Embed Size (px)
Citation preview

Quantifying atmospheric methane emissions from oiland natural gas production in the Bakken shaleregion of North DakotaJ. Peischl1,2, A. Karion1,3,4, C. Sweeney1,3, E. A. Kort5, M. L. Smith5, A. R. Brandt6, T. Yeskoo7,K. C. Aikin1,2, S. A. Conley8, A. Gvakharia5, M. Trainer2, S. Wolter1,3, and T. B. Ryerson2
1Cooperative Institute for Research in Environmental Sciences, University of Colorado Boulder, Boulder, Colorado, USA,2Chemical Sciences Division, NOAA Earth System Research Laboratory, Boulder, Colorado, USA, 3Global MonitoringDivision, NOAA Earth System Research Laboratory, Boulder, Colorado, USA, 4Now at the National Institute of Standards andTechnology, Gaithersburg, Maryland, USA, 5Department of Climate and Space Sciences and Engineering, University ofMichigan, Ann Arbor, Michigan, USA, 6Department of Energy Resources Engineering, Stanford University, Stanford,California, USA, 7Department of Civil and Environmental Engineering, Stanford University, Stanford, California, USA,8Department of Land, Air, and Water Resources, University of California, Davis, California, USA
Abstract We present in situ airborne measurements of methane (CH4) and ethane (C2H6) taken aboard aNOAA DHC-6 Twin Otter research aircraft in May 2014 over the Williston Basin in northwestern North Dakota,a region of rapidly growing oil and natural gas production. TheWilliston Basin is best known for the Bakken shaleformation, from which a significant increase in oil and gas extraction has occurred since 2009. We derive a CH4
emission rate from this region using airborne data by calculating the CH4 enhancement flux through theplanetary boundary layer downwind of the region. We calculate CH4 emissions of (36±13), (27±13), (27±12),(27±12), and (25±10) ×103 kg/h from five transects on 3days in May 2014 downwind of the Bakken shaleregion of North Dakota. The average emission, (28±5)×103 kg/h, extrapolates to 0.25±0.05 Tg/yr, which issignificantly lower than a previous estimate of CH4 emissions from northwestern North Dakota and southeasternSaskatchewan using satellite remote sensing data. We attribute the majority of CH4 emissions in the region to oiland gas operations in the Bakken based on the similarity between atmospheric C2H6 to CH4 enhancement ratiosand the composition of raw natural gas withdrawn from the region.
1. Introduction
From 1981 to 2003, North Dakota accounted for less than 1.5% of United States (U.S.) crude oil production(U.S. Energy Information Administration (EIA), www.eia.gov). However, the onset of directional drilling andhydraulic fracturing has led to a large increase in oil and natural gas extraction from shale formations in theU.S. in recent years. One such shale formation, the Bakken, is located in the Williston Basin of northwesternNorth Dakota. As a result, North Dakota accounted for 12.5% of the U.S. crude oil production in May 2014(EIA), due mainly to oil extraction from the Bakken shale formation (Figure 1), surpassing the oil productionfrom all U.S. regions except Texas and federal Gulf of Mexico (EIA).
In addition to crude oil, natural gas is also extracted from the Bakken shale formation. The region was respon-sible for 1.4% of U.S. natural gas production in May 2014 (EIA). Natural gas is a mixture primarily composed ofmethane (CH4), with ethane (C2H6) typically the second largest component. Emissions of natural gas to theatmosphere may occur during various stages of oil and natural gas extraction and processing. Consequently,the U.S. Environmental Protection Agency (EPA) greenhouse gas (GHG) inventory estimates that CH4 emissionsto the atmosphere from the oil and gas industry account for 29% of 2013 U.S. anthropogenic CH4 emissions(EPA 430-R-15-004, http://www3.epa.gov/climatechange/Downloads/ghgemissions/US-GHG-Inventory-2015-Main-Text.pdf). Two recent studies have shown measurement-based estimates of CH4 emissions from the oiland gas industry are in agreement with the EPA GHG inventory for large gas-producing regions [Peischl et al.,2015; Karion et al., 2015]. However, other studies have shown that GHG inventories underestimate CH4 emis-sions from other oil and natural gas-producing regions [Pétron et al., 2012; Peischl et al., 2013; Karion et al.,2013; Pétron et al., 2014; Brandt et al., 2014]. Therefore, studies that estimate CH4 emissions from the oil andgas industry are necessary to constrain regional and national GHG emissions inventories and ultimately informdecisions based on the climate impacts of U.S. fuel choices.
PEISCHL ET AL. CH4 EMISSIONS FROM THE BAKKEN 6101
PUBLICATIONSJournal of Geophysical Research: Atmospheres
RESEARCH ARTICLE10.1002/2015JD024631
Key Points:• CH4 emissions from the Bakken regionof North Dakota quantified
• First emission estimate using in situCH4 measurements
• CH4 sources dominated by oil- andgas-related activities
Correspondence to:J. Peischl,[email protected]
Citation:Peischl, J., et al. (2016), Quantifyingatmospheric methane emissions fromoil and natural gas production in theBakken shale region of North Dakota,J. Geophys. Res. Atmos., 121, 6101–6111,doi:10.1002/2015JD024631.
Received 9 DEC 2015Accepted 22 APR 2016Accepted article online 11 MAY 2016Published online 25 MAY 2016
©2016. The Authors.This is an open access article under theterms of the Creative CommonsAttribution-NonCommercial-NoDerivsLicense, which permits use and distri-bution in any medium, provided theoriginal work is properly cited, the use isnon-commercial and no modificationsor adaptations are made.

Schneising et al. [2014] reported anincrease in CH4 emissions from theBakken region of northwesternNorth Dakota and southeasternSaskatchewan of 0.99 ± 0.65 TgCH4/yr between the years 2006–2008 and 2009–2011 based onmeasurements from the SCanningImaging Absorption spectroMeterfor Atmospheric CHartographY(SCIAMACHY) instrument on boardthe Envisat satellite. Schneisinget al. [2014] further estimated an“energy content leak rate” for theBakken, i.e., the energy content ofthe natural gas emitted to the atmo-
sphere divided by the sum of the energy content of the oil and natural gas extracted from the ground, of10.1%± 7.3% by comparing the increase in CH4 emissions with the increase in oil and natural gas productionfrom this region over the same time period. We interpret this as a loss of 44 ± 32% of the natural gas with-drawn, as discussed in section 5.5. Several studies using in situ airborne measurements and the mass balancemethod have recently quantified CH4 emissions to the atmosphere from oil and natural gas-producingregions such as the Uinta Basin of Utah [Karion et al., 2013], the Denver-Julesburg Basin of northeasternColorado [Pétron et al., 2014], the Haynesville region of northwestern Louisiana and eastern Texas, theArkoma Basin of Arkansas, the Marcellus region of northeastern Pennsylvania [Peischl et al., 2015], and theBarnett region of central Texas [Karion et al., 2015]. These aircraft studies report a variety of atmosphericCH4 emission rates, ranging from (14–80) ×103 kg CH4/h, with rates of natural gas losses to the atmosphere ran-ging from 0.18% to 11.7% of the natural gas extracted from the ground from these regions. The variability inemissions and loss rates from these regions likely stems from a variety of factors, including whether oil isextracted in addition to natural gas, the amount of aboveground fossil fuel processing that occurs, the well count,the fossil fuel production volume, the age of the infrastructure, and the type of activity occurring on days whenthe aircraft studies occur. For comparison, the average hourly emission increase found by Schneising et al. [2014]was (110±70)×103 kg CH4/h over the years 2006–2008 to 2009–2011. This CH4 emission rate is the largest emis-sion reported from all oil and gas-producing regions studied to date, which warrants further examination. Herewe derive atmospheric CH4 emission rates from the Bakken region of North Dakota using in situ airborne dataand the aircraft mass balance technique and compare to the estimate by Schneising et al. [2014].
We estimate the total CH4 emitted to the atmosphere from the Bakken region of North Dakota using measure-ments taken aboard a chemically instrumented National Oceanic and Atmospheric Administration (NOAA)DHC-6 Twin Otter aircraft in May 2014 during the Twin Otter Projects Defining Oil/gas Well emissioNs(TOPDOWN) field project, based out of Minot, ND (Figure 2). The NOAA Twin Otter flew on 12 days in theBakken region, with transects performed upwind, over, and downwind of this region. The Twin Otter typi-cally flew at ~65m/s, and full field transects normally took 45min. A flight was typically 3 to 3.5 h in dura-tion. On six of the flight days, the Twin Otter refueled and took off again for a second flight. Figure 2 showsall the flight tracks of the NOAA Twin Otter around the Bakken region in May 2014. Using the mass balancetechnique, we determine the CH4 emissions from this region on 3 days with steady winds. We then attri-bute the CH4 emissions in the region to oil and natural gas extraction operations based on the similarityof atmospheric C2H6 to CH4 enhancement ratios during the mass balance transects with the abundancesof C2H6 and CH4 in natural gas extracted from the Bakken region. Finally, we estimate the natural gas lossrate to the atmosphere from oil and gas operations in the Bakken region by converting the CH4 emission toa natural gas emission and dividing by the amount of natural gas extracted in the region in May 2014.
2. Instrumentation
CH4, carbon dioxide (CO2), carbonmonoxide (CO), andwater vapor (H2O)weremeasured bywavelength-scannedcavity ringdown spectrometry using a Picarro G2401 -m [Karion et al., 2015]. CH4 was measured once every 2 s
Figure 1. Monthly average daily oil and natural gas production from theBakken shale play through May 2014. Source: U.S. Energy InformationAdministration (downloaded October 2015).
Journal of Geophysical Research: Atmospheres 10.1002/2015JD024631
PEISCHL ET AL. CH4 EMISSIONS FROM THE BAKKEN 6102

with an estimated accuracy of ±1.4 ppb (all uncertainties herein are 1σ); the precision of this measure-ment was ±0.2 ppb. All CH4 measurements herein are reported as dry air mole fractions expressed asnanomole/mole or parts per billion. C2H6 was measured by tunable infrared laser direct absorption spec-troscopy using an Aerodyne mini ethane analyzer [Smith et al., 2015]. C2H6 was measured every secondwith an estimated accuracy of ±7%; 1 s precision was ± (0.02 to 0.21) ppb, depending on flight conditions.Additionally, black carbon was measured using a single particle soot photometer [Schwarz et al., 2015],ozone was measured using a 2B Technologies analyzer, and flasks of air samples were later analyzedfor hydrocarbons and other trace gases. Two differential GPS antennae were mounted above the fuselageof the Twin Otter and provided aircraft heading, altitude, latitude, longitude, ground speed, and courseover ground. Ambient temperature was measured with a Rosemount deiced total temperature sensor,model number 102CP2AF, calibrated before and after the field project, with a precision of ±0.2°C andan estimated accuracy of ±1.0°C. Meteorological and navigational measurements were made once persecond by various sensors aboard the NOAA Twin Otter. Potential temperature, θ, is calculated usingthe following equation:
θ ¼ T� 1000P
� �0:286
(1)
where T is ambient temperature in units of Kelvin and P is ambient pressure is in units of millibar. The ambientwind speed andwind direction were derived from the true air speed, heading, speed over ground, and courseover ground measurements aboard the Twin Otter using the technique of Conley et al. [2014]. We estimateuncertainties in the wind speed of ±1m/s and wind direction of ±6° during typical level flight conditions,based on an analysis of the wind calibration flight pattern data [Conley et al., 2014].
3. Other Data
The following inventories are used in the current analysis: the EPA 2013 GHG Inventory (publication EPA430-R-15-004, downloaded September 2015, http://www3.epa.gov/climatechange/Downloads/ghgemis-sions/US-GHG-Inventory-2015-Main-Text.pdf), and the EPA GHG Reporting Program (GHGRP) inventory
Figure 2. Map of the Bakken region. The NOAA Twin Otter flight tracks are shown with thin black lines. Active oil and gaswells in North Dakota (ND), Montana (MT), Saskatchewan (SK), and Manitoba (MB) are shown as light blue circles. Naturalgas was sampled from 710 wells, colored mustard yellow, and analyzed for CH4, C2H6, and other trace gas abundance[Brandt et al., 2015]. Point sources from the 2013 EPA GHG Reporting Program inventory are shown as open dark blue circlessized by inventory CH4 emissions. Urban area outlines, including Minot and Williston, ND, are colored orange. Theapproximate extent of the Williston Basin is shaded gray in the overview map.
Journal of Geophysical Research: Atmospheres 10.1002/2015JD024631
PEISCHL ET AL. CH4 EMISSIONS FROM THE BAKKEN 6103

(downloaded November 2015, http://www2.epa.gov/ghgreporting/subpart-w-reported-data). The GHGRPdata include the latitude, longitude, and estimated CH4 emission of known point sources (Figure 2). Somelatitude-longitude coordinates in the 2013 EPA GHGRP inventory data set were modified to match the actuallocations determined using satellite imagery.
Natural gas sample analysis data are used from the work of Brandt et al. [2015] by way of the North DakotaIndustrial Commission, Department of Mineral Resources, Oil and Gas Division (https://www.dmr.nd.gov/oilgas/).Samples were taken from 710 wells across the Bakken region (Figure 2) and analyzed for the molar compo-sition of C1-C6 alkanes, CO2, and other trace gases. North Dakota well locations were downloaded from thesame website (accessed September 2014). North Dakota well production data are from the North DakotaState Industrial Commission May 2014 Oil and Gas Production Report (https://www.dmr.nd.gov/oilgas/mprindex.asp). Bakken production data were obtained from the EIA Web site (http://www.eia.gov/petro-leum/drilling/, downloaded October 2015).
Terrain height below the Twin Otter aircraft is estimated using a digital elevation map (DEM) from the U.S.Geological Survey (GTOPO30, 1996, https://lta.cr.usgs.gov/GTOPO30). The DEM has a resolution of 30 arcsec (~900m) and is based on World Geodetic System 1984 data. Hybrid Single-Particle LagrangianIntegrated Trajectory (HYSPLIT) model back trajectories [Stein et al., 2015; https://ready.arl.noaa.gov/HYSPLIT.php] are used to evaluate the evolution of wind fields over time and are run with the following set-tings: Meteorology: North American Mesoscale Forecast System, 12 km; Vertical Motion: Model vertical velo-city (which uses the vertical velocity field from the meteorological data). County-level livestock populationswere downloaded from the U.S. Department of Agriculture (USDA) National Agriculture Statistics Service(NASS) (http://www.nass.usda.gov). We assume an average emission of 67.9 kg CH4/yr per head from entericfermentation (EPA GHG inventory) and no emission of C2H6. Bison populations are estimated from a NorthDakota Department of Agriculture website (http://www.nd.gov/aitc/agfacts/Livestock/). We assume thatbison populations scale with cattle populations and assume an average emission of 72 kg CH4/yr per head[Kelliher and Clark, 2010]. County-level manure emissions estimates were downloaded from the NationalRenewable Energy Laboratory (http://maps.nrel.gov/biomass) and were based on 2002 USDA data. In caseswhere the NOAA Twin Otter flight track transects a county, an apportionment based on geographical areais used to determine livestock and manure emissions within the study region.
4. Mass Balance Technique
The technique used to estimate CH4 fluxes is the mass balance approach [White et al., 1976]. This techniquehas been used extensively to estimate CH4 emissions from oil and gas-producing regions [Karion et al., 2013;Pétron et al., 2014; Peischl et al., 2015; Karion et al., 2015]. Further, the mass balance technique was used toestimate C2H6 emissions from an oil and gas-producing region [Smith et al., 2015] and black carbon andC2H6 emissions from the Bakken region during the 2014 TOPDOWN project [Schwarz et al., 2015; Kortet al., 2016].
The mass balance technique is used as follows. We calculate the horizontal flux of a species X through avertical plane defined by an aircraft transect:
flux ¼ v cos αð Þ∫z1
z0 ∫y
�y X � Xbg� �
dydz (2)
where ν cos(α) is the magnitude of the component of the wind velocity normal to the flight track aver-aged over the course of a transect, z0 is the terrain height in meters above sea level (masl), z1 is theadjusted mixing height in meters above sea level, (X–Xbg) is the CH4 enhancement above the back-ground, and y is the crosswind distance [White et al., 1976]. We define the background CH4 mixing ratiosas those found immediately outside the plume downwind of the Bakken region. This is discussed in moredetail, below. We define the adjusted mixing height in meters above ground level (magl) as described byPeischl et al. [2015]: z1 = (3zPBL + ze)/4, where zPBL is the well-mixed planetary boundary layer (PBL) depth,and ze is the entrainment height or the altitude at which mixing from the PBL has reached estimated freetropospheric CH4 mixing ratios. Below, we compare this method of determining the adjusted mixingheight with that of Schwarz et al. [2015]. All other calculations are similar to those reported by Peischlet al. [2015].
Journal of Geophysical Research: Atmospheres 10.1002/2015JD024631
PEISCHL ET AL. CH4 EMISSIONS FROM THE BAKKEN 6104
5. Results and Discussion5.1. CH4 Emissions to the Atmosphere From the Bakken Study Region
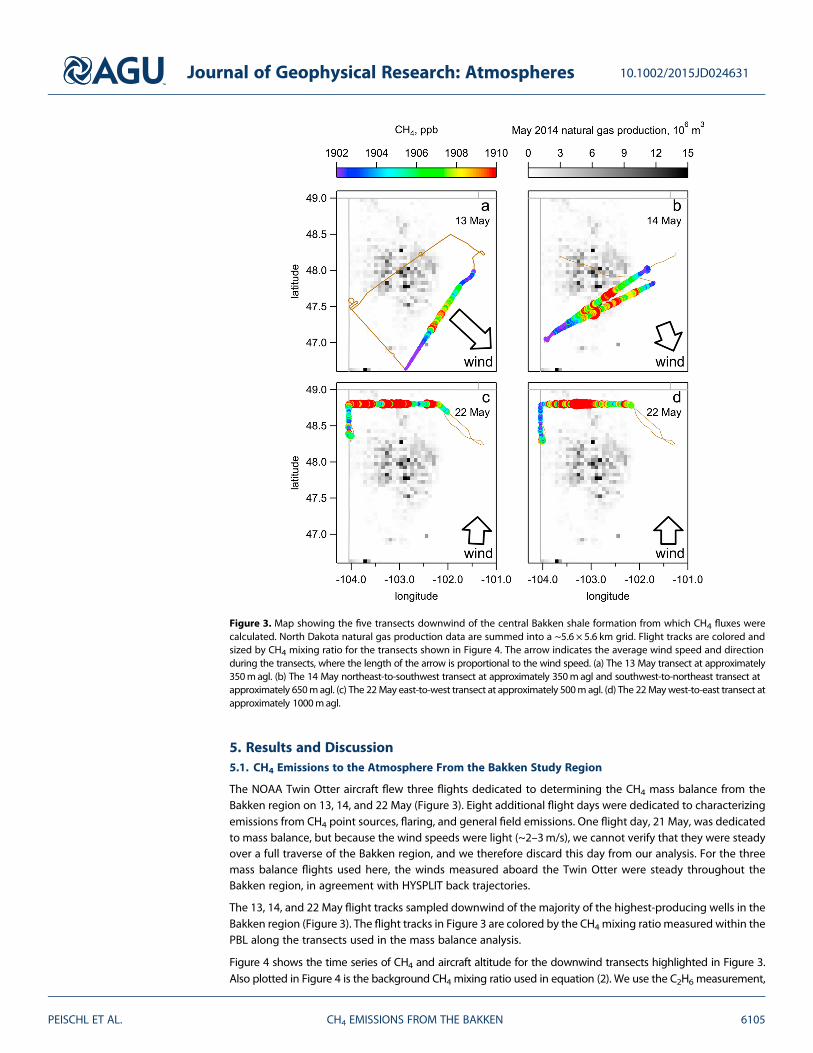
The NOAA Twin Otter aircraft flew three flights dedicated to determining the CH4 mass balance from theBakken region on 13, 14, and 22 May (Figure 3). Eight additional flight days were dedicated to characterizingemissions from CH4 point sources, flaring, and general field emissions. One flight day, 21 May, was dedicatedto mass balance, but because the wind speeds were light (~2–3m/s), we cannot verify that they were steadyover a full traverse of the Bakken region, and we therefore discard this day from our analysis. For the threemass balance flights used here, the winds measured aboard the Twin Otter were steady throughout theBakken region, in agreement with HYSPLIT back trajectories.
The 13, 14, and 22 May flight tracks sampled downwind of the majority of the highest-producing wells in theBakken region (Figure 3). The flight tracks in Figure 3 are colored by the CH4 mixing ratio measured within thePBL along the transects used in the mass balance analysis.
Figure 4 shows the time series of CH4 and aircraft altitude for the downwind transects highlighted in Figure 3.Also plotted in Figure 4 is the background CH4 mixing ratio used in equation (2). We use the C2H6 measurement,
Figure 3. Map showing the five transects downwind of the central Bakken shale formation from which CH4 fluxes werecalculated. North Dakota natural gas production data are summed into a ~5.6 × 5.6 km grid. Flight tracks are colored andsized by CH4 mixing ratio for the transects shown in Figure 4. The arrow indicates the average wind speed and directionduring the transects, where the length of the arrow is proportional to the wind speed. (a) The 13 May transect at approximately350magl. (b) The 14 May northeast-to-southwest transect at approximately 350magl and southwest-to-northeast transect atapproximately 650magl. (c) The 22May east-to-west transect at approximately 500magl. (d) The 22Maywest-to-east transect atapproximately 1000magl.
Journal of Geophysical Research: Atmospheres 10.1002/2015JD024631
PEISCHL ET AL. CH4 EMISSIONS FROM THE BAKKEN 6105

which typically has a greater plume signal to background variability ratio than the CH4 measurement, to helpdefine the plume background, especially on days such as 22May, when the CH4 plume enhancements were onlya factor of 2–4 greater than the CH4 background variability. The CH4 background is further selected to beconsistent with the C2H6 data, such that the ratio of their derived fluxes is equal to the molar enhancement ratioof C2H6 to CH4 observed on the downwind transects.
Examples of the mixing height determination are shown with three vertical profiles in Figure 5. Figure 5 (left)shows the vertical profile immediately before the transect shown in Figure 4a; Figure 5 (middle) shows thevertical profile immediately before the second transect shown in Figure 4b; Figure 5 (right) shows the verticalprofile immediately after the first transect shown in Figure 4c. We calculate the adjusted mixing height, z1,following the method of Peischl et al. [2015] to account for any transport of CH4 through the top of thePBL. We increase the effective PBL depth by one quarter the distance between the well-mixed PBL, definedby the dashed lines in Figure 5, and entrainment height, ze, defined by the dotted lines in Figure 5, and
Figure 4. Time series of CH4 measurements (black) from the five transects downwind of the Bakken shale region shown inFigure 3. The blue trace shows the Twin Otter altitude above ground level. The red trace represents the background CH4used for the flux calculations; the dashed red traces represent the estimated ±1σ uncertainty of the background. Theshaded areas show the CH4 enhancement above the background along the transects.
Journal of Geophysical Research: Atmospheres 10.1002/2015JD024631
PEISCHL ET AL. CH4 EMISSIONS FROM THE BAKKEN 6106

include an uncertainty equal to this same distance. This adjusted mixing height and uncertainty encom-passes a range of possible sources for the CH4 enhancement above the free tropospheric levels immediatelyabove the PBL: zPBL if the CH4 enhancements above the PBL are solely due to preexisting layers aloft, andhalfway between zPBL and ze if all CH4 enhancements above the PBL are due to detrainment from the PBL.The resulting adjusted mixing heights and their uncertainties from each vertical profile during a flight arefit with a line. We use the value of this fit at the time of the transect, along with the corresponding 1σ con-fidence interval of the fit, to determine z1 for equation (2), and plot the resulting adjusted mixing heightsas filled yellow circles in Figure 5. For comparison, themixed height determined by Schwarz et al. [2015] usinga different method are shown with orange diamonds. For each mass balance transect in this analysis, themixed height determinations are well within the uncertainties of the two different estimation techniques.
Table 1 lists the parameters and their uncertainties used in equation (2) to calculate the CH4 flux for eachtransect. The largest uncertainties for the 13 May flight were from the uncertainty of the background CH4
value (±25%), the variability of the wind speed (±20%), and the uncertainty of z1 (±18%). The largest uncer-tainties for the 14 May flight were from the variability of the wind speed (±34%), the uncertainty of the back-ground CH4 value (±30%), and the uncertainty of z1 (±21%). Finally, the largest uncertainties for the 22 Mayflight were from the uncertainty of the background CH4 value (±27%), the variability of the wind speed(±24%), and the uncertainty of z1 (±21%). The CH4 fluxes calculated from the five downwind transects are(36 ± 13), (27 ± 13), (27 ± 12), (27 ± 12), and (25 ± 10) × 103 kg/h. The two flux determinations from the 14and 22 May flights did not depend on transect altitude, indicating the emissions were mixed vertically withinthe PBL by the time they were sampled by the Twin Otter. The 1/σ2-weighted average of the five CH4
Figure 5. One vertical profile is plotted from each of the three flight days used for the mass balance. Dashed horizontalblack lines indicate the well-mixed PBL depth. Dotted horizontal black lines indicate the entrainment height. The yellowcircles indicate the average adjusted mixing heights used for the mass balance calculations. The orange diamonds indicatethe average adjusted mixing heights (h × β) used by Schwarz et al. [2015]. Solid vertical gray lines indicate the CH4background; dashed vertical gray lines represent the ±1σ uncertainty of the background.
Journal of Geophysical Research: Atmospheres 10.1002/2015JD024631
PEISCHL ET AL. CH4 EMISSIONS FROM THE BAKKEN 6107

emissions estimates for the Bakken region is 28 (±5) × 103 kg CH4/h (Table 2), suggesting relatively smallday-to-day variability in the total emissions rate for this short study. We therefore assume that this emissionrate represents the average May 2014 CH4 emission from the Bakken region.
5.2. Oil and Natural Gas Production in the Bakken Study Region
Monthly oil and natural gas production from the Bakken region is estimated for May 2014 using both EIA andNorth Dakota state data. The EIA reports gross gas withdrawal volumes in thousands of cubic feet (MCF) at 60°F and 6.681528 kg per square inch. We therefore adjust the volumes reported by the EIA by factor of 0.9483 toconvert to standard temperature and pressure of 0°C and 1 atm then convert cubic feet to cubic meters. TheBakken natural gas production for May 2014 was 10.2 × 10⁸m3 according to the EIA when converted to stan-dard cubic meters. Similarly, the sum of individual well production data from the North Dakota Oil and GasDivision is 9.7 × 10⁸m3, within 5% of the EIA estimate. Each airborne transect analyzed here was downwindof wells that accounted for greater than 97% of total production. We therefore estimate natural gas produc-tion upwind of any given transect in the region to be (9.9 ± 0.3) × 108m3 for the month of May 2014 (Table 2).
5.3. Other Sources of CH4 in the Bakken Study Region
The Bakken region encompasses landfills and livestock; these sources emit CH4 but are not known to emitC2H6. The total CH4 emission from point sources in the 2013 EPA GHGRP inventory not related to oil and nat-ural gas processing in the Bakken region, two natural gas-fired electrical generating stations, is 0.23 × 10³ kg/yr, which averages to 0.03 kg CH4/h, which we treat as negligible. Here we use bottom-up methods to esti-mate CH4 emissions from livestock in the Bakken region and then compare these emissions to the totalCH4 emission from the region to confirm that livestock emissions are also not a major source of CH4 to theatmosphere in the Bakken region. We estimate that the Twin Otter flight track encompassed 9% of the cattleand calves in North Dakota, based on a geographical apportionment of USDA NASS county data. This resultsin an estimated enteric fermentation emission from 161,000 cattle and calves of 1.3 × 10³ kg CH4/h. CH4 emis-sions from manure are estimated at 0.003 × 10³ kg CH4/h. We estimate approximately 32,000 bison emit0.3 × 103 kg CH4/h, based on statewide bison populations scaled by estimated cattle and calf populationsin the Bakken region. The combined point source and livestock emission, 1.5 × 10³ kg CH4/h (Table 2),accounts for approximately 5% of the 28× 103 kg CH4/h emission calculated for May.
Coal mines, another possible source of CH4, are located southeast of the Bakken region. The state of NorthDakota has four active coal mines (EIA, http://www.eia.gov/coal/annual/pdf/table2.pdf), all of which aresurface mines. These mines are represented in the 2013 EPA GHGRP inventory and are located between47.0° and 47.5°N latitude and 101° and 102°W longitude (Figure 2). CH4 emissions from these mines werefurther downwind of the 13 and 14 May transects, and therefore do not affect the mass balance calculations
Table 1. Data Used in Equation (2) From Five Transects on the 13, 14, and 22 May 2014 Flights and the Resulting CH4 Fluxes
Transect Terrain Height (masl) z1, (masl) Wind Direction (°) Wind Speed (m/s) CH4 Flux (1026molecule/s) CH4 Flux (10
3 kg/h)
13 May 680 ± 60 2810 ± 265 312 ± 9 13.3 ± 2.7 3.8 ± 1.4 36 ± 1314 May, #1 695 ± 85 2545 ± 395 339 ± 14 7.7 ± 2.6 2.8 ± 1.4 27 ± 1314 May, #2 705 ± 80 2655 ± 245 339 ± 8 8.0 ± 2.3 2.8 ± 1.3 27 ± 1222 May, #1 655 ± 45 2340 ± 355 177 ± 10 7.5 ± 1.8 2.8 ± 1.2 27 ± 1222 May, #2 660 ± 45 2320 ± 300 180 ± 9 7.4 ± 1.7 2.7 ± 1.1 25 ± 10
Table 2. Summary of CH4 Emissions From the Bakken Study Region
Quantity Evaluated Amount
CH4 flux (28 ± 5) × 103 kg/hCH4 estimated from nonoil and gas point sources and livestock ~1.5 × 10³ kg/hCH4 emissions attributed to the oil and gas industry (20–33) × 103 kg/hNatural gas production in May 2014 (9.9 ± 0.3) × 108m3
CH4 abundance in natural gasa 47 ± 13%CH4 extraction rate in May 2014 (420 ± 120) × 103 kg/hNatural gas loss rate to the atmosphere 6.3 ± 2.1%
aBrandt et al. [2015].
Journal of Geophysical Research: Atmospheres 10.1002/2015JD024631
PEISCHL ET AL. CH4 EMISSIONS FROM THE BAKKEN 6108

on these days, but may have contrib-uted to the CH4 enhancements mea-sured on the 22 May flight. This isdiscussed in more detail in the nextsection.
5.4. Source Attribution ofCH4 Emissions
The small contribution of livestock tothe total CH4 emission in the Bakkenregion suggested by the USDA inven-tory is confirmed using airborne data.Enhancements of C2H6 in the bound-ary layer along the mass balancetransects correlate with enhance-ments of CH4 similar to the composi-tion ratios of C2H6 to CH4 in naturalgas extracted from the region(Figure 6). The lines representing thecomposition ratios in Figure 6 areoffset to 1900.5 ppb CH4 and 1.5 ppbC2H6, which represents the approxi-
mate background mixing ratios for the mass balance transects on the 13 and 14 May flights. For the 22May flight, we plot the CH4 enhancement above the sloping background in Figure 4 then offset the differ-ence to the background values as for the composition ratios. The C2H6 to CH4 enhancement ratio was onthe order of 0.4–0.5, an atypically high ratio compared to previously studied oil and gas-producing regions.As a result, this ratio provides a unique source fingerprint and distinguishes Bakken region oil and gas emis-sions from natural gas in the supply chain or coal mine emissions, which typically have C2H6 to CH4 ratios ofless than 0.05. Finally, an approximately 10 km wide CH4 plume on 22 May sampled shortly before 17:00 CSTnot highly correlated with C2H6 represents 6% of the CH4 flux calculation for that day. These data weresampled along the eastern edge of the 22 May transects, where emissions from coal mines to the south-southeast may have influenced the CH4 measurements.
We attribute CH4 emissions to the oil and gas industry in the Bakken region as follows. We subtract the esti-mated livestock emission and the plume not correlated with C2H6 on the 22 May flight from the total CH4
emission estimated for the region. Since we cannot confirm quantitatively with our measurements theimpact that livestock and coal mine emissions may have had on the CH4 emissions, we assign a 100% uncer-tainty to these subtractions. Consequently, CH4 emissions attributed to the oil and gas industry have largererror bars than the estimate for the total CH4 emissions from the region, but both emissions estimates sharethe same upper limit (Table 2).
Our estimate for oil and gas emissions of (20–33) × 103 kg CH4/h is a factor of 5–8 greater than the 2013 EPAGHGRP estimate for the entire Williston Basin of 0.0047 Tg CH4/yr, which averages to 4.1 × 10³ kg CH4/h.However, under this program, emissions from many small facilities may not meet the threshold required toreport (http://www2.epa.gov/sites/production/files/2015-07/documents/subpartwinformationsheet.pdf), sowe would expect the GHGRP value to be a lower limit to the total emissions. However, the EPA also estimatesU.S. CH4 emissions from petroleum systems of 1.009 Tg CH4/yr (2013 EPA GHG inventory, Tables 3–37).Assuming inventory CH4 emissions scale with oil production, the Bakken region would account for 12.5%of the total U.S. emission, which averages to 14.4 × 10³ kg CH4/h. Therefore, our estimate of CH4 emissionsfrom the Bakken region oil and gas industry is a factor of 1.4–2.3 greater than the 2013 EPA GHG inventory’semissions from petroleum systems scaled by oil production.
5.5. Loss Rates to the Atmosphere From Oil and Natural Gas Production in the Bakken Study Region
CH4 may be emitted, or lost, to the atmosphere from oil and natural gas operations through a variety of ways:intentional venting, partially combusted flaring, fugitive losses, etc. An atmospheric loss rate from oil and
Figure 6. C2H6 and CH4 are plotted for each of the five transects used tocalculate a CH4 flux downwind of the Bakken region. Also, plotted are lineswith a slope equal to the C2H6 to CH4molar composition ratio (C2/C1) from 710samples of natural gas from the Bakken region [Brandt et al., 2015], assuming abackground of 1.5 ppb C2H6 and 1900.5 ppb CH4. The slope of the yellow linerepresents the geometric mean C2H6 to CH4 composition ratio of the samples.
Journal of Geophysical Research: Atmospheres 10.1002/2015JD024631
PEISCHL ET AL. CH4 EMISSIONS FROM THE BAKKEN 6109

natural gas operations in the Bakken region for May 2014 is estimated by taking the CH4 mass emission rateattributed to the oil and gas industry and dividing by the average CH4 mass extraction rate, or productionrate, of natural gas for the month. We use 22.414 L/mol (the EIA standard 23.636 L/mol times 0.9483 to con-vert to standard L) of natural gas in the conversion from volume tomass. Themean CH4 abundance in the 710Bakken natural gas samples is 47 ± 13% [Brandt et al., 2015] (Table 2). The resulting estimated natural gas lossrate from the Bakken region is 4.2%–8.4% based on this analysis of airborne in situ data. This loss rate is notsignificantly different than that calculated for another oil-producing region, the Denver-Julesburg Basin innortheastern Colorado, where Pétron et al. [2014] found loss rates of 2.6%–5.6%.
We convert this loss rate to an “energy loss rate” in order to compare to that reported by Schneising et al.[2014]. We estimate an energy loss rate by converting the natural gas and oil extracted from the Bakkenformation to energy extracted using the following conversions: 5.8 × 10⁷ J/m3 for natural gas and3.464 × 1010 J/m3 for oil [Brandt et al., 2015]. We assume the change in density of oil into standard unitsis <1% and therefore negligible. In May 2014, natural gas accounted for 25.4% of the energy extractedin the Bakken region (EIA), which results in an energy loss rate of 1.6 ± 0.5%, a factor of approximately 6lower than that reported by Schneising et al. [2014] for 2006–2008 to 2009–2011. Alternatively, we convertthe energy loss rate found by Schneising et al. [2014] to a natural gas loss rate. Natural gas in the NorthDakota portion of the Bakken accounted for 23% of the energy extracted from 2009 to 2011. Assuming thatthis energy extraction ratio holds true for production in the Saskatchewan portion of the Bakken, the 10.1± 7.3% energy loss rate reported by Schneising et al. [2014] would imply an emission to the atmosphere ofapproximately 44 ± 32% of the natural gas extracted from the Bakken formation. Finally, where we derive atotal CH4 emission of (28 ± 5) × 103 kg/h from the Bakken region, Schneising et al. [2014] found an increase inemissions of (110 ± 70) × 103 kg/h from western North Dakota and southeastern Saskatchewan. Weconclude that the exceptionally high atmospheric loss rate of CH4 reported by Schneising et al. [2014] for2009–2011 is inconsistent with our airborne data from May 2014.
6. Conclusions
We report the first in situ measurements of CH4 to estimate atmospheric CH4 emissions from the Bakken oiland natural gas production region of northwestern North Dakota. We calculate CH4 fluxes from the Bakkenregion for May 2014 from three flights and five transects downwind of the region and find CH4 emissionsto the atmosphere of (28 ± 5) × 103 kg CH4/h. Both aircraft measurements of C2H6 and a bottom-up assess-ment derived here indicate that livestock are not a dominant source of CH4 to the atmosphere in this region,nor are landfills and other CH4 sources not related to the oil and gas industry. Instead, atmospheric enhance-ment ratios of C2H6 to CH4 are consistent with the composition ratio of natural gas extracted in the Bakkenregion. We therefore attribute CH4 emissions of (20–33) × 103 kg CH4/h to the oil and gas production anddistribution activities in this region. This is approximately a factor of 1.4–2.3 greater than the 2013 EPAGHG inventory emission rate from petroleum systems when scaled by oil production. Stated in terms ofthe natural gas extracted from the ground, we estimate atmospheric loss rates from natural gas productionof 4.2–8.4%, similar to the rate found for the Denver-Julesburg oil-producing region [Pétron et al., 2014].
Note Added in Proof
The EPA GHG inventory report for 2014 was released in April 2016 (EPA 430-R-16-002, https://www3.epa.gov/climatechange/ghgemissions/usinventoryreport.html), while this paper was under final review; inventoriedemissions from petroleum systems increased by a factor of 2.5 compared to the GHG inventory for 2013 thatwas used for comparison above. The CH4 emissions attributed to oil and gas operations in this paper are nowa factor of 0.51–0.85 times the 2014 EPA GHG inventory for petroleum systems scaled by oil production inthe Bakken.
ReferencesBrandt, A. R., et al. (2014), Methane leaks from North American natural gas systems, Science, 343, 733–735, doi:10.1126/science.1247045.Brandt, A. R., T. Yeskoo, S. McNally, K. Vafi, H. Cai, and M. Q. Wang (2015), Energy intensity and greenhouse gas emissions from crude oil
production in the Bakken Formation: Input data and analysis methods, Department of Energy, Argonne National Laboratory. [Available athttps://greet.es.anl.gov/publication-bakken-oil.]
Journal of Geophysical Research: Atmospheres 10.1002/2015JD024631
PEISCHL ET AL. CH4 EMISSIONS FROM THE BAKKEN 6110
AcknowledgmentsJ. Peischl, K. Aikin, M. Trainer, andT. Ryerson were supported in part by theNOAA Climate Program Office. A. Karion,C. Sweeney, S. Wolter, E. Kort, M. Smith,and A. Gvakharia were supported in partby the NOAA Atmospheric Chemistry,Carbon Cycle, and Climate Programunder grant NA14OAR0110139. Data arepublicly available at http://esrl.noaa.gov/csd/groups/csd7/measurements/2014topdown/.

Conley, S. A., I. C. Faloona, D. H. Lenschow, A. Karion, and C. Sweeney (2014), A low-cost system for measuring horizontal winds from single-engine aircraft, J. Atmos. Oceanic Technol., 31, 1312–1320, doi:10.1175/JTECH-D-13-00143.1.
Karion, A., et al. (2013), Methane emissions estimate from airborne measurements over a western United States natural gas field, Geophys.Res. Lett., 40, 4393–4397, doi:10.1002/grl.50811.
Karion, A., et al. (2015), Aircraft-based estimate of total methane emissions from the Barnett Shale Region, Environ. Sci. Technol., 49,8124–8131, doi:10.1021/acs.est.5b00217.
Kelliher, F. M., and H. Clark (2010), Methane emissions from bison—An historic herd estimate for the North American Great Plains, Agric. For.Meteorol., 150(3), 473–477, doi:10.1016/j.agrformet.2009.11.019.
Kort, E. A., M. L. Smith, L. T. Murray, A. Gvakharia, A. R. Brandt, J. Peischl, T. B. Ryerson, C. Sweeney, and K. Travis (2016), Fugitive emissions fromthe Bakken shale illustrate role of shale production in global ethane shift, Geophys. Res. Lett., 43, doi:10.1002/2016GL068703.
Peischl, J., et al. (2013), Quantifying sources of methane using light alkanes in the Los Angeles basin, California, J. Geophys. Res. Atmos., 118,4974–4990, doi:10.1002/jgrd.50413.
Peischl, J., et al. (2015), Quantifying methane emissions from the Haynesville, Fayetteville, and Marcellus shale play regions, J. Geophys. Res.Atmos., 120, 2119–2139, doi:10.1002/2014JD022697.
Pétron, G., et al. (2012), Hydrocarbon emissions characterization in the Colorado Front Range: A pilot study, J. Geophys. Res., 117, D04304,doi:10.1029/2011JD016360.
Pétron, G., et al. (2014), A new look at methane and nonmethane hydrocarbon emissions from oil and natural gas operations in the ColoradoDenver-Julesburg Basin, J. Geophys. Res. Atmos., 119, 6836–6852, doi:10.1002/2013JD021272.
Schneising, O., J. P. Burrows, R. R. Dickerson, M. Buchwitz, M. Reuter, and H. Bovensmann (2014), Remote sensing of fugitive methaneemissions from oil and gas production in North American tight geologic formations, Earth’s Future, 2, doi:10.1002/2014EF000265.
Schwarz, J. P., J. S. Holloway, J. M. Katich, S. McKeen, E. A. Kort, M. L. Smith, T. B. Ryerson, C. Sweeney, and J. Peischl (2015), Black carbonemissions from the Bakken Oil and Gas Development region, Environ. Scit. Technol. Lett., doi:10.1021/acs.estlett.5b0025.
Smith, M. L., E. A. Kort, A. Karion, C. Sweeney, S. C. Herndon, and T. I. Yacovitch (2015), Airborne ethane observations in the Barnett Shale:Quantification of ethane flux and attribution of methane emissions, Environ. Sci. Technol., 49, 8128–8166, doi:10.1021/acs.est.5b00219.
Stein, A. F., R. R. Draxler, G. D. Rolph, B. J. B. Stunder, M. D. Cohen, and F. Ngan (2015), NOAA’s HYSPLIT atmospheric transport and dispersionmodeling system, Bull. Am. Meteorol. Soc., 96, 2059–2077, doi:10.1175/BAMS-D-14-00110.1.
White, W. H., J. A. Anderson, D. L. Blumenthal, R. B. Husar, N. V. Gillani, J. D. Husar, and W. E. Wilson Jr. (1976), Formation and transport ofsecondary air pollutants: Ozone and aerosols in the St. Louis urban plume, Science, 194, 187–189, doi:10.1126/science.959846.
Journal of Geophysical Research: Atmospheres 10.1002/2015JD024631
PEISCHL ET AL. CH4 EMISSIONS FROM THE BAKKEN 6111


![The structure of Xray emissions from triggered lightning ...my.fit.edu/~nliu/papers/schaal-2014-xrayStructure.pdfJournal of Geophysical Research: Atmospheres 10.1002/2013JD020266 channelnearlysimultaneously.Furthermore,Hill[2012]showedthatX-raysarelocatedontheorderof10m](https://img.dokumen.tips/doc/110x75/5d05ffec88c99375438ce9f0/the-structure-of-xray-emissions-from-triggered-lightning-myfitedunliupapersschaal-2014-.jpg)