Embed Size (px)
Citation preview

Quantification of T-cell dynamics
from telomeres to DNA labelling
José Borghans
Dpt. Immunology
University Medical Center Utrecht

How long does a T cell live?
• Estimates vary widely
• How is T-cell turnover disturbed
in HIV infection, leukemia,
or after stem cell transplantation?
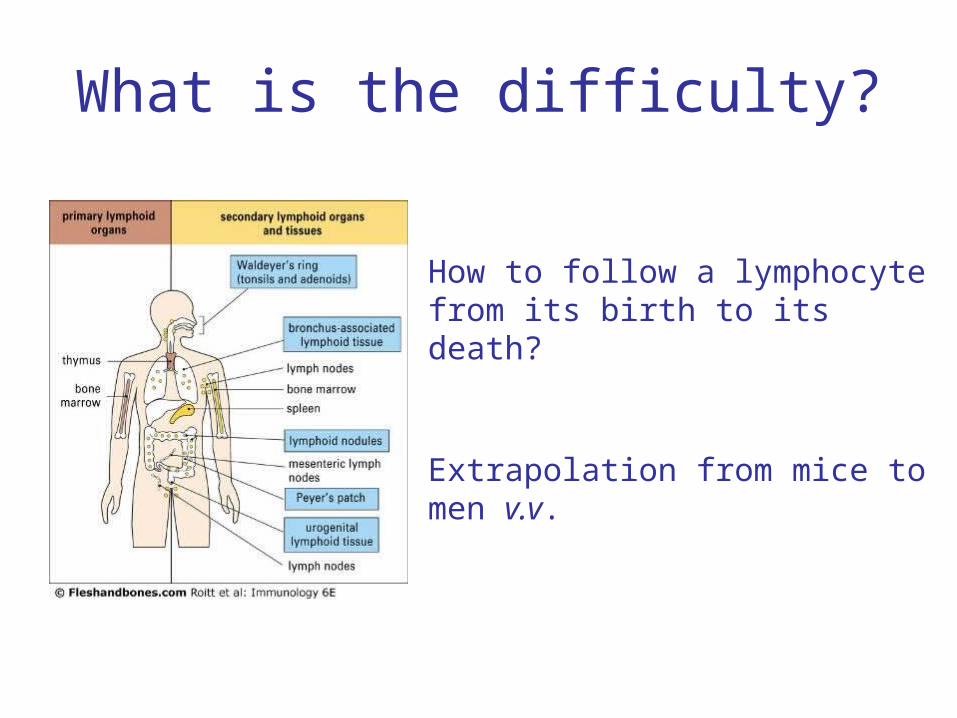
What is the difficulty?
How to follow a lymphocyte from its birth to its death?
Extrapolation from mice to men v.v.

3 years of age 23 years of age
Mackall et al. 1995
Experiments of nature (1): T-cell reconstitution after chemotherapy
Underestimate?: Cells may also die during reconstitution
Overestimate?: Cells undergo little competition

Michie et al. Nature 1992
CD45RA (“naive”)
CD45RO (“memory”)
Immunological memory resides in a population with rapid turnover:
Memory T cells have a shorter lifespan (~250 d) than naive T cells (~1000 d)
Experiments of nature (2): Loss of T cells with chromosome damage
Caution: Cells have DNA damage, and cell numbers are low
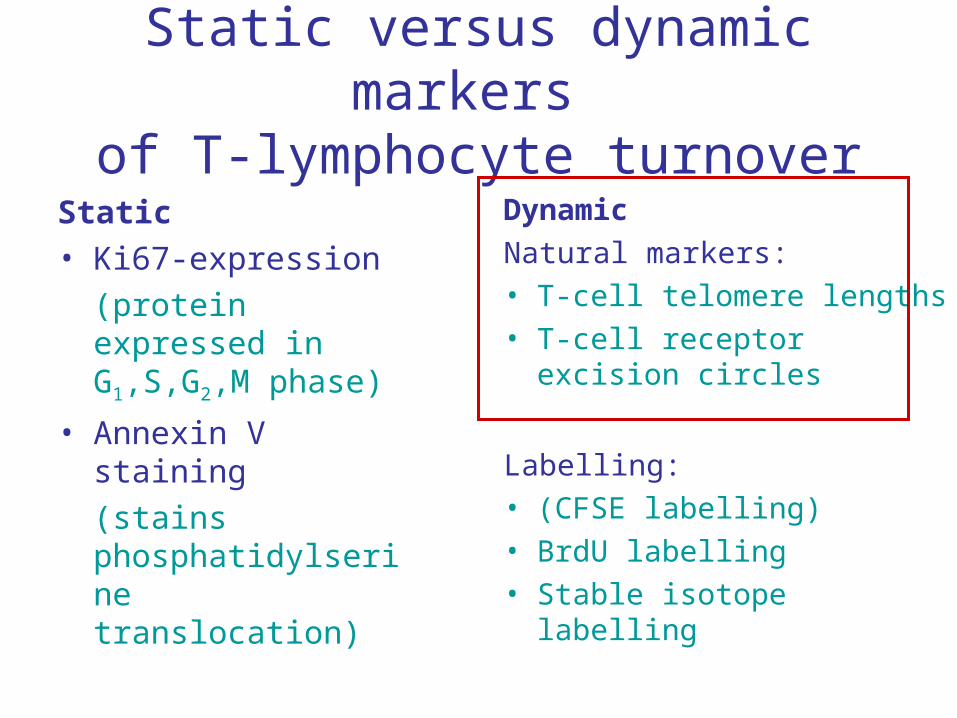
Static versus dynamic markers of T-lymphocyte turnover
Static• Ki67-expression
(protein expressed in G1,S,G2,M phase)
• Annexin V staining
(stains phosphatidylserine translocation)
Dynamic
Natural markers:• T-cell telomere lengths • T-cell receptor excision
circles
Labelling:• (CFSE labelling)• BrdU labelling• Stable isotope labelling
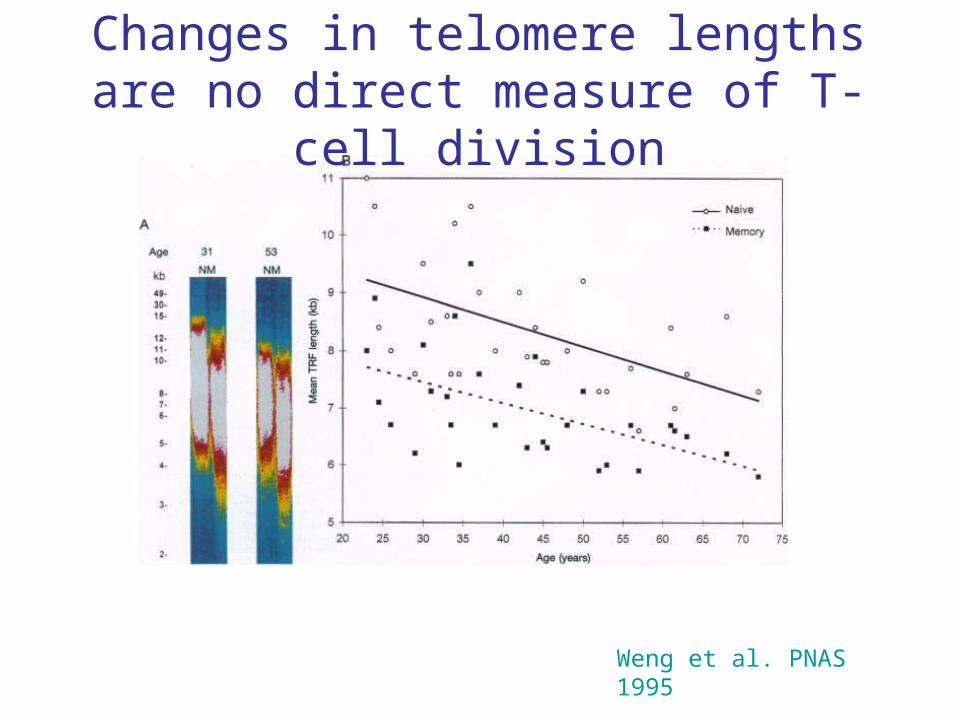
Weng et al. PNAS 1995
Changes in telomere lengths are no direct measure of T-cell division
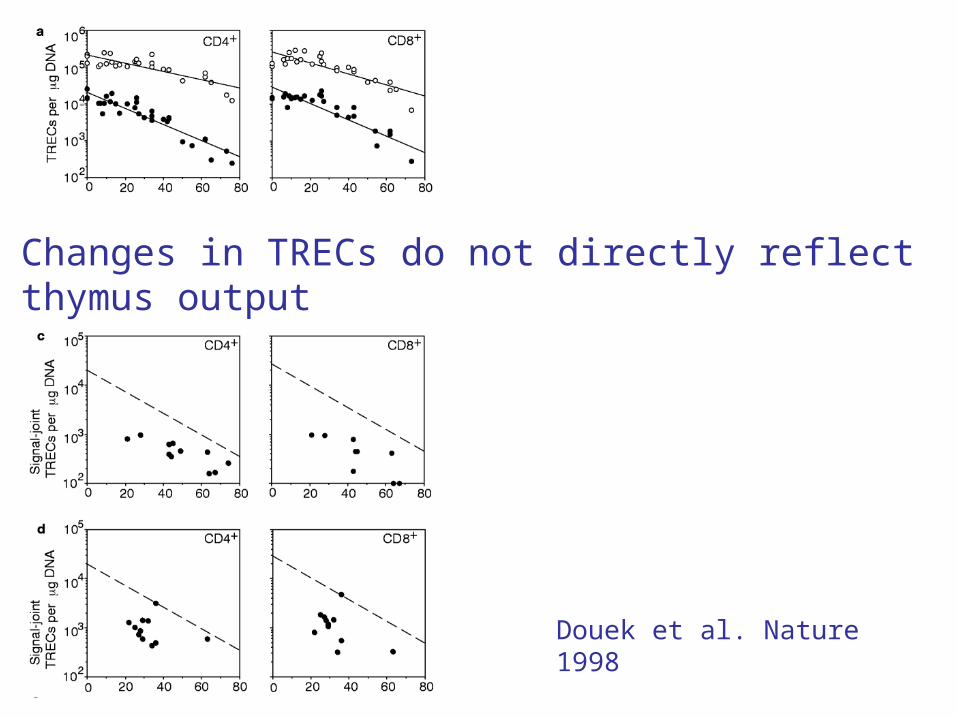
Changes in TRECs do not directly reflect thymus output
Douek et al. Nature 1998

Static versus dynamic markers of T-lymphocyte turnover
Static• Ki67-expression
(protein expressed in G1,S,G2,M phase)
• Annexin V staining
(stains phosphatidylserine translocation)
Dynamic
Natural markers:• T-cell telomere lengths • T-cell receptor excision
circles
Labelling:• (CFSE labelling)• BrdU labelling• Stable isotope labelling

Dynamic markers (1) BrdU Labelling
BrdU = 5-bromo-2’-deoxyuridine
Nucleoside analog
incorporated instead of thymidine

Determine percentage BrdU+ cells by FACS analysis
Kovacs et al. 2001
How to quantify leukocyte turnover?
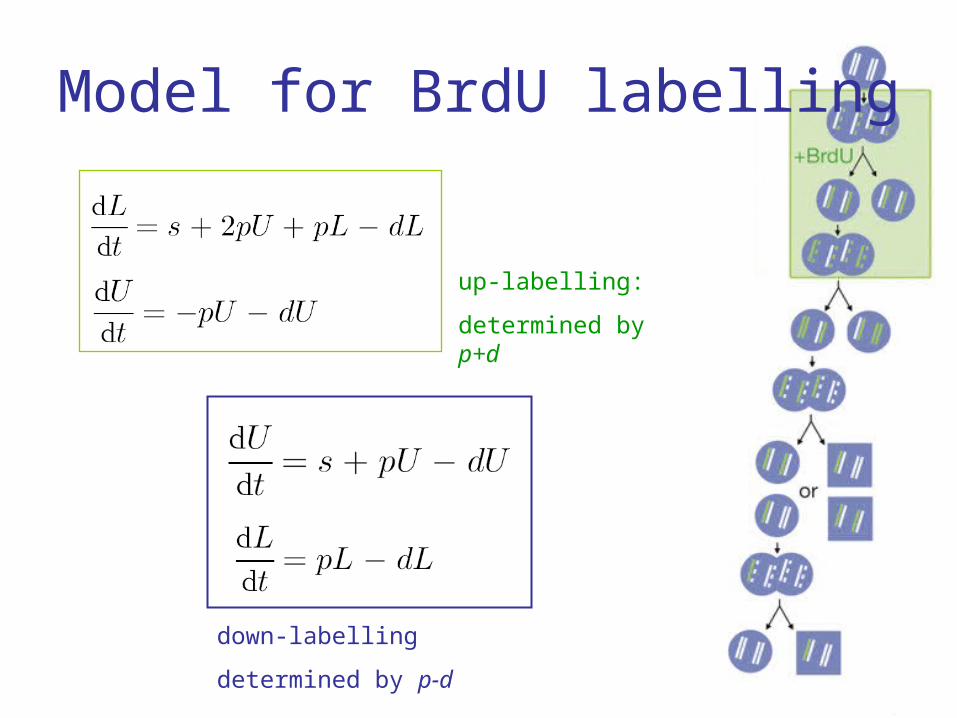
Model for BrdU labelling
up-labelling:
determined by p+d
down-labelling
determined by p-d

Expected changes in the percentage of BrdU+ cells
p-d
p+d
See today’s exercise
But… possible toxicity, almost only done in mice, only short-term labelling
Kovacs et al. 2001

Deuterium (2H) replaces hydrogen in DNA of proliferating cells
Dynamic markers (2) Stable isotope labelling
Measure deuterium-enrichment using GC/MS
Main advantage: no interference with cell dynamics
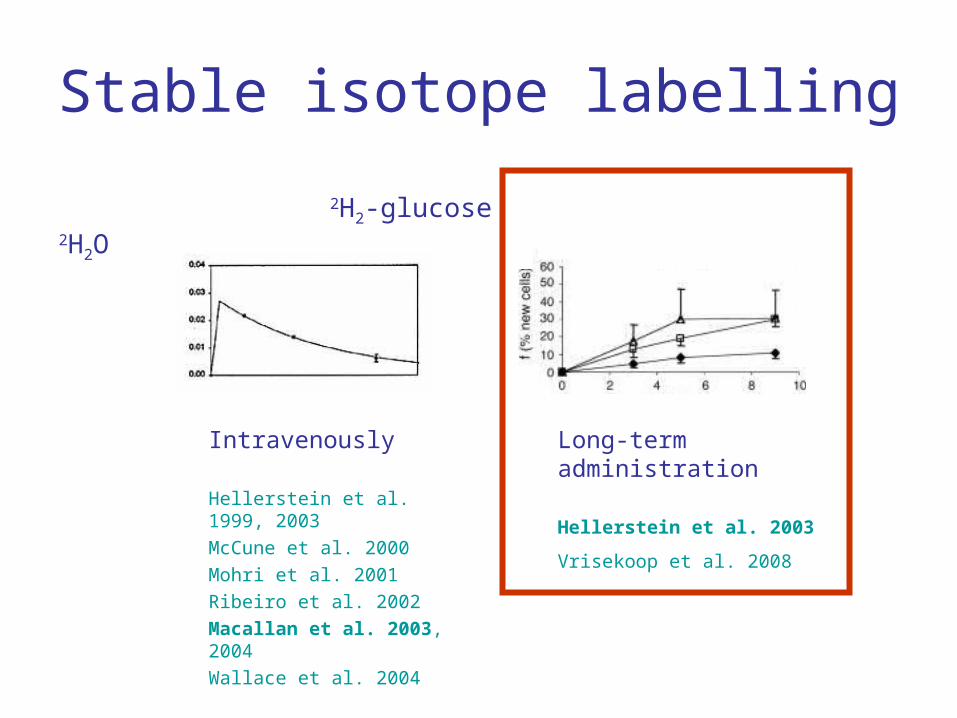
2H2-glucose 2H2O
Intravenously
Hellerstein et al. 1999, 2003
McCune et al. 2000
Mohri et al. 2001
Ribeiro et al. 2002
Macallan et al. 2003, 2004
Wallace et al. 2004
Long-term administration
Hellerstein et al. 2003
Vrisekoop et al. 2008
Stable isotope labelling

Enrichment in DNA of cells
Fraction labeled DNA (!) L changes by:
Label
U(t)
p - L - dL
2H2O labeling does not distinguish between production in thymus and periphery!
Yields two parameters: p and d
p from upslope, d from up- and downslope

Asquith et al. 2002
dp
Typically: p < d
Paradox: d is typically larger than p
Conclusion: d is no good measure of average turnover rate
It represents the turnover of labelled cells

Short labelling periods give higher estimate of d
Asquith et al. 2002

Average turnover (p) needs data during up-labeling period
D-glucose D2O
Advantages of heavy water: long-term labeling possible
many data points during labeling

BrdU
Potentially toxic
Measures labeled cells
Up: p+d Down: p-d
Deuterium labeling
Non-toxic (non-radioactive)
Measures labeled DNA strands
Up: p (and d) Down: -d

NaiveT-cell dynamics of mice and men

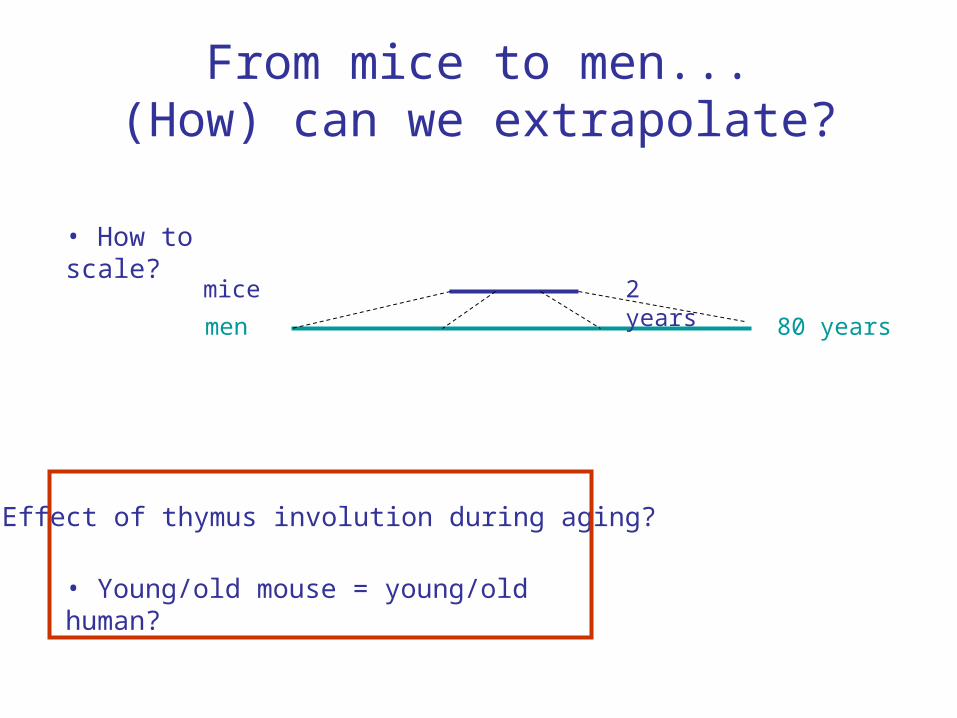
From mice to men...(How) can we extrapolate?
2 years
80 years
mice
men
2 years
80 years
mice
men
• How to scale?
• Young/old mouse = young/old human?
• Effect of thymic involution during aging?

Of mice... Naive T-cell dynamics using 2H2O
H-O-H
H-O-HLabel acquisition:
- proliferation- thymic output
Loss of label:- cell death- differentiation/migration
C57Bl/62H2O4w
% l
ab
ele
d
time
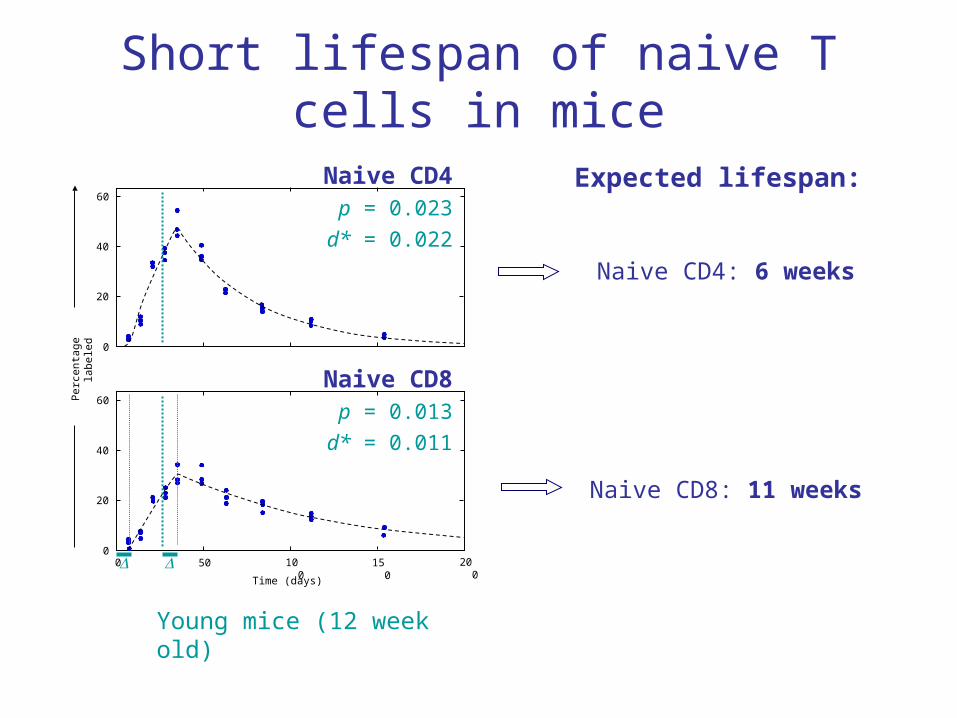
Short lifespan of naive T cells in mice
Expected lifespan:
Naive CD4: 6 weeks
Naive CD8: 11 weeks
Per
cent
age
labe
led
20
40
60
0
50 100 150 200
Time (days)
20
40
60
00
Naive CD4p = 0.023
d* = 0.022
Naive CD8p = 0.013
d* = 0.011
Young mice (12 week old)

And men... T-cell dynamics using 2H2O
H-O-H
H-O-H
% l
ab
ele
d
time~ 400 ml D2O on day 0
~ 50 ml D2O daily during 9 weeks

T-cell turnover in healthy individuals
Vrisekoop et al.
PNAS 2008
Lifespan 6.0 9.4 0.6 1.0 year

T-cell turnover in young healthy men
Vrisekoop et al. PNAS 2008
200
Per
cent
age
labe
led
20
40
60
0
50 100 150Time (days)
20
40
60
00
Naive CD4
Naive CD8
Young adult mice (12 week old)
Lifespan 6.0 9.4 0.6 1.0 year
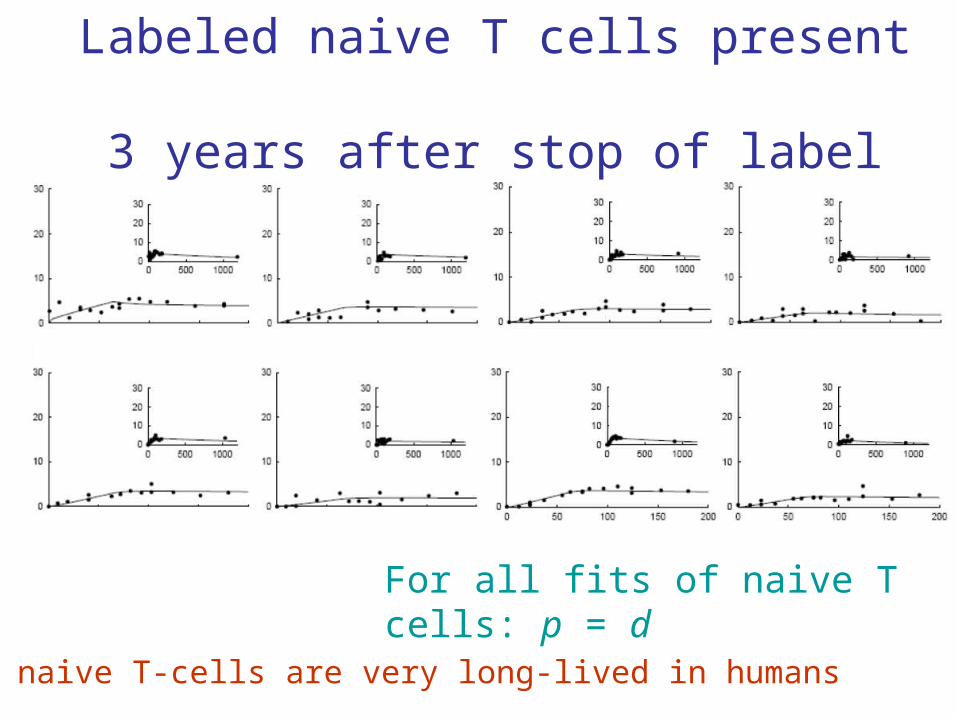
Labeled naive T cells present 3 years after stop of label
For all fits of naive T cells: p = d
All naive T-cells are very long-lived in humans
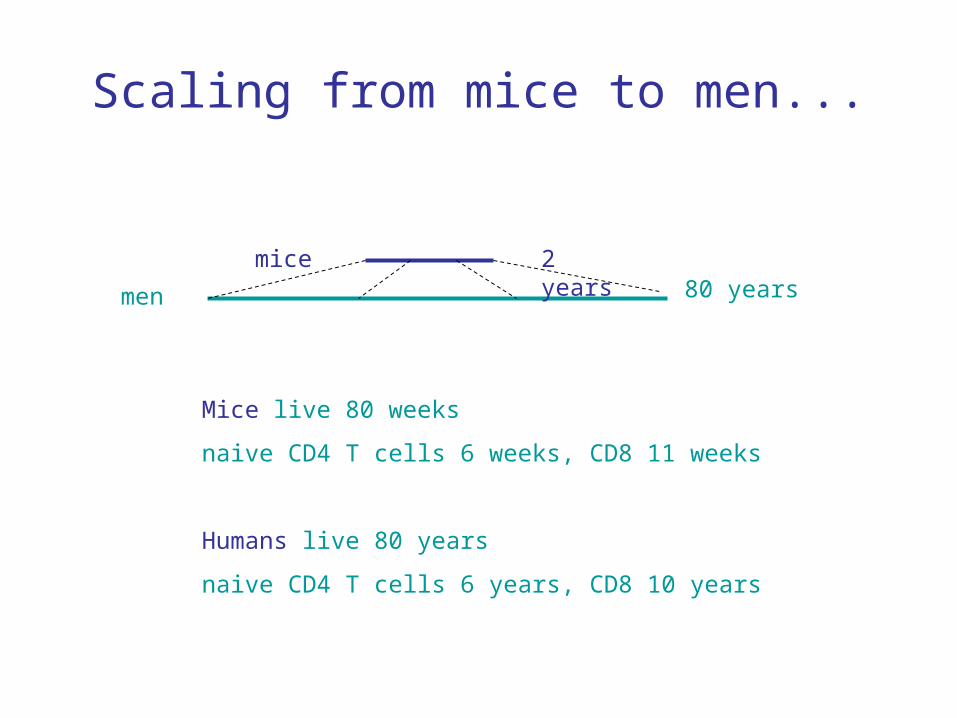
Scaling from mice to men...
2 years80 years
mice
men
Mice live 80 weeks
naive CD4 T cells 6 weeks, CD8 11 weeks
Humans live 80 years
naive CD4 T cells 6 years, CD8 10 years
From mice to men...(How) can we extrapolate?
2 years
80 years
mice
men
• How to scale?
• Young/old mouse = young/old human?
• Effect of thymus involution during aging?

Thymus involution in mice and men
Mice Men
Steinman et al. 1985

2H2O labeling does not distinguish between production in thymus and periphery
Proliferation
Thymic outputDifferentiation
Naïve
Death
Label acquisition:- thymic output- proliferation
Loss of label:- cell death- differentiation/migration
Fra
ctio
n la
be
led
DN
A
Time in days

Distinguishing between T-cell proliferation and thymic output
ATx or ShamTx at 7 weeks of age
Isolation of spleen, PLNs and thymus
FACS analysis
Mathematical modelling
C57BL/6

Naive T-cell dynamics after thymectomy
N’ = ε f(t) + rnN – dnN2Naive T cells:
Naive CD4 (spleen)
Naive CD8 (spleen)
Tx
Control
Tx
Control
ε = 2.8 10-2
rn = – 3.0 10-3
dn = 1.7 10-9
Cel
ls (
x10
6)
Mouse age (weeks)
ε = 2.8 10-2
rn = – 2.0 10-3
dn = 6.8 10-10
0.9% of thymocytes per day

Naive T-cell production in mice almost completely due to thymic output!
Loss
Thymic output
Heavy water
Peripheral proliferation
Total Naive T-cell production
Naive CD4 p = 0.28 106 / day
Naive CD8 p = 0.13 106 /day
Thymectomy Thymic output
Loss
Peripheral proliferation
Thymic output:
CD4 thymic emigrants 0.35 106 / day
CD8 thymic emigrants 0.12 106 / day
Contribution of thymic output and T-cell proliferation in mice

If everything depends on thymic output, what happens when thymic output declines?
Young mice:12 weeks
43 days
77 days
42 days
91 days
Old mice: 85 weeks
p = 0.023 p = 0.024
p = 0.013 p = 0.011
Time (days)
?

Naive T-cell dynamics in mice hardly change with age
The naive pool of a mouse is a big homogeneous pool of thymus emigrants
Young mice:12 weeks
43 days
77 days
42 days
91 days
Old mice: 85 weeks
p = 0.023 p = 0.024
p = 0.013 p = 0.011
Time (days)
Naive T-cell proliferation hardly occurs at any age in mice!

This is completely different in humans!
Evidence for naive T-cell proliferation in men…

TREC decline with age originally interpreted to reflect thymus decline
Child
Adult
Douek et al. Nature 1998 Rodewald Nature 1998

If naive T-cells proliferate homeostatically, TREC contents do decline
Naive TREC decline in humans suggests that naive T-cell proliferation contributes to the naive T-cell pool in humans
Hazenberg et al. 2000, Dutilh et al. 2003

CD31 proposed as marker for non-divided naive CD4 T cells
Naive Memory
CD31+ CD31-
thymus
CD31+ naive T cells have consistently higher TREC content than CD31-
Suggestion: CD31+ naive T cells represent (non-divided) thymic emigrants
CD31- naive T cells have divided
Kimmig et al J. Exp Med 2002

However, even CD31+ naive T cells divide in humans!
See also Kilpatrick et al. 2008
Age (years)
0 10 20 30 40 50 60 70 80
Sj T
RE
C c
on
ten
t/ c
ell
0.0001
0.001
0.01
0.1
1
CD31+
CD31-
CD4 SP
Age (in years)
TR
EC
con
tent
per
cel
l

Fewer thymus emigrants (TE) than CD31+ naive T cells
Naive Memory
CD31+ CD31-
thymus
Naive Memory
CD31-thymus CD31+
TE non-TE
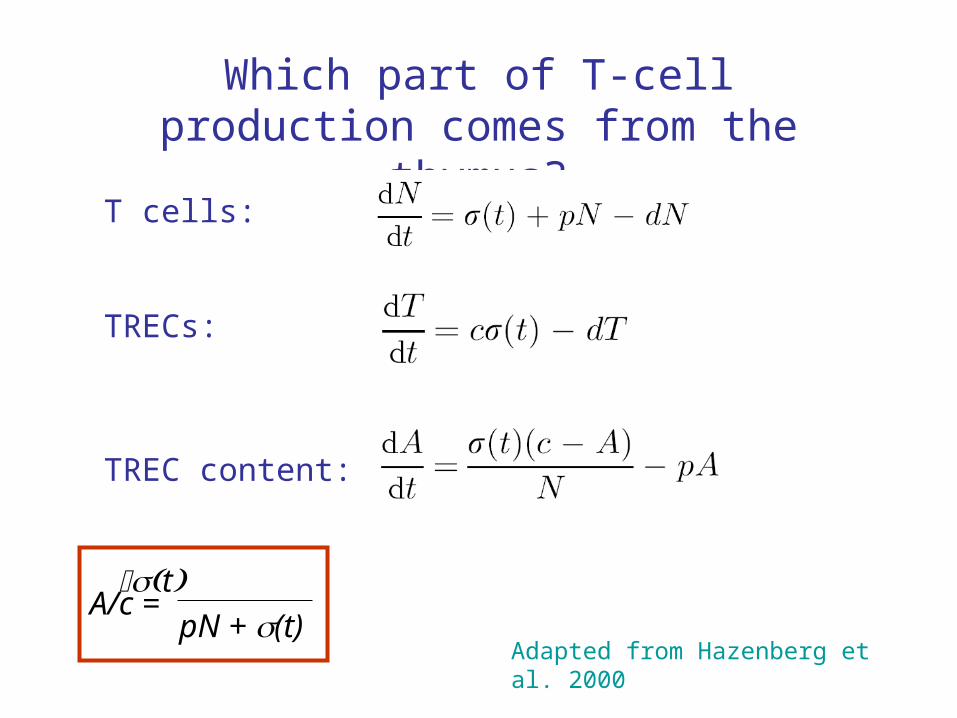
T cells:
TRECs:
TREC content:
Which part of T-cell production comes from the thymus?
Adapted from Hazenberg et al. 2000
tpN + (t)
A/c =

Use TREC content of cord blood or SP thymocytes to measure c
See also Kilpatrick et al. 2008
Age (years)
0 10 20 30 40 50 60 70 80
Sj T
RE
C c
on
ten
t/ c
ell
0.0001
0.001
0.01
0.1
1
CD31+
CD31-
CD4 SP
Age (in years)
TR
EC
con
tent
per
cel
l
tpN + (t)
A/c =
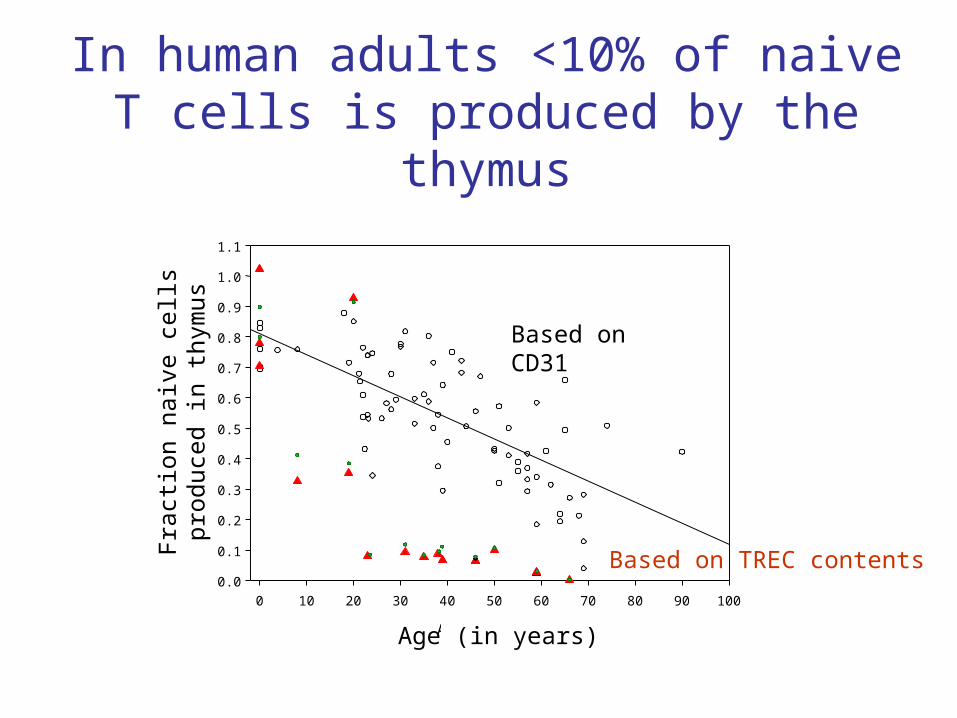
In human adults <10% of naive T cells is produced by the thymus
Age (years)
0 10 20 30 40 50 60 70 80 90 100
0.0
0.1
0.2
0.3
0.4
0.5
0.6
0.7
0.8
0.9
1.0
1.1
Fra
ctio
n R
TE
Fra
ctio
n na
ive
cells
pro
duce
d in
thy
mus
Age (in years)
Based on CD31
Based on TREC contents

Extrapolating from mice to men
RTERTE
Proliferation
RTERTE
ProliferationMen
2 years80 years
mice
men
Prediction:
without proliferation there should be no TREC dilution in mice…

0 25 50 75 100
125
150
0.0001
0.001
0.01
0.1
1 CD4NCD4E/MCD8NCD8E/M
Age [weeks]
TR
EC
s/ce
ll
And indeed... no TREC decline in naive T cells from mice

NaiveT-cell dynamics of mice and men
“The best-laid schemes o' mice an' men, Gang aft agley”
The most carefully prepared plansmay go wrong
Quantification of T-cell dynamics
from telomeres to DNA labelling