Embed Size (px)
Citation preview
QUANTIFICATION OF MERCURY, LEAD, AND CADMIUM IN AQUEOUS SOLUTIONS BY
ENERGY K X-RAY FLUORESCENCE SPECTROSCOPY
P. Suwanathada and T.A. DeVol Department of Environmental Engineering and Science
Clemson University, SC 29634-0919 USA
ABSTRACT
An energy dispersive K X-ray fluorescence (EDXRF) system was used to simultaneously quantify volatile and semi-volatile heavy metals in aqueous solutions. The EDXRF system consisted of a 31 MBq (1/2001) 57Co excitation source, one of two low-energy high-purity germanium (HPGe) semiconductor detectors coupled with standard NIM electronics and a data acquisition system. The K X-ray fluorescence from mercury, lead and cadmium at concentrations ranging from 0 to 200 mg/L for mercury and 0 to 400 mg/L for lead and cadmium were investigated. Acidified solutions were prepared based on the ratio of mercury to lead and cadmium at 0:1, 1:0, 1:2, 1:4, and 1:8. The 100-mL samples were directly presented to the detection system without sample pretreatment. The source-sample-detector geometry was arranged so that the collimated source was positioned perpendicular to the centerline of the detector, while the sample was positioned at the intersection. Metal quantification was based on K X-ray fluorescence peaks. Calibration curves were determined from the relationship of individual metal concentration and K X-rays net peak areas. The minimum detectable levels (MDLs) for the planar HPGe for mercury, lead, and cadmium were 0.58, 0.61, and 0.20 cps, which corresponded to the minimum detectable concentrations (MDCs) at 25, 12, and 30 mg/L, respectively. The MDLs for the coaxial HPGe were 0.61, 0.84, and 0.42 cps for mercury, lead, and cadmium, which corresponded to the MDCs at 24, 25, and 82 mg/L, respectively.
INTRODUCTION
Mercury, lead, and cadmium are emitted from various combustion sources such as hazardous waste incinerators and coal fired power plants. Standards and regulations in the United States set mercury as a high volatile metal, and lead and cadmium as semi-volatile metals.1 Quantification of heavy metal emissions is important for process control, regulatory compliance and risk assessment. Emissions may be measured either in situ or ex situ by selective sorption in different media such as liquid solution or a solid. Many source sampling devices use cumulative measuring schemes by passing the flue gas through the sampling probe, a bubbler and a series of suitable absorbing solutions followed by off-line analysis.2
X-ray fluorescence (XRF) spectroscopy is one of the possible techniques for simultaneous multi-metal quantification for on-line and field application. Energy dispersive XRF (EDXRF) is an analytical technique based on taking a measurement of characteristic X-ray energy to identify and quantify an element.3 Application in process control for emission measurements usually does not involve quantification at very low concentrations. For instance, USEPA estimated mercury contents from typical uncontrolled flue gas in the range of 400-1400 µg/m3 for municipal waste combustor and 1-25 µg/m3 for coal-fired utility boilers.4
Copyright (c)JCPDS-International Centre for Diffraction Data 2002, Advances in X-ray Analysis, Volume 45. 505 ISSN 1097-0002

This document was presented at the Denver X-ray Conference (DXC) on Applications of X-ray Analysis. Sponsored by the International Centre for Diffraction Data (ICDD). This document is provided by ICDD in cooperation with the authors and presenters of the DXC for the express purpose of educating the scientific community. All copyrights for the document are retained by ICDD. Usage is restricted for the purposes of education and scientific research. DXC Website – www.dxcicdd.com
ICDD Website - www.icdd.com
ISSN 1097-0002

Various types of samples may be analyzed by XRF, including solids, liquids and gases. Liquid samples are appropriate for on-line measurement because continuous flow can be arranged through the sample chamber of the spectrometer. However, liquid sample usually provides a high X-ray scatter background resulting in poor signal-to-noise ratio. Typical detection limits of conventional direct EDXRF with 30 minutes counting time are in the ppm range.5 Preconcentration or separation method could be used to achieve better detection level, if desired. For example, on-line quantification of lead in water stream collecting on a filter medium has been studied and detection level at sub ppb level was obtained.6 Metal quantification in the XRF technique is based on characteristic X-ray emission either K or L X-ray lines. High-Z elements are usually analyzed using L X-ray lines, ~ 3-15 keV, which can be excited with a conventional X-ray tube.7 Many of the mercury studies used Si (Li) semiconductor detector as an X-ray spectrometer8-11, which has the response function dominated in the low energy region.12 Analysis of a high-Z element based on its K-lines has increased recently.13 This research is aimed toward quantification of mercury, lead, and cadmium in aqueous solutions by EDXRF with emphasis on the effects of potential lead and cadmium interferences on mercury quantification. The EDXRF system is based on a radioisotope as an excitation source and one of two germanium detectors as an X-ray spectrometer. Metal quantification is based on the determination of the K X-ray peak areas. The Kα X-ray was chosen to quantify the net peak area of each metal because the Kα X-ray line provided relatively high X-ray intensities and high fluorescence yields.14 This research is a subsequent study to the development of a K X-ray EDXRF system for quantification of mercury in aqueous solution.15 MATERIAL AND METHOD The EDXRF system was based on a low-energy high purity germanium (HPGe) X-ray spectrometer. Two different configurations of the n-type HPGe detectors were used in this study. The first was a planar HPGe configuration detector (Canberra Model GL 1520R, diameter 43.7 mm, thickness 20 mm, active area 1500 mm2, and active volume 30 cm3), and the second was a coaxial HPGe configuration detector in pop-top capsule (EG&G Ortec Model GMX-25190 P-A, diameter 57.0 mm, and length 55.1 mm). Excitation source was a radioisotope 57Co (31 MBq, 1/2001), of which the principal gamma-ray energies are 122.06 keV (85.5%), and 136.47 keV (10.7%).14 The detector was connected with associated standard NIM electronics and a computerized data acquisition system (Aptec MCArd 1204). The HPGe detector was cooled with liquid nitrogen. The bias was negative bias at 2000 volts for the planar HPGe and 4500 volts for the coaxial HPGe. Detector energy calibration was performed by using reference gamma ray sources, which included 241Am, 133Ba, 57Co, and 152Eu. The excitation source, sample and detector geometry was chosen to minimize the direct radiation from the source to the detector and the scattered radiation from the sample. The collimated source was positioned perpendicular to the centerline of the detector, while the sample was positioned at the intersection. This geometry was also arranged in order to minimize the contribution from the Compton continuum on the K X-rays of interest energies.
Copyright (c)JCPDS-International Centre for Diffraction Data 2002, Advances in X-ray Analysis, Volume 45. 506 ISSN 1097-0002

All reagents used in this research were of certified analytical grade or ultra-pure reagent. A mixture of acidified mercury, lead, and cadmium solutions were prepared from standard reference solution (certified at 1000 ppm ± 1%) and diluted to the desired concentrations. Mercury concentration ranged from 0 to 200 mg/L. Lead and cadmium concentrations ranged from 0 to 400 mg/L. Mercury concentrations from uncontrolled stack emission in the absorbing solution after four-hour sampling time and sampling rate of 28 L/min were calculated from USEPA data4 to be approximately in the 50 to 200 mg/L range. A mixture of acidified solutions was prepared based on the ratio of mercury to lead and cadmium at 0:1, 1:0, 1:2, 1:4, and 1:8. The 100-mL sample in a plastic bottle was directly presented to the detection system without any sample pretreatment. The counting time for each sample was 3,600 to 15,000 seconds depending on the metal concentration and the detector type. Metal quantification was based on K X-rays. Mercury, lead and cadmium K X-ray peaks were identified based on their corresponding energies. The principal K X-ray emission lines that have relative intensity greater than 1% are summarized in Table I. Table I: Mercury (Hg), lead (Pb), and cadmium (Cd) K X-ray emissions.14
X - ray energy (keV) and intensity per 100 K-shell vacancies+ Element Kα1 Kα2 Kβ1 Kβ2 Kβ3 Mercury 70.818 (46.39) 68.894 (27.56) 80.255(10.70) 82.473 (3.88) 79.824 (5.59) Lead 74.969 (46.29) 72.805 (27.76) 84.938 (10.70) 87.300 (3.92) 84.450 (5.58) Cadmium 23.174 (46.11) 22.984 (24.57) 26.095 (7.69) 26.644 (1.99) 26.060 (3.99)
+ Intensities are given as a percentage in parentheses
The K X-ray peaks quantification was conducted with standard spectroscopy algorithms.16, 17 Spectrum processing method using an analytical technique was applied to quantify each peak area when there was spectral overlap. This analytical technique was modified from the method to resolve two β-emitting radionuclides in liquid scintillation counting.18 The net count rates (cps) within the same region of interest (ROI) acquired from the control solution were deducted from the net count rates in each X-ray peak areas. These net peak areas were used to calculate a calibration line, which is the relationship between metal concentrations (mg/L) and Kα X-ray net count rate for each metal solution. Statistical test at an observed significant level 5% was performed to compare the K X-ray net peak areas from different solutions using analysis of variance (ANOVA) two-sided hypothesis test, F-test, and Fisher’s least significant difference (LSD) test.19 Metal calibration curves were compared by using the calibration lines and ANOVA test.19 The minimum detectable level (MDL) was calculated at 95% confidence level and was based on counting statistics20 as ND = 2.71 + 4.65 B where ND = minimum counts within the X-ray ROI to assure 5% chance of having a false conclusion and B = background counts within the X-ray ROI. Therefore, the MDL in the unit of count rate =
tND , where t = count time (seconds). The
Copyright (c)JCPDS-International Centre for Diffraction Data 2002, Advances in X-ray Analysis, Volume 45. 507 ISSN 1097-0002

MDL (cps) was converted to the minimum detectable concentrations (MDC) in mg/L using the corresponding calibration curve for each metal. RESULTS AND DISCUSSIONS Spectra of mercury and lead X-rays acquired from the planar and the coaxial HPGe are compared in Figure 1. The spectrum acquired from the coaxial HPGe had shown relatively higher net count rate (cps) than the planar HPGe due to much larger physical size. Figure 1 also illustrated that the planar HPGe has shown better resolution than the coaxial HPGe, hence, lower spectral overlap between the mercury Kα1 and the lead Kα2 X-rays. Energy resolution (FWHM) at 122.06 keV was 0.86 keV for the planar HPGe, and 1.63 keV for the coaxial HPGe. Both detectors could resolve mercury and lead K X-rays from different line group (Kα and Kβ) and within the same line group (such as Kα1 and Kα2 ; Kβ1 and Kβ2). Both detectors could resolve Cd Kα line from Kβ but could not resolve Cd K X-ray line within the same line group. The X-ray net peak areas increased proportional with metal concentrations as illustrated in Figure 2 for cadmium spectra acquired from the planar HPGe. Mercury and lead also exhibited the same trend. The X-ray peaks with consistent intensity were observed at 24 and 27 keV and are likely K X-rays from indium, which is used as electronic contact in the germanium crystal.
-0 .20
0.00
0.20
0.40
0.60
0.80
1.00
1.20
66 68 70 72 74 76 78
Planar HPGe Coaxial HPGe
Net
cou
nt r
ate
(cps
)
Energy (keV)
Hg K α2
Hg K α1
Pb Kα2 Pb Kα
1
0.20
0.25
0.30
0.35
0.40
0.45
0.50
0.55
0.60
20 22 24 26 28 30
Control 100 mg/L 200 mg/L 400 mg/L
Cou
nt r
ate
(cps
)
Energy (keV)
Cd Kα
Cd Kβ
In K α?
In K β ?
A an(RcalsigmeleaforHP
Copyright (c)JCPDS-International Centre for Diffraction Data 2002, Advances in X-ray Analysis, Volume 45. 508 ISSN 1097-0002
Figure 1: Mercury and lead K X-rays afterbackground subtraction for the same solution(mercury concentration was 200 mg/L andlead concentration was 400 mg/L).
calibration line for each metal was prepared from td metal concentration (mg/L). Some of these calib2) obtained from various combinations were compaibration lines prepared from a series of single metanificant difference, although a difference in slope tal solution, good linearity and correlation was obd, and cadmium = 0.997, 0.960, and 0.985 for the the coaxial HPGe, respectively). Better correlatioGe than the coaxial HPGe. This might be attribute
Figure 2: Cadmium K X-ray spectra fromdifferent cadmium concentrations acquiredfrom the planar HPGe.
he relationship between net count rate (cps) ration lines and coefficient of correlation red in Figure 3. Statistical test for these l solutions and mixed solutions showed no
was observed in some cases. For a single served for both detectors (R2 for mercury, planar HPGe; and 0.985, 0.995, and 0.906 n was generally observed from the planar d to the better energy resolution of the
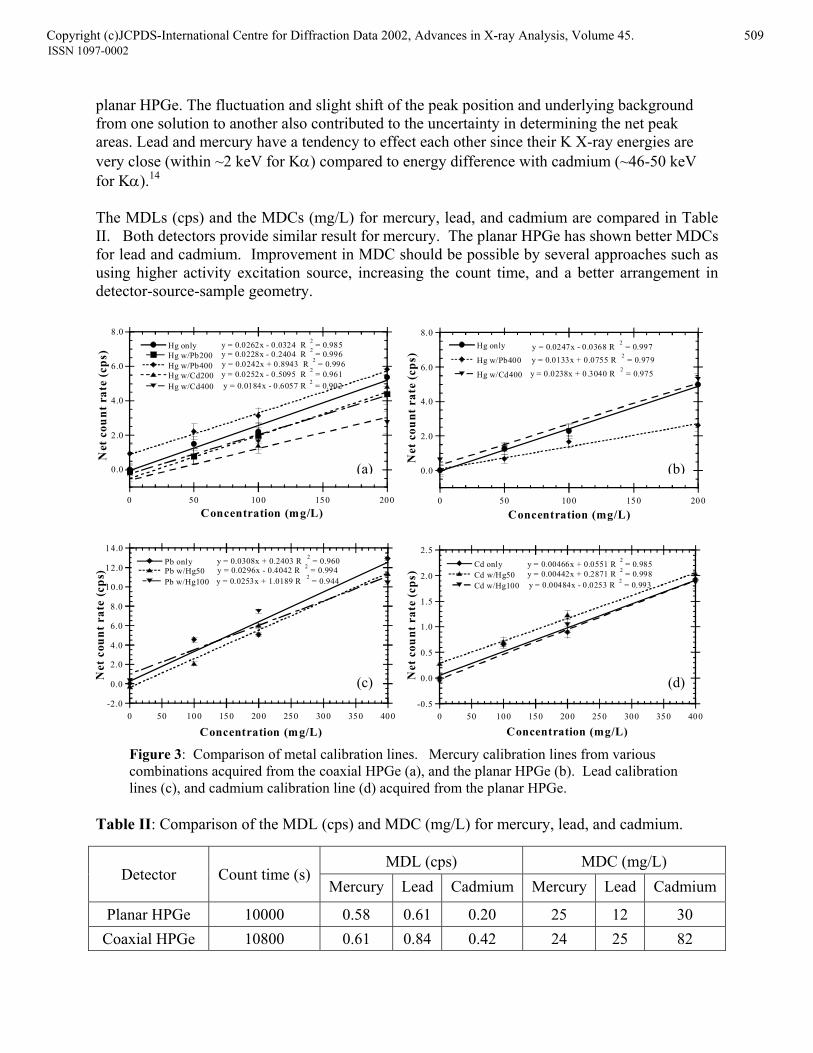
planar HPGe. The fluctuation and slight shift of the peak position and underlying background from one solution to another also contributed to the uncertainty in determining the net peak areas. Lead and mercury have a tendency to effect each other since their K X-ray energies are very close (within ~2 keV for Kα) compared to energy difference with cadmium (~46-50 keV for Kα).14 The MDLs (cps) and the MDCs (mg/L) for mercury, lead, and cadmium are compared in Table II. Both detectors provide similar result for mercury. The planar HPGe has shown better MDCs for lead and cadmium. Improvement in MDC should be possible by several approaches such as using higher activity excitation source, increasing the count time, and a better arrangement in detector-source-sample geometry.
y = 0.0262x - 0.0324 R 2 = 0.985 y = 0.0228x - 0.2404 R 2 = 0.996 y = 0.0242x + 0.8943 R 2 = 0.996 y = 0.0252x - 0.5095 R 2 = 0.961 y = 0.0184x - 0.6057 R 2 = 0.902
0.0
2.0
4.0
6.0
8.0
0 50 100 150
Hg onlyHg w/Pb200Hg w/Pb400Hg w/Cd200Hg w/Cd400
Net
cou
nt r
ate
(cps
)
Concentration (mg/L)
y = 0.0247x - 0.0368 R 2 = 0.997 y = 0.0133x + 0.0755 R 2 = 0.979
y = 0.0238x + 0.3040 R 2 = 0.975
0.0
2.0
4.0
6.0
8.0Hg only
Hg w/Pb400
Hg w/Cd400
Net
cou
nt r
ate
(cps
)
y = 0.0308x + 0.2403 R 2 = 0.960 y = 0.0296x - 0.4042 R 2 = 0.994 y = 0.0253x + 1.0189 R 2 = 0.944
-2.0
0.0
2.0
4.0
6.0
8.0
10.0
12.0
14.0
0 50 100 150 200 250 300 3
Pb onlyPb w/Hg50 Pb w/Hg100
Net
cou
nt r
ate
(cps
)
Concentration (mg/L)
Figure 3: Comparison of metal calibrcombinations acquired from the coaxilines (c), and cadmium calibration line
Table II: Comparison of the MDL (cps)
Detector
Count time (s)
Me
Planar HPGe 10000 0Coaxial HPGe 10800 0
Copyright (c)JCPDS-International Centre for Diffraction Data 2002, Advances in X-ray Analysis, Volume 45. 509 ISSN 1097-0002
(a)
200 0 50 100 150
Concentration (mg/L)
50 400
y = 0.00466x + 0.0551 R 2 = 0.985 y = 0.00442x + 0.2871 R 2 = 0.998 y = 0.00484x - 0.0253 R 2 = 0.993
-0.5
0.0
0.5
1.0
1.5
2.0
2.5
0 50 100 150 200 250 300 3
Cd onlyCd w/Hg50Cd w/Hg100
Net
cou
nt r
ate
(cps
)
Concentration (mg/L)
(c)
ation lines. Mercury calibration lines from various al HPGe (a), and the planar HPGe (b). Lead calibrati (d) acquired from the planar HPGe.
and MDC (mg/L) for mercury, lead, and cadmiu
MDL (cps) MDC (mg/Lrcury Lead Cadmium Mercury Lead C
.58 0.61 0.20 25 12
.61 0.84 0.42 24 25
(b)
200
50 400
(d)
on
m.
) admium
30 82

CONCLUSION Mercury, lead, and cadmium K X-ray intensities in terms of net peak areas is linearly proportional with their concentrations in solutions. Mercury and lead, which are very close in K X-ray peak energy, have a tendency to effect each other; however, statistical tests showed no significant difference among the single metal and multimetal calibration curves once an analytical processing technique was applied. Good correlation and linearity within the concentrations studied was achieved. The MDC for our configuration was 10 to 100 mg/L for a 3-hour data collection time. Lowering the MDC should be possible by utilizing a higher activity excitation source, increasing the count time, or possibly a better arrangement of detector-source-sample geometry. ACKNOWLEDGEMENT The primary author would like to thank the Ministry of Science, Technology, and Environment, Thailand for providing her scholarship. The authors would also like to thank the South Carolina Hazardous Waste Management Research Fund for their partial support. REFERENCES [1] United States Environmental Protection Agency. NESHAPS: Final Standards for Hazardous Air Pollutants for Hazardous Waste Combustors; Final Rule. 40 FR 52828, September 30, 1999. [2] De Nevers, N. Air Pollution Control Engineering. USA, McGraw-Hill, Inc., 1995. [3] Jenkins, R. X-ray Fluorescence Spectrometry, 2nded. New York, John Wiley & Sons, Inc. 1999. [4] United States Environmental Protection Agency. Mercury Report to Congress Vol. VIII. (EPA-452/R97-010). December 1997. [5] Injuk, J.; Van Grieken, R.E. In Handbook of X-ray Spectrometry. Van Grieken, R.E.; Markowicz, A.A. (eds). New York, Marcel Dekker, Inc., 1993; 657-692. [6] Connolly, D.; Walker, C. Ultrapure Water, 1998, 15, 53-58. [7] Russ, J.C. Fundamentals of Energy Dispersive X-ray Analysis. London, Butterworths and Co Ltd., 1984. [8] Nguyen, T.H.; Boman, J.; Leermakers, M.; Baeyens, W. X-ray Spectrom. 1998, 27, 277-282. [9] Bhat, C.K.; Bhat, C.L.; Lodha, G.S.; Koul, D.K. Environ. Monit. Assess. 1996, 41, 77-86. [10] Grupp, D.J.; Everitt, D.A.; Bath, R.J.; Spear, R. Am. Environ. Lab., 1989, 1, 32-40. [11] Rhodes, J.R.; Pradzynski, A.H.; Sieberg, R.D. ISA Trans., 1972, 11, 337-345. [12] Knoll,G.F. Radiation Detection and Measurement, 3rded. USA, John Wiley & Sons, Inc. 2000. [13] Harada, M.; Sakurai, K. Spectrochim. Acta B. 1999, 54, 29-39. [14] Firestone, R. E.; Shirley, V. S. (eds.). Table of Isotopes, 8th ed. USA, John Wiley & Sons, Inc. 1996. [15] Suwanathada, P.; DeVol, T.A. Proceed. Inter. Conf. Nuclear and Hazardous Waste. Spectrum 2000. 24-28 September 2000. Chattanooga, TN, USA. (in preparation for publication). [16] Van Espen, P.J.M.; Janssens, K.H.A. In . In Handbook of X-ray Spectrometry. Van Grieken, R.E.; Markowicz, A.A. (eds). New York, Marcel Dekker, Inc., 1993; 181-293. [17] Seymour, R.S.; Cox, J.E. Radioact. Radiochem. 1991, 1, 10-28. [18] Snipes, M.B.; Lengemann, F.W. Int. J. Appl. Rad. Isot. 1971, 22, 513-520. [19] Ott, R.L.; LongNecker, M. An Introduction to Statistical Methods and Data Analysis. 5th ed. USA: Wadsworth Group. 2001 [20] Currie, L.A. Anal.Chem. 1968, 40, 586-593.
Copyright (c)JCPDS-International Centre for Diffraction Data 2002, Advances in X-ray Analysis, Volume 45. 510 ISSN 1097-0002