Embed Size (px)
Citation preview

Quality by Design
Questions to Consider• How can we maximize the benefits to
the industry and other stakeholders?• How can we ensure that this will
speed up development and reduce the investment for process and product development?
• QbD may be implemented in parts or as part of a development philosophy. How can this be implemented during early development?
• What is the best way to ensure that smaller enterprises can benefit from the work going on with QbD and facilitate innovation?
Slide 1
AggredatesFucosylation
GalactosylationCEX AV
HCPDNA
N-1 Bioreactor
FeedGlucose Feed
Production Bioreactor
Harvest
Medium
Procedures
Temperature
pH
Seed
In Vitro Cell Age
Seed Density
Viability
Operations
Time of Feeding
Volume of Feed
Preparation
Concentration
pH
Age
DO
pH
Temperature
CO2
AgitationShear/Mixing
Gas Transfer
Airflow
Antifoam
Scale Effects
Amount Delivered
Number of Feeds
TimingPreparation [Glucose]
Osmolality
Concentration
ProceduresAge
Duration
Working Volume
[NaHCO3]
Pre-filtration hold time
Storage Temperature
[Antifoam]
Procedures
Age
Storage Temperature
Pre-filtration hold time
Filtration
Filtration
# of Impellers
Vessel Design
Baffles
Control Parameters
Operations
Impeller Design
Sparger Design
Nominal Volumne
Horiz Vert
Temperature
DO
Dissolved CO2
Split Ratio
Basal Strength (Dilution)
Feed Strength (Dilution)
Feed Neutralization
Osmo
Duration
Factor
35
50
70
3.7
100
100
90
440
17.5
Current X
Productivity
aFucosylation
Galactosylation
Response
3
11
25
Contour
8.644125
6.1354189
32.452376
Current Y
3
3
25
Lo Limit
.
11
55
Hi Limit
40
60
80
100
Dis
so
lved
CO
2
Galactosylation
400 420 440 460 480
Osmo
Contour Profiler
Horiz Vert
Temperature
DO
Dissolved CO2
Split Ratio
Basal Strength (Dilution)
Feed Strength (Dilution)
Feed Neutralization
Osmo
Duration
Factor
37
50
70
3.7
100
100
90
440
17.5
Current X
Productivity
aFucosylation
Galactosylation
Response
3
11
25
Contour
8.951625
7.5034189
32.837639
Current Y
3
3
25
Lo Limit
.
11
55
Hi Limit
40
60
80
100
Dis
so
lve
d C
O2
Galactosylation
400 420 440 460 480
Osmo
Contour Profiler
Horiz Vert
Temperature
DO
Dissolved CO2
Split Ratio
Basal Strength (Dilution)
Feed Strength (Dilution)
Feed Neutralization
Osmo
Duration
Factor
37
50
70
4.9
100
100
90
440
17.5
Current X
Productivity
aFucosylation
Galactosylation
Response
3
11
25
Contour
5.974125
9.5011447
30.980559
Current Y
3
3
25
Lo Limit
.
11
55
Hi Limit
40
60
80
100
Dis
solv
ed C
O2
Productivity
aFucosylation
Galactosylation
400 420 440 460 480
Osmo
Contour Profiler
Horiz Vert
Temperature
DO
Dissolved CO2
Split Ratio
Basal Strength (Dilution)
Feed Strength (Dilution)
Feed Neutralization
Osmo
Duration
Factor
35
50
70
4.9
100
100
90
440
17.5
Current X
Productivity
aFucosylation
Galactosylation
Response
3
11
25
Contour
6.896625
6.1244052
30.595296
Current Y
3
3
25
Lo Limit
.
11
55
Hi Limit
40
60
80
100
Dis
so
lved
CO
2
Galactosylation
400 420 440 460 480
Osmo
Contour Profiler

A-Mab: a Case Study in Bioprocess Development
CMC Biotech Working Group

Background and Goal• To create a publicly available case study that helps translate the
‘what’ of ICH guidelines into practical ‘how’ for a biological molecule with emphasis on Quality by Design
• Started in August 2008• 7 companies divided across the various sections into teams
– GlaxoSmithKline, Abbott, Lilly, Pfizer, Genentech, MedImmune, Amgen– John Berridge, Sam Venugopal, and Ken Seamon, co-facilitators
• Combination of regular telecon and in- person meetings • Relentless focus on science and risk-based approaches, not
traditional ways• Colleagues from regulatory authorities provided unique insights
to help stimulate our case study
Slide 3

Creating a Biotech Case Study:“A-Mab”
• Based on a monoclonal antibody drug substance and drug product– “A-Mab”– Humanized IgG1
– IV Administered Drug (liquid)– Expressed in Cho Cells– Treatment of NHL
• Publicly and freely available as a teaching tool for industry and agencies
Why Monoclonal Antibody? Represents a significant number
of products in development Good product and process
experience in development and manufacture
Slide 4

Outline and Intent of Case Study
Content• Structure• Introduction• Quality Attributes• Upstream• Downstream• Drug Product• Control Strategy• Regulatory
Intent• Contains pieces/ sections that
appear realistic and represent selected QbD principles
• Illustrates the benefits of a QbD development approach
• Information represents real data or appropriate fictitious data
• Not a mock CTD-Q• Not a Gold Standard
Slide 5

A-Mab is a Public Document• Publication and Sponsorship
– CASSS http://www.casss.org– ISPE http://www.ispe.org
• Maintain CMC Working Group interactions• Coordinate workshops• Develop training• Facilitate regulatory interactions
Slide 6

Background and Linkage to ICH
CMC Biotech Working Group

Quality Risk
Management
Q9
Product and Process
Understanding
Q8 (R1)Q9, Q10 Q11
Pharmaceutical Quality System
Q10
21st Century Quality Paradigm
Lower Risk OperationsInnovation and Continual Improvement
Optimized Change Management ProcessEnhanced Regulatory Approaches
The New Qs underwrite the Quality Paradigm
Slide 8

Historical PerspectiveHistorical Perspective• Companies have always used science and risk based processes to
develop new products and gain process understanding– But they often did not submit knowledge or information to regulators
• Focus on minimum controversy registration, launch and then compliance– Processes became fixed
Future Goal• Knowledge management and risk management processes more
extensively used, documented and submitted– Intention of clearer communication of product and process understanding
• Opportunities for flexibility and post-approval process optimisation– A challenge to do this well– Leads to opportunities
Slide 9

To illustrate options to achieve enhanced product and process understanding
Demonstrate Industry’s vision for QbD as applied to biotech product realisation
Overall Goals of the A-mAb Case Study
• Identification of CQAs– Examples of CQA risk ranking tools
• Use of prior knowledge and platform technologies• Risk based approaches• Use of DoEs and statistical approaches
– To identify CPPs and their linkage to CQAs• Approaches to define and describe Design Spaces• Upstream , Downstream and Drug Product • Rational approach to defining a Control Strategy that reflects product & process
understanding and risk • Risk-based, lifecycle approach to managing continual improvement
Slide 10
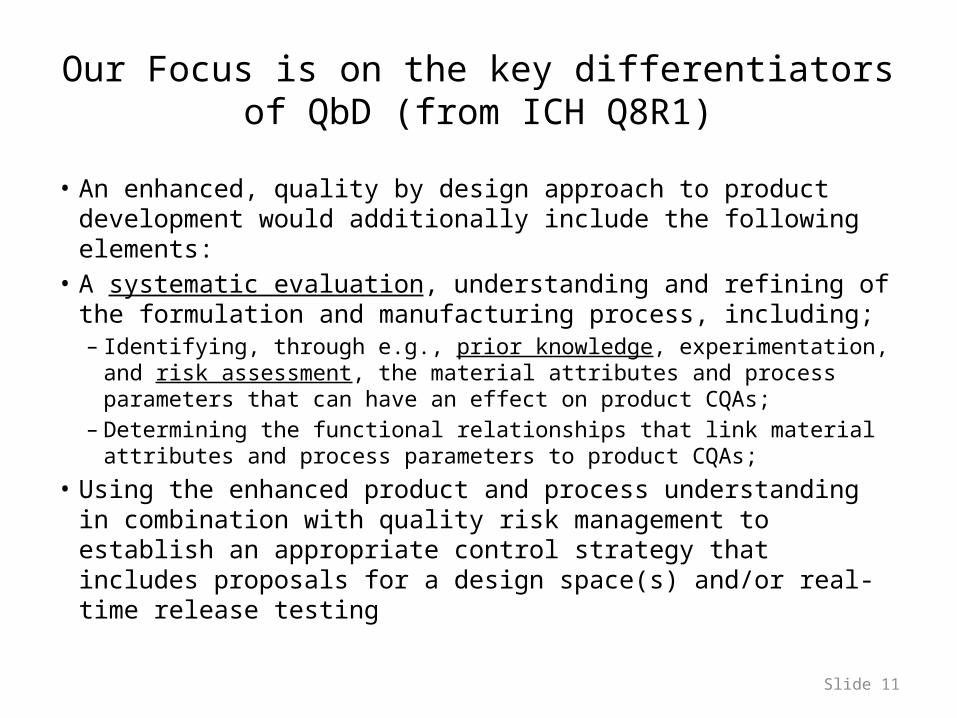
Our Focus is on the key differentiators of QbD (from ICH Q8R1)
• An enhanced, quality by design approach to product development would additionally include the following elements:
• A systematic evaluation, understanding and refining of the formulation and manufacturing process, including; – Identifying, through e.g., prior knowledge, experimentation, and risk
assessment, the material attributes and process parameters that can have an effect on product CQAs;
– Determining the functional relationships that link material attributes and process parameters to product CQAs;
• Using the enhanced product and process understanding in combination with quality risk management to establish an appropriate control strategy that includes proposals for a design space(s) and/or real-time release testing
Slide 11

Linking Product and Process Understanding
Product QualityAttributes
CriticalityAssessment
1.Quality attributes to beconsidered and/or controlled
by manufacturing process
2. Acceptable ranges forquality attributes to ensure
drug safety and efficacy
Attributes that do not need tobe considered or controlledby manufacturing process
Safety andEfficacy Data
Process Targetsfor QualityAttributes
ProcessDevelopment andCharacterization
Con
tinuo
us P
roce
ss V
erifi
catio
nProcedural Controls
Characterization &Comparability Testing
Process ParameterControls
Specifications
Input Material Controls
In-Process Testing
Process Monitoring
Con
trol
Str
ateg
y E
lem
ents
High CriticalityAttributes
Low CriticalityAttributes
Product Understanding Process Understanding
ClinicalStudies
AnimalStudies
In-VitroStudies
PriorKnowledge
DesignSpace
Process Controls
Testing
Slide 12

“Systematic Evaluation”1. Use of prior platform knowledge
and process risk assessments to identify CQAs and those steps that need additional experimentation.
2. Demonstration that laboratory scale models are representative of the full-scale operations.
3. DOE to determine CPPs & KPPs4. Linkage of process parameters to
product Quality Attributes to create a Design Spaces.
5. Final risk assessment and categorization of process parameters to develop control strategy.
AggredatesFucosylation
GalactosylationCEX AV
HCPDNA
N-1 Bioreactor
FeedGlucose Feed
Production Bioreactor
Harvest
Medium
Procedures
Temperature
pH
Seed
In Vitro Cell Age
Seed Density
Viability
Operations
Time of Feeding
Volume of Feed
Preparation
Concentration
pH
Age
DO
pH
Temperature
CO2
AgitationShear/Mixing
Gas Transfer
Airflow
Antifoam
Scale Effects
Amount Delivered
Number of Feeds
TimingPreparation [Glucose]
Osmolality
Concentration
ProceduresAge
Duration
Working Volume
[NaHCO3]
Pre-filtration hold time
Storage Temperature
[Antifoam]
Procedures
Age
Storage Temperature
Pre-filtration hold time
Filtration
Filtration
# of Impellers
Vessel Design
Baffles
Control Parameters
Operations
Impeller Design
Sparger Design
Nominal Volumne
Tox500L
PhI/PhII1,000L
Optimization DOE I - 2L
Optimization DOE II - 2L
PhIII5,000L
PlatformKnowledge
25
30
35
40
Gal
acto
syla
tion
32.0
2279
±0.9
3055
5
35
35.5 36
36.5 37
36
Temperature
30 40 50 60 70
50
DO
40 50 60 70 80 90 100
70
Dissolved
CO2
3.8 4
4.2
4.4
4.6
4.8
4.3
Split Ratio
90 95 100
105
110
100
Basal Strength
(Dilution)
400
420
440
460
480
440
Osmo
90 95 100
105
110
100
Feed Strength
(Dilution)
86 88 90 92 94
90
Feed
Neutralization
16.8
17.2
17.6 18
17.3778
Duration
Prediction Profiler
Horiz Vert
Temperature
DO
Dissolved CO2
Split Ratio
Basal Strength (Dilution)
Feed Strength (Dilution)
Feed Neutralization
Osmo
Duration
Factor
35
50
70
3.7
100
100
90
440
17.5
Current X
Productivity
aFucosylation
Galactosylation
Response
3
11
25
Contour
8.644125
6.1354189
32.452376
Current Y
3
3
25
Lo Limit
.
11
55
Hi Limit
40
60
80
100
Dis
so
lve
d C
O2
Galactosylation
400 420 440 460 480
Osmo
Contour Profiler
Horiz Vert
Temperature
DO
Dissolved CO2
Split Ratio
Basal Strength (Dilution)
Feed Strength (Dilution)
Feed Neutralization
Osmo
Duration
Factor
37
50
70
3.7
100
100
90
440
17.5
Current X
Productivity
aFucosylation
Galactosylation
Response
3
11
25
Contour
8.951625
7.5034189
32.837639
Current Y
3
3
25
Lo Limit
.
11
55
Hi Limit
40
60
80
100
Dis
so
lve
d C
O2
Galactosylation
400 420 440 460 480
Osmo
Contour Profiler
Horiz Vert
Temperature
DO
Dissolved CO2
Split Ratio
Basal Strength (Dilution)
Feed Strength (Dilution)
Feed Neutralization
Osmo
Duration
Factor
37
50
70
4.9
100
100
90
440
17.5
Current X
Productivity
aFucosylation
Galactosylation
Response
3
11
25
Contour
5.974125
9.5011447
30.980559
Current Y
3
3
25
Lo Limit
.
11
55
Hi Limit
40
60
80
100
Dis
solv
ed C
O2
Productivity
aFucosylation
Galactosylation
400 420 440 460 480
Osmo
Contour Profiler
Horiz Vert
Temperature
DO
Dissolved CO2
Split Ratio
Basal Strength (Dilution)
Feed Strength (Dilution)
Feed Neutralization
Osmo
Duration
Factor
35
50
70
4.9
100
100
90
440
17.5
Current X
Productivity
aFucosylation
Galactosylation
Response
3
11
25
Contour
6.896625
6.1244052
30.595296
Current Y
3
3
25
Lo Limit
.
11
55
Hi Limit
40
60
80
100
Dis
so
lved
CO
2
Galactosylation
400 420 440 460 480
Osmo
Contour Profiler
Slide 13
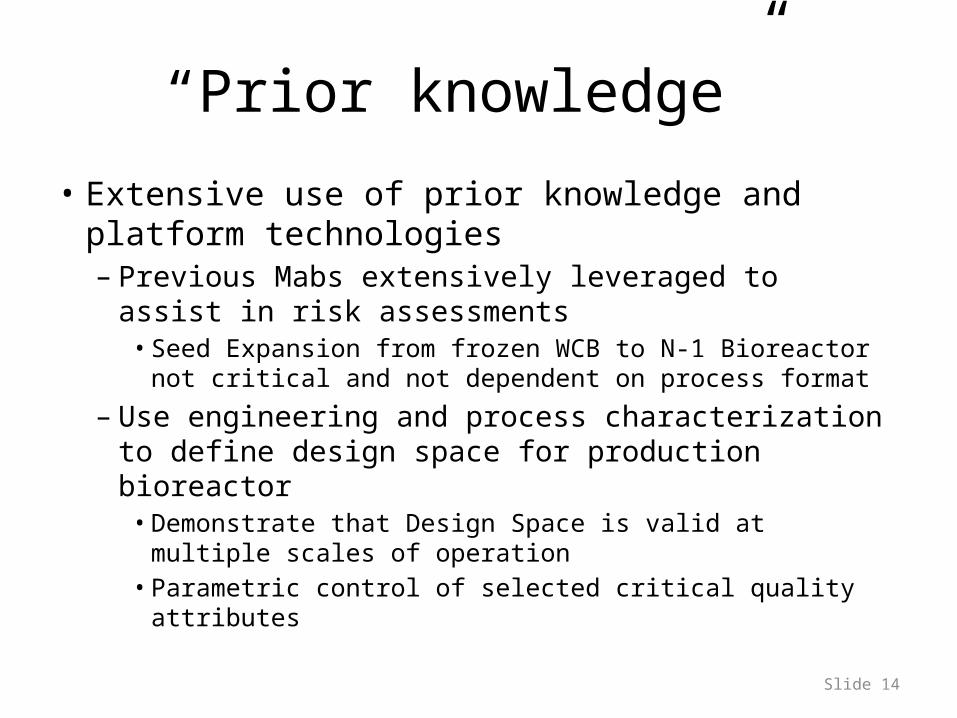
“Prior knowledge”
• Extensive use of prior knowledge and platform technologies – Previous Mabs extensively leveraged to assist in risk
assessments• Seed Expansion from frozen WCB to N-1 Bioreactor not
critical and not dependent on process format
– Use engineering and process characterization to define design space for production bioreactor
• Demonstrate that Design Space is valid at multiple scales of operation
• Parametric control of selected critical quality attributes
Slide 14

Critical Quality Attributes (CQAs)
• One of the greatest challenges is identifying CQAs• In the case study, we focus on severity, not process capability
– Risk assessment is based on:• prior knowledge (encompasses laboratory to clinic)• nonclinical studies and biological characterization throughout clinical
development • clinical experience
– Key Decisions: • Assign a Criticality Level (continuum) instead of critical/non-critical• Criticality based on potential impact to safety and efficacy
– Key Issues that were discussed:• Is there a cutoff for critical?• What would make critical into non-critical?• Linkage of QA ranking to Control Strategy
Slide 15

Prior Knowledge
Process Understanding
Product Understanding
ProcessDevelopment
RiskAssessment
ProcessCharacterization
RiskAssessment
RiskAssessment
ProcessPerformanceVerification
RiskAssessment
Life CycleManagement
Final ControlStrategy
ProcessParameters
QualityAttributes
Design Space
Draft ControlStrategy
Process 2
Process 1 2
Risk Assessment Approach used through A-MAb development lifecycle
Slide 16

CQA Risk Ranking & Filtering Approach
• Severity = risk that attribute impacts safety or efficacy• Assess relative safety and efficacy risks using two factors:
– Impact and Uncertainty
• Impact = impact on safety or efficacy, i.e. consequences– Determined by available knowledge for attribute in question– More severe impact = higher score
• Uncertainty = uncertainty that attribute has expected impact– Determined by relevance of knowledge for each attribute– High uncertainty = high score– Low uncertainty = low score
Severity = Impact x Uncertainty
Slide 17
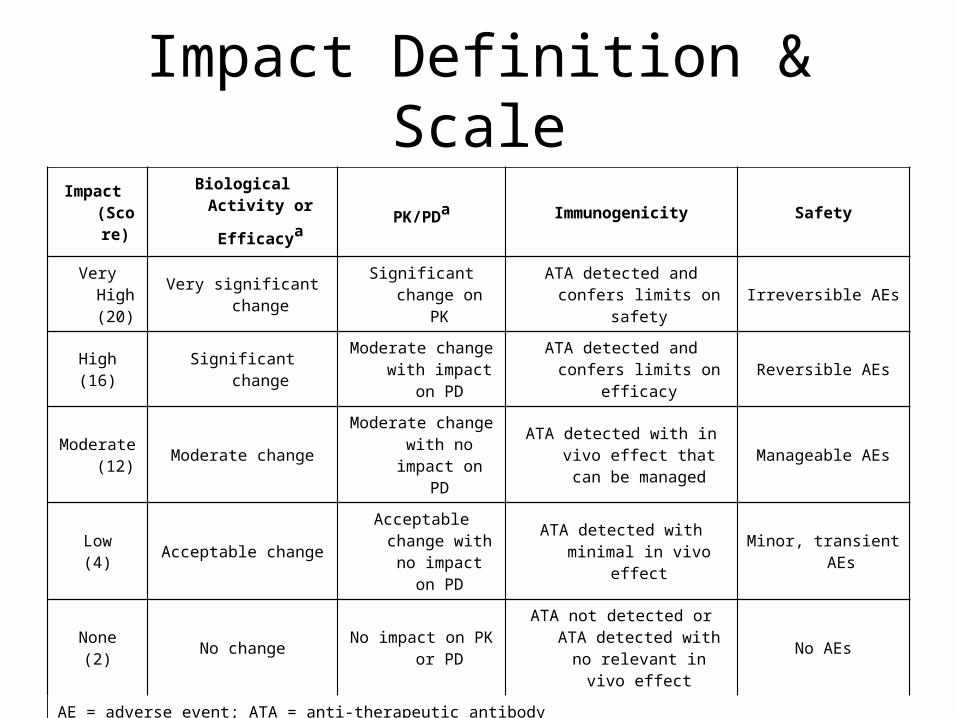
Impact Definition & ScaleImpact
(Score)
Biological Activity or
Efficacya PK/PDa Immunogenicity Safety
Very High (20)
Very significant changeSignificant change
on PKATA detected and confers
limits on safetyIrreversible AEs
High(16)
Significant changeModerate change
with impact on PD
ATA detected and confers limits on efficacy
Reversible AEs
Moderate (12)
Moderate changeModerate change
with no impact on PD
ATA detected with in vivo effect that can be
managedManageable AEs
Low(4)
Acceptable changeAcceptable change
with no impact on PD
ATA detected with minimal in vivo effect
Minor, transient AEs
None(2)
No changeNo impact on PK or
PD
ATA not detected or ATA detected with no
relevant in vivo effectNo AEs
AE = adverse event; ATA = anti-therapeutic antibodyaQuantitative criteria should be established for biological activity/efficacy and PK/PD. Significance of the change is
assessed relative to assay variability.

Uncertainty Definition & Scale
Uncertainty (Score)
Description(Variants and Host Related Impurities)
Description(Process Raw
Material)a
7(Very High)
No information (new variant)No information (new
impurity)
5(High)
Published external literature for variant in related molecule.
---
3(Moderate)
Nonclinical or in vitro data with this molecule. Data (nonclinical, in vitro or clinical) from a similar class
of molecule.
Component used in previous processes
2(Low)
Variant has been present in material used in clinical trials.
---
1(Very Low)
Impact of specific variant established in Clinical Studies with this molecule.
GRAS or studied in clinical trials
GRAS = generally regarded as safe a Assesses the impact of a raw material as an impurity. Impact of the raw material on the product
during manufacturing is assessed during process development.
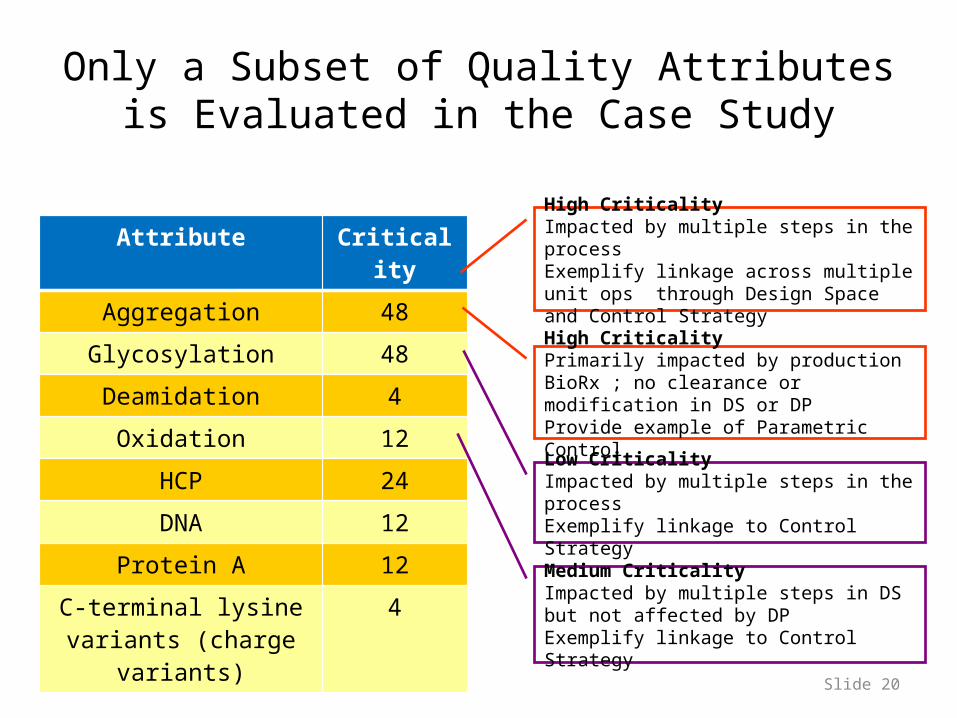
Attribute Criticality
Aggregation 48
Glycosylation 48
Deamidation 4
Oxidation 12
HCP 24
DNA 12
Protein A 12
C-terminal lysine variants (charge
variants)
4
High CriticalityImpacted by multiple steps in the process Exemplify linkage across multiple unit ops through Design Space and Control Strategy
High CriticalityPrimarily impacted by production BioRx ; no clearance or modification in DS or DPProvide example of Parametric Control
Low Criticality Impacted by multiple steps in the process Exemplify linkage to Control Strategy
Medium CriticalityImpacted by multiple steps in DS but not affected by DPExemplify linkage to Control Strategy
Only a Subset of Quality Attributes is Evaluated in the Case Study
Slide 20

A-Mab Case StudyUpstream Process Development
CMC Biotech Working Group

Seed Culture Expansionin disposable shake flasks and/
or bags
Seed Culture Expansion in fixedstirred tank reactors
N-1 Seed Culture Bioreactor3,000L WV
Production Bioreactor15,000L WV
Harvest Centrifugation & Depth Filtration
Nutrient Feed
Seed Maintenance
ThawWorking Cell Bank
Clarified Bulk
Seed Maintenance
Glucose Feeds
STEP 1
STEP 2
STEP 3
STEP 4
Leverage Prior Knowledge with platform process
Engineering and process characterization to define Design Space and Control
Strategy
Risk-based approach to demonstrate no impact to
product quality
Demonstrate that Design Space is applicable to
multiple scales of operation
Lifecycle validation approach that includes continued process verification
Upstream Process
Slide 22

A-Mab Batch History
Process Scale Batches DispositionClinical
Exposure
Process 1 500 L 2 Pre-clinical studies
Process 1 1,000 L 3Phase 1 & 2Product/process understanding.
Process 2 5,000 L 5Phase 3Confirm end-to-end process performance.
Process 2 15,000 L 2
Commercial launch supplies Confirm Design Space and Control Strategy at commercial scale
Slide 23

Upstream Process Steps 1 & 2: Seed expansionNon-Critical based on Risk Assessment
1. No product is accumulated during seed expansion steps. 2. Prior knowledge with platform process (X-Mab, Y-Mab, and Z-Mab) shows
that process performance is consistent and robust 3. Prior knowledge also demonstrates that process is flexible: successful use of
multiple formats and scales (shake flasks, cell bags, spinners, bioreactors)4. Risk Assessments of seed steps up to N-2 stage shows no impact on product
quality
Seed expansion process is not part of the Design Space and is not included in the registered detail
Seed Culture Steps Product Accumulation Risk of Impact to Product Quality
Seed Expansion in Spinner or Shake Flasks Negligible Very Low
Seed Expansion in Wave Bag Bioreactor Negligible Very Low
Seed Expansion in Fixed Bioreactor Negligible Very Low
Slide 24

N-1 Seed Impacts Process Performance but NOT Product Quality
P-Values
Process Parameters N-1 Seed Bioreactor Performance Parameters
Production Bioreactor
Performance
Production Bioreacotr Product Quality
Variables Peak VCC
% Viab Culture
Duration Titer aFucos. Galact. HCP Aggreg.
pH 0.03 0.24 0.04 0.001 0.27 0.53 0.63 0.64
Dissolved oxygen
0.31 0.25 0.19 0.35 0.77 0.73 0.31 0.49
Temperature 0.02 0.05 0.03 0.005 0.43 0.22 0.23 0.60
pH × Dissolved Oxygen
0.04 0.78 0.65 0.37 0.17 0.78 0.59 0.85
pH × Temperature 0.32 0.26 0.32 0.02 0.98 0.36 0.80 0.36
Dissolved Oxygen × Temperature
0.42 0.86 0.74 0.37 0.80 0.38 0.61 0.26
Seed expansion process is not part of the Design Space and is not included in the registered detail
Slide 25

Upstream Process: Production Bioreactor Approach to Define a Design Space
Leverage Prior Knowledge and A-Mab Development Experience
Tox500L
Ph 1/Ph 21,000L
ProcessDevelopment (2L)
Ph 35,000L
PlatformKnowledge
Tox500L
Ph 1/Ph 21,000L
ProcessDevelopment (2L)
Ph 35,000L
PlatformKnowledge
Tox500L
Ph 1/Ph 21,000L
ProcessDevelopment (2L)
Ph 35,000L
PlatformKnowledge
Tox500L
Ph 1/Ph 21,000L
ProcessDevelopment (2L)
Ph 35,000L
PlatformKnowledge
Process 1 Process 1
Process 2
Data from other MAbs A-Mab Data
Slide 26
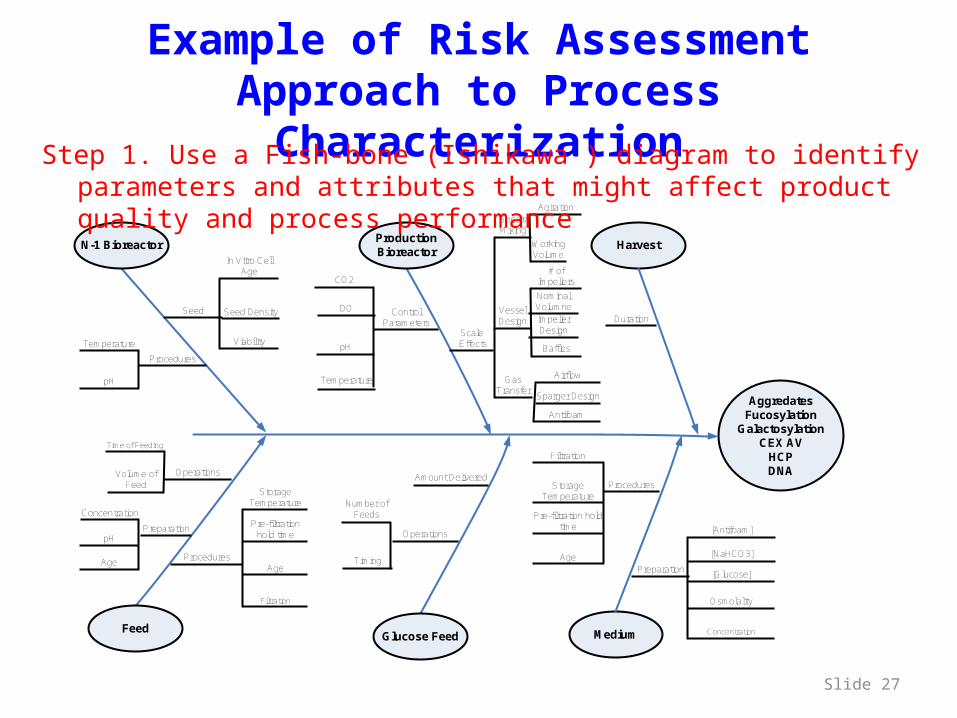
Example of Risk Assessment Approach to Process Characterization
AggredatesFucosylation
GalactosylationCEX AV
HCPDNA
N-1 Bioreactor
FeedGlucose Feed
Production Bioreactor
Harvest
Medium
Procedures
Temperature
pH
Seed
In Vitro Cell Age
Seed Density
Viability
Operations
Time of Feeding
Volume of Feed
Preparation
Concentration
pH
Age
DO
pH
Temperature
CO2
AgitationShear/Mixing
Gas Transfer
Airflow
Antifoam
Scale Effects
Amount Delivered
Number of Feeds
TimingPreparation [Glucose]
Osmolality
Concentration
ProceduresAge
Duration
Working Volume
[NaHCO3]
Pre-filtration hold time
Storage Temperature
[Antifoam]
Procedures
Age
Storage Temperature
Pre-filtration hold time
Filtration
Filtration
# of Impellers
Vessel Design
Baffles
Control Parameters
Operations
Impeller Design
Sparger Design
Nominal Volumne
Step 1. Use a Fish-bone (Ishikawa ) diagram to identify parameters and attributes that might affect product quality and process performance
Slide 27
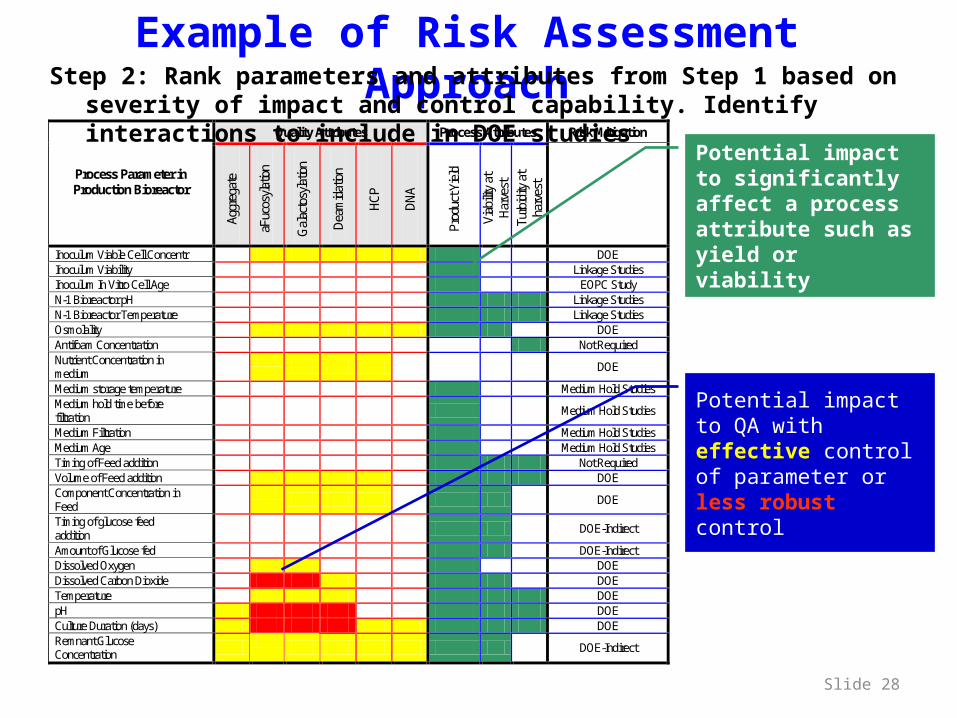
Example of Risk Assessment Approach
Quality Attributes Process Attributes Risk Mitigation
Process Parameter in Production Bioreactor
Aggr
egat
e
aFuc
osyla
tion
Gal
acto
syla
tion
Deam
idat
ion
HCP
DNA
Prod
uct Y
ield
Viab
ility
at
Harv
est
Turb
idity
at
harv
est
Inoculum Viable Cell Concentr DOE Inoculum Viability Linkage Studies Inoculum In Vitro Cell Age EOPC Study N-1 Bioreactor pH Linkage Studies N-1 Bioreactor Temperature Linkage Studies Osmolality DOE Antifoam Concentration Not Required Nutrient Concentration in medium DOE
Medium storage temperature Medium Hold Studies Medium hold time before filtration Medium Hold Studies
Medium Filtration Medium Hold Studies Medium Age Medium Hold Studies Timing of Feed addition Not Required Volume of Feed addition DOE Component Concentration in Feed DOE
Timing of glucose feed addition DOE-Indirect
Amount of Glucose fed DOE-Indirect Dissolved Oxygen DOE Dissolved Carbon Dioxide DOE Temperature DOE pH DOE Culture Duration (days) DOE Remnant Glucose Concentration DOE-Indirect
Potential impact to significantly affect a process attribute such as yield or viability
Potential impact to QA with effective control of parameter or less robust control
Step 2: Rank parameters and attributes from Step 1 based on severity of impact and control capability. Identify interactions to include in DOE studies
Slide 28

DOE Studies to Define Design Space: Identify CPPs and Interactions
Example of DOE Results
3
4
5
Tite
r (g
/L)
3.74
3131
±0.0
7605
2
4
6
8
aFuc
osyl
atio
n
6.43
9933
±0.2
2694
8
24
28
32
Gal
acto
syla
tion
(%)
29.2
8939
±0.6
7458
2
4e+5
6e+5
8e+5
1e+6
HC
P (
ppm
)
6955
38
±165
18.3
1500
2000
2500
DN
A (
ppm
)
1935
.343
±89.
5590
8
24
28
32
CE
X %
Aci
dic
Var
iant
s
27.6
6898
±0.4
8081
4
1.8
2.2
2.6
3.0
Agg
rega
tes
(%)
2.51
5119
±0.0
3524
34
34.5 35
35.5 36
35
Temperature
(C)
30 40 50 60 70
50
DO (%)
40 60 80 100
120
140
160
100
CO2 (%)
6.6
6.7
6.8
6.9 7
7.1
6.85
pH
.8 1
1.2
1.4
1.6
1.2
[Medium]
(X)
360
380
400
420
440
400
Osmo (mOsm)
9 10 11 12 13 14 15
12
Feed (X)
.7 .8 .9 11.
11.
21.
3
1
IVCC (e6
cells/mL)
15 16 17 18 19
17
Duration
(d)
-0.1 .1 .3 .5 .7 .9 1.1
0.21
Curvature
Prediction Profiler
29

Classification of Process Parameters based on Risk Assessment
ProcessParameter
RiskAssessment
Does variability inparameter significantly
impact CQAsRisk
AssessmentSeverity of Impact,
ability to controlwithin Design
Space
Critical ProcessParameter
(CPP)
Well Controlled CriticalProcess Parameter
(WC-CPP)
RiskAssessment
Does variability inparameter impact process
performance orconsistency?
Key ProcessParameter
(KPP)
General ProcessParameter
(GPP)
Yes No
Yes
NoHighRisk
LowRisk
RiskAssessment
Severity of Impact,ability to control within
acceptableranges
HighRisk
LowRisk
Within Design SpaceRegulatory-Sensitive
Not in Design SpaceManaged through QMS
Slide 30

Control Strategy for Upstream Production
Step 2Seed Culture Expansion
in Fixed Stirred TankBioreactors
Step 3Production Culture
Step 4Centrifugation and Depth
Filtration
Working Cell Bank
Clarified Bulk
Step 1Seed Culture Expansion
in Disposable ShakeFlasks and/or bags
In-ProcessQuality Attributes
BioburdenMMVMycoplamaAdventitious Virus
Product YieldTurbidity
Viable Cell ConcentrationViability
Product YieldViability at HarvestTurbity at Harvest
Viable Cell ConcentrationViability
Key ProcessAttributes
Viable Cell ConcentrationViability
Quality-linkedProcess Parameters
(WC-CPPs)
TemperaturepH
Dissolved CO2Culture Duration
OsmolalityRemnant Glucose
TemperaturepH
Dissolved OxygenCulture Duration
Initial VCC/Split Ratio
Antifoam ConcentrationTime of Nutrient Feed
Volume of Nutrient FeedTime of Glucose Feed
Volume of Glucose FeedDissolved Oxygen
Flow RatePressure
TemperatureCulture Duration
Initial VCC/Split Ratio
Key ProcessParameters
(KPPs)
TemperatureTime
Controlled within theDesign Space to
ensure consistentproduct quality and
process performance
Controlled within acceptablelimits to ensure consistent
process performance
Assay results partof batch releasespecifications
Slide 31

Define Engineering Design Space for Production Bioreactor
Analogous to the design space defined by scale-independent parameters, the engineering design space is a multidimensional combination of bioreactor design characteristics and engineering parameters that provide assurance that the production bioreactor performance will be robust and consistent and will meet product quality targets
Slide 32

Engineering Design SpaceRan
dal Al
le n
Design Space for scale-independent parameters was developed using qualified scale-down models
Engineering Design Space includes bioreactors of multiple scales and designs (2L -25K L)
Based on keeping microenvironment experienced by cells equivalent between scales
Characterization of bioreactor design, operation parameters, control capabilities, product quality and cell culture process performance provide basis for scientific understanding of the impact of scale/design
Includes bioreactor design considerations and scale-dependent process parameters
linked to fluid dynamics and mass transfer
2L Scale
Design Space applicability to multiple operation scales demonstrated using PCA/MVA models
500 L – 25,000 L
Slide 33

Lifecycle Approach to Validation
1. Multivariate model based on process characterization (e.g. DOE) - Model 1A comprehensive Design Space based on 2-L characterization studies as well as 500-
L, and 5000L experience for A-Mab. Includes scale-independent operational parameters: iVCC, temp, pH, pCO2 etc
2. Design Space for Scale-up, based on BioRx engineering parameters- Model 2Based on engineering characterization and DOE studies. Establish 2L as a reliable model system by: a) Establishing hydrodynamic similarity and ensuring appropriate
equipment design and operation; b) Establishing scalability through demonstration of overlapping performance of either scale in a MVA model that includes process inputs,
outputs and product quality – for previous aMAb product (Model 3)
3. Demonstration of scalability and Design Space for A-Mab by execution of 2 batches at the intended commercial scale (15K)
4. Use process monitoring during routine manufacturing for continuous verification that process is in state of control
Build MVA model for A-Mab; define acceptance criteria
1. Multivariate model based on process characterization (e.g. DOE) - Model 1A comprehensive Design Space based on 2-L characterization studies as well as 500-
L, and 5000L experience for A-Mab. Includes scale-independent operational parameters: iVCC, temp, pH, pCO2 etc
2. Design Space for Scale-up, based on BioRx engineering parameters- Model 2Based on engineering characterization and DOE studies. Establish 2L as a reliable model system by: a) Establishing hydrodynamic similarity and ensuring appropriate
equipment design and operation; b) Establishing scalability through demonstration of overlapping performance of either scale in a MVA model that includes process inputs,
outputs and product quality – for previous aMAb product (Model 3)
3. Demonstration of scalability and Design Space for A-Mab by execution of 2 batches at the intended commercial scale (15K)
4. Use process monitoring during routine manufacturing for continuous verification that process is in state of control
Build MVA model for A-Mab; define acceptance criteria Slide 34

Case StudyDownstream Process and Drug Product
CMC Biotech Working Group

Leverages Prior Knowledge with platform process to
define Design Space
Leverages prior knowledge and A-Mab results to justify a
modular approach to viral clearance
Downstream Process
Protein A Affinity Chromatography
Clarified Bulk
Final Filtration, Fill and Freeze
Formulation: Ultrafiltration and
Diafiltraion
Small Virus Retentive Filtration
Anion Exchange Chromatography
Cation Exchange Chromatography
Low pH Incubation
A-mAb
Step 5
Step 11
Step 8
Step 6
Step 7
Step 10
Step 9
Design Space based on worst case scenario for A-Mab stability and worst case for viral inactivation
Slide 37
Justification of two process changes post-launch : 1. Change resin for Protein
A 2. Change from resin to membrane format for AEX
Design Space based on multivariate model that links all three purifications steps (Protein A, AEX and CEX)

Multi-step Design Space for Chromatography Columns
• Design Space is defined based on model that links performance of the 3 purification steps– HCP clearance example
• Model based on results of individual DOE studies• No extrapolation of parameters outside ranges tested allowed
in design space• No interaction of parameters from different steps assumed.
– Assumption was experimentally verified.• 99.5% prediction interval added to mean predicted HCP levels
– To reflect high level of assurance specifications will be met if process operated in design space.
Slide 38

Acceptable range for each step depends on acceptable ranges for other two steps
Case 1: If full range allowed in Protein A and CEX, AEX is constrained
Protein A
3.23.33.43.53.63.73.83.9
10 20 30 40 50
Protein Load
Elu
tion
pH
CEX
3
4
5
6
7
10 15 20 25 30
Protein Load
Wa
sh C
on
du
ctiv
ity
AEX
1.6
2.6
3.6
4.6
5.6
7.2 7.4 7.6 7.8
Load pH
Equil
Wash C
onductiv
ity
Protein A
3.23.33.43.53.63.73.83.9
10 20 30 40 50
Protein Load
Elu
tion
pH
CEX
3
4
5
6
7
10 15 20 25 30
Protein Load
Wa
sh C
on
du
ctiv
ity
AEX
1.6
2.6
3.6
4.6
5.6
7.2 7.4 7.6 7.8
Load pH
Equil
Wash C
onductiv
ity
Protein A
3.23.33.43.53.63.73.83.9
10 20 30 40 50
Protein Load
Elu
tion
pH
CEX
3
4
5
6
7
10 15 20 25 30
Protein Load
Wa
sh C
on
du
ctiv
ity
AEX
1.6
2.6
3.6
4.6
5.6
7.2 7.4 7.6 7.8
Load pH
Equil
Wash C
onductiv
ity
Acceptable RangeFull range on axis is range explored in DOE
Case 2: Constraining Protein A and CEX ranges allows full ranges for AEX
Case 3: If full range allowed in Protein A and AEX, CEX is constrained
Slide 39

Step 1
Step 2
Step 3
Step 4
A-Mab Drug Substance
Drug substance preparation/handling
Compounding
Sterile filtration
Filling, stoppering and Capping
Packaged A-Mab Drug Product
Design spaces
· Multiple or single lots/container
· Frozen or unfrozen· Unclassified or class
100,000
· 50-1500 L· Stir time· Hold time· Tank configuration
· 50-1500 L· Hold time· Filter configuration
· Reservoir pressure· Pumping configuration· Capper spring pressure
Risk Assessment
Design Space
Control Strategy
Drug product process steps exemplifying QbD supported by optimized formulation design
40

A- Mab Case StudyControl Strategy
CMC Biotech Working Group

Control Strategy: Linking Product and Process Understanding
Product QualityAttributes
CriticalityAssessment
1.Quality attributes to beconsidered and/or controlled
by manufacturing process
2. Acceptable ranges forquality attributes to ensure
drug safety and efficacy
Attributes that do not need tobe considered or controlledby manufacturing process
Safety andEfficacy Data
Process Targetsfor QualityAttributes
ProcessDevelopment andCharacterization
Con
tinuo
us P
roce
ss V
erifi
catio
nProcedural Controls
Characterization &Comparability Testing
Process ParameterControls
Specifications
Input Material Controls
In-Process Testing
Process Monitoring
Con
trol
Str
ateg
y E
lem
ents
High CriticalityAttributes
Low CriticalityAttributes
Product Understanding Process Understanding
ClinicalStudies
AnimalStudies
In-VitroStudies
PriorKnowledge
DesignSpace
Process Controls
Testing
Slide 42

Control Strategy is based on a final Risk Assessment for each CQA
Overall CQA RiskAssessment
RPN
CQA CriticalityAssessment
Severity
ProcessCapability
Occurrence
TestingStrategy
Detectability
= X X
RiskAssessment
RPN = SxOxD
Categorizationof ProcessParameters
Design Space
In-ProcessControls
Specifications
Risk Assessment
Severity of Impactx Certainty
Slide 43

Example of Control Strategy for selected CQAs
CQA Criticality Process Capability Testing Spec
LimitsOther Control
Elements
Aggregate High (48) High Risk DS and DP release Yes Parametric Control of
DS/DP steps
aFucosylation High (48) Low Risk DS Process Monitoring Yes Parametric Control of
Production BioRx
Host Cell Protein High (24) Very Low Risk Charact.
Comparability YesParametric Control of Prod BioRx, ProA, pH inact, CEX , AEX steps
DNA High (24) Very Low Risk Charact.Comparability Yes
Parametric Control of Prod Biox and AEX
Steps
Deamidated Isoforms Low (12) Low Risk Charact.
Comparability No Parametric Control of Production BioRx
From A-Mab Case Study www.casss.org

Drug Substance & Product Release Testing is Only one Element of Control Strategy
Attribute Test Acceptance Criteria Release Stability
Identity CEX Consistent with Ref Std and No New Peaks Yes No
Monomer HPSEC NLT 97% Yes Yes
Aggregates HPSEC NMT 3% Yes Yes
Endotoxin (LAL) USP <85> NMT 12.5 EU/mL Yes No
Reduced testing in comparison with traditional approaches
Example: Drug Substance Release Testing
Slide 45
A-Mab Case StudyRegulatory Considerations
CMC Biotech Working Group

Regulatory Aspects of the Case Study
• Objectives of the Regulatory section of the case study:– Describe information that is provided in the filing to convey process &
product understanding -vs- license commitments
– Describe how elements not covered by license commitments will be addressed in the Quality System
– Describe how development and monitoring of process knowledge throughout the product’s lifecycle will differ from traditional process validation activities and lead to continued improvement
– Propose a general risk-based approach for managing post-approval changes within and outside the design space and provide specific examples
Slide 47

Linking Product and Process Understanding to Regulatory Commitments & Process Lifecycle
The regulatory filing presents a summary of the risk assessment methodology and accumulated process & product knowledge
Regulatory commitments are the critical elements of the overall control strategy developed based on the outcomes of the overall risk assessments
The overall approach to risk-based process management becomes the basis for lifecycle and change management
BLA/MAA
Design space controls
In-process tests
Lot release tests
Stability commitments
Prior Knowledge
Process Understanding
Product Understanding
ProcessDevelopment
RiskAssessment
ProcessCharacterization
RiskAssessment
RiskAssessment
ProcessPerformanceVerification
RiskAssessment
Life CycleManagemen t
Final ControlStrategy
ProcessParameters
QualityAttributes
Design Space
Draft ControlStrategy
Slide 48
Justification of the Design Space• The overall knowledge that justifies the Design Space is based on
– Product and process specific knowledge– Historical and platform data
• Summary of the knowledge that justifies the outcomes of the risk assessment and the limits for design space will be presented in the Process Development History section– Conclusions will be supported by process characterization reports available upon
request or inspection
• The design space may be applied across many scales, or pieces of equipment (different bioreactors, columns of different widths), provided data sufficient justification is provided in the application
• The design space is not “validated” at manufacturing scale in the traditional sense
Slide 49
Lifecycle Approach to Process Validation
• Begins during development and continues post-launch
• Builds on knowledge from multiple scales
• Departure from the traditional 3-batch validation approach prior to submission– Process validation encompasses cumulative knowledge– Includes continued process verification
• To demonstrate validity of Design Space• To maintain validity of models
Slide 50

Lifecycle Management of Process Improvements & Changes
• Movements within the design space are managed without regulatory notification
• Changes outside the design space will involve a regulatory action– From notification to pre-approval depending on risk assessment
• Specific examples addressed in case study– Scale-up of production culture– Replace new chromatography resin with similar from same vendor– Replace new chromatography resin with new technology (membrane)– Manufacturing Site Changes for DS and DP
Slide 51

Assessing Change: Scope of Change is Initially Assessed at the Unit Operation Level
Degree to which outputs overlap denotes risk associated with change
Movement w/in approved DS
Changes outside approved DS
Outputs from previous step & other material inputs
Same Minor Change
Major change
Major change
Design Space Parameters
Same Same, Data not in original filing
New New
Step Outputs Same Same Same New
Output from previous step
DS ParametersUnchanged
DS Parameters
Changed
Output Output Output
MATERIAL INPUTS (Vendor, Scale,
Technology)
Unchanged Changed
Risk
Changes which represent more risk drive more extensive data collection
Slide 52

Quality by Design
Questions to Consider• How can we maximize the benefits to
the industry and other stakeholders?• How can we ensure that this will
speed up development and reduce the investment for process and product development?
• QbD may be implemented in parts or as part of a development philosophy. How can this be implemented during early development?
• What is the best way to ensure that smaller enterprises can benefit from the work going on with QbD and facilitate innovation?
Slide 53
AggredatesFucosylation
GalactosylationCEX AV
HCPDNA
N-1 Bioreactor
FeedGlucose Feed
Production Bioreactor
Harvest
Medium
Procedures
Temperature
pH
Seed
In Vitro Cell Age
Seed Density
Viability
Operations
Time of Feeding
Volume of Feed
Preparation
Concentration
pH
Age
DO
pH
Temperature
CO2
AgitationShear/Mixing
Gas Transfer
Airflow
Antifoam
Scale Effects
Amount Delivered
Number of Feeds
TimingPreparation [Glucose]
Osmolality
Concentration
ProceduresAge
Duration
Working Volume
[NaHCO3]
Pre-filtration hold time
Storage Temperature
[Antifoam]
Procedures
Age
Storage Temperature
Pre-filtration hold time
Filtration
Filtration
# of Impellers
Vessel Design
Baffles
Control Parameters
Operations
Impeller Design
Sparger Design
Nominal Volumne
Horiz Vert
Temperature
DO
Dissolved CO2
Split Ratio
Basal Strength (Dilution)
Feed Strength (Dilution)
Feed Neutralization
Osmo
Duration
Factor
35
50
70
3.7
100
100
90
440
17.5
Current X
Productivity
aFucosylation
Galactosylation
Response
3
11
25
Contour
8.644125
6.1354189
32.452376
Current Y
3
3
25
Lo Limit
.
11
55
Hi Limit
40
60
80
100
Dis
so
lved
CO
2
Galactosylation
400 420 440 460 480
Osmo
Contour Profiler
Horiz Vert
Temperature
DO
Dissolved CO2
Split Ratio
Basal Strength (Dilution)
Feed Strength (Dilution)
Feed Neutralization
Osmo
Duration
Factor
37
50
70
3.7
100
100
90
440
17.5
Current X
Productivity
aFucosylation
Galactosylation
Response
3
11
25
Contour
8.951625
7.5034189
32.837639
Current Y
3
3
25
Lo Limit
.
11
55
Hi Limit
40
60
80
100
Dis
so
lve
d C
O2
Galactosylation
400 420 440 460 480
Osmo
Contour Profiler
Horiz Vert
Temperature
DO
Dissolved CO2
Split Ratio
Basal Strength (Dilution)
Feed Strength (Dilution)
Feed Neutralization
Osmo
Duration
Factor
37
50
70
4.9
100
100
90
440
17.5
Current X
Productivity
aFucosylation
Galactosylation
Response
3
11
25
Contour
5.974125
9.5011447
30.980559
Current Y
3
3
25
Lo Limit
.
11
55
Hi Limit
40
60
80
100
Dis
solv
ed C
O2
Productivity
aFucosylation
Galactosylation
400 420 440 460 480
Osmo
Contour Profiler
Horiz Vert
Temperature
DO
Dissolved CO2
Split Ratio
Basal Strength (Dilution)
Feed Strength (Dilution)
Feed Neutralization
Osmo
Duration
Factor
35
50
70
4.9
100
100
90
440
17.5
Current X
Productivity
aFucosylation
Galactosylation
Response
3
11
25
Contour
6.896625
6.1244052
30.595296
Current Y
3
3
25
Lo Limit
.
11
55
Hi Limit
40
60
80
100
Dis
so
lved
CO
2
Galactosylation
400 420 440 460 480
Osmo
Contour Profiler

What are Biosimilars?
• Biosimilars – Are biological products that claim to be similar to
an innovator biological product– The innovator’s product is off-patent and no
regulatory data protection remains– Are manufactured by a second manufacturer with
new cell line, new process and new analytical methods
– Require original data for approval

EMEA Approach for Biosimilar Medicines:Guideline on Similar Biological Medicinal Products
(CHMP/437/04)
• Overall Approach– Similar biological medicinal products are not generic medicinal
products– Comparability studies need to demonstrate the similar nature in
terms of quality, safety, and efficacy
• Biosimilars will be different from the reference– It is not expected that the quality attributes in the biosimilar and
reference product will be identical– The biosimilar product may exhibit a different safety profile (in
terms of nature, seriousness, or incidence of adverse reactions)

US Definition of Biosimilarity
• Biosimilarity– The biological product is highly similar to the
reference product not withstanding minor differences in clinically inactive components
– There are no clinically meaningful differences between the biological product and the reference product in terms of the safety, purity, and potency of the product.

Criteria for Biosimilar
EU• Similar nature to reference product
based on:– Quality– Safety– Efficacy
• Should be similar in molecular and biological terms
• Pharmaceutical form, strength, and route should be the same or if different additional data should be provided
• Class specific guidelines are referenced
US – BPCA• Highly similar to reference product
based on:– Analytical studies– Animal studies– Clinical study or studies
• Utilizes same mechanism of action• Conditions of use have been approved• Route of administration, dosage form,
and strength are the same• Not all data elements may be
necessary• Allows for a determination of
interchangeability

US Definition of Interchangeability
• The biological product may be substituted for the reference product without the intervention of the health care provider
• Determination of Interchangeability– Finding of biosimilarity and expectation to produce the
same clinical result in any patient– For a product that is administered more than once
• The risk in terms of safety or diminished efficacy of alternating or switching between use of the biological product and the reference product is not greater than using the reference product alone

Specification Limits Vs. Control LimitsDifferentiate Specification Limits from Control Limits
Based on clinical relevance to provide assurance of
safety and efficacy
Based on process capability to provide assurance of
process consistency
Regulatory CommitmentDesign Space enabled
Process Improvements enabled
Managed through QMSProcess Monitoring
Continued Process Verification
Product Understanding Process Understanding
Design Space
Control SpaceS
pe
cif
ica
tio
n L
imit
s
Co
ntr
ol
Lim
its
CQA 1 CQA 2 CQA 3
Specifications are linked to clinical relevance not process capability
Changes in specifications during product lifecycle reflect improved understanding of relationship between product and clinical relevance
From Ilse Blumentals, GSK

Step 2: Consider Impact to Other Unit Operations and Requirements for Extended Characterization
Movement in approved DS
Change outside approved DS
Outputs from previous step & other material inputs
Same Minor Change Major change Major change Major change
Design Space Parameters Same Same, Data not in original filing
New New New
Step Outputs Same Same Minor Changes New New
Other Unit Operations Affected
Single Single Single Multiple Multiple
Meets IP & Lot Release Criteria
Yes Yes Yes Lot release met, some IPCs changed
Lot release met, some IPCs changed
Comparability required__________________Results Observed
no no Yes,__________ No changes
Yes__________ minor changes
Yes__________ new peaks
Supportive non-clin/clin data
no no no maybe Yes
No Reporting Notification Pre-approvalReporting Requirement
Reporting requirements are based on the reassessment of risk posed by the change including results of new design and testing if necessary
Slide 66


