Embed Size (px)
Citation preview

Quality Assurance Project Plan
City of West Richland Phase 2a Well No. 10
Final: April 15 2021 Ecology Publication 21-12-007
Funded by Ecology Grant No. WROCR-1921-WeRiPW-00016

QAPP: West Richland Phase 2a QAPP
Page 0
Publication Information Each study conducted by the Washington State Department of Ecology must have an approved Quality Assurance Project Plan (QAPP). The plan describes the objectives of the study and the procedures to be followed to achieve those objectives. After completing the study, Ecology will post the final report of the study to the Internet.
This QAPP was approved to begin work in April 2021. It was finalized and approved for publication in April 2021.
The final QAPP is available on Ecology’s website at https://fortress.wa.gov/ecy/publications/SummaryPages/2112007.html.
Suggested Citation: City of Quincy, GeoEngineers, Northwest Groundwater Services. 2021. Quality Assurance Project Plan: City of West Richland Phase 2a Well No.10. Publication 21-12-007. Washington State Department of Ecology, Olympia. https://fortress.wa.gov/ecy/publications/SummaryPages/2112007.html.
Data for this project are available in Ecology’s EIM Database.
Contact Information
For more information contact:
Office of Columbia River Publications Coordinator Washington State Department of Ecology 1250 West Alder Street Union Gap, WA 99205-1295
Phone: (509) 575-2490
Washington State Department of Ecology – https://ecology.wa.gov
• Headquarters, Olympia 360-407-6000 • Northwest Regional Office, Bellevue 425-649-7000 • Southwest Regional Office, Olympia 360-407-6300 • Central Regional Office, Union Gap 509-575-2490 • Eastern Regional Office, Spokane 509-329-3400
COVER PHOTO: West Richland Well No. 10 discharge pond. PHOTO BY JON TRAVIS/ALICIA CANDELARIA.
Any use of product or firm names in this publication is for descriptive purposes only and does not imply endorsement by the author or the Department of Ecology.
To request ADA accommodation for disabilities or printed materials in a format for the visually impaired, call the Ecology ADA Coordinator at 360-407-6831 or visit https://ecology.wa.gov/ accessibility. People with impaired hearing may call Washington Relay Service at 711. People with speech disability may call TTY at 877-833-6341.

QAPP: West Richland Phase 2a QAPP
Page 1
Quality Assurance Project Plan
City of West Richland Phase 2a Well No. 10 By Phil Brown, Brad Bessinger, Alex Fazzari, Laura Hanna
Published April 2021
Approved by:
Signature:
Date: April 13, 2021
Roscoe Slade III, P.E. City of West Richland
Signature:
Date: April 9, 2021
Phil Brown, Author/Principal Hydrogeologist/Project Manager, Northwest Groundwater Services, LLC
April 9, 2021
Signature: Date: Kevin Lindsey, Principal Hydrogeologist, GeoEngineers, Inc.
Signature: Date: Ingrid Ekstrom, Project Manager, Ecology Office of Columbia River
Signature: Date: Michael Callahan, QA Coordinator, Ecology Office of Columbia River
Signatures are not available on the Internet version.

QAPP: West Richland Phase 2a QAPP
Page 2
1.0 Table of Contents Page
Publication Information ........................................................................................0 Contact Information ..............................................................................................0 1.0 Table of Contents .......................................................................................2
List of Figures ..............................................................................................4 List of Tables ...............................................................................................4
2.0 Abstract .......................................................................................................5 3.0 Background ................................................................................................6
3.1 Introduction and problem statement ....................................................6 3.2 Study area and surroundings ..............................................................7 3.3 Water quality impairment studies ....................................................15
4.0 Project Description ..................................................................................16 4.1 Project goals .....................................................................................16 4.2 Project objectives .............................................................................16 4.3 Information needs and sources .........................................................17 4.4 Tasks required ..................................................................................17 4.5 Systematic planning process ............................................................23
5.0 Organization and Schedule .....................................................................24 5.1 Key individuals and their responsibilities .........................................24 5.2 Special training and certifications .....................................................24 5.3 Organization chart .............................................................................24 5.4 Proposed project schedule .................................................................24 5.5 Budget and funding ...........................................................................26
6.0 Quality Objectives ....................................................................................27 6.1 Data quality objectives ......................................................................27 6.2 Measurement quality objectives ........................................................27 6.3 Acceptance criteria for quality of existing data ................................39 6.4 Geochemical modeling quality objectives ........................................39
7.0 Study Design .............................................................................................40 7.1 Study boundaries ...............................................................................40 7.2 Field data collection ..........................................................................40 7.2 Field data collection ..........................................................................41 7.2 Field data collection ..........................................................................41 7.3 Modeling and analysis design ...........................................................45 7.4 Assumptions underlying design ........................................................46 7.5 Possible challenges and contingencies ..............................................46
8.0 Field Procedures.......................................................................................48 8.1 Invasive species evaluation ...............................................................48 8.2 Measurement and sampling procedures ............................................48 8.3 Containers, preservation methods, holding times .............................52 8.4 Equipment decontamination ..............................................................54 8.5 Sample ID ..........................................................................................55

QAPP: West Richland Phase 2a QAPP
Page 3
8.6 Chain of custody................................................................................56 8.7 Field log requirements .......................................................................56 8.8 Other activities – Water Management ...............................................56
9.0 Laboratory Procedures ...........................................................................57 9.1 Laboratory procedures table ..............................................................57 9.2 Sample preparation method(s) ..........................................................57 9.3 Special method requirements ............................................................57 9.4 Laboratories accredited for methods .................................................57
10.0 Quality Control Procedures ....................................................................58 10.1 Field Quality Control .........................................................................58 10.2 Laboratory Quality Control................................................................58 10.3 Corrective action processes .............................................................59
11.0 Data Management Procedures ................................................................60 11.1 Data recording and reporting requirements .....................................60 11.2 Laboratory data package requirements ...........................................60 11.3 Electronic transfer requirements .....................................................60 11.4 EIM/STORET data upload procedures ...........................................60 11.5 Model information management .....................................................61
12.0 Audits and Reports ..................................................................................62 12.1 Field, laboratory, and other audits ...................................................62 12.2 Responsible personnel .....................................................................62 12.3 Frequency and distribution of reports .............................................62 12.4 Responsibility for reports ................................................................62
13.0 Data Verification ......................................................................................63 13.1 Field data verification, requirements, and responsibilities ..............63 13.2 Laboratory data verification ............................................................63 13.3 Validation requirements, if necessary .............................................64 13.4 Model quality assessment................................................................64
14.0 Data Quality (Usability) Assessment ......................................................65 14.1 Process for determining project objectives were met ......................65 14.2 Treatment of non-detects .................................................................65 14.3 Data analysis and presentation methods..........................................65 14.4 Sampling design evaluation ............................................................67 14.5 Documentation of assessment .........................................................67
15.0 References .................................................................................................68

QAPP: West Richland Phase 2a QAPP
Page 4
List of Figures Figure 1. Vicinity Map Figure 2. Faults and Folds along the Western Margin of the Richland Subbasin Figure 3. Well No. 10 Site Map Figure 4. Observation Wells and Intertie Locations
List of Tables Table 1. Historical Specific Capacity Measurements Table 2. Well 10 and Observation Well Information Table 3. Organization of Project Staff and Responsibilities Table 4. Schedule for Completing Field and Laboratory Work Table 5. Schedule for Data Entry Table 6. Water Quality Characterization Analytical Suite Table 7. Measurement Quality Objectives for Analytical Sample QA/QC Table 8. Water Level Measurement Frequency for Step-Rate Testing Table 9. Water Level Measurement Frequency for Baseline Monitoring Table 10. Water Level Measurement Frequency for Constant Rate Pumping Test Table 11. Geochemical Analytical Suite Table 12. Sample Containers, Preservation, and Holding Times Table 13. Laboratory Methods Summary

QAPP: West Richland Phase 2a QAPP
Page 5
2.0 Abstract The City of West Richland (City) is developing an Aquifer Storage and Recovery (ASR) facility at existing City Well No. 10 in conjunction with the Washington State Department of Ecology’s Office of Columbia River (OCR). The City requires additional supply capacity to support municipal demand. Without an ASR program the options are limited: the aquifer is declining in some areas and there is no additional summer supply and treatment capacity for the City. By storing treated surface water in the winter months at Well No. 10, the City can expand summer capacity of high-quality drinking water without impacting the aquifer system or the Columbia River in the summer months.
Phase 1a was completed with Ecology Grant No. WROCR-2018-WeRiPW-00004 between 2018 and 2019. The Phase 1a Well No. 10 condition assessment found limited biological activity and that the well is in relatively good condition. No well modifications were recommended. Physical well rehabilitation without advanced chemical treatment was recommended (NWGS 2020a).
In 2020, initial Phase 2a work included well rehabilitation, pump repair, and pumping system evaluation (NWGS 2020b). Well No. 10 rehabilitation was successful with future disinfection recommended. The pumping system evaluation found that using the City’s existing pump for the aquifer test proposed while discharging water for municipal supply will provide the necessary data to support ASR permitting (NWGS 2020b).
This Quality Assurance Project Plan (QAPP) describes additional Phase 2a work including aquifer testing, water quality sampling, geochemical compatibility analysis, and information needed to conduct an all known, available and reasonable methods of prevention, control and treatment (AKART) analysis. Phase 2a is being completed with support from OCR with Ecology Grant No. WROCR-1921-WeRiPW-00016.
The goal of the Phase 2a QAPP is to provide Ecology with a Phase 2a report which will provide the analysis and documentation to authorize Phase 2b preliminary ASR testing activities. The Phase 2a report will include supporting documentation for a Reservoir Permit application to request permission to recharge at Well No.10 to evaluate aquifer conditioning and recovered water quality prior to entering into design and construction phases of the project.

QAPP: West Richland Phase 2a QAPP
Page 6
3.0 Background The City is evaluating an ASR facility at existing City Well No. 10 to increase their summer pumping capacity by using an unused well to recover water stored in winter months. This action will not require an increase in West Richland’s water right authorized withdrawals. The City relies primarily on groundwater from seven production wells to supply municipal drinking water (City and J-U-B 2017). The City supplements the primary water supply during peak demand periods with Columbia River water purchased from the City of Richland which is delivered via an intertie with the Richland water system. The Wholesale Water Services Agreement between the cities expires January 1, 2051, though there it contains a provision to extend into perpetuity. Well No. 10 is located in the Zone 4 pressure zone which provides the majority of the City’s source water and storage.
In Phase 1a, the City completed a biological and condition assessment at Well No. 10 with support from OCR with Ecology Grant No. WROCR-2018-WeRiPW-00004. The results of the Phase 1a investigation are summarized in Section 3.2.2 and presented in the Ecology-approved Phase 1a: Well No. 10 Condition Assessment Report (NWGS and GeoEngineers, 2019).
Phase 2a Task 2 began with Well No. 10 well rehabilitation, pump repair, and a pumping system evaluation. Results of the initial Phase 2a efforts are summarized in Section 3.2.2 and presented in the Ecology-approved Well No. 10 ASR Well Rehabilitation and Pumping System Evaluation technical memorandum (memo) (NWGS 2020b).
This project is proceeding with additional Phase 2a work which includes:
• Phase 2a Task 3 (herein referred to as Phase 2a): Aquifer Testing and Sampling and, • Portions of Phase 2a Task 4: Documentation for Reservoir Permitting (Part 1 of 2) (NWGS
2020a).
The proposed Phase 2a field activities described in this QAPP include water quality characterization of source water, pre-recharge groundwater, and aquifer testing. Once collected, analytical data will be used to assess aquifer hydraulics, conduct a geochemical compatibility analysis, and an AKART analysis.
This Phase 2a QAPP for Well No. 10 was drafted with input from the ASR project team: Northwest Groundwater Services LLC (NWGS), GeoEngineers, Inc. (GeoEngineers), J-U-B Engineers, Inc., (J-U-B), and S.S. Papadopulos & Associates, Inc. (Papadopulos). This Phase 2a QAPP was generated in accordance with Ecology Publication No. 04-03-030, Guidelines for Preparing Quality Assurance Project Plans for Environmental Studies (Lombard and Kirchmer, 2004, revised December 2016) and the Quality Assurance Project Plan template (Ecology, revised March 2020) to provide procedures for making accurate measurements and obtaining representative, accurate, and precise analytical data. The project team and the City are working with Ecology’s OCR for the permitting and compliance portions of this QAPP.
3.1 Introduction and problem statement Well No. 10 was installed as a replacement well in 2006, but soon after completion customers noticed aesthetic issues. These issues were likely related to biofouling, though high iron,

QAPP: West Richland Phase 2a QAPP
Page 7
manganese, and odor are baseline conditions that make use of groundwater undesirable. Though demand has been increasing, the well has remained idle in emergency supply status since 2008. After rehabilitation in June 2020, the City began delivering Well No. 10 groundwater to the supply system the week of July 13, 2020 (NWGS 2020b). ASR remains the City’s objective to further improve delivered water quality (taste, odor, iron, and manganese) and perhaps increase supply capacity from the Well No.10 location.
The City requires additional supply capacity to support current municipal demand. Without an ASR program the options are limited because the aquifer is declining in some areas and there is no additional summer supply capacity from the City of Richland’s water treatment plant. By storing treated surface water in the winter months at Well No. 10 using ASR, the City can expand capacity of high-quality drinking water without impacting either the aquifer system or the Columbia River during the summer months.
The results of Phase 2a efforts for Task 3 described herein will be used to support Phase 2a Task 4, a Reservoir Permit application for Phase 2b preliminary testing at Well No. 10. A Phase 2a report will be prepared and designed to provide Ecology with the elements required by Chapter 173-157 Washington Administrative Code (WAC) (Underground Artificial Storage and Recovery) to authorize recharging source water into the aquifer with a Reservoir Permit.
This QAPP is only seeking approval for Phase 2a work described herein. Future phases including Phase 2b for preliminary ASR testing work will be addressed under a separate, future QAPP(s) (NWGS 2020a).
3.2 Study area and surroundings The Well No. 10 project site, shown in Figure 1, Vicinity Map, is located in Benton County in West Richland, Washington. Well No. 10 is located just north of E. Lattin Road. The site is bounded to the east by farmland, to the north, west, and south by residential properties. Well No. 10 is a 439-foot-deep well installed in 2006 by Schneider Equipment, Inc. Well No. 10 is located in SE¼ NE¼ Section 17, T9N, R28E.
The geology of the project area consists of Quaternary Missoula Flood outburst deposited gravel, sand and silt, minor remnants of Pleistocene loess, localized clay, silt, sand, and gravel of the Miocene-Pliocene Ringold Formation, and the Miocene Columbia River Basalt Group (CRBG). In the project area the CRBG is divided into three geologic formations including Grande Ronde Basalt, Wanapum Basalt, and Saddle Mountains Basalt (Swanson et al. 1979). The Columbia Plateau, where West Richland is located, is bounded on the west by the Cascade Range; on the east by the Rocky Mountains; on the north by the Okanogan Highlands; and on the south by the Blue Mountains.
The CRBG is a thick sequence of lava flows, a series of more than 300 flows and sedimentary interbeds that erupted 17 million to 6 million years ago (Tolan et al. 1989). CRBG flows were formed primarily as sheet flows that were laterally extensive, often covering tens of thousands of km2. CRBG sheet flows often transition to mega-scale compound flow geometries near flow margins. Individual flows range in thicknesses from 3 to more than 100 m (Tolan et al. 1989; GWMA 2009, 2011; Reidel et al. 2013). In the south-central portion of the Columbia Plateau, the total thickness of the CRBG is estimated to exceed 5 km (Tolan et al. 1989; Reidel et al. 2002,

QAPP: West Richland Phase 2a QAPP
Page 8

QAPP: West Richland Phase 2a QAPP
Page 9
2013; Burns et al. 2011). Thick sedimentary deposits overlie the basalts in many hydraulically separated structural basins, but basalt units occur at or near land surface over most of the Columbia Plateau (Tolan et al. 1989; Reidel et al. 2002, 2013; Burns et al. 2011). CRBG units are variably folded and faulted, including in the West Richland area where the nearby hills are folded and faulted basalt. Beneath the Columbia Plateau, the thickest and most extensive of the CRBG formations are, in order of decreasing age, volume and extent, the Grande Ronde, the Wanapum and the Saddle Mountains Basalts.
Appendix A includes four figures extracted from a 2010 Ecology technical memo (Hoselton, 2010) with a nearby cross section. The geologic cross section ends approximately 4 miles northwest of Well No. 10. An updated cross section will be included in the Conceptual Hydrogeologic Model as part of the Phase 2a report.
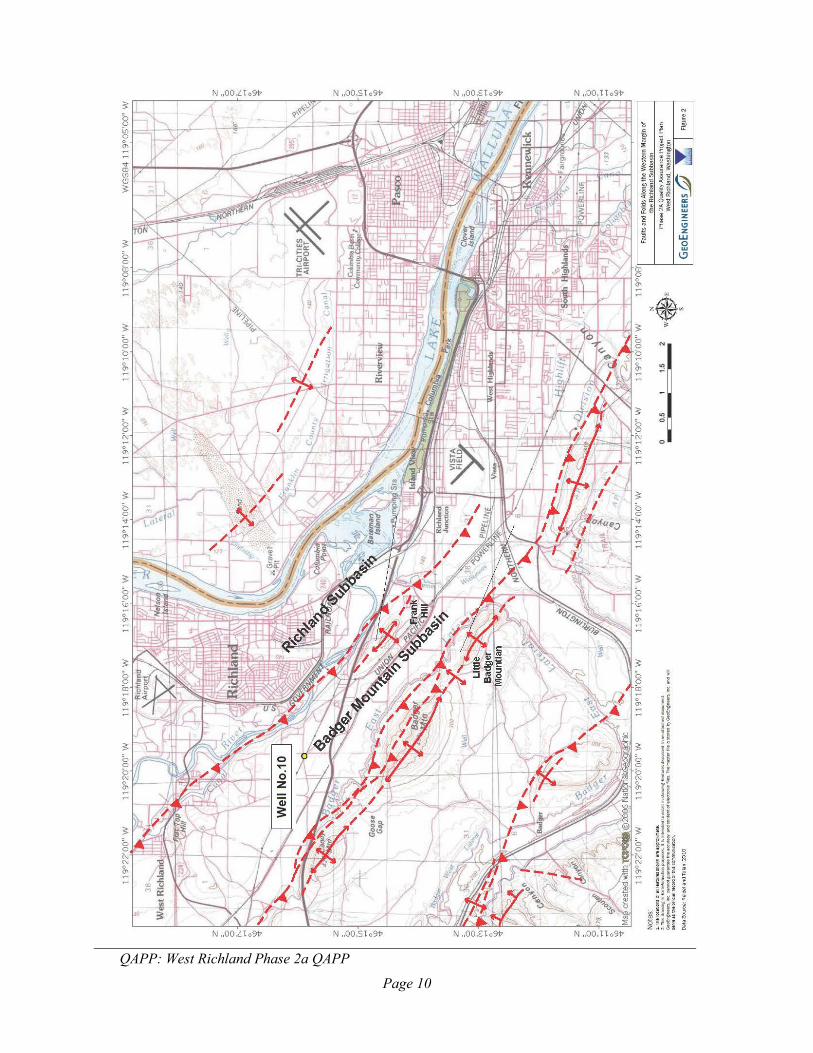
Well No. 10lies within the Richland subbasin, which encompasses the eastern portion of the Yakima Fold Belt geomorphic sub-province and the western portion of the Palouse sub-province. The broad structure of this subbasin is that of an asymmetrical syncline with the steepest side on the south and a gentle north slope. Local geologic structure is shown in Figure 2. Well No. 10is seen to lie between to northwest-southeast sets of southwest dipping thrust faults and anticlinal structures.
From Reidel and Tolan (2010): “The boundaries of the Richland subbasin are defined by CRBG feeder dikes on the east and folds and faults on the north, west, and south sides. The 8.5 million year old Ice Harbor Member (Saddle Mountains Basalt) feeder dike system bounds the east side of the subbasin. The Ice Harbor Member feeder dikes can be traced for more than 35 miles along this side of the subbasin and represent a series of vertical sheets of basalt (30 feet- to 50 feet-wide) that extend from near the top of the CRBG through the entire CRBG sequence. These feeder dikes trend about 20o west of true north. There are at least three known sets of vertical dikes and they create a groundwater barrier for east-west horizontal groundwater flow within the CRBG aquifer system (GWMA, 2009).” All of the City’s wells are completed in basalts of the CRBG. Well No. 10appears completed in the upper Saddle Mountains Basalt. Interflow zones of the CRBG where a vesicular flow top and subsequent flow bottom are found is where most of the groundwater flow occurs (Tolan et al. 2009; Lindsey et al. 2009; Burns et al. 2010; Ely et al.2014). Groundwater flow can also occur within interbed units although fine-grained and/or indurated interbeds can act as aquitards to inhibit vertical groundwater flow. Dense flow interiors typically have very low horizontal and vertical hydraulic conductivities unless post-deposition fracturing has created secondary permeability. Conversely, folding and faulting of the basalt may create lateral barriers to groundwater flow due to the formation of fault gouge and clays along the fault plane or by the offsetting (terminating) zones of permeability.
3.2.1 History of study area The area surrounding Well No.10 was historically agricultural and rural dwellings. Municipal infrastructure and houses have developed north, south, and west of the well site. An orchard operation remains east of the well site.
QAPP: West Richland Phase 2a QAPP
Page 10

QAPP: West Richland Phase 2a QAPP
Page 11

QAPP: West Richland Phase 2a QAPP
Page 12
In 2006 Well No. 10 was installed 50 feet southwest of abandoned Well No. 8. Well No. 8 was taken out of service and decommissioned in 2005 after collapsing in 2000 (J-U-B 2006). As Well No. 8 was a primary source for the City’s drinking water, Well No. 10 was installed in 2006 to replace it. At that time the well could produce approximately 1,200 gallons per minute (gpm). Within a few months of well startup, customers complained about rusty, black, and cloudy water. The original Well No. 8 log (B-1), Well No. 8 abandonment record (B-1), and new Well No. 10 log (B-2) are provided in Appendix B. When Well No. 10 was first installed, it was named Well No. 8 which caused confusion with the prior Well No. 8, so it was renamed Well No. 10. Figure 3 shows the Well No. 10 site, property boundaries, and the location of the well, pump house, unused water tank, unlined infiltration pond, and a lined evaporation pond.
The unlined infiltration basin receives discharge water from Well No. 10 when the pump is first turned on. The lined evaporation pond has a liner with sand and rock overtop. The evaporation pond receives flow from the floor drains in the building.
3.2.2 Summary of previous studies and existing data Because the water quality degraded at Well No.10 and it became a stranded asset, the City has been evaluating options to increase production capacity. Early efforts evaluated wellhead treatment. In 2010, new water quality issues limited use of the well. After 2010, the City began considering ASR as an option for improving delivered water quality from the Well No.10 location. The following section summarizes the 2008 water treatment feasibility study, Phase 1a condition assessment, and Phase 2a Task 2 well rehabilitation, pump repair, and pumping system evaluation. Work to support Tasks 1a and 2a has been ongoing since 2018. The relevant water quality information available for this project consists of the following:
1. West Richland Samples collected for compliance with DOH requirements, and available on the DOH website. There are four volatile organic compounds (VOCs) samples in this data set collected in 2006, 2007, and twice in 2008. There are also several partial suites of pesticides (2006), herbicides (2006, 2008, and 2009), insecticides (2006) and soil fumigants (2008 and 2009). Full IOC suites were collected in 2006, 2007, and April and May of 2008. This information will be presented in the AKART analysis.
2. Reviewing the most recent decade of City of Richland source samples in the DOH database (consistent with Ecology guidance) identifies the following available information: a. Four VOC suites collected in 2011, 2013, 2019, and 2020. b. Five Gross alpha samples collected in 2010, 2012, 2014, and 2020. c. Fifteen usable (separated by a month or more) IOC samples collected between 2010
and 2020. d. One TTHM and HAA5 sample collected in 2010. e. Two partial herbicide suites collected in 2013 and 2016. f. Two partial pesticide suites collected in 2013 and 2016. These data will be presented in the AKART analysis.
3. In 2008, a pilot study was conducted to utilize sequestering agents for the iron and manganese, which proved successful for a year or two of operation. In 2010 Well No. 10

QAPP: West Richland Phase 2a QAPP
Page 13
was placed on emergency status due to aesthetic issues of the produced water (City and J-U-B 2017). This report will be provided to Ecology for review.
4. In 2018, NWGS and GeoEngineers began the Phase 1a biological and condition assessment in accordance with the Ecology-approved Phase 1a QAPP (GeoEngineers and NWGS 2018a). This report was provided to Ecology in 2018. The results of Phase 1a specific capacity (SC) testing, water quality sampling, and well video included:
a. The produced water quality was reasonably good, though manganese was detected at the secondary maximum contaminant level (MCL) of 0.1 mg/L.
b. There were few indications of biological activity, though historic biofouling and corrosion were interpreted from the well video; and
c. The screen was in good condition, no holes were observed in the casing, and there were no indications of anaerobic biological activity in the sump.
Consequently, Phase 1a rehabilitation recommendations were limited to a physical well cleanout and disinfection (NWGS 2020a).
Table 1. Historical specific capacity measurements
Date Pumping
Rate (gpm) Drawdown
(feet)
Specific Capacity (gpm/ft)
Duration of Test (hours) Conducted By
3/27/2006 1426 47 30.3 1 Schneider Drilling, original well log
3/27/2006 1426 50 28.5 2 Schneider Drilling, original well log
Feb to March 2006 247 2.49 99.3 1 J-U-B (2006)
Feb to March 2006 474 5.98 79.3 1 J-U-B (2006)
Feb to March 2006 725 13.5 53.7 1 J-U-B (2006)
Feb to March 2006 953 22.53 42.3 1 J-U-B (2006)
Feb to March 2006 1196 35.38 33.8 1 J-U-B (2006)
6/17/2020 1 476 4.7 101.3 1 NWGS (2020b) Notes: 1 The June 17, 2020 specific capacity measurement was higher than some previously measured because of reduced turbulent losses (resulting from the lower discharge rate) relative to prior specific capacity tests.
In 2020, Phase 2a Task 2 work included well rehabilitation and pumping system test (NWGS 2020b). Well No. 10 was physically brushed, swabbed, bailed to remove debris, and disinfected in June 2020. A well video was conducted post-rehabilitation and water quality samples were collected pre- and post-rehabilitation. Well No. 10 post-rehabilitation produced acceptable water quality, though groundwater exhibited undesirable taste and odor, and biological activity remained present. The post-rehabilitation water quality results are presented in Appendix C. Table 1 shows

QAPP: West Richland Phase 2a QAPP
Page 14
available historical specific capacity (SC) measurements and the SC measured during well rehabilitation in June 2020.
During Phase 1a, the pump was removed prior to down-hole work related to the condition assessment. The pump contractor recommended some pump column and shaft bearings be replaced prior to reinstallation. During Phase 2a, Well No. 10 pump was repaired and re-installed prior to completing the pumping system evaluation in August 2020.
The pumping system evaluation was conducted to assess whether the City’s pump could be used to complete the Well No. 10 aquifer test described herein. Primary concerns were the ability to valve the system sufficiently to conduct a step-rate test and whether system pressure fluctuations would be too extreme to allow a constant-rate test. The pumping system evaluation included throttling the flow to determine if the pump and valves could be used to control rates targeting 500, 700, 900 and “wide-open” while pumping to the supply system; evaluating pressure response to turning on the intertie pump delivering water; and allowing the pump to run uninterrupted for 24 hours to assess pressure response and water level changes.
The pumping system evaluation found that using the City’s existing pump for the aquifer test while delivering water for municipal supply will provide the data necessary to assess aquifer properties and hydraulic response to pumping/injection sufficiently to support the first phase of ASR permitting. Detailed results are presented in the Well No. 10 ASR Well Rehabilitation and Pumping System Evaluation technical memo (NWGS 2020b). Ecology, the City, and NWGS met on November 9, 2020 where Ecology provided approval to move forward with this QAPP to describe using the City’s pump for aquifer testing, source and pre-recharge water characterization, and two elements of the subsequent data analysis which is the basis for this QAPP.
3.2.3 Parameters of interest and potential sources Well No. 10 project site is not known to be a contaminated site or suspected to be a contaminated site. The parameters of interest associated with ASR projects are typically constituents present in the treated drinking water that have listed health-based criteria, and constituents with concentrations that exceed pre-recharge groundwater concentrations with respect to groundwater quality criteria and the State’s Antidegradation Policy. Therefore, the parameters of interest are those listed in Ch. 173-200 WAC and any other parameter needed to complete a geochemical compatibility analysis and an AKART to assess compliance strategies with respect to those constituents that would increase groundwater concentrations.
To evaluate for specific parameters of interest and the potential for other unanticipated water quality changes during Phase 2a, the water quality analytical program will include inorganic compounds, metals, disinfection by-products (DBP), miscellaneous constituents, bacteriologicals, radiologicals, carcinogens, and herbicides and pesticides. Field water quality parameters, water level data, and pumping rate data will also be collected. The analytical program and field water quality parameters are detailed in Sections 6.0 and 7.0.
Additional water quality parameters will be collected for the geochemical compatibility analysis. This will include major cations, anions, and redox-sensitive parameters that control mineral precipitation and dissolution in the ASR aquifer as described in Sections 6.0 and 7.0.

QAPP: West Richland Phase 2a QAPP
Page 15
3.2.4 Regulatory criteria or standards Ch. 90.48 Revised Code of Washington (RCW; Water Pollution Control) and Ch. 173-200 WAC (Water Quality Standards for Groundwaters of the State of Washington) dictate and establish that water stored in an aquifer as part of an ASR project must meet water quality standards for groundwaters of the state of Washington.
Water quality analytical results will be compared to Ch. 173-200 WAC criteria If geochemical compatibility modeling predicts an increase in stored water concentration, those constituents will also be compared against Ch. 246-290-310 WAC (Maximum Contaminant Levels [MCLs] and Maximum Residual Disinfectant Levels (MRDLs).
Ch. 90.48 RCW, Ch. 90.54 RCW Water Resources Act of 1971, and Ch. 173-200-030 WAC further establishes the Antidegradation Policy that states existing and future beneficial uses of groundwater shall be maintained and protected from groundwater quality degradation. Chapter 173-200-030(2)(c) also states that when groundwater is of a higher quality than the water quality criteria in Table 1, Chapter 173-200-040, contaminants that will reduce the existing quality shall not be allowed with two exceptions. These exceptions are that: 1) an overriding consideration of the public interest will be served by the water quality changes; and 2) contaminants proposed to be introduced to groundwater shall be provided with an AKART prior to entry in the groundwater.
3.3 Water quality impairment studies There will be no impairment during Phase 2a ASR characterization. This work consists of aquifer testing and sampling. Because future ASR operations (if authorized) involve treated drinking water and past studies have shown the water of the Columbia River to be compatible with Basalts of the CRBG, no future impairment is anticipated. The Phase 2a geochemical compatibility analysis will evaluate several different mixtures of source water and pre-recharge groundwater chemistries and the potential for different mixtures of those waters to react with the aquifer matrix specific to the selected storage zone. This modeling will rely on the source and pre-recharge characterization samples collected in Phase 2a. This will be accomplished using PHREEQ, Hydrogeochemist’s Workbench or similar thermodynamic equilibrium modeling tool and presented in the Phase 2a report. The results of the geochemical evaluations will be compared to groundwater and drinking water quality criteria, as appropriate, to establish treatment goals in the AKART. If reactions in the subsurface indicate the potential to increase concentrations above pre-recharge, these constituents will be included in the constituents of concern list and addressed in the AKART analysis. AKART results will be presented in the Phase 2a report. No increases of any constituent rising to the level of impairment are anticipated.

QAPP: West Richland Phase 2a QAPP
Page 16
4.0 Project Description The following section describes the project for the City’s Phase 2a Well No. 10 aquifer characterization, geochemical compatibility modeling, and AKART analysis.
4.1 Project goals The project goal is to implement an ASR project at Well No.10. To do so, the project team must implement studies consistent with Ch. 173-157 WAC to support an application and request to authorize recharge activities. Phase 2a is designed to collect the information and present the analyses necessary to support a permit application for Phase 2b preliminary ASR testing. This QAPP describes the following Phase 2a elements: aquifer testing, source and pre-recharge water quality characterization, geochemical compatibility modeling, and an AKART analysis. This work, along with much additional analysis, will be presented in the Phase 2a Report. The goal of the Phase 2a report is to support a Reservoir Permit application requesting Ecology authorization to recharge source water into the aquifer at Well No. 10 for preliminary ASR testing (Phase 2b).
4.2 Project objectives Phase 2a objectives include:
• Conduct well and aquifer performance characterization through establishing an observation well network, conducting baseline (pre-test) monitoring, a step-rate test, a 72-hour constant -rate test, and 72-hour recovery monitoring.
• Assess aquifer hydraulic properties through aquifer performance test data analysis. • Collect one source water sample for water quality characterization from City of Richland water
supply system. • Collect one groundwater sample on the second day of the aquifer test for general geochemistry
analysis to support the geochemical compatibility modeling. • Collect one groundwater sample for pre-recharge groundwater quality characterization at the
end of the constant-rate pumping period. This expanded analytical suite contains the analytes included in the general geochemistry suite.
• Conduct geochemical compatibility modeling to evaluate potential water quality changes that could occur as source and pre-recharge waters mix in the subsurface.
• Conduct an AKART analysis utilizing the water quality and geochemical compatibility modeling results. The purpose of the AKART is to evaluate whether or not treatment or other strategies comply with regulatory criteria and the Antidegradation Policy. The overall objective of this analysis is to provide Ecology with the information needed to allow a determination that West Richland’s ASR project is in the public interest as described in Ch. 173-157-200(2) WAC, and ASR can be allowed. Because disinfection by-products are present in chlorinated drinking water, the source water will not comply with state groundwater quality criteria (WAC 173-200) and/or the state’s anti-degradation policy. Other contaminants of concern may also be identified as part of the AKART analysis.

QAPP: West Richland Phase 2a QAPP
Page 17
4.3 Information needs and sources The information needed as part of this Phase 2a QAPP include:
• Baseline testing, and post-test water levels at Well No. 10 and other observation wells • Well performance and aquifer hydraulic properties • Source water quality sample • Pre-recharge groundwater quality sample • Groundwater samples for geochemical compatibility modeling • Compile nearby information to prepare a theoretical weathered surface chemical profile for
evaluation of the potential for rock-water interactions, with details provided in Section 7.3. o Ames, L.L. and J.E. McGarrah. 1980. Hanford basalt flow mineralogy. Battelle Pacific
Northwest Laboratory Report PNL-2847. 469 pp. o Reidel, S.P. 2005. A lava flow without a source: the Cohassett Flow and its
compositional components, Sentinel Bluffs Member, Columbia River Basalt Group. J. Geol. 113: 1–21.
o Schaef, H.T., and B.P. McGrail, 2009. Dissolution of Columbia River Basalt under mildly acidic conditions as a function of temperature: experimental results relevant to the geological sequestration of carbon dioxide. Appl. Geochem. 24: 980–987.
• The AKART will rely on information collected through sampling and geochemical modeling specific to this project.
4.4 Tasks required Phase 2a Task 3 anticipated project tasks include the following:
1. Establish Observation Well Network
2. Aquifer Testing
3. Source and Pre-Recharge Groundwater characterization Sampling
4. Geochemical Compatibility Modeling
5. AKART
Task 1: Establish Observation Well Network (Complete) Table 2 lists wells identified as available for monitoring for this project. Figure 4 shows there locations. The City and consulting team contacted more than a dozen well owners, visited 10 well sites, and eliminated 25 wells on the basis of 6-inch casing and domestic use. The bulk of the remaining wells were eliminated on the basis of depth or lack of information allowing identification of owner or location.

QAPP: West Richland Phase 2a QAPP
Page 18

QAPP: West Richland Phase 2a QAPP
Page 19

QAPP: West Richland Phase 2a QAPP
Page 20
Ground surface elevations (feet North American Vertical Datum of 1988 [feet NAVD88]) were estimated using the X and Y coordinates included in Ecology’s database and using Geographic Information Systems (GIS) 10-meter digital elevation model. GIS was also used to estimate the distance from Well No. 10 location to each well. Well bottom hole elevations were estimated by subtracting the reported well depth (feet) from the ground surface elevation (feet NAVD88). Wells with bottom elevations within 100 feet of the Well No. 10 bottom elevation (+/- 50 feet) were considered candidates for monitoring. This filter removed all monitoring wells and piezometers from consideration because all present in the area are less than 150 feet deep. Once wells with access were identified, elevation estimates were made using Google Earth, which resulted in elevations different from the GIS approach due to the uncertainty associated with locations recorded on well logs. Consequently, some bottom of hole elevations no longer match the original +/- 50 feet (100 ft) arbitrary range selection. However: • Elevations will be re-evaluated with a GPS measurement. • There are no known “better” wells available for monitoring. This search resulted in the observation wells shown in Table 2 and Figure 4. The well logs are included in Appendix B. A distance-drawdown analysis was conducted using the Cooper-Jacob (1946) approximation to the Theis Equation:
Where s is the drawdown at time t at a distance r from the pumping well. The aquifer transmissivity was estimated using the empirical method relating the measured specific capacity to Transmissivity included in Driscoll (1986, p.1021). Storativity was assumed to be the 1X10⁻⁵
commonly observed in well confined fractured basalt aquifers. This resulted in the following estimates of drawdown for a 72-hour 1,050 gpm pumping period at the distances shown (noting all the common simplifying assumptions associated with this analysis are unlikely to be true): • Well No.10. Distance = 1 ft, drawdown = 33 ft • Hawkins #1. Distance = 8,554 ft, drawdown = 6.7 ft • CID. Distance = 11,194 ft, drawdown = 5.9 ft • MW-7. Distance = 39,600 ft, drawdown = 2.3 ft These rough estimates indicate that if there is hydraulic continuity between Well No. 10and these locations and the assumptions used are reasonable, there will be sufficient drawdown at these distances from the planned test to assist in aquifer characterization.

QAPP: West Richland Phase 2a QAPP
Page 21
Well MW-7 was identified as being completed in the same basalt unit as Well No. 10 by Anna Hoselton (Ecology) sometime after the well was drilled in 2009 and the City published a groundwater monitoring report in 2011 (see appendix A). The CID well is likely to be completed in the same unit on the basis of the current bottom of hole elevation estimate. The Hawkins well may be up to 122-feet shallower (pending elevation confirmation), so continuity at that location is uncertain. Lateral continuity cannot be guaranteed regardless of completion depth, and the presence/absence of vertical continuity as observed at Hawkins would also provide important aquifer characterization information.
Task 2: Aquifer Testing Aquifer testing and sampling activities are briefly described as follows. Additional details are provided in Section 7.0.
• Baseline water level monitoring for 3 consecutive days prior to start of step-rate test at Well No. 10 and observation well network.
• Step-rate testing: four steps will be used to develop well performance analysis. • Constant-rate testing: 3-day (72-hour) pumping period is assumed. • Recovery monitoring: 3-day (72-hour) period will occur after the end of the pumping period. • Barometric pressure monitoring to allow transducer data corrections as needed. • City pumping records will be collected to assess other City wells as potential sources of
interference signals. • Data analysis to evaluate storage zone response to ASR and set optimum rates and volumes
for Phase 2b Preliminary ASR testing. • Collect water level data and flow rate measurements during step-rate and constant-rate testing
at Well No. 10. • Collect water level data during step-rate and constant-rate testing at the observation well
network. Deliverables for Task 2 will be compiled data sets for inclusion in the Phase 2a report.
Task 3: Sampling The following groundwater sampling and water quality monitoring will be conducted in this portion of Phase 2a: • Collect one source water characterization sample from City of Richland water supply system
to be analyzed for the expanded characterization suite of analytes. That sample will be collected at the Richland Intertie Pump Station shown in Figure 4. The City’s engineering team determined that this location is as close as possible to the West Richland Well No.10 site that can produce water representative of what will be delivered to Well No.10.
• Collect two geochemical suite samples on day two of the test. • Collect one pre-recharge groundwater characterization sample on the final day of the constant-
rate test.

QAPP: West Richland Phase 2a QAPP
Page 22
• Collect physical water quality measurements (field parameters) during the constant-rate test at Well No. 10
Physical parameters will be measured coincident with each sample collected. Details regarding sample schedule and analyte lists are provided in Section 7.
Task 4: Geochemical Compatibility Modeling The source water and pre-recharge groundwater laboratory analytical results will be imported to a thermodynamic geochemical equilibrium model to assess the potential for reactions to occur between mixtures of the two waters. Because Well No. 10 predates this project, SEM and XRD analysis of weathered surfaces does not exist for this site so nearby information will be compiled to prepare a theoretical weathered surface chemical profile to evaluate potential for rock-water interactions.
Deliverables for Task 3 will be compiled data sets for inclusion in the Phase 2a report.
Task 5: AKART Because of the assumed presence of disinfection by-products in drinking water, the source water will not comply with state groundwater quality criteria (WAC 173-200) and/or the state’s anti-degradation policy. To address this (and any other identified) issue and meet regulatory requirements, an engineering and economic analysis known as AKART will be performed to assess the feasibility of treatment as a compliance approach. The AKART will rely on the source and pre-recharge characterization samples collected at the end of the aquifer test.
The objective of the AKART analysis is to provide analysis to support an OPI determination that will be necessary to obtain authorization for preliminary recharge testing. It is anticipated that this AKART will also be the basis (perhaps with modification) for future testing authorization. Subsurface attenuation and compliance monitoring strategies allowable within the regulatory framework will also be evaluated. It is anticipated that the information provided by this task will allow Ecology to make the determination that West Richland’s ASR project is in the public interest as described in Ch. 173-157-200(2) WAC. We anticipate referencing relevant reports and documentation that Ecology has previously approved and to focus the analysis on site-specific factors that will streamline the AKART task and minimize costs.
The AKART analysis will include description of water quality; comparison to relevant standards (Ecology 2005); seasonal variability assessment and data gaps; evaluation of treatment methods/technologies and costs; identification of potential receptors; evaluation of mixing through dispersion; vertical continuity; attenuation potential in the subsurface; comparison of alternative strategies to treatment methods/technologies; and a recommended approach for the West Richland ASR project to comply with water quality regulations.
Deliverables for Task 4 will be included in the Phase 2a report. The Ecology-approved Project Implementation Plan includes an outline of that report. The Task 4 data set will support much of that analysis.

QAPP: West Richland Phase 2a QAPP
Page 23
4.5 Systematic planning process The project has been developed with support from OCR grant funding; is based on the requirements of WAC 173-157; and informed by previous ASR projects completed by this team. The phased work scope has been approved by Ecology in the Well No. 10 ASR Implementation Plan City of West Richland, Washington (NWGW 2020a).
Phase 2a is being completed with support from OCR with Ecology Grant No. WROCR-1921-WeRiPW-00016.
This QAPP only covers select Phase 2a elements: the field program and two data analysis elements requested by Ecology. The complete Phase 2a workflow is described below:
• Task 1: Project Administration - ongoing • Task 2: Well Rehabilitation and Pump Repair - completed • Task 3: Aquifer Test and Sampling – to be completed upon approval of this QAPP • Task 4: Documentation for Reservoir Application, Part 1 – to be completed after the Phase 2a
QAPP is approved and implemented • Task 5: Documentation for Reservoir Application, Part 2 – to be completed after the Phase 2a
QAPP is approved and implemented • Task 6: Final Phase 2a Report – to be completed after the Phase 2a QAPP is approved and
implemented
Tasks 4 and 5 were separated at Ecology’s request in response to the space limitations in Ecology’s EAGL grant application format.
Future additional Phases, not included in this QAPP are as follows:
Phase 2b – Preliminary ASR Testing
Phase 3 - Design, Construction, and Phase 4 Permitting
Phase 4 - Operational-Scale ASR Testing, Phase 4 Report

QAPP: West Richland Phase 2a QAPP
Page 24
5.0 Organization and Schedule 5.1 Key individuals and their responsibilities Table 3 shows the responsibilities of those who will be involved in this project.
5.2 Special training and certifications NWGS, GeoEngineers, J-U-B, and Papadopulos personnel working on this project are appropriately trained and several are licensed hydrogeologists and professional engineers in the state of Washington as noted in the above table. This team has conducted this type of testing and sampling many times previously, and several projects have occurred under Ecology-approved QAPPs. Most recently, this team conducted aquifer testing and pre-recharge groundwater characterization with an Ecology-approved QAPP at the City of Quincy (GeoEngineers and NWGS 2018b).
The subcontractor selected to provide water quality laboratory analytical services is discussed in Section 9.4.
5.3 Organization chart Not applicable – See Table 3.
5.4 Proposed project schedule Tables 4 and 5 list key activities, due dates, and lead staff for this project.
The Phase 2a aquifer testing and sampling will begin in the Spring of 2021. It is desirable to complete the work prior to the irrigation season. It is anticipated to begin in March 2021. (Table 3). The Phase 2a report will be completed in the summer 2021 (Table 3). Please note the dates below are estimated and subject to change.

QAPP: West Richland Phase 2a QAPP
Page 25
Table 3. Organization of project staff and responsibilities
Staff Title Responsibilities
Roscoe Slade III, PE City of West Richland Phone: 509-967-54354
City of West Richland Public Works Director Clarifies scope of the project. Provides internal review of the QAPP and approves the final QAPP.
Kevin Lindsey, LHg GeoEngineers Phone: 509-209-2840
Principal Hydrogeologist Principal Hydrogeologist provides technical support, senior review, and reviews QAPP and Phase 2a report.
Phil Brown, LHg Northwest Groundwater Services, LLC Phone: 503-313-5195
Principal Hydrogeologist/Project Manager
Ensures the hydrogeologic team meets technical quality requirements, directs the field program, produces required project reports, and provides guidance and review of analytical interpretations, QA efforts, and reports. Finalizes QAPP and Phase 2a report.
Laura Hanna, LG GeoEngineers Phone: 978-844-0605
Hydrogeologist/Health and Safety Officer
Drafts the QAPP. Oversees field data collection and transportation of samples to the laboratory. Analyzes and interprets data. Supports the draft Phase 2a report.
Jon Travis, LG GeoEngineers Phone:509-209-2839
Hydrogeologist Supports field data collection, sampling, and transportation of samples to the laboratory.
Denell Warren GeoEngineers Phone: 253-722-2792
QA/QC Coordinator
Provides internal review of the QAPP. Review and compilation of QA/QC elements of QAPP. Conducts QA review of data. Uploads data to EIM.
Brad Bessinger, PhD, RG S.S. Papadopulos & Associates, Inc. Phone: 360-566-7119
Senior Geochemist
Drafts QAPP components related to geochemical compatibility analysis. Conducts geochemical compatibility analysis. Supports AKART as needed.
Alex Fazzari, PE J-U-B Engineers, Inc. Phone:509-783-2144
Senior Engineer
Drafts QAPP components related to the AKART. Conducts AKART analysis. Supports project with Engineering analysis as-needed.
Ingrid Ekstrom Office of the Columbia River Phone:509-454-4335
Ecology Office of Columbia River Project Manager
Reviews and comments on draft QAPP Provides Ecology/OCR QAPP review. Updates project team on schedule, scope, and budget.
Michael Callahan Phone: 509-454-4270
Ecology Office of Columbia River Quality Assurance Coordinator
Reviews and approves the draft QAPP and the final QAPP.
Notes: EIM: Environmental Information Management database QAPP: Quality Assurance Project Plan

QAPP: West Richland Phase 2a QAPP
Page 26
Table 4. Schedule for completing field and laboratory work.
Task Due date Lead staff Ecology Phase 2a QAPP (Draft) approval February 2021 Phil Brown Ecology Review and Final QAPP March 2021 Ecology Establish final observation well network approved by Ecology April 2021 Phil Brown
Collect source water sample March/April 2021 Jon Travis Fieldwork – aquifer testing and sampling April/May 2021 Laura Hanna/Jon Travis Laboratory analyses April/May 2021 Phil Brown Geochemical Compatibility Modeling June/July 2021 Brad Bessinger AKART Analysis August/September
2021 Alex Fazzari
Draft Phase 2a Report October 2021 Phil Brown Final Phase 2a Report December 31, 2021 Phil Brown
Notes: *Pending approval of proposed analytical program
Table 5. Schedule for data entry
Task Due date Lead staff EIM data loaded* May 2021 Denell Warren EIM QA May 2021 Laura Hanna EIM complete June 2021 Denell Warren
Notes: *EIM Project ID: WROCR-2018-004 EIM: Environmental Information Management database
5.5 Budget and funding The project is funded by Ecology Grant No. WROCR-1921-WeRiPW-00016. Budget details for Phase 2a work were reviewed and approved by Ecology as part of that Agreement.

QAPP: West Richland Phase 2a QAPP
Page 27
6.0 Quality Objectives The goal of this Phase 2a QAPP is to ensure that data of sufficiently high quality are generated to support the main data quality objectives (DQOs) and measurement quality objectives (MQOs) of the project.
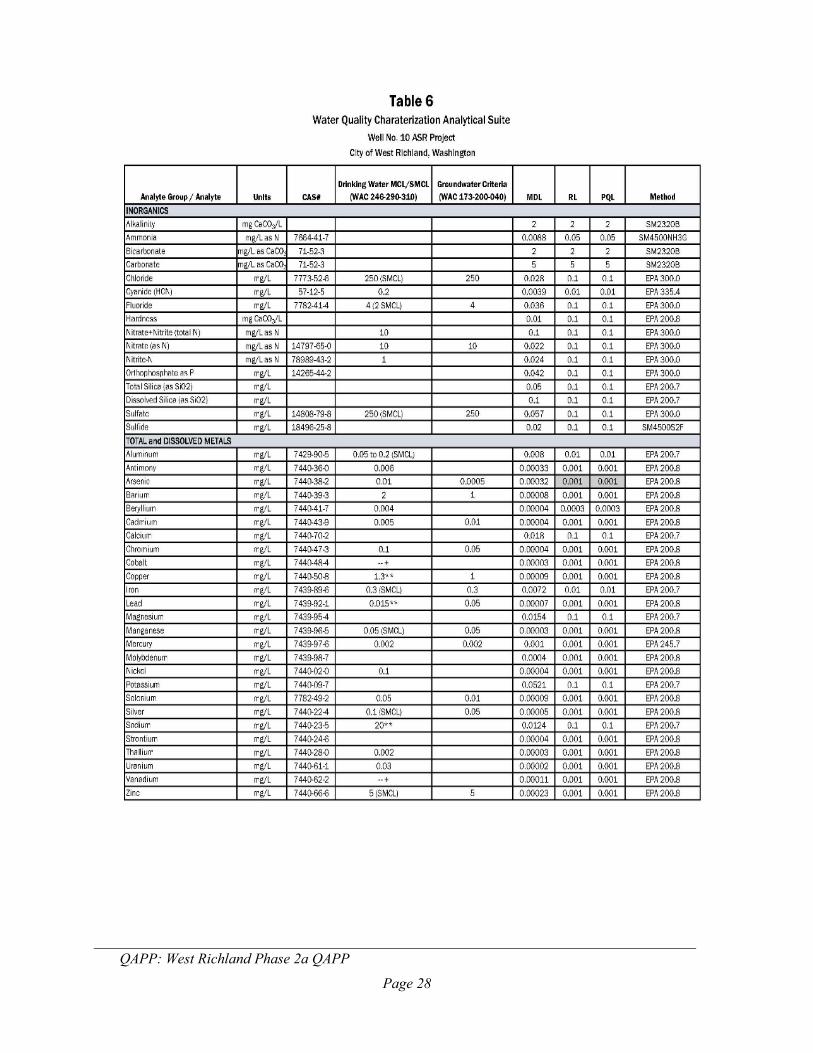
6.1 Data quality objectives The main DQO for this project is to characterize aquifer hydraulic properties; source and pre-recharge groundwater chemistry; perform a geochemical compatibility analysis that evaluates the potential water quality changes in the subsurface; and an AKART to assess compliance alternatives with respect to water quality criteria and the state’s Antidegradation Policy. The analytical list for the water characterization suite of analysis and methods are provided in Table 6. Note that the geochemical characterization suite discussed later in this QAPP (and shown in Table 10) is a subset of the list shown in Table 6. The proposed analytical is a subset of analytical presented in a previously approved QAPP for groundwater characterization of another Ecology funded project (GeoEngineers and NWGS 2018b), a subset of analytical from WAC 173-200 Table 1, and a subset of previously reported VOCs to the Washington State Department of Health by the City and the City of Richland.
Decision quality objectives are data of sufficient breadth, accuracy, and precision needed to support a decision to continue the study to the Phase 2b preliminary ASR testing phase. Because the well was not drilled for the purpose of this project, cuttings are not available to support rock-water geochemical compatibility. Therefore, Phase 2b is designed to confirm geochemical compatibility modeling that will have some necessary degree of uncertainty. Consequently, the data collected in Phase 2a will be sufficient to support a decision to proceed with water quality confirmation testing in Phase 2b as long as the analytical results and geochemical modeling do not show that impairment (defined here as an increase above a maximum contaminant level [MCL]) is likely to occur if source water is injected. The analytical program presented in this QAPP has sufficient analytical precision to identify potential impairment.
6.2 Measurement quality objectives The MQOs for analytical data quality are defined in terms of the quantitation limits achievable using the referenced analytical methods, and in terms of the resulting goals for precision, accuracy, sensitivity, representativeness, completeness, and comparability of analytical data. Method detection limits (MDLs) and reporting limits (RLs) and practical quantification limits (PQLs) for water quality analyses are provided for each analytical parameter in Full Water Quality Analytical Suite, Table 5. The quality objectives for water quality analyses established for Phase 2a are described in the following sections.
The follow sections describe the MQOs for precision, bias, and sensitivity.
The MQOs for field measurements and data collection are specific to the equipment or instrument being used and the type of data being collected. Field data collection includes water levels, flow rates, field water quality parameters (temperature, pH, DO, ORP, turbidity and specific conductance).
QAPP: West Richland Phase 2a QAPP
Page 28

QAPP: West Richland Phase 2a QAPP
Page 29

QAPP: West Richland Phase 2a QAPP
Page 30

QAPP: West Richland Phase 2a QAPP
Page 31

QAPP: West Richland Phase 2a QAPP
Page 32
Water level in Well No. 10 will be monitored with a datalogging pressure transducer (Appendix D, Groundwater Monitoring SOP) and backed-up with electronic water level sounder (e-tape) measurements with an accuracy of 0.01-ft. The frequency of the measurements is provided in detail in Section 7.2.
Flow rate monitoring, including noting instantaneous and totalizer measurements, will be performed using the Cities McCrometer Water Specialties size 12" model MLo4-12 serial #

QAPP: West Richland Phase 2a QAPP
Page 33
2007o716 re-calibrated 12-11-20 with +/- 2% accuracy. The reading will be done visually mirroring manual water level monitoring. A camera will be installed to record instantaneous and totalizer readings at fixed 1-minute intervals for the duration of the test. Additional details are provided in Section 7.2.
Field water quality parameters will be collected using a YSI556 (or similar) multi-probe meter and flow-through cell. The parameters will include temperature, pH, DO, ORP, turbidity, and specific conductance. The meter will be calibrated using user manual specifications at the intervals provided in Section 8.2 and measurements will be made at the frequency provided in Section 7.2. The accuracy for the YSI556 varies by parameter and is as follows:
• Temperature will be reported to the nearest 0.01°C • pH will be measured and reported to the nearest 0.01 • DO will be measured and reported to the nearest 0.01 milligram per liter (mg/L) • ORP will be measured and reported to the nearest 0.01millivolt (mV) • Turbidity will be measured with a Lamont 20/20 WE, or similar capable of report to the nearest
0.05 Nephelometric Turbidity Unit (NTU). The GPS unit used will be a GPSMAP 60CSx SN10R-022491. This unit is reported to have an altimeter accuracy of +/- 10 ft with 1-ft resolution. It will be checked against a City benchmark near the site to assess precision. Combined with map evaluation, final accuracy is expected to be less than +/- 10 ft.
6.2.1 Targets for precision, bias, and sensitivity The MQOs for project results, expressed in terms of acceptable precision, bias, and sensitivity, are described in this section and summarized in Table 7.
6.2.1.1 Precision Precision is the ability of an analytical method or instrument to reproduce its own measurement. Analytical precision shall be reported as required by the governing reference methods cited in Table 7. Analytical precision will be evaluated via matrix spike-duplicates and the collection of field duplicates.
For the MS/MSD and field duplicate samples collected the relative percent difference (RPD) will be evaluated. See Table 7.
The equation used to express precision is as follows:
Relative Percent Difference (RPD) = (𝐶𝐶1−𝐶𝐶2)(𝐶𝐶1+𝐶𝐶2)/2
𝑥𝑥100%
where:
C1 = larger of the two observed values
C2 = smaller of the two observed values

QAPP: West Richland Phase 2a QAPP
Page 34
6.2.1.2 Bias Bias (accuracy) is a measure of the closeness of an individual measurement (or an average of multiple measurements) to the true or expected value. Accuracy will be determined using laboratory QA/QC procedures and verification standards. The laboratory verification standards, recovery limits for the laboratory control standard, matrix spikes, internal standard, and surrogate standards (when applicable) are in Table 7.
In addition, accuracy of field equipment will be determined by calibrating all field equipment prior to the use the same day as use. Equipment calibration will follow the manufacture recommended protocols in the user manual specific to each piece of equipment.
6.2.1.3 Sensitivity For Phase 2a the goal is to achieve analytical sensitivities consistent with or lower than regulated criteria values. When they are achievable, target reporting limits (RLs) specified in this QAPP will be at least a factor of 2 less than the analyte’s corresponding regulated criteria value. Where groundwater quality standards are lower than RLs, comparison to PQLs will be included in the AKART.
Detected results between the MDLs and the RLs will be reported with a “J” qualifier. Non-detected results will be reported at the limit of detection with a “U” qualifier by the analytical laboratory.
6.2.1 Targets for comparability, representativeness, and completeness The following sections describe the actions to be taken to support comparability, representativeness, and completeness of the data collected. 6.2.2.1 Comparability Approved analytical procedures shall require consistent reporting techniques and units specified by the referenced methods cited in Table 6 to facilitate the comparability of data sets from sequential sampling rounds in terms of precision and accuracy.

QAPP: West Richland Phase 2a QAPP
Page 35

QAPP: West Richland Phase 2a QAPP
Page 36

QAPP: West Richland Phase 2a QAPP
Page 37

QAPP: West Richland Phase 2a QAPP
Page 38
In addition, field work will be completed using the standard methodology and procedures providing in the SOPs in Appendix D to the extent possible. Deviations from the provided SOPs necessitated by field conditions will be noted in the field notebook. Appendix D includes the following SOPs:
• Aquifer Tests SOP (Appendix D-1) includes procedures for: o Step-rate Test o Constant-rate Test
• Groundwater Monitoring SOP (Appendix D-2) includes procedures for: o Use of pressure transduces and barometric pressure corrections o Manual water level measurements
• Environmental Sampling for Groundwater and Surface Water (Appendix D-3) includes procedures for:
o Equipment and site decontamination o General sample collection, preservation, shipping, and chain of custody o Total and Dissolved Metals Sampling o Extractable Organic Sampling o VOC sampling and, o Bacteriological Sampling
6.2.2.2 Representativeness Representativeness expresses the degree to which data accurately and precisely represents the current well condition. Groundwater will be collected at the end of a 3-day constant-rate pumping period and will, therefore, be representative of pre-recharge groundwater quality within the aquifer to be characterized. This will be confirmed with field water quality parameters stabilizing to within 10% of the preceding two measurements. If field water quality parameters do not stabilize by the third day of testing, the City will consult with Ecology whether the test duration should be extended or not.
For the source water sample, the operational conditions of the City of Richland water supply system will be documented to ensure the water is as representative as possible. It is anticipated that City of Richland operations staff will identify a sampling location as close as possible to Well No. 10. Assuming those objectives are met, the samples collected will be considered adequately representative of the environmental conditions they are intended to characterize.
6.2.2.3 Completeness Completeness is defined as the percentage of valid analytical determinations with respect to the total number of requested determinations in a given sample delivery group; completeness goals are established at 90 percent. Data that have been qualified as rejected will not be considered valid for assessing completeness.

QAPP: West Richland Phase 2a QAPP
Page 39
6.3 Acceptance criteria for quality of existing data Existing data are appropriate for use in this project. Existing data primarily reflect groundwater quality conditions that have changed over time, and any limitations to the precision and quality of past analytical data will not impair the ability to evaluate ASR feasibility moving forward. No data gaps are apparent in the past data set. New information will be developed by this project to complete the requirements of Ch. 173-157 WAC.
6.4 Geochemical modeling quality objectives The modeling to be done in Phase 2a will use measured water quality at Well No. 10, published aquifer matrix mineralogy and geochemistry; and measured source water (City of Richland) water quality. The modeling which will use these data and information has two objectives: 1) evaluate the potential for source water-native groundwater reactions to change stored water quality and what those changes may look like; and 2) evaluate the potential for source water and aquifer matrix reactions to change the stored water quality. Stored water refers to treated source water once it is in the aquifer. The quality objectives are to identify these potential reactions and their potential products to use in designing future ASR preliminary testing, sampling, analysis, and modeling for the aquifer system both near and distally from Well No. 10.
Geochemical modeling will be performed using PHREEQC, Hydrogeochemist’s Workbench or similar program. The accuracy of geochemical modeling depends on the quality of the water chemistry data used as input to the model. Data quality objectives for geochemical modeling include complete water chemical analyses that meet all laboratory analytical QA/QC criteria and are charge balanced (10% charge imbalance). The DQO's will be evaluated during the initial review of the sampling data and are routinely satisfied in studies of this nature. Any deficiencies will be corrected by reanalysis. Resampling, if needed, would be done in coordination with the City when Well No. 10 is in use.

QAPP: West Richland Phase 2a QAPP
Page 40
7.0 Study Design The following sections describe the study design for Phase 2a work planned for this QAPP.
7.1 Study boundaries Surface boundaries for the project are the well site and immediately surrounding area as shown in Figure 3 above. Subsurface study boundaries for future phases and tasks will be initially determined by the observation wells shown in Figure 4. The hydraulic analysis resulting from the aquifer test described in this QAPP will allow an evaluation of the study area, and this will be presented in the Phase 2a Report.
7.2 Field data collection The field data collection section describes the groundwater samples, source water samples, water level data, rate data, and physical (field) water quality parameters that will be collected at various times during Phase 2a aquifer testing. This section describes the number of samples, sampling locations, timing, and pertinent field information to be recorded as part of this Phase 2a QAPP by data type:
• Water Level Monitoring • Flow Rate • Field Water Quality Parameters • Groundwater and Source Water Quality Parameters
Field measurement and sampling procedures are detailed in Section 8.0 Field Procedures.
7.2.1 Water Level Monitoring The testing sequence will be as follows:
• Thursday: Install Transducer, Baseline Day 0
• Friday: Step-Rate Test
• Saturday: Baseline Day 1
• Sunday: Baseline Day 2
• Monday: Baseline Day 3
• Tuesday: Baseline Day 4
• Wednesday: Baseline Day 5
• Thursday: Baseline Day 6
• Friday: End Baseline on Day 7, Begin Pumping Day 1
• Saturday: Pumping Day 2
• Sunday: Pumping Day 3

QAPP: West Richland Phase 2a QAPP
Page 41
• Monday: End Pumping Day 3, Begin Recovery Day 1
• Tuesday: Recovery Day 2
• Wednesday: Recovery Day 3
• Thursday: End Recovery Day 3 The weekdays were selected to ensure samples arrive at laboratories prior to weekends, and City staff are not required to work overtime/weekend days for start/stop pump operations.
Water level in Well No. 10 will be monitored with a datalogging pressure transducer and backed-up with electronic water level sounder measurements. Manual measurements at Well No. 10 will be collected at a decaying frequency, with more frequent measurements at the start of the test. Throughout testing, a dedicated barometric transducer will record atmospheric pressure changes. Pressure transducers will be installed in two of the three observation wells (Hawkins and MW-7) and measurement frequency will be set to match Well No. 10. The third observation well (CID) has an airline installed and no other access for manual measurement or pressure transducer. The well however is unused, so the lower frequency of airline measurements should not prevent data analysis.
7.2 Field data collection The field data collection section describes the groundwater samples, source water samples, water level data, rate data, and physical (field) water quality parameters that will be collected at various times during Phase 2a aquifer testing. This section describes the number of samples, sampling locations, timing, and pertinent field information to be recorded as part of this Phase 2a QAPP by data type:
• Water Level Monitoring • Flow Rate • Field Water Quality Parameters • Groundwater and Source Water Quality Parameters
Field measurement and sampling procedures are detailed in Section 8.0 Field Procedures.
7.2 Field data collection The field data collection section describes the groundwater samples, source water samples, water level data, rate data, and physical (field) water quality parameters that will be collected at various times during Phase 2a aquifer testing. This section describes the number of samples, sampling locations, timing, and pertinent field information to be recorded as part of this Phase 2a QAPP by data type:
• Water Level Monitoring • Flow Rate • Field Water Quality Parameters • Groundwater and Source Water Quality Parameters

QAPP: West Richland Phase 2a QAPP
Page 42
Field measurement and sampling procedures are detailed in Section 8.0 Field Procedures.
7.2.1 Water Level Monitoring The testing sequence will be as follows:
• Thursday: Install Transducer, Baseline Day 0
• Friday: Step-Rate Test
• Saturday: Baseline Day 1
• Sunday: Baseline Day 2
• Monday: Baseline Day 3
• Tuesday: Baseline Day 4
• Wednesday: Baseline Day 5
• Thursday: Baseline Day 6
• Friday: End Baseline on Day 7, Begin Pumping Day 1
• Saturday: Pumping Day 2
• Sunday: Pumping Day 3
• Monday: End Pumping Day 3, Begin Recovery Day 1
• Tuesday: Recovery Day 2
• Wednesday: Recovery Day 3
• Thursday: End Recovery Day 3
The weekdays were selected to ensure samples arrive at laboratories prior to weekends, and City staff are not required to work overtime/weekend days for start/stop pump operations.
Water level in Well No. 10 will be monitored with a datalogging pressure transducer and backed-up with electronic water level sounder measurements. Manual measurements at Well No. 10 will be collected at a decaying frequency, with more frequent measurements at the start of the test. Throughout testing, a dedicated barometric transducer will record atmospheric pressure changes. Pressure transducers will be installed in two of the three observation wells (Hawkins and MW-7) and measurement frequency will be set to match Well No. 10. The third observation well (CID) has an airline installed and no other access for manual measurement or pressure transducer. The well however is unused, so the lower frequency of airline measurements should not prevent data analysis.
Anticipated timing of manual and transducer water level measurements for each phase of aquifer testing for Well No. 10 and the observation well network is summarized in Tables 8 through 10 below.

QAPP: West Richland Phase 2a QAPP
Page 43
Table 8. Water level measurement frequency for Step Rate Test
Well Measurement Type
Baseline Monitoring
(1 day)
Pumping (1 day)
Recovery
(1 day)
Well No. 10
Pressure Transducer
15minute intervals
1-minute intervals 1 minute for one hour, then 15 minutes
Manual Twice per day Minimum 12 times 15 minutes for 2-hours
Barometric Pressure
Pressure Transducer 15-minute intervals 15-minute intervals 15-minute intervals
Flow Meter Visual, photo NA 1-minute intervals for 2-hrs, then 15 minutes
NA
Observation Well Network
Pressure Transducers
15-minute intervals
15-minute intervals 15-minute intervals
Manual Twice Twice
Once
Air Line Twice Twice
Twice
Table 9. Water level measurement frequency for Baseline Monitoring
Well Measurement Type
Baseline Monitoring
(2 days)
Well No. 10
Pressure Transducer
15minute intervals
Manual Once daily
Barometric Pressure
Pressure Transducer 15-minute intervals
Observation Well Network
Pressure Transducers
15-minute intervals
Manual Once daily
Air line Twice daily

QAPP: West Richland Phase 2a QAPP
Page 44
Table 10. Water level measurement frequency for Constant Rate Test
Well Measurement Type
Pumping
Recovery
Well No. 10
Pressure Transducer
1-minute intervals 1 minute for one hour, then 15 minutes
Manual Minimum 12 times 15 minutes for 2-hours
then twice per day
Barometric Pressure
Pressure Transducer
15-minute intervals 15-minute intervals
Flow Meter Visual, photo 1-minute intervals NA
Observation Well Network
Transducer (access TBD)
15-minute intervals 15-minute intervals
Manual Four times per day
Four times day 1, then twice daily1
Air line Four times per day
Four times day 1, then
twice daily1
1 The timing and frequency of recovery monitoring at observations wells will be adjusted to reflect response observed.
7.2.2 Flow Rate Data Flow rate monitoring includes noting instantaneous and totalizer measurements. Visual reading frequency will mirror manual water level monitoring as described above in Table 10. A camera will be installed to record instantaneous and totalizer readings at fixed 1-minute intervals for the duration of the test. The City’s flow meter is a McCrometer Water Specialties size 12" model MLo4-12 serial # 2007o716 re-calibrated 12-11-20 with +/- 2% accuracy. It is located inside the wellhouse approximately 15-feet south of Well No. 10.
7.2.2 Field Water Quality Parameter Collection Field water quality parameters will be collected using a YSI556 multi-probe meter and flow-through cell. The parameters will include temperature, pH, DO, ORP, turbidity, and specific conductance during the step-rate and constant-rate pumping periods. Field measurements will be used to help evaluate whether water quality is consistent over time or to help assess analytical variability, if reported.
Field measurements will be collected during step-rate and constant-rate testing at the frequency as follows during daylight hours:
• On an approximate 15-minute interval from 0 minutes to 1 hour. • On an approximate 30-minute interval from 1 hour to 2 hours. • On an approximate 1-hour interval from 2 hours to 8 hours.

QAPP: West Richland Phase 2a QAPP
Page 45
• Five times daily (roughly 6am, 10am, 2pm, 6pm, 10pm) for the remainder of the pumping period.
7.2.3 Groundwater and Source Water Quality Sample Collection Water quality samples will be collected for the water quality characterization suite or a subset of that list referred to as the geochemical suite of parameters as shown in Tables 5 and 11. Water quality sampling and analytical program is designed to collect:
• One source water quality sample from the City of Richland to verify source water chemistry for a full water quality suite. It is anticipated that City of Richland operations staff will identify a sampling location as close as possible to Well No. 10. The exact timing and location of sampling has yet to be determined. The sample location will be added to a planned site visit to examine the observation well network with Ecology staff.
• One pre-recharge groundwater sample on the final day of constant-rate pumping to assess pre-recharge water chemistry for a full water quality suite within the last 30 minutes of pumping.
• Two groundwater samples during the second two days of testing: general chemistry on day 2, and extended suite on day 3.
• One groundwater field duplicate of the geochemical suite collected on day 2 of the constant rate test.
7.3 Modeling and analysis design Geochemical compatibility analysis involves evaluating potential impacts on stored water quality and/or the aquifer storage zone hydraulic properties due to geochemical interactions to identify what processes may occur: mixing, mineral dissolution, or precipitation between 1) stored water and native groundwater; and 2) stored water and the aquifer matrix. Geochemical modeling will be performed using PHREEQC, Hydrogeochemist’s Workbench or similar program.
The compatibility analyses are typically performed using a geochemical model such as PHREEQC using site-specific water chemistry and aquifer mineralogy as model input. The stored water-native groundwater interaction modeling entails generating a range of hypothetical mixtures of the two end-members and calculating saturation indices for potential mineral phases to assess potential for precipitation within the mixing zone. For phases that become supersaturated during the mixing process, the model is used to calculate the maximum amount (mass and volume) of precipitate(s) that could form to assess the potential for aquifer clogging during the injection-storage cycle. The stored water-rock interaction modeling evaluates potential changes in stored water quality during the storage cycle by simulating the dissolution of basalt components using published kinetic rate laws for CRB dissolution. These analyses set expectations for potential water quality changes. The accuracy of water-rock interaction calculations will be addressed by assessing whether or not simulated processes are reasonable (i.e., consistent with other CRB studies) and consistent with site groundwater data.

QAPP: West Richland Phase 2a QAPP
Page 46
7.4 Assumptions underlying design The study area is not known to contain any specific or atypical challenges to achieving project goals or objectives. Several other projects have utilized treated drinking water with the Columbia River as a source and successfully stored and recovered that water without negative impacts. Our assumption is that this project will achieve a similar result and the design is specified by the requirements of Ch. 173-157 WAC. The current assumption is the existing geochemical data will be used to support the geochemical compatibility modeling needed.
It is assumed that ASR operations will increase some constituent concentrations above pre-recharge levels in the subsurface. This will clearly be the case with residual chlorine and disinfection byproducts that are present in drinking water though not expected to be present in a deep confined basalt aquifer. It is also likely that other constituents in treated drinking water are present at concentrations above pre-recharge groundwater, and there is a slight possibility that geochemical reactions in the subsurface could cause some concentrations to increase above pre-recharge levels. These increases are not expected to impair groundwater quality in the aquifer, though they would violate the state’s Antidegradation Policy. Consistent with the requirements of Ch. 173-157 WAC, an AKART analysis will be conducted to evaluate the feasibility and cost of treating source water as a means of compliance with the Antidegradation Policy. This analysis will be completed in accordance with Ecology’s Guidance for Aquifer Storage and Recovery AKART Analysis and Overriding Consideration of the Public Interest Demonstration, Publication No. 17-10-035 (Ecology 2017).
7.5 Possible challenges and contingencies Any possible challenges for Phase 2a testing could stem from normal issues encountered while conducting aquifer tests. These challenges could include unanticipated pump failure due to power outage or mechanical failure. If early termination of the pumping period occurs, we will collect recovery data as planned and then consult with Ecology on whether or not a second test attempt is needed.
It is possible that few properly constructed observation wells completed at similar depth to Well No.10 are available for monitoring. Of that subset, landowners may not provide permission to access their wells, or physical access may not exist. Available wells may be in-use as domestic wells, and consequently provide noisy data-sets difficult to interpret. There are no contingencies: well modifications and/or pump removal are not within the scope of this project.
7.5.1 Logistical problems The ability to develop an observation well network will be based on access to the City’s other wells and the ability to secure access agreements from individual well owners. The level of cooperation and physical access cannot be determined in advance of site visits. The project team will coordinate with Ecology for site visits.
An electronic water level sounder will not be lowered into wells with pumps installed unless physical access currently exists and the well owner reports that water levels have been measured successfully within the past year. The replacement costs for lost probes and removing pumps to retrieve broken cable are not included in the scope of this project.

QAPP: West Richland Phase 2a QAPP
Page 47
7.5.2 Practical constraints Because Well No. 10 predates this project, SEM and XRD analysis of weathered surfaces does not exist for this site and is unable to be obtained. However, enough nearby information exists to prepare a theoretical weathered surface chemical profile for evaluation of the potential for rock-water interactions. This will result in some uncertainty with respect to Phase 2a geochemical modeling results that will be addressed by Phase 2b Preliminary ASR test design.
7.5.3 Schedule limitations Based on the findings of the pumping system evaluation, conducting aquifer testing in the winter—ideally in March 2021—is recommended to limit potential system pressure changes and well interference that was observed during the summer months, which resulted in dynamic water level changes of around 1-foot in amplitude. Winter pressure changes are expected to be significantly reduced. No other schedule limitations are apparent at this time.

QAPP: West Richland Phase 2a QAPP
Page 48
8.0 Field Procedures 8.1 Invasive species evaluation This project is located on a property owned and developed by the City to contain the original Well 8 and associated infrastructure. The lot is gravel lined where not paved, and no evidence of any flora or fauna is apparent. No above-ground work is planned.
8.2 Measurement and sampling procedures The following subsections describe methods and procedures for Phase 2a aquifer testing, water quality sampling, flow rate measurements, water level measurements, and field parameters described in Section 7.0 Study Design. Specific Standard Operating Procedures (SOPs) are provided in Appendix D. The SOPs provided in Appendix D include the following:
• Aquifer Tests SOP (Appendix D-1) includes procedures for: o Step-rate Test o Constant-rate Test
• Groundwater Monitoring SOP (Appendix D-2) includes procedures for: o Use of pressure transduces and barometric pressure corrections o Manual water level measurements
• Environmental Sampling for Groundwater and Surface Water (Appendix D-3) includes procedures for:
o Equipment and site decontamination o General sample collection, preservation, shipping, and chain of custody o Total and dissolved metals sampling o Extractable Organic Sampling o VOC sampling; and o Bacteriological Sampling
Example field forms for well reconnaissance, aquifer test, recovery test collection are provided in Appendix E.
8.2.1 Aquifer Testing Pending Ecology approval of the observation well network, aquifer testing will be conducted in accordance with GeoEngineers the aquifer testing SOP. Ecology’s Water Resources Program guidance document Aquifer Test Procedures (Publication 20-11-093, October 2020) is also included and will be used as a reference. The testing sequence specific to Well No. 10 Phase 2a will be as follows:
• Thursday: Install Transducer, Baseline Day 0
• Friday: Step-Rate Test

QAPP: West Richland Phase 2a QAPP
Page 49
• Saturday: Baseline Day 1
• Sunday: Baseline Day 2
• Monday: Baseline Day 3
• Tuesday: Baseline Day 4
• Wednesday: Baseline Day 5
• Thursday: Baseline Day 6
• Friday: End Baseline on Day 7, Begin Pumping Day 1
• Saturday: Pumping Day 2
• Sunday: Pumping Day 3
• Monday: End Pumping Day 3, Begin Recovery Day 1
• Tuesday: Recovery Day 2
• Wednesday: Recovery Day 3
• Thursday: End Recovery Day 3 The days of the week were selected to ensure samples arrive at laboratories prior to weekends, and City staff are not required to work overtime/weekend days for start/stop.
• Step-Rate Testing. Four, 1-hour steps will be completed. Each step will target a previously determined valve position and rates will be verified with the flow meter. o Step 1 – close valve 26 turns from wide open, targeting 450 to 500 gpm o Step 2 – open ½ turn, targeting 700 gpm o Step 3 – open ½ turn, targeting 900 gpm o Step 4 – open remaining 25 turns, targeting the maximum flow, estimated to be 1,070 gpm
• Baseline Monitoring. Baseline monitoring will begin at the end of the step-rate test and continue for seven days.
• Constant-Rate Pumping. A 3-day (72-hour) constant-rate test will be conducted 24 hours post step-rate recovery. The goal is to pump approximately 1,000 gpm. The actual constant-rate will be selected based on step-rate test results. The pumping rate will be within the rate limit (Qi) associated with the City’s water right for this well. Data will be plotted and evaluated real time in the field to assess response at Well No. 10 and nearby observation wells. o Additionally, an Imhoff cone will be used to assess sand production within 30 minutes of
the onset of pumping. • Constant-Rate Recovery Monitoring. After the constant-rate test, recovery monitoring will
be conducted for at least 3 days (72-hours) or until 95% recovery at Well No.10 or other locations where response was observed.

QAPP: West Richland Phase 2a QAPP
Page 50
8.2.1.1 Water Level Monitoring A pressure transducer will be installed at Well No. 10 to collect pressure and temperature data. The SOP for water level monitoring is provided in Appendix D, D-2. This transducer will be an unvented Seametrics PT2X with a 300-psi range. Serial number 03210432. . Specifications are located here:
http://www.geotechenv.com/pdf/water_level_and_pressure/seametrics_pt2x.pdf.
A Seametrics BaroScout 5 psi barometric transducer will be installed onsite away from the influence of the building HVAC system. Serial number 21814064. Specifications are located here:
http://www.geotechenv.com/pdf/water_level_and_pressure/seametrics_baroscout.pdf
For the observation well network, two 30 psi Seametrics INW cableless Level Scouts will be installed at the Hawkins (147256) well and at MW-7(127086). Serial numbers are SN21814964 and SN02212586. Specifications can be located here:
http://www.geotechenv.com/pdf/water_level_and_pressure/seametrics_levelscout.pdf
The third observation well is owned by the Columbia Irrigation District (CID, ID #138691). This well has a functioning airline installed and no other water level access available. The City requested information on the air line setting from CID drilled but none is available. The well was drilled by the developer of the Polo Club in 1976 and operated by an HOA that no longer exists. The well was transferred to the CID over 10 years ago when a nearby irrigation LID was formed, but CID has not operated the well or removed the pump. Though the airline depth setting is unknown, it does appear to produce a reasonable depth to water, confirming its function. This assessment is based on the following:
• The well log shows a 5 gpm test with 20-feet of drawdown. The current pump column is 6-inches, indicating a pump capacity much greater than 5 gpm. To allow greater production, the pump intake would need to be set quite deep.
• The static water level in 1976 was reported to be 214 feet bgs. Water levels have not declined significantly at Well No.10, suggesting they may not have declined significantly at this location as well.
• The airline measurement made on April 8, 2021 showed a consistently repeatable maximum pressure 99.4 psi, or 229.6 feet of water above the base of the airline.
• If we assume that the airline is attached to the column 5-feet above the intake and the intake is set 10-feet above the bottom (488 ft bgs), then the static water level would be 244 feet bgs, around 29-feet different from the 1976 measurement. This appears to be a reasonable estimate sufficient to confirm the airline is functional.
Although the water level elevation at this location will remain unknown, analysis of the well response relies on changes from static (drawdown) which the airline can measure. Due to the lack

QAPP: West Richland Phase 2a QAPP
Page 51
of otherwise suitable and accessible wells, and the likely functioning airline, this location is recommended for inclusion in the observation network.
The transducers will be programed to take measurements as described in Tables 8 - 10. Depending on field observations, the project team may choose to increase the frequency of measurements. Transducer data will be compared to manual measurements to verify accuracy. All downloaded and logged data will be compiled and analyzed using appropriate analysis and spreadsheet software to detect and correct any errors.
• The pressure transducer files will be named to reflect the location (well), phase (baseline, step-test, constant-rate, and recovery), date (yyyymmdd), and time (24-hour) of the deployment (i.e., Well10-Baseline-202021215-1200).
Manual water level readings will also be collected Well No. 10 from a designated measuring point. Measuring point height above ground surface will be measured and recorded in the field logbook. Measuring point elevations will be measured with a hand-held GPS unit and that result compared to topographic maps to convert water levels to approximate elevation for comparison of water levels between wells. The GPS unit used will be a GPSMAP 60CSx SN10R-022491. This unit is reported to have an altimeter accuracy of +/- 10 ft with 1-ft resolution. It will be checked against a City benchmark near the site to assess precision. Combined with map evaluation, final accuracy is expected to be less than +/- 10 ft.
Water levels will be collected using an electronic water level sounder and recorded to the 0.01 foot. Manual water level measurements will be taken as described in Table10. Example field forms are provided in Appendix E. 8.2.1.2 Flow Rate Monitoring During Phase 1a, flow rates calculated using the totalizer readings appear to be more accurate than readings taken with the instantaneous dial (NWGS 2020b). The flow rate targets for the step-rate test will be approximately 500, 700, 900, and the pump maximum 1,070 gpm. Both instantaneous and totalizer flow meter readings will be recorded during the step-rate and constant-rate testing. The 72-hour previously determined maximum to-system flow rate for this pumping system will be within the Qi for the City’s water right associated with this well. Water will be delivered to the City’s supply system.
The existing totalizer flow meter (Water Specialties size 12-inch, Model MLo4-12, Serial No. 2007o716, recalibrated 12-11-20) will be utilized at Well No. 10.
8.2.1.3 Field Parameter Water Quality Parameters Field water quality parameter measurements will be recorded with a calibrated field instrument during the step-rate and constant-rate pumping periods. These will include temperature, pH, conductivity, dissolved oxygen (DO), oxidation/reduction potential (ORP), turbidity, and specific conductance. A YSI 556 (or similar) will be calibrated daily according to the instrument user’s manual. Calibration information will be recorded in the field logbook to document instrument performance. Field parameters recorded during the test will have an accurate date/time stamp to ensure accurate correlations with other test measurements.
QAPP: West Richland Phase 2a QAPP
Page 52
• Temperature will be reported to the nearest 0.01°C • pH will be measured and reported to the nearest 0.01 • DO will be measured and reported to the nearest 0.01 milligram per liter (mg/L) • ORP will be measured and reported to the nearest 0.01millivolt (mV) • Turbidity will be measured with a Lamont 20/20 WE, or similar capable of report to the nearest
0.05 Nephelometric Turbidity Unit (NTU).
If a field parameter measurement appears anomalous, the field hydrogeologist will repeat the measurement. If the result remains suspect, the instrument will be recalibrated. If the measurement remains consistent after recalibration, the measurement will be documented, and the results communicated to the Project Manager.
8.2.1.4 Groundwater and Source Water Quality Sample Collection A source water quality sample from the City of Richland will be collected for the expanded water quality suite. The sample will be collected at Richland’s intertie booster station as shown in Figure 4. The City’s engineering team has determined that this location is the closest point to Well No. 10that will also produce a sample representative of water that would be delivered during recharge.
During constant-rate testing, one sample will be collected for the geochemical suite on day 2 of pumping, and a duplicate sample will be collected at that time (shown in Tables 5 and 11). A second geochemical suite is included as a subset of the extended suite sample that will be collected on Day 3, as shown in Table 5. This sample will represent the pre-recharge groundwater characterization sample. One field duplicate will be collected for a subset of total metals for field QC.
This data and information will be compiled as the results are received from the laboratory and evaluated by the project team. If exceedances of water quality criteria are observed Ecology will be notified.
8.3 Containers, preservation methods, holding times Water sample containers, preservatives, trip blank, and sample coolers will be provided by the analytical laboratory. Sample container type, volume requirements, preservation requirements, and hold times are listed by analytical category in Table 12.
Water quality samples will be shipped on ice and coolers secured with a custody seal on the outside, with signature and date provided by the attending field hydrogeologist.

QAPP: West Richland Phase 2a QAPP
Page 53

QAPP: West Richland Phase 2a QAPP
Page 54
8.4 Equipment decontamination The objective of decontamination procedures is to minimize the potential for cross contamination between sample locations. To the extent possible dedicated sampling equipment will be used. All non-dedicated sampling equipment (in contact with sample) will be thoroughly cleaned prior to each sampling event to prevent cross-contamination between samples and to ensure accurate representation of analytes of interest in each sample interval. The decontamination procedures for water quality sampling equipment and the bottom 5 feet of water level probes are as follows:
• Wash until free of visible debris (if any) and rinse with tap water. • Rinse with tap water. • Wash with non-phosphate detergent solution (Liquinox® and potable tap water). • Rinsed with distilled water.

QAPP: West Richland Phase 2a QAPP
Page 55
8.5 Sample ID Sample nomenclature identification is described as follows:
• For source (injection) water (IW) the sample will be identified by: Sample location, IW, sample date and time. For example, a sample taken from Intertie injection water on December 15, 2020 at 9:00 will be: Intertie-IW-20201215-0900.
• Each groundwater (GW) sample will be identified by: Well name, GW, sample date (in the format YYYYMMDD), depth of pump intake (at 365 ft below ground surface). Example: Well10-GW-20201215-365.
• Field duplicate samples will be identified by adding 50 to the sample number. For example, a duplicate of the Well No. 10 GW sample taken above would be labeled: Well60-GW-20201215-365.
Each sample bottle label will also identify the sampler, date, time, and preservative.

QAPP: West Richland Phase 2a QAPP
Page 56
8.6 Chain of custody Samples are in custody if they are: 1) in the custodian’s possession or view; 2) in a secured location (under lock) with restricted access; or 3) in a container that is secured with an official seal(s) so that the sample cannot be reached without breaking the seal(s).
Chain-of-custody (COC) procedures will be followed for all samples throughout the collection, handling, and analysis process. The COC document used to track possession and transfer of samples is the laboratory-provided COC form. Each sample will be represented on a COC form the day it is collected. All data entries will be made using an indelible-ink pen. Corrections will be made by drawing a single line through the error, writing in the correct information, then dating and initialing changes. Blank lines and spaces on the COC form will be lined-out and dated and initialed by the individual maintaining custody.
A COC form will accompany each cooler of samples to the analytical laboratories. Each person who has custody of the samples will sign the COC form and ensure that the samples are not left unattended unless properly secured. Copies of all COC forms will be retained in the project files and provided in the laboratory report.
8.7 Field log requirements A project-dedicated field notebook will record field documentation and to record hydrogeologists’ daily activities at the well site. Additional field documentation will consist of laboratory-specific COC forms and well-specific water level data sheets for monitored wells. Corrections will be made by drawing a single line through the error, writing in the correct information, then dating and initialing changes.
The daily field log is intended to provide sufficient information to enable readers to reconstruct events that occurred during field activities. Examples of recorded information include, but are not limited to field personnel on-site, weather conditions, complications encountered, field communications, and other general details associated with the testing and sampling effort. At a minimum, the following information will be included in the project-dedicated field notebook:
• Names of the field hydrogeologist(s) and person(s) on site. • Sample ID, as appropriate. • Date and time of water measurements and estimated water production. • Observations during sample collection including date and time, weather conditions,
complications, communications, and other details associated with the sampling effort. • Any deviations from the approved sampling plan. In addition, water levels, system pressure, flow rate, and field parameter measurements and any other relevant observations will be recorded.
8.8 Other activities – Water Management Water pumped from Well No. 10 will be delivered to the City’s existing water supply system for consumptive use. This was approved in the meeting on November 9, 2020.

QAPP: West Richland Phase 2a QAPP
Page 57
9.0 Laboratory Procedures 9.1 Laboratory procedures table The anticipated sample count is listed in Table 13. Tables 6 and 11 present anticipated water quality analyte list, analytical method, MDLs, and RLs. Tables 6 and 11 also include field water quality parameters.
Table 13. Laboratory methods summary
Analytes Sample Matrix Samples Methods and Details
Water Quality Characterization Analytical Suite
Source Water 1 Table 6 Pre-recharge Groundwater
Quality 1 Table 6
Geochemical Suite Groundwater 1 Tables 6 and11 Duplicate Geochemical Suite Groundwater 1 Tables 6 and 11
9.2 Sample preparation method(s) Water quality samples will be collected as described above in Section 8.0. The sample preparation will be conducted in accordance with applicable method requirements by an accredited lab. Methods are listed in Tables 6, 7, and 11.
9.3 Special method requirements Water quality samples will be collected as described above in Section 8.0.
9.4 Laboratories accredited for methods An environmental laboratory accredited for drinking water analysis by Ecology Lab Accreditation Program will be used as the primary laboratory. Anatek Labs, Inc. (Anatek), Ecology Laboratory No. C595, EPA Lab ID: WA00169, is anticipated to be the prime laboratory for the Phase 2a geochemical and full water quality analytical program. Their address is:
• Anatek Labs, Inc. 504 East Sprague Avenue, Suite D, Spokane, Washington 99202, 509.838.3999
The primary laboratory will provide a majority of the proposed analytical testing; however, the primary laboratory may subcontract analytical work to other accredited laboratories as needed to complete the analytical program list. No single, customarily utilized Washington Drinking Water-certified laboratory can complete the analytical program listed in WAC 173-200. In this case, we will coordinate with the lab to aid in meeting hold times. For example, samples could be shipped directly to the subcontracting laboratory. The primary laboratory will provide all groundwater and injection water sample containers, container preparation, preservatives, trip blank(s), and coolers to ship samples.

QAPP: West Richland Phase 2a QAPP
Page 58
10.0 Quality Control Procedures Analytical samples shall be subject to quality control (QC) measures both in the field and laboratory. This section describes the various QA/QC samples that will be collected in the field and analyzed in the laboratory and the frequency at which they will be performed.
10.1 Field Quality Control Field QC serves as a control and check mechanism to monitor the consistency of sampling methods and the influence of potential off-site factors on environmental samples. Field QC will include the following:
• Reviewing field notes/logs for completeness, errors, and consistency. • Preventive maintenance measures and equipment calibration. All measuring and test
equipment used in the sampling activities that affect the quality of the analytical data shall be maintained and calibrated as specified in their respective manuals. Any non-conforming conditions identified during maintenance, calibration, and/or data collection will be documented in the field log.
• Electronic water level data will be downloaded and compared to manual measurements to verify the instruments are working properly. Manual measurements will be repeated to ensure accuracy. All downloaded and logged data will be compiled and analyzed using appropriate analysis and spreadsheet software to detect and correct any errors.
• Water quality samples will be collected during the constant-rate test. Field QC for these samples will focus on field duplicates and trip blanks, as follows:
• Field duplicates serve as measures for precision. Under ideal field conditions, field duplicates are created when a second sample of the same volume as the primary sample is placed in a separate container and identified with a unique sample number that does not specify it as a duplicate sample. This will test both the precision of the laboratory analytical procedures and methods, and the consistency of the sampling techniques used by field personnel. One field duplicate will be collected for the geochemical suite during the aquifer test.
• Trip blanks accompany VOC samples during shipment and sampling periods. Trip blanks will be analyzed on a one per cooler basis.
10.2 Laboratory Quality Control At the laboratory, data quality indicators will be evaluated by the proper handling of the samples, the use of standard procedures for sample analyses. Table 5 references the analytes of interest for this investigation to the standard reference methods. MDLs for analytes in water samples are provided and shall be established as contractual requirements between NWGS/GeoEngineers and the subcontracted analytical laboratory. The subcontracted laboratory is responsible for implementing the analytical methods selected, documenting through Standard Operating Procedures modifications (if any) to the methods and providing these documents for review upon request. Any changes to the method number selected for analysis and identified in Table 5 must

QAPP: West Richland Phase 2a QAPP
Page 59
first be brought to the attention of the Project Manager in writing before analysis can begin. These requirements will vary by method but generally include:
• Method blanks; • Internal standards; • Calibrations; • MS/matrix spike duplicates (MSD); • Lab Control Standards (LCS); • Laboratory duplicates; and • Surrogate spikes. Laboratories will be responsible for their respective laboratory QA plans and procedures. Calibration of analytical laboratory equipment shall be in accordance with the laboratory's internal procedures. Appendix F presents Anatek’s Quality Assurance Plan.
10.3 Corrective action processes Variations from established field procedure requirements may be necessary in response to field conditions encountered during sampling activities. Field team personnel are authorized to implement non-substantive variations based on immediate need, provided that the Project Manager is notified prior to the deviation, and it is noted in the field log. If the variation is unacceptable, the activity shall be repeated, or other corrective action taken as indicated. A copy of the field log will be included with all field reports.
The analytical laboratory shall notify the Project Manager immediately if sample integrity has been compromised; holding times have been exceeded; or other nonconforming conditions are identified by the laboratory. The laboratory, however, will carry out corrective action procedures as required by its internal laboratory QA plan and make every effort to maintain sample integrity and obtain the best analytical results practicable.

QAPP: West Richland Phase 2a QAPP
Page 60
11.0 Data Management Procedures 11.1 Data recording and reporting requirements This section presents an overview of the procedures that will be used to manage monitoring and analysis data. The field hydrogeologist will maintain the data collected to be used for generating reports and for use in data evaluation and future permitting.
The Environmental Information System (EIM) Study ID for this project is WROCR-2018-004.
11.2 Laboratory data package requirements Field forms will be reviewed by the Project Manager to ascertain that samples were collected and analyzed in accordance with the approved QAPP. Data packages provided by the analytical laboratory will be expected to include the following information:
• Sample receipt “condition found” record, noting dates of sample receipt; chain-of-custody and shipping documentation including identification of field sampling personnel, and shipping personnel (or organization);
• Copies of completed chain-of-custody forms; • Sampling and analysis dates; • Test methods; • Reporting limits; • Detection limits; • A QA/QC summary and documentation of any discrepancies that may have affected the
reported measurements; and
Laboratory reports will be reviewed to ensure that analytical holding times were not exceeded and that the results for field duplicate samples are valid. Questionable, poor quality, or unusable data will warrant immediate action by the Project Manager, which may involve re-calibration of field instruments and re-sampling or reanalysis of samples.
All data packages for all analytical parameters shall be reviewed and approved by the analytical laboratory's QA Officer.
11.3 Electronic transfer requirements Analytical laboratories will be required to submit electronic data deliverable (EDD) for each analytical report.
11.4 EIM/STORET data upload procedures Analytical results compatible with Ecology’s EIM system will be uploaded.

QAPP: West Richland Phase 2a QAPP
Page 61
11.5 Model information management Analytical laboratory results and aquifer test data analyses will be managed in Excel. Data inputs and outputs for the geochemical compatibility modeling will be documented in an appendix to the Phase 2a report. The volume of data produced in this phase of work does not require special procedure, control, or documentation.
QAPP: West Richland Phase 2a QAPP
Page 62
12.0 Audits and Reports 12.1 Field, laboratory, and other audits No formal audits are planned; however, auditing activities will take place throughout the tasks described in this Phase 2a QAPP and data will be reviewed for quality control. A simple technical systems review of the field and laboratory quality control procedures during early data collection will be performed. Licensed hydrogeologists will review fieldwork products by staff under their supervision. Any data exceptions will be resolved via correspondence between the two staff and corrective actions documented. Project analytical laboratories will supply quality assurance for project laboratory analyses.
The licensed hydrogeologist will review work products after the tasks are complete including after the step rate test, after the constant rate test, and after completion on the geochemical compatibility modelling.
Analytical data audit for quality control will reviewed upon receipt of data package, so that data exceptions can be resolved with field staff or with the laboratory as needed.
Internal reviews will also take place before the submittal of the final report.
12.2 Responsible personnel The QA/QC Coordinator will conduct an audit of analytical results, as necessary. The PM will conduct an audit of field data, as necessary.
12.3 Frequency and distribution of reports Phase 2a work will be incorporated into the Phase 2a Report. The Phase 2a Report will utilize available information, test results, and assumptions to develop the content as described in the Ecology-approved Well No. 10 ASR Implementation Plan City of West Richland, Washington (NWGS 2020a).
12.4 Responsibility for reports Phil Brown, Northwest Groundwater Services
Brad Bessinger, SSPA
Alex Fazzari, J-U-B Engineers, Inc.
Kevin Lindsey, GeoEngineers, Inc.
Laura Hanna, GeoEngineers, Inc.
Alicia Candeleria, GeoEngineers, Inc.

QAPP: West Richland Phase 2a QAPP
Page 63
13.0 Data Verification 13.1 Field data verification, requirements, and responsibilities Field data will be reviewed at the end of each day by the PM, following the quality control checks outlined below and procedures in this Phase 2a QAPP. Field data documentation will be checked against the applicable criteria as follows:
• Sample collection information • Field instrumentation and calibration • Climate and precipitation information • Sample collection protocol • Sample containers, preservation, and volume • Field QC samples collected at the frequency specified • Sample documentation and COC protocols • Sample shipment
Shipping container receipt forms and sample condition forms provided by the laboratory will be reviewed for out-of-control incidents. The final report will contain what effects, if any, an incident has on data quality. Sample collection information will be reviewed for correctness before inclusion in a final report.
13.2 Laboratory data verification The data validation will be performed by the QA/QC Coordinator to determine if the MQOs have been met. Data validation will include reviewing laboratory reports for data quality exemptions and review of surrogates, matrix spike/matrix spike duplicates, duplicates and blank data. Data validation will also include reviewing field reports for procedures that might affect laboratory results; reviewing hold times relative to extraction and analysis times; and estimating data quality relative to data quality objectives. Questionable, poor quality, or unusable data will warrant immediate action by the QA/QC Coordinator, which may involve re-calibration of field instruments and re-analysis of samples. The laboratory data assessment will consist of a formal review of the following QC parameters:
• Holding times; • Method blanks; • MS/MSD; • LCS; • Surrogate spikes; and • Replicates.

QAPP: West Richland Phase 2a QAPP
Page 64
In addition to these QC mechanisms, other documentation such as cooler receipt forms and case narratives will be reviewed to fully evaluate laboratory QA/QC. For the list of anticipated levels see Table 6.
13.3 Validation requirements, if necessary Not applicable. The data to be generated from this field effort will small enough to not warrant validation.
13.4 Model quality assessment A predictive geochemical model calibrated to site data will not be generated during Phase 2a. Instead, geochemical modeling will consist of simulating potential chemical processes during mixing using reported chemical data. In this context, model accuracy primarily depends on correct data entry into the model. Model inputs will be reviewed internally prior to modeling.
The model used to complete the geochemical compatibility modeling is a well-known widely accepted industry-standard tool.
13.4.1 Calibration and validation Not applicable as the geochemical model will utilize existing data and data generated as part of this Phase 2a QAPP. 13.4.1.1 Precision Not applicable as the geochemical model will utilize existing data and data generated as part of this Phase 2a QAPP.
13.4.1.2 Bias
With respect to modeling potential water-rock interactions, model accuracy (bias) depends on simulating the correct mineral interactions for Columbia River Basalt. Selected minerals and dissolution rates for model simulations will be based on reported studies conducted in other Columbia River Basalt. Further evaluation of the accuracy of predictions will not be performed during Phase 2a.
13.4.1.3 Representativeness Not applicable as the geochemical model will utilize existing data and data generated as part of this Phase 2a QAPP.
13.4.1.4 Qualitative assessment Quality assurance will consist of manual verification of input to ensure no transcription errors are made.
13.4.2 Analysis of sensitivity and uncertainty Not applicable as the geochemical model will utilize existing data and data generated as part of this Phase 2a QAPP.

QAPP: West Richland Phase 2a QAPP
Page 65
14.0 Data Quality (Usability) Assessment
14.1 Process for determining project objectives were met The data collected covered under this Phase 2a QAPP will be used to further evaluate aquifer hydraulic characteristics and assess potential geochemical reactions between injected water and native groundwater and stored water and the aquifer matrix. The data quality, or usability, assessment will be done by the Project Manager to evaluate if sufficient usable data was collected and if these data can be relied on to evaluate aquifer physical parameters and assess geochemistry conditions under these field tests. If the data is determined to be usable, the project team will use it to evaluate the feasibility of ASR in this well, at this location, using source water. If the project team determines that ASR appears to be feasible a recommendation to move forward with Phase 2b will be made.
14.2 Treatment of non-detects Non-detects will be reported as non-detect or at the specified reporting limit if an analytical result is necessary for the purposes of the geochemical modeling.
14.3 Data analysis and presentation methods No special data analysis or presentation tools are required for this phase of the project. Laboratory results will be tabulated, field data will be presented in appendices, and compiled into time-series arithmetic and semi-log plots for analysis using Excel or AQTESOLV©.
14.3.1 Aquifer Test Analysis and Interpretation During aquifer testing, data analysis will begin to assess aquifer properties in the field. The following subsections describe how data will assess aquifer properties. 14.3.1.1 Field Evaluation of Aquifer Test Data The step-rate test will be used to estimate well efficiency by calculating the specific capacity for each step. Specific capacity is the discharge (pumping rate) divided by the drawdown observed in the well This will then be used to get an estimate of transmissivity using the Driscoll (1986) or Theis (1935). In addition to estimates of transmissivity, well losses will be estimated by comparing measured drawdown for the well against the predicted drawdown for the well via Cooper-Jacob (1946).
Hydraulic response interpretation generally begins with the traditional Theis (1935) confined non-leaky non-equilibrium equation and associated well function. Its more common simplified form, the Cooper-Jacob (1946) solution, allows drawdown trends to be identified on semi-logarithmic plots, and readily analyzed to yield apparent values of transmissivity and storativity for the aquifer (if a properly constructed responding observation well is available). These traditional solutions will be the starting point for initial aquifer test analysis and interpretation in the field during the testing program. The shape and pattern(s) of the aquifer response will be compared to diagnostic log-log, and semi-log plots for various types of aquifer models. If unused observation wells are

QAPP: West Richland Phase 2a QAPP
Page 66
established as part of the monitoring network, estimates of the anticipated response to pumping at those wells will be developed using the Theis equation. These simplified evaluations will help the project team decide if the aquifer test will be extended to observe responses at nearby observation wells.
14.3.1.2 Aquifer Test Interpretation One of the potential limiting factors for ASR feasibility is the presence of flow-limiting or negative boundaries and/or connection to surface water bodies near the test area. These conditions will be assessed using diagnostic plots to identify the appropriate analytical solutions that best match the observed response. These methods may identify spatial heterogeneity, variability in aquifer properties, compartmentalization of the target aquifer and other factors that could influence the assessment of ASR feasibility. More advanced methods of aquifer test analysis will be applied to the interpretation of the individual aquifer tests based on the semi-log, log-log diagnostic plot evaluation, and AQTESOLV, as necessary.
14.3.1.3 Data Correction and Processing Data processing and data correction may be needed to remove potential effects on observed water levels from artifacts of the aquifer test operation or other external influences. Variations in flow rate or interruptions in the aquifer test are the most common problem in aquifer test data collection. A constant pumping rate is a fundamental assumption in most aquifer analytical solutions. As variations in the system pressure changes resulted in dynamic water level changes of approximately 1 foot in the summer (NWGS 2020b), it is anticipated that the drawdown data will either be normalized, or a variable rate test method would be used to analyze the test if fluctuations inhibit assessment of aquifer response. Observation wells will improve the diagnostic value of the aquifer test, limiting the influence of the pressure response and may be used to assess transmissivity and boundary conditions. Antecedent (baseline) water levels will be compared to barometric pressure data. An unvented transducer will be used in Well No.10, and if the well exhibits 100% barometric efficiency, barometric response is not expected to be registered by the sensor. If it is determined that it is necessary to correct the data in order to determine whether an antecedent trend is present, or improve the precision of the slope calculation, barometric efficiency will be determined through linear regression, and applied to the antecedent data set. Similarly, if baseline monitoring shows barometric response in sensor data, pumping period water levels will be evaluated to assess whether correction is needed to better define any changes in slope or otherwise improve evaluation of test response. Data corrections and the order that they are applied will be documented as part of the aquifer test analysis and interpretation process.
14.3.2 Geochemical Compatibility Data Analysis Geochemical compatibility data analysis will first involve geochemical mixing modeling. Model input will include the chemistry of representative groundwater and recharge water samples. The model will then predict: 1) the chemistry of hypothetical mixtures (0 to 100% recharge water); and 2) saturation indices for potential mineral phases (to assess potential for precipitation within the mixing zone). For phases that become supersaturated during the mixing process, model results will be used to calculate the maximum amount (mass and volume) of precipitate(s) that could form to assess the potential for aquifer clogging during the injection-storage cycle.

QAPP: West Richland Phase 2a QAPP
Page 67
Geochemical compatibility data analysis will also involve geochemical water-rock interaction modeling. In this case, representative recharge water will be reacted with a theoretical mineral assemblage based on other reported studies for the Columbia River Basalt. The model will then predict changes in recharge water quality and aquifer chemistry over time.
14.3.3 AKART Data Analysis One sample of source water will be collected from the City of Richland water distribution system nearby Well No. 10. This source water data will be compared to existing groundwater quality at Well No. 10 and with existing groundwater quality standards to identify constituents in the source water that may violate the Antidegradation policy, and identify any additional data needed to complete the analysis.
For the AKART, data analysis will be in accordance with Ecology’s Guidance for Aquifer Storage and Recovery AKART Analysis and Overriding Consideration of the Public Interest Demonstration Publication no. 17-10-035 (2017). The analysis will:
• Compare project source water quality to ground water standards (WAC 173-200-040); • Identify any data gaps; • Evaluate the comparability of water treatment plant samples to distal distribution system water
quality samples. • Evaluate existing water quality information from City records and assess whether seasonal
variability (during the anticipated recharge season) will require additional source water characterization, and;
• Identify any constituents that exceed pre-recharge groundwater water quality. • Geochemical Compatibility modeling will: • Evaluate the potential for water-water and rock-water interactions; • Assess potential of metal leaching in the aquifer. • Estimate recovered water quality and compare that to drinking water standards; • Assess the potential for down gradient changes in water quality. • Identify any changes in pre-recharge or groundwater criteria exceedances, including those
caused by the introduction of oxygenated water in the aquifer. • Assess the time-dependency/persistence of contaminants introduced and water quality changes
in the aquifer.
14.4 Sampling design evaluation The proposed sampling associated with this Phase 2a QAPP should meet objectives described in Section 4.2., and the requirements of Ch. 173-157 WAC.
14.5 Documentation of assessment Usability will be discussed in the draft and final Phase 2a report.

QAPP: West Richland Phase 2a QAPP
Page 68
15.0 References Burns, E.R., Morgan, D.S., Peavler, R.S., and Kahle, S.C. 2011. “Three-dimensional model of the
geologic framework for the Columbia Plateau Regional Aquifer System, Idaho, Oregon, and Washington.” U.S. Geological Survey Scientific Investigations Report 2010-5246, 44p.
City of West Richland (City) and J-U-B. 2017. Water System Plan Update. City of West Richland. # 94900P. Prepared by City of West Richland and J-U-B Engineers. March.
Cooper, H.H. and C.E. Jacob, 1946. A generalized graphical method for evaluating formation constants and summarizing well field history, Am. Geophys. Union Trans., vol. 27, pp. 526-534
Department of Ecology (Ecology), 2017. Guidance for Aquifer Storage and Recovery AKART Analysis and Overriding Consideration of the Public Interest Demonstration. Publication No. 17-10-035. November. https://apps.ecology.wa.gov/publications/documents/1710035.pdf
Driscoll, F.G., 1986, Groundwater and Wells, Second Edition: Johnson Filtration Systems, Inc. GeoEngineers, Inc. (GeoEngineers) and Northwest Groundwater Services, LLC. (NWGS). 2018a.
Quality Assurance Project Plan Ecology Grant No. WROCR-2018-WeRiPW-00004 City of West Richland Phase 1a: Well No. 10 Assessment. City of West Richland, Washington. December 12.
GeoEngineers and NWGS. 2018b. Phase 1 Aquifer Characterization Combined Quality Assurance Project Plan and Sampling and Analysis Plan. City of Quincy, Washington. November 20.
GWMA. 2009. “Geologic framework of selected sedimentary and Columbia River Basalt Group units in the Columbia Basin Ground Water Management Area of Adams, Franklin, Grant, and Lincoln Counties, Washington, Edition 3.” Consultant report prepared for the Columbia Basin Ground Water Management Area of Adams, Franklin, Grant, and Lincoln Counties, Washington, prepared by GSI Water Solutions, Inc. and the Franklin County Conservation District, June 2009.
GWMA. 2011. “Geologic framework of selected sedimentary and Columbia River Basalt Group units in the Columbia Basin Ground Water Management Area of Adams, Franklin, Grant, and Lincoln Counties, Washington, Edition 4.” Consultant report prepared for the Columbia Basin Ground Water Management Area of Adams, Franklin, Grant, and Lincoln Counties, Washington, prepared by GSI Water Solutions, Inc. and the Franklin County Conservation District, June 2011.
Hoselton, A. 2020. Technical Memorandum. Technical Discussion of Application G4-35203 for the City of West Richland, WRIA 37, Benton County, Washington. March 29.
J-U-B Engineers, Inc. (J-U-B). 2006. Project Report Well No. 10 Pump and Building. City of West Richland, West Richland, Washington. October.

QAPP: West Richland Phase 2a QAPP
Page 69
Lombard, S. and C. Kirchmer, 2004. Guidelines for Preparing Quality Assurance Project Plans for Environmental Studies. Revised December 2016. Washington State Department of Ecology, Olympia, WA. Publication No. 04-03-030. https://fortress.wa.gov/ecy/publications/SummaryPages/0403030.html
NWGS and GeoEngineers. 2019. Phase 1a: Well No. 10 Condition Assessment Report. City of West Richland, Washington. Ecology Grant No. WROCR-2018-WeRiPW-00004. October 18.
NWGS. 2020a. Well No. 10 ASR Implementation Plan. City of West Richland, Washington. March 25, 2020. Amended June 18, 2020.
NWGS. 2020b. Well No. 10 ASR Well Rehabilitation and Pumping System Evaluation. City of West Richland. November 9.
NWGS. 2020c. City of West Richland Well #10 Proposed Water Quality Analytical Compliance Discussion. Request for Analytical Waiver for Phase 2a Quality Assurance Project Plan. December 7.
Reidel, S.P., Johnson, V.G., and Spane, F.A. 2002. “Natural Gas Storage in Basalt Aquifers of the Columbia Basin, Pacific Northwest USA: A Guide to Site Characterization.” Pacific Northwest National Laboratory, Richland, Washington.
Reidel, S.P., Tolan, T.L., 2010. “Preliminary Hydrogeologic Assessment of the Availability of Saddle Mountains Basalt Groundwater Within the Richland Subbasin.” Prepared for Washington State Department of Ecology on behalf of City of West Richland, WA. GSI Water Solutions, Inc., Kennewick WA.
Reidel, S.P., Camp, V.E., Tolan, T.L., and Martin, B.S. 2013. “The Columbia River flood basalt province: Stratigraphy, aerial extent, volume, and physical volcanology,” in The Columbia River Flood Basalt Province. Reidel, S.P., Camp, V.E., Ross, M.E., Wolff, J.A., Martin, B.S., Tolan, T.L., and Wells, E.E., eds., Geological Society of America Special Paper 497, p. 1-43.
Swanson, D.A., Anderson, J.L., Bentley, R.D., Camp, V.E., Gardner, J.N., and Wright, T.L. 1979. “Reconnaissance Geologic Map of the Columbia River Basalt Group in Washington and adjacent Idaho.” U.S. Geological Survey Open-File Report 79-1363, scale 1:250,000.
Theis, C.V., 1935. The relation between the lowering of the piezometric surface and the rate and duration of discharge of a well using groundwater storage, Am. Geophys. Union Trans., vol. 16, pp. 519-524.
Tolan, T.L., Reidel, S.P., Beeson, M.H., Anderson, J.L., Fecht, K.R., Swanson, D.A. 1989. “Revisions to the Estimates of the Aerial Extent and Volume of the Columbia River Basalt Group, in Volcanism and Tectonism in the Columbia River Flood-Basalt Province.” Special Paper 239, edited by Reidel, S.P and Hooper, P.R., pp. 1-20, Geological Society of America, Boulder, Colorado.
Washington State Legislature. Chapter 90.48. Revised Code of Washington (RCW). Water Pollution Control.

QAPP: West Richland Phase 2a QAPP
Page 70
Washington State Legislature. Chapter 90.54. RCW. Water Resources Act of 1971.
Washington State Legislature. Chapter 173-157 Washington Administrative Code (WAC). Underground Artificial Storage and Recovery.
Washington State Legislature. Chapter 173-200 WAC. Water Quality Standards for Groundwaters of the State of Washington.
Washington State Legislature. Chapter 246-290-210 WAC. Maximum Contamination Levels (MCLs) and Maximum Residual Disinfectant Levels (MRDLs).


![Phase II Training Briefed By [CA insert name] For Quality Assurance Personnel](https://img.dokumen.tips/doc/110x75/56649d955503460f94a7e6f6/phase-ii-training-briefed-by-ca-insert-name-for-quality-assurance-personnel.jpg)


