Embed Size (px)
Citation preview

EPAR8 Phase 2 QAPP: Libby, MT March, 2001
Phase 2 Sampling and Quality Assurance Project Plan Revision 0
For Libby, Montana
Environmental Monitoring for Asbestos
Evaluation of Exposure to Airborne Asbestos Fibers
During Routine and Special Activities
PROI
On Scene Coordinator: Paul Peronard , OSC 8EPR-PAER
Science Support Coordinator: Chris Weis, Ph.D., DABT 8EPR-PS

EPA R8 Phase 2 QAPP: Libby, MT March, 2001
DOCUMENT REVISION LOG
Revision Date Major Changes
0 03/01/01 ~

EPAR8 Phase 2 QAPP: Libby, MT
TABLE OF CONTENTS
March, 2001
A. PROJECT MANAGEMENT 1 A4. PROJECT/TASK ORGANIZATION 1 A5. PROBLEM DEFINITION and BACKGROUND 2 A6. PROJECT/TASK DESCRIPTION 4 A7. QUALITY OBJECTIVES AND CRITERIA FOR MEASUREMENT DATA 4
B. MEASUREMENT/DATA ACQUISITION . 10 B1. SAMPLING PROCESS DESIGN 10
B1a. Environmental Samples 11 B1b. Housing Characteristics .18 B1c. Documentation of Activities 18
B2. SAMPLING METHODS REQUIREMENTS 19 B3. SAMPLE DOCUMENTATION, HANDLING AND CUSTODY
REQUIREMENT 21 B4. ANALYTICAL METHODS REQUIREMENTS . 23 B5. QUALITY CONTROL 26 B6. INSTRUMENT CALIBRATION and FREQUENCY 28 B7. DATA MANAGEMENT . 28
C. ASSESSMENT AND OVERSIGHT 29 C1. ASSESSMENTS AND RESPONSE ACTIONS 29 C2. REPORTS TO MANAGEMENT 29
D. DATA VALIDATION AND USABILITY 30 D1. DATA REVIEW, VERIFICATION, and VALIDATION 30 D2 . VERIFICATION AND VALIDATION METHODS 30 D3. RECONCILIATION with DQOs 33
E. REFERENCES 34
LIST OF TABLES
TABLE B-1 SUMMARY OF PHASE 2 SAMPLING DESIGN 36 TABLE B-2 SUMMARY OF QC AND RELATED SAMPLES 37
LIST OF FIGURES
FIGURE B-1 AIR SAMPLING MANAGEMENT FLOW DIAGRAM-SCENARIO 1 ... 38 FIGURE B-2 AIR SAMPLING MANAGEMENT FLOW DIAGRAM-SCENARIO 1 ... 39 FIGURE B-3 AIR SAMPLING MANAGEMENT FLOW DIAGRAM-SCENARIO 1 ... 40 F IGURE B-4 A IR SAMPLING MANAGEMENT FLOW DIAGRAM-SCENARIO 1 . . . 41
EPAR8 Phase 2 QAPP: Libby, MT March, 2001
APPENDICES
APPENDIX AFIELD DATA SHEETS . A1
APPENDIX BSTANDARD OPERATING PROCEDURES B1
APPENDIX C LABORATORY DATA SHEETS ..... C1
APPENDIX D RESIDENTIAL ACTIVITY LOG D1
APPENDIX ECHAIN OF CUSTODY FORM . E1
APPENDIX F STATISTICAL COMPARISON OF TWO POISSON RATES ... F1
APPENDIX G CALCULATION OF TARGET DETECTION LIMITS G1

EPAR8 Phase 2 QAPP: Libby, MT March. 2001
A. PROJECT MANAGEMENT
A4. PROJECT/TASK ORGANIZATION
Project Directors
This project is being planned and funded by the U. S. Environmental Protection Agency (EPA), Region 8. The following individuals are the EPA project directors with overall responsibility for the design and conduct of this project, and will be the principal data users and decision makers:
Paul Peronard On-Scene Coordinator (Primary Contact) Libby, MT Response
Due Nguyen (Secondary Contact) On-Scene Coordinator Libby, MT Response
Doug Skie, Director Emergency Response Program Ecosystems Protection and Remediation
Christopher P. WeiS, PhD, DABT Regional Toxicologist Scientific Support Coordinator for the Response Ecosystems Protection and Remediation
Aubrey Miller, MD, MPH. Medical Coordinator for Environmental Emergencies and Hazards U.S. Public Health Service Region 8 and USEPA Region 8
Project Managers X
Responsibility for implementation of the tasks specified in this project Plan has been assigned to the U.S. Department of Transportation Volpe Center, working under an inter-agency agreement with the USEPA.
1

EPAR8 Phase 2 QAPP: Libby, MT March, 2001
The following individuals are the Volpe Center Project Managers with overall responsibility for ensuring successful performance of the tasks specified in this plan:
John McGuiggin (primary contact) Project Manager U.S. Department of Transportation, Volpe Center
Mark Raney (secondary contact) Technical Lead U.S. Department of Transportation, Volpe Center
Quality Assurance
All Quality Assurance activities associated with the implementation of this plan will be coordinated by:
Mary Goldade Quality Assurance Coordinator U.S. Environmental protection Agency, Region 8
Ms. Goldade may personally assess any aspect of this plan and require response actions as needed, or may delegate assessment responsibility to qualified staff.
A5. PROBLEM DEFINITION and BACKGROUND
Libby, Montana, is a community located near an open pit vermiculite mine which began limited operations in the 1920's and was operated on a larger scale by the W. R Grace Company from approximately 1963 to 1990. Studies at the site revealed that the vermiculite from the mine contains amphibole-type asbestos, and that workers at the mine had an increased risk of developing asbestos-related lung disease (Amandus et al. 1978, McDonald et al. 1986, Amandus et al., 1987, Amandus and Wheeler 1987). Although the mine has ceased operations, concern exists that historic or continuing releases of asbestos from mine-related materials could be serving as a source of ongoing asbestos exposure and risk to current and future residents in the area.
The U.S. Environmental Protection Agency (USEPA) is implementing an investigation to characterize the nature and extent of asbestos contamination of the environment in and around Libby. This investigation is being performed in several phases. Phase 1 of the program (USEPA 2000b) focused on collection of air samples from multiple indoor and outdoor locations around the community, along with samples of different potential sources of asbestos fibers in air. The results from this phase of the investigation indicate that amphibole-type asbestos fibers are present in a number of environmental samples, including indoor air, dust, soil, and insulation.
2
EPAR8 Phase 2 QAPP: Libby, MT March, 2001
Because human health risk from asbestos is mediated by inhalation exposure, greatest emphasis has been placed on collection and analysis of air samples. To date, most air samples at homes have been collected using a stationary air monitor located in the principal living area of the home, and the concentration of fibers has been estimated using Transmission Electron Microscopy (TEM). However, there are issues which exist with regard to both the collection technique (stationary air monitors) and the analytical technique (TEM).
With regard to the stationary air monitor sampling method, the potential issue is that, in a location where asbestos fibers are present in a source such as dust, soil, or insulation, some types of human activities may tend to "kick up" asbestos fibers into the air, resulting in an increase in asbestos fiber concentration in the breathing zone of the person engaged in the activity. A stationary monitor located in such a home is useful and appropriate for assessing the "passive" exposures of people in the home who are not engaged in the activity, but may tend to underestimate exposures of the people directly engaged in activities which do generate dust. Therefore, the first objective of this sampling effort (Phase 2 of the environmental characterization project plan) is to measure asbestos levels in the breathing zone of individuals engaged in routine and special activities in and about Libby, and to compare those measurements to data collected from co-located stationary air monitors. This information will be helpful in deciding what type of air sampling method is needed to evaluate risks to individuals engaged in both routine and special activities in the home.
With regard to the analytical technique, the issue is that air samples have historically been analyzed for asbestos using Phase Contrast Light Microscopy (PCM), and the EPA current slope factor for quantifying lung cancer risk from asbestos in air is expressed in units of risk per PCM fiber per cc of air (USEPA 2000a). Thus, even though it is widely recognized that TEM analyses are more accurate and more powerful than PCM analyses, measurements of asbestos concentration based on TEM are difficult to convert to an equivalent concentration by PCM (this is referred to as PCM equivalents, or PCME). Thus, the second objective of this sampling effort is to analyze a series of different air samples by both the TEM and PCM methods in order to derive a site-specific relationship between the two, and to help judge which type of measurement is most appropriate.
As noted above, the chief reason for collecting data on asbestos fiber levels in air is to support risk assessment and risk management decision making. Thus, the third objective of the study is to utilize the data collected to derive preliminary assessments of the potential health risk to people who engage in the types of routine and special activities investigated during the study. Because the study will not span all possible exposure conditions and all exposure locations, the data will be used to help estimate the range of different exposure levels (and hence health risks) that residents of Libby may experience from both routine and special activities.
3
EPAR8 Phase 2 QAPP: Libby, MT March, 2001
A6. PROJECT/TASK DESCRIPTION
The basic tasks required to achieve the three main objectives of this phase of the Libby site investigation are listed below:
1. Collect samples of air from the breathing zone of people engaged in routine and special activities in homes in and about Libby where asbestos-contaminated soil, dust or insulation might result in increased concentrations of asbestos fibers in air.
2. Collect air samples from a fixed air monitor in the main living area of homes where individuals engage in the routine or special activities referred to above.
3. Analyze each air sample by each of two methods (TEM, PCM).
4. Compare the personal air monitoring data to the data from the fixed air monitors to judge the reliability of the fixed air monitors in predicting exposures associated with routine or special activities.
5. Compare the results of the TEM and PCM measurements and (if the data warrant) derive a site-specific empirical conversion factor that relates one to the other.
6. Using current (USEPA 2000a) and proposed (Berman and Crump 2000b) risk assessment methods for airborne asbestos, compare and contrast the risk estimates derived by each of the two approaches in order to determine whether one or more of the routine or special activities is associated with exposures that are above a level of health concern.
A7. QUALITY OBJECTIVES AND CRITERIA FOR MEASUREMENT DATA
EPA has developed a seven-step Data Quality Objectives (DQO) procedure that is designed to ensure that sampling and analysis plans are carefully thought out and that the results of the effort will be adequate to meet the basic objectives of the program. Application of this seven step procedure to each of the three main objectives of this project are presented below.
4

Phase 2 QAPP: Libby, MT EPAR8
FIRST OBJECTIVE: Personal Air Monitor vs Stationary Air Monitor
March, 2001
Step 1. State the Problem
The primary issue to be addressed is that asbestos levels in air collected using stationary air monitors located in the central living space of a home may not accurately represent exposures of people engaged in routine or special activities in locations where asbestos may be released to air from soil, dust or insulation.
Step 2. Identify the Decision
The decision to be made is whether stationary air monitors can be used to evaluate exposure and risk to residents from airborne asbestos in homes in Libby, or whether personal air sampling should be used in addition to or in place of stationary air monitors.
Step 3. Identify Inputs to the Decision
Data needed to achieve this objective consist of accurate and reliable measurements of asbestos levels in the breathing zone of people engaged in routine or special activities in a home, paired with accurate and reliable measurements of asbestos levels in air collected using a stationary air monitor located in the main living area of the same home. Measurements of asbestos levels in breathing zone air will be collected using personal air monitors.
The number of paired samples needed for each routine or special activity that is investigated is difficult to judge, since it is expected that there could be wide variations between locations in the levels of asbestos in source material (dust, insulation, soil), and in the amount of each source material suspended in air by the activity. Thus, the range of concentration and risk estimates based on either personal or stationary air samples could vary substantially from case to case. In general, when variability is wide, more samples are needed to support risk management decisions. However, since the special exposure scenarios being evaluated in this study are only trial simulations of authentic exposures of area citizens, it is expected that judgements about the relative hazard associated with each activity can be based on only a few samples. Thus, each activity will be performed at 3-8 different residences, with one sample of each type of air sample (personal air monitor, fixed air sampler) collected at each location.
5

EPA R8 Phase 2 QAPP: Libby, MT March, 2001
Step 4. Define the Study Boundaries
There are a wide variety of routine and special human activities which might result in the generation of elevated levels of asbestos in breathing zone air. The activities selected for evaluation in this investigation are listed below:
1) Routine household activities (excluding active cleaning) 2) Active house cleaning activities (dusting, sweeping, etc.) 3) Simulated remodeling activities that involve direct contact or handling of vermiculite insulation
' 4) Rototilling a home garden containing vermiculite in the soil
Step 5. Develop a Decision Rule
The degree of similarity (or dissimilarity) of concentration values measured by personal air monitors and by fixed air monitors will be judged semi-quantitatively. The exact data evaluation procedure cannot be stated a priori, but it is expected that, for each type of activity investigated, a simple plot of the fixed station value (x-axis) versus the corresponding personal air value (y-axis) will reveal if there is a systematic pattern of differences between the two. For example, if the slope of the line is close to 1.0, it will be decided that there are no large and consistent differences, and that fixed air monitoring is adequate for assessing human exposure associated with the activity being considered. Conversely, if the slope of the line is substantially greater than 1.0, it will be concluded that fixed air monitors tend to underestimate personal exposures for individuals engaged in the specific activities investigated. In general, if significant differences exist between the two types of measurements, personal air samples will be judged to be most appropriate for assessing risks to individuals engaged in the activities, and data from stationary air monitors will be considered appropriate for individuals residing within the same house who may be passively exposed to the dust generated by the activity.
Step 6. Specify Limits on Decision Errors
With regard to the decision as to whether data from stationary air monitors are adequate for assessing personal exposure during some routine or special activity, the decision is semi-quantitative and no formal limit is imposed on decision error.
Step 7. Optimize the Design for Obtaining Results
Additional air samples or samples from different types of activities may be collected and incorporated into the study results as data become available on actual airborne exposure levels associated with specific types of activity.
6

EPAR8 Phase 2 QAPP: Libby, MT March, 2001
SECOND OBJECTIVE: PCM vs TEM
Step 1. State the Problem
The second issue being addressed by this study is that most air concentration data obtained to date at the site are based on TEM measurements, while the current risk assessment method used by EPA for asbestos is based on fiber counts measured by PCM. The reasons for this dichotomy are mainly historic: most historic epidemiological studies of asbestos exposure in workers used PCM to quantify asbestos levels in air, and these studies provide the basic dose-response data used by EPA to establish the slope factor for lung cancer. However, PCM is subject to a number of limitations, and it is well recognized that TEM can identify thinner fibers than PCM, and is also able to clearly distinguish asbestos from non-asbestos fibers. For these reasons, TEM is the preferred approach, but an estimate of what the PCM result would be is also needed In order to be able to utilize the current cancer slope factor. Thus, a site-specific empiric conversion factor between TEM and PCM fiber counts is required to allow fiber counts measured by one technique to be extrapolated to the results that would have been obtained by the other technique.
Step 2. Identify the Decision
The purpose of this part of the study design is to develop an empiric conversion factor to convert from TEM to PCM fiber counts (and vice versa). No formal decision will be based on this conversion factor. Note that an empiric factor derived for the Libby site may not be applicable to other sites.
Step 3. Identify Inputs to the Decision
Data required to establish a site-specific empirical correlation factor between PCM fibers and TEM fibers is an extensive set of samples analyzed by each method. Ideally, this set of samples should span a wide range of fiber concentrations so that the relationship is well constrained over most of the relevant range.
Step 4. Define the Study Boundaries
The bounds of the study are the same as described above.
Step 5. Develop a Decision Rule
No formal decision will be made with the correlation factor derived from this study.
7

EPAR8 Phase 2 QAPP: Libby, MT March, 2001
Step 6. Specify Limits on Decision Errors
Since no quantitative decision will be made, no limits on decision errors are needed.
Step 7. Optimize the Design for Obtaining Results
Additional samples may be added to this project if the original data collected do not span an adequate range of concentration values to reliably quantify the correlation between PCM and TEM counts,
THIRD OBJECTIVE: PRELIMINARY RISK EVALUATION
Step 1. State the Problem
The third question being addressed by this study is whether or not levels of asbestos fibers may reach a level of potential health concern to area residents who engage in routine or special activities that may cause asbestos fibers to become resuspended in air.
Step 2. Identify the Decision
The decision to be made is whether or not EPA needs to take action to protect human health from asbestos exposures associated with the routine or special activities investigated during this study.
Step 3. Identify Inputs to the Decision
The key data required to estimate human health risk from airborne asbestos exposures include accurate and reliable measurements of the concentration of fibers in air that result from the routine and special activities being evaluated, and the approximate exposure frequency and duration associated with each type of exposure scenario.
Step 4. Define the Study Boundaries
The bounds of the study are the same as described above.
Step 5. Develop a Decision Rule
The degree of risk posed by measured air levels will be assessed using two alternative risk methods. The first is the method currently recommended by USEPA (2000a), and
8

EPA R8 Phase 2 QAPP: LibbV, MT March, 2001
is based on the measured concentration of PCM fibers in air in accordance with the following equation:
Risk = C(PCM f/cc) * TWF * 0.23 (PCM f/cc)'1
where:
Risk = Lifetime excess cancer risk due to exposure being evaluated C = Concentration of asbestos fibers in air quantified using PCM TWF = Time-weighting factor to account for less than lifetime
exposure via the activity being evaluated. For example, if the activity is sweeping the floor, and this activity is performed for 1 hour per day, three days per week for 50 years, the TWA would be 1/24*3/7*50/70 = 0.0128.
The second method that will be used is currently under development by the USEPA (Berman and Crump 2000b). This method has not yet been peer reviewed, but a formal review is planned for Spring, 2001. The basic equation is as follows:
Risk = [Cwo * URW0 + C>10*UR>10]*TWF
where:
Risk = Lifetime excess risk due to exposure being evaluated
Cg.10 = Concentration of amphibole asbestos fibers in air that are 5-10 urn in length and thinner than 0.5 urn, quantified using TEM
C>10 = Concentration of amphibole asbestos fibers in air that are greater than 10 urn in length and thinner than 0.5 urn, quantified using TEM
UR5,I0 = Unit risk (f/cc)'1 for amphibole fibers in the 5-10 urn size range
UR>10 = Unit risk (f/cc)"1 for amphibole fibers in the >10 urn size range
TWF = Time-weighting factor to account for less than lifetime exposure via the activity being evaluated
Risk coefficients stratified by effect (lung cancer, mesothelioma), gender) smoking status, fiber size, and asbestos type (amphibole, chrysotile) are given in Berman and Crump (2000b).
9

EPA R8 Phase 2 QAPP: Libby, MT March, 2001
The mean unit risks for lung cancer plus mesothelioma combined due to amphibole exposure, averaged across gender and smoking status, are as follows:
Fiber Size Unit Risk (TEM f/cc)'1
5-10 um 5.74E-02
> 10 um 1.89E+01
As seen, the unit risk is much higher for fibers longer than 10 urn than for fibers between 5-10 urn, so in this approach the risk to a person is largely determined by the level of these long fibers.
The level of risk that is unacceptable is a matter of risk management judgement. In general, USEPA considers excess lifetime risks that are below 1E-04 to 1E-06 to be sufficiently small that remedial action under Superfund is usually not warranted. Risks above 1E-04 are generally considered to warrant some sort of action or intervention, to the extent feasible.
Step 6. Specify Limits on Decision Errors
It is standard EPA policy to provide a margin of safety in risk management decisions regarding health risk from environmental contamination. Generally, this is achieved by basing risk calculations on the 95% upper confidence limit (95% UCL) of the arithmetic mean concentration of contaminant in the environment. In the case of asbestos concentrations in air measured by counting the number of fibers present on a filter, the 95% UCL of concentration is derived by using the 95% UCL of the fiber count, based on the Poisson distribution (e.g., see ISO 10312). However, since the data collected during this investigation are not intended to serve as the basis of final risk management^ decision-making at any specific residence or sampling location, but rather to serve as a preliminary assessment of the range of exposures and risks that may be associated with certain types of activities, preliminary judgements regarding risk will take both the mean and the 95% UCL into account.
Step 7. Optimize the Design for Obtaining Results
Additional sampling of air or source media and/or investigation of other types of activities may be added to this project as data on asbestos levels in air generated by the original activities investigated become available.
10

EPAR8 Phase 2 QAPP: Libby, MT March, 2001
B. MEASUREMENT/DATA ACQUISITION
B1. SAMPLING PROCESS DESIGN
Information to be collected during this program includes three types of data:
1) Concentrations of asbestos in various types of environmental media 2) Attributes of the houses or other buildings that participate in the program 3) Details of the specific activities engaged in during the sampling program
The following sections present the methods to be used for collection of each of these types of information.
B1a. Environmental Samples
Overview
Environmental samples to be collected during this program include samples of air (drawn through a filter) and samples of potential asbestos source materials (dust, insulation, soil). With regard to the air samples, analytical sensitivity is controlled by two key variables: the volume of air drawn through the filter, and the number of grids openings or fields examined by the microscopist. Appendix G presents calculations that estimate the target volume of air needed for each activity scenario, assuming the goal is to be able to quantify cancer risk at the 1E-04 level, and assuming that 50 TEM grid openings or 100 PCM fields will be evaluated. The precise combination of flow rate and sampling time needed to approach or exceed these target volumes will be selected by the field teams based on the specific requirements for each scenario.
Scenario 1: Sampling Purina Routine Household Activities
Twelve residences in Libby will be selected for sampling during routine household activities. To the extent possible, these will be chosen based on the results of previous asbestos sampling programs to provide a range of expected conditions and exposures, as follows:
Target Number of Homes To Be Sampled Vermiculite Insulation Present
Observed Amphibole Fibers in Indoor Air or Dust Vermiculite Insulation Present
None 5-10 urn > 10 um
No 2 2 2
Yes 2 2 2
11

EPAR8 Phase 2 QAPP: Ljbby, MT March, 2001
Participation in the investigation is strictly voluntary. Because the results for individual properties are considered to be confidential, the names and addresses of participants will not be made public.
Preference will be given to volunteers who are non-smokers, since smoke particles in air collect on filters and could tend to reduce analytical sensitivity of air samples collected.
Air samples for asbestos analysis will be collected using both personal and stationary air sampling pumps.
The personal air sampler will be worn by an adult resident in the home, who will engage in all normal activities except active cleaning. The participant will need to remain indoors as much as possible throughout the sampling period. As discussed in Appendix G, the target volume of air needed to obtain a detection limit equivalent to a 95% UCL risk level of 1E-04 is quite large (4,900 L for the IRIS method and over 80,000 L for the Berman and Crump method). Thus, every effort should be taken to maximize flow rates and collection times. To this end, collection may be extended across two or more days, if the resident is willing. Due to the presumed length of the sampling period, the sampling team will return to the home periodically (about every 4 hours) to ensure the pumps are operating properly. To ensure the battery does not run down during sampling, the team will change the personal air sampling pump every visit (about 4 hours apart).
The location of the stationary air sampler will be the main living area of the home (see USEPA 2000b). A high volume pump will be used to collect the stationary sample. The sampling time for the stationary air monitor should be the same as for the personal air monitor. Flow rates may be higher than for the personal pump in order to increase sensitivity.
Whenever feasible, all pumps (high volume and low volume) will be programed, calibrated, and placed at the sampling location on the evening prior to the sampling event.
Scenario 2: Sampling Purina Active Household Cleaning Activities
The investigation of airborne levels during active cleaning activities will be conducted at the same 12 locations as were selected for the routine household activities investigation above. Residents will be asked to NOT engage in cleaning activities for one week prior to this event. Due to the possibility that such activities might be associated with increased exposure to asbestos fibers, the cleaning activities will be performed not by the residents of the home, but by an EPA staff member or consultant with appropriate health and safety training and wearing adequate personal protective equipment (PPE).
12

EPAR8 Phase 2 QAPP: Libby, MT March, 2001
As before, both personal and stationary air samples will be collected. The personal air sample will be collected using a portable high-volume air sampler worn by the person performing active cleaning activities such as sweeping, vacuuming, and dusting. This activity will be conducted for a time period of approximately 2 hours. To the extent possible, the cleaning activities performed in each house will be standardized as follows:
Vacuuming: This will be done using the vacuum cleaner owned by the resident. If the resident does not own a suitable vacuum cleaner, then a vacuum will be provided by EPA. This will be a standard commercial cleaner, not a HEPA device. Vacuuming should be performed for approximately 40 minutes, and should cover carpets, rugs that a resident might normally vacuum.
Sweeping. This will be done using a straw or plastic broom. If possible, this will be a broom owned by the resident, but a broom provided by EPA may also be used. Sweeping should be done mainly on uncarpeted floors. Sweeping should be from the edges toward the center. If the sweeping generates a visible pile of dust or dirt, this should be sampled using the microvac method (SOP ASTM 5755-95), and the remainder picked up with a dust pan and discarded as IDW. Total time spent sweeping should be approximately 40 minutes.
Dusting. Dusting will be done with a clean dry rag provided by EPA. Dusting may be done on any surface that might normally be dusted by a resident, including table tops, counters, window sills, picture frames, lamp shades, etc. Total time spent dusting should be approximately 40 minutes..
The stationary air sampler will be a high volume pump located in the same central living area of the main house as was used during the routine activity investigation (above). The sampling time will be the same for the stationary sampler as for the personal sampler. To the extent feasible, pump flow rates will be adjusted to approach or exceed the target volumes specified in Appendix G.
In order to help quantify the impact of the activity (active cleaning) on asbestos levels in air, the stationary air monitor will also be used to collect a pre-activity and a post activity sample as well as the sample during the activity.
13

EPA R8 Phase 2 QAPP: Libby, MT March, 2001
The sampling duration for these samples should be approximately 3 hours. An example sampling scheme is summarized below:
Activity Example Clock time
Minimum Target Volume8 (L) Activity Example
Clock time Personal Air Monitor Stationary Air Monitor
Pre-sampling 8:00-11:00 690
Active cleaning 11:30-1:30 690 690
Post activity 2:00-5:00 690 a If feasible, collection of volumes greater than the minimum should be achieved since this
will increase sensitivity.
The stationary air sample collected post activity will be analyzed using the AHERA method (USEPA 1987). A property will be considered suitable for re-habitation if this sample complies with the AHERA standard (or a more stringent standard, as directed by the EPA SCC). If the clearance sample fails this standard, either more clearance samples may be collected, or alternatively, the pre-activity sample may be analyzed. In this case, the residence will be considered suitable for re-habitation if the final clearance sample does not have a fiber concentration higher than the pre-activity sample,
Immediately prior to initiation of the cleaning activities, a composite dust sample will be collected from the house in accord with SOP ASTM 5755-95. This sample is intended to provide a representative composite of the dust inside the house, especially in living areas. As noted above, if sweeping or dusting activities results in the generation of a pile of dust, a sample of this material will also be collected using the microvac technique in order to provide a second sample to evaluate for fiber content.
If preliminary practice sessions reveal that active cleaning generates sufficient dust to be detectable by real-time aerosol monitors, then two such aerosol monitors will be used to quantify the level of dust particles in the air before, during, and after the cleaning activities. One will be located in close proximity to the stationary air monitor in the main living area of the home, and one will be located in close proximity to the cleaning activity. Real-time aerosol monitoring will not be used during Scenario 2 if trial runs indicate that no useful data will be collected.
Scenario 3: Sampling During Simulated House Remodeling Activities
Houses selected for inclusion in this category will be selected based on previously obtained data on asbestos levels in insulation. One house will be selected where the insulation is not believed to contain asbestos, and three houses will be selected where the insulation is vermiculite and the vermiculite is known to contain detectable levels of asbestos.
14

EPAR8 Phase 2 QAPP: Llbby, MT March, 2001
The simulated remodeling activities performed will be relatively simple in nature, and will be representative of activities which a homeowner might undertake that could lead to direct exposure to vermiculite insulation. For example, this might include removing vermiculite insulation from a wall or ceiling, moving (bagging, sweeping) insulation from an attic to gain access to plumbing or wiring, replacing or repairing drywall or paneling on an insulated wall, etc. Specific activities will be selected on a house-by-house basis, depending on the location and accessability to vermiculite insulation.
Because of the possibility that this type of activity might lead to increased exposure to asbestos fibers in air, all simulated remodeling activities will be performed by EPA staff or contractors with adequate health and safety training and Wearing adequate PPE.
Homes selected for this scenario may be either vacant or occupied. In the case of homes that are currently occupied, the residents will be asked to leave the house until activities are completed and airborne levels of fibers are returned to acceptable levels.
This scenario will be carefully monitored by air sampling both in the vicinity of the simulated remodeling activity and in the main living area of the home. These samples are described below.
Personal Air Monitor for Simulated Worker
The individual performing the simulated remodeling will engage in simulated remodeling activities for a period of approximately one hour. This individual will wear a portable low-volume air sampling pump. Because it is expected that this activity will be associated with high airborne dust levels, the flow rate will be set at a low value (e.g., 0.5 L/min). If overloading does not occur, the entire sampling activity will be collected on one filter. If pilot studies suggest that 60 minutes of sample collection will result in filter overload, then a series of sequential samples will be collected (e.g., two 30-minutes samples or four 15-minute samples, etc.),
Fixed Air Monitor at the Work Area
One 3-hour air sample will be collected from the simulated work area before simulated remodeling begins, and a set of three sequential 3-hour samples will be collected after the work is completed to monitor the time course of fiber disturbance and settling. The pre- and post-activity sampling will be done using a stationary high volume pump, placed in a convenient position within the work area that can be accessed by the sampling team without re-disturbing the insulation. The flow rate for these pre- and post-activity samples will be selected to yield a volume that meets or exceeds the minimum target volume specified in Appendix G without causing filter overload.
15

EPA R8 Phase 2 QAPP: Libby, MT March, 2001
Stationary Air Monitor in the Main House
The stationary air sampler will be located in the main living area of the house. These samples will serve to measure the impact of the simulated remodeling on "passive" air exposure at locations remote from the simulated remodeling. In addition, these samples will serve as "clearance" samples to establish when the house is suitable for re-occupation by the resident. Samples will be collected before, during and for three sequential time periods after simulated remodeling work is completed. Pump flow rates will be set to ensure that a minimum volume of at least 1,200 L will be collected during each 3-hour sampling period (e.g., 7-8 L/min). Analysis of these samples will be done using the AHERA method (USEPA 1987). A property will be considered suitable for re-habitation if the final clearance sample complies with the AHERA standard or a more stringent standard, as directed by the EPA SCC. If the final clearance sample fails this standard, either more clearance samples may be collected, or alternatively, the pre-activity sample may be analyzed. In this case, the residence will be considered suitable for re-habitation if the final clearance sample does not have a fiber concentration higher than the pre-activity sample.
The following tables provides an example schedule summarizing the that will be collected for this scenario:
Time Period Example Clock time
Work area Main living area Time Period Example
Clock time Type Min Vol (L) Type Min Vol (L)
Pre-sampling 8:00AM-11:00AM Fixed 1200 Fixed 1200
Simulated remodeling
11:00AM-12:00PM Personal 14 Fixed 400
Post activity 1 12:00PM-3:00PM Fixed 1200 Fixed 1200
Post activity 2 3:00PM-6:00PM Fixed 1200 Fixed 1200
Post Activity 3 6:00 PM-9:00 PM Fixed 1200 Fixed 1200
Dust Monitors
In addition to sampling for asbestos, two real-time aerosol monitors will be used to quantify the level of dust particles in the air before, during, and after the simulated remodeling activities. One aerosol monitor will be located in close proximity to the stationary air monitor, and the other will be located in the enclosed area where the simulated remodeling is occurring.
16

EPA R8 Phase 2 QAPP: Libby, MT March, 2001
Bulk Insulation
In all locations where simulated remodeling activities are performed, samples of the bulk insulation will be collected and analyzed for asbestos in accordance with NIOSH Method 9002, or using improved methods currently being developed by USEPA for use on this project.
Scenario 4: Sampling Purina Garden Rototillina Activities
Sites will be selected for inclusion in this test scenario based on the results of previous garden soil analyses. One property will be selected where the garden does not contain visible vermiculite and where PLM analysis does not reveal the presence of asbestos material. Two gardens will be selected where vermiculite is visible and/or where PLM soil analysis reveals the presence of asbestos fibers. Sampling will be performed in summer (e.g., July-August) when garden soils are likely to be drier (and hence more likely to release dust and fibers) than in the spring, In addition, EPA Project managers may direct that a second (optional) sample be collected in spring (e.g., late May), when residents first begin preparation of their gardens for planting. In order to help reduce variability between sites, the same rototiller will be used at all locations (with appropriate decontamination between locations).
Because of the possibility that rototilling might lead to increased exposure to asbestos fibers in air, this activity will be performed by EPA staff or contractors with adequate health and safety training and wearing adequate PPE.
Stationary air monitors will be used to collect ambient air samples at two locations: either 5 meters upwind and 5 meters downwind of the garden, or the upwind and downwind perimeter of the property (whichever is closer). The direction and speed of the wind will be recorded throughout the rototilling event. The operator of the rototiller will wear a personal air sampling pump, Flow rate for both the stationary and personal air pumps will be approximately equal and will be sufficient to collect the minimum target volume specified in Appendix G (70 L), and the sampling durations will also be equal (about 1 hour).
In order to help quantify the impact of the activity (garden rototilling) on asbestos levels in ambient air, the down-wind stationary air monitor will also be used to collect a pre-activity and a post activity sample as well as a sample during the activity. Both the pre-and the post activity samples will be at a flow rate adequate to yield a minimum volume of 1200 L, collected over a sampling duration of about 3 hours.
17

EPAR8 Phase 2 QAPP: Libby, MT March, 2001
This sampling scheme is summarized in the following example schedule:
Activity Example Clock time
Minimum Target Volume (L) Activity Example
Clock time Personal Sampler Stationary Monitor
Pre-sampling 8:00-11:00 1200
Garden rototilling 11:30-12:30 70 70
Post activity 1:00-4:00 1200
A downwind aerosol monitor will also be used to monitor dust generation before, during and after rototilling.
One soil sample will be collected from each garden before rototilling occurs. This will be accomplished by dividing the garden into six approximately equal areas, and collecting one grab sample from each of grid areas. These grab samples will then be composited into a single sample representative of the garden as a whole. Grab samples will be collected from the depth interval rototilled (about 0-12 inches). Soil sampling and analysis for asbestos will be performed in accordance with methods currently under development by EPA for use at this site. Soil moisture content will be measured in the laboratory by weighing the composite sample before and after drying to constant weight.
Summary of Sampling Design
Field samples and other data items scheduled for collection during this investigation are summarized in Table B-1. Flow charts tracing the path and handling of the air samples collected in Scenarios 1-4 are shown in Figures B-1 to B-4, respectively.
B1b. Housing Characteristics
For Scenarios 1, 2, and 3, potentially relevant attributes of the house or building where samples are collected will be recorded using the Housing Attributes field data sheet provided in Appendix A. In addition, videotape will be used to record the appearance of the structure (inside and out), and to record qualitative information on airflow direction and rate (as assessed using a smoke generator). This data collection and recording will be done prior to the initiation of any environmental sampling activities.
B1 c. Documentation of Activities
Scenario 1
Each volunteer who participates in Scenario 1 will be instructed that they should remain indoors to the maximum extent possible, and that they should engage in all normal
18

EPAR8 Phase 2 QAPP; Libby, MT March, 2001
activities except active cleaning. Each time that a project team member comes to the house to check or change pumps, the activities of the resident during the preceding time interval will be recorded on an activity log (see Appendix D). Videotaping of the resident during routine activities will not usually be performed, but any special activities that are judged to be a likely source of increased exposure to airborne asbestos fibers may be videotaped to document the activity.
Scenarios 2. 3. and 4
The activities specified in Scenario 2 (active cleaning), Scenario 3 (simulated remodeling), and Scenario 4 (garden rototilljng) will all be documented using video exposure monitoring, as described in EPA SOP-LIBBY-02. Whenever possible, Tyndall lighting will be used so that particles of dust in air can be observed in the videotape. A smoke generator may be used to help reveal the direction and rate of airflow during the activities, as needed.
B2. SAMPLING METHODS REQUIREMENTS
Air Samples
All air samples (both personal air and fixed station) to be analyzed for asbestos will be collected by drawing air through a cellulose acetate filter at the flow rates and times specified above. All samples collected using a high-volume pump will employ filters that have pores that are 0.45 urn in diameter. For personal air samples using a low volume pump, filters with pores that are 0.8 urn in diameter may be used, since this decreases back-pressure and increases flow rate without significant impact on the quality of the sample. The details of the air sampling method for personal and stationary air monitors are provided in SOP EPA-LIBBY 01.
Because some of the activities being investigated in this project may generate significant concentrations of airborne dust, it is important to ensure that air filters collected during the activity do not become overloaded with particulate material. This is not a concern for air filters collected during routine household activities, and is not likely to be of concern for filters collected during active cleaning activities (sweeping, dusting), or during garden rototilling (unless the soil is very dry). The chief concern is for personal air samples collected during simulated house remodeling activities that involve active disturbance of vermiculite insulation. For this scenario, it may be necessary to use a low flow (e.g., 0.5 L/min) and to collect several sequential samples during the activity to avoid filter overload.
Dust Samples
As noted above, dust samples will be collected at each of the eight houses in which routine and active cleaning activities are investigated. All dust samples for evaluation of
19

EPAR8 Phase 2 QAPP: Libby, MT March, 2001
asbestos content will be collected using a Microvac method as detailed in SOP ASTM 5755-95, as modified for this project.
Garden Soil Samples
All garden soil samples will be collected in accordance with SOP CDM SOP 1-3. After collection, each soil sample will be prepared in accordance with SOP ISSI-Libby-01.
Insulation Samples
Bulk insulation sampling locations will be determined based on the amount of vermiculite within each building, current and historic insulation layers, and the location of vermiculite insulation within the building. At least one bulk vermiculite insulation sample will be collected within each building. This sample will normally be collected from the attic, walls, or crawlspace of the building, depending on the location of the vermiculite insulation. In the case of larger buildings or buildings which have been renovated, it may be necessary to collect more than one bulk insulation sample to get a more representative sampling of the building.
All bulk insulation samples will be collected in accordance with NIOSH Method 9002, Asbestos (bulk) by TEM. There will be no modifications to this method for the purposes of collecting bulk samples for this project.
The samples will be collected by placing approximately 2 ounces of vermiculite insulation into a plastic zip-top bag. The bag will then be placed into a second plastic zip-top bag. All vermiculite insulation samples will be double bagged The bulk material will preferably be collected from several locations at different depths in order to obtain a homogenized sample of the insulation. PES personnel will wear disposable nitrite gloves while sampling the insulation. A new pair of gloves will be donned prior to each sample being collected. PES personnel will also wear appropriate respiratory protection at all times while collecting bulk insulation samples.
Airborne Dust Monitoring
Airborne dust levels will be measured using a real-time aerosol monitor in accord with the method contained within SOP EPA-LIBBY-03. In general, one aerosol monitor will be located in close proximity to the stationary air monitor, and another will be located in close proximity to the person engaged in the activity. For the rototilling scenario, the aerosol monitor will be co-located with the downwind monitor.
Deviations from SOPs
Every reasonable effort will be made to adhere strictly to specified SOPs for sample and data collection. Where deviation from an SOP is unavoidable, documentation of the
20
EPAR8 Phase 2 QAPP; Libby, MT March, 2001
deviation and its potential impact on the outcome of the data collection effort will be clearly indicated in field notes and subsequent reports.
B3. SAMPLE DOCUMENTATION, HANDLING AND CUSTODY REQUIREMENT
Documentation of sample collection, handling, and shipment will include completion of chain-of-custody forms in the field, use of field maps and field data forms, and entry of data into a field logbook. Each sample will be properly labeled with the a unique sample identifier. A chain-of-custody form shall accompany every shipment of samples to the analytical laboratory. The purpose of the chain-of-custody form is to establish the documentation necessary to trace possession from the time of collection to final disposal.
Field Log Book
Each sampling team will maintain a field log book in Which the following information is recorded for each location visited:
Names of team members Location (address) of sample collection site Date and time of sample collection Number and type of samples collected Any special circumstances that influenced sample collection
Field Data Sheets
Detailed information on each sample collected will be entered onto a field data sheet. Minimally, the field data sheet will have the following information:
Site name or project number Type of medium sampled (air, dust, soil, insulation) Sample type (field, QA) Sample collection method (SOP number) Sample location Date and time of sample collection Unique sample identification number Sampler's signature
Field data sheets to be used for each medium are presented in Appendix A.
21

EPAR8
Sample Numbering System
Phase 2 QAPP: Libby, MT March, 2001
All environmental samples collected during the Phase 2 investigation will be assigned a sample number of the following format:
2-xxxxx (e.g., 2-00458)
These sample numbers may be assigned to samples of any medium in any order that is convenient for field supervisors and sampling crews. In order to minimize the chance of error in number assignment, pre-printed sheets of adhesive labels with sequential sample numbers will be prepared and provided to field crews. Each sheet will have two identical labels for each sample number. Once a sample is collected, one adhesive label will be attached to the sample, and the second adhesive label with the same number will be attached to the appropriate field data sheet (see Appendix A).
Sample Handling and Custody Requirements
All samples collected must be handled in accordance with the methods specified in the sampling SOP and must be maintained under chain of custody.
The chain-of-custody for all samples will be prepared using the form presented in Appendix E, in accordance with CDM SOP 1-2. All corrections to the chain-of-custody record will be initialed and dated by the person making the corrections. Each chain-of-custody form will include signatures of the appropriate individuals indicated on the form. The originals will accompany the samples to the laboratory, and copies documenting each custody change will be recorded and kept on file.
When shipping samples from EPA custody to an analytical laboratory, the shipping forms or transmittal memo from EPA will describe:
Number of containers Sample preservative (N/A) Date and time of sample shipments
All required paper work, including sample container labels, chain-of-custody forms, custody seals and shipping forms will be fully completed in ink (or printed from a computer) prior to shipping of the samples to the laboratory. Shipping from sample storage to laboratory will be by overnight delivery.
Upon receipt, the samples will be given to the laboratory sample custodian. The coolers will be opened and the contents inspected. Chain-of custody forms will be reviewed for completeness, and samples will be logged and assigned a unique laboratory sample number. Any discrepancies or abnormalities in samples will be noted and the Project Director will be promptly notified.
22

EPA R8 Phase 2 QAPP; Libby, MT March, 2001
Record Keeping
Chain-of-custody will be maintained until final disposition of the samples by the laboratory and acceptance of analytical results by EPA. One copy of the chain-of-custody will be kept by field personnel.
Following completion of the project, the EPA On-Scene Coordinator will consolidate and maintain all original log books, field data sheets, analytical data packages and reports, and any other information required to document and support the findings of the investigation.
B4. ANALYTICAL METHODS REQUIREMENTS
' Appendix B provides detailed SOPs for each analytical method used in this project.
Air and Dust Samples
As discussed above, all air and dust samples collected during this study will be analyzed using both PCM and TEM methods.
Direct vs Indirect Preparation Methods
For both TEM and PCM, two alternative approaches are available: "direct" and "indirect' analysis. In direct analysis, the sample is prepared with minimal handling, generally by placing the test material directly under the microscope for examination. However, this approach may sometimes be inadequate because a) the fibers are accompanied by an excessive level of non-asbestos material, or b) the concentration of asbestos fibers is either too low or too high for reliable quantification. In these cases, an indirect approach may be used. In the indirect method, the sample is generally diluted, concentrated, and/or treated to remove interferences, such that the asbestos fibers can be more reliably quantified. However, because indirect preparation steps may alter fiber morphology and/or may alter fiber recovery, indirect sampling may introduce uncertainty into the results.
For the purposes of this study, direct preparations are strongly preferred for all air filters, and a direct preparation will be made and examined for all air samples. When reliable fiber counts cannot be obtained for one or both methods due to interfering materials, an indirect preparation will be made and the indirect preparation will be re-analyzed by both methods. For dust, only the secondary preparation method will be used.
Counting Rules
The microscopist wilLrecord all observations on a TEM or PCM Laboratory Microscopy Results Form, which are included in Appendix C. For TEM, for each fiber that is
23

EPAR8 Phase 2 QAPP: Libby, MT March, 2001
characterized in accord with the applicable counting rules, the microscopist will record the size (length, thickness) and type (chrysotile, amphibole, non-asbestos) of the fiber. These data will then serve to support calculation of fiber counts in specified size and type categories ("bins"). For PCM, only the number (and not the dimensions or type) of fibers which meet the counting rules will be recorded.
For TEM, the counting rules specified in ISO 10312 will be used for all air and dust samples. In addition, air samples collected by the stationary air filter in the central location of the home before, during and after the active cleaning and simulated remodeling scenarios will be analyzed according to the AH ERA method by the field laboratory that EPA has established on-site. This analysis is needed is to shorten the analytical turn-around time for these samples, since the results from these samples are required to ensure that levels in the home are safe before allowing the residents to return.
For PCM, the counting rules established by NIOSH 7400 (Revision 2) will be used for all samples. Differential counting (i.e., excluding fibers which the analyst suspects are not asbestos) will not be used.
Stopping Rules
The analytical sensitivity and detection limit of microscopic methods such as TEM and PCM are a function of the volume of air drawn through the filter and the number of grids openings or fields counted. In principle, any required sensitivity or detection limit can be achieved simply by increasing number of grid openings or fields examined. Likewise, statistical uncertainty around the number of fibers observed can be reduced simply by counting more and more fibers. Because of the open-ended nature of this situation, stopping rules are needed to specify when microscopic examination should end, both at the low end (zero or very few fibers observed) and at the high end (many fibers observed). For the purposes of this investigation, the following stopping rules will be employed:
Method Count Until
TEM Number of structures longer than 5 urn counted is > 20 OR number of grid openings equals 50
PCM 100 fields are viewed OR 100 fibers are counted (but not less than 20 fields must be counted)
24

EPA R8 Phase 2 QAPP: Libby, MT March, 2001
At the low end, based on the assumed flow rates and sampling durations described previously, these rules will allow quantification of combined cancer risks (lung cancer plus mesothelioma) at or below a level of 1E-04 for all scenarios and methods except for routine exposures of residents based on the Berman and Crump risk assessment methodology (assuming 30% of the protocol structures are longer than 10 urn). In this case, it would be necessary to count 50CM000 grids to establish a 95% UCL on low fiber counts that approaches 1 E-04.
At the high end, a plot of the ratio of the 95% UCL on fiber count as a function of the number of fibers counted reveals that there is relatively little reduction in uncertainty after the number of fibers reaches 15-20. Thus, for the TEM method, counting will stop if 20 structures are observed. For PCM, because counting is faster than for TEM, the stopping point is 100 fibers.
Garden Soil Samples
Garden soil samples will be evaluated for asbestos content using one or more methods to be specified after completion of a study specifically designed to evaluate the relative advantages and limitations of a number of alternative methods for measuring asbestos in soil and other solid media (EPA 2000c).
Insulation Samples
Vermiculite insulation samples will be evaluated for asbestos content using polarized light microscopy (PLM), in accord with SOP NIOSH 9002. Other methods may also be used, as needed, and considering the results of a study designed to evaluate the relative strengths and weaknesses of a number of alternative methods for measuring asbestos in soil and other solid media (EPA 2000c),
B5. QUALITY CONTROL
Quality Control (QC) is a component of the QA Plan, and consists of the collection of data that allow a quantitative evaluation of the accuracy and precision of the field data collected during the project. QC samples that will be collected during this project include the following types of samples.
Laboratory-Based QC Samples
These are samples prepared in or re-analyzed by the laboratory.
Recount (samel This is a TEM grid or a PCM slide that is re-examined by the same (Code = RS) microscopist who performed the initial examination. In the case of
a TEM grid, the microscopist returns to the same grid openings as were counted in the original examination. In the case of PCM, the microscopist simply re-counts the slide at randomly selected fields
25

EPA R8 Phase 2 QAPP: Libby, MT March, 2001
Recount (different) This is a TEM grid or a PCM slide that is re-examined by a different (Code = RD) microscopist in the same laboratory than the individual who
performed the initial examination. In the case of a TEM grid, the microscopist returns to the same grid openings as were counted in the original examination. In the case of PCM, the microscopist recounts the slide at randomly selected fields.
Re-preparation (Code = RP)
This is a grid or a slide that is prepared from a new aliquot of the same field sample as was used to prepare the original grid or slide. This is often referred to as a laboratory duplicate, Typically this is done within the same lab as did the original analysis, but a different lab may also prepare grids from a new piece of filter. If the re-preparation is done within a laboratory, the re-preparation and re-analysis should be done by a different person than did the original, whenever possible.
Verified analysis (Code = VA)
This is a re-count of a TEM grid (same openings) or a PCM slide (random fields) by a different laboratory than performed the original
analysis. A detailed protocol for verified analysis in provided in NIST (1994).
For the purposes of this project, air samples will undergo re-preparation at a rate of at least 5% and re-analysis (different) at a rate of at least 5%. When a laboratory does not have sufficient trained analysts available to perform the needed re-analysis (different), re-analysis (same) may be used, but the re-analysis (same) must be performed at least 24 hours after the initial analysis.
Field-Based QC Samples
These are samples that are prepared in the field and submitted to the laboratory in a blind fashion. That is, the laboratory is not aware the sample is a QC sample, and should treat the sample in the same way as a field sample.
26

EPAR8 Phase 2 QAPP: Libby, MT March, 2001
QC Sample Type Description
Field Blank (Code = FB)
This is a filter that is placed in a collection cassette for either a personal or a stationary air monitor or a microvac, but through which no air is drawn. There is no field blank for soil or insulation.
Field Duplicate (Code = FD) or Field Replicate (Code = REP)
This is a second sample of environmental medium collected at the same place and at the same time as the primary sample. Field duplicates may be collected for each type of medium (air, dust, soil, insulation). For the purposes of this study, duplicate samples of air (i.e., two filters collected at the same time and same location using different pumps and cassettes) are referred to as replicates rather than duplicates.
Performance Evaluation Standards (Code = PE-xx)
These are samples of a medium in which the concentration of the target analyte is known. In the case of asbestos, there are no adequate PE samples available for air (as a primary medium)1, soil, dust, or vermicullte insulation. At present, the USEPA is working to develop PE samples for asbestos in soil and in vermiculite, and these will be included in the study if they become available in time.
For the purposes of this project, field blanks will be submitted for air samples and dust samples at a rate of 5% (minimum number - 2). There are no field blanks for soil or insulation.
Field replicates of air samples will also collected at a rate of approximately 5%. This will include samples from co-located stationary air monitors, and may also include samples obtained from personal air monitors using a flow splitter, when feasible.
Although filed duplicate samples of soil, dust and insulation will be collected from some locations as part of this program, it is important to stress that these will not be evaluated as QC samples, since there are no criteria to judge whether the agreement between samples is within some pre-define acceptance limit. Rather, duplicate samples of these media will be used to gain understanding of the inter-sample variability.
The number of each type of QC and related types of samples to be included in this study is summarized in Table B-2.
1 Samples of asbestos deposited on MCE filters are available from NIST (NVLAP), but these filters contain chrysotile fibers only, and have a size distribution that is not similar to that observed at Libby. Thus, these filters will not be used as PE materials.
27

Phase 2 QAPP: Libby, MT EPA R8
B6. INSTRUMENT CALIBRATION and FREQUENCY
March, 2001
Field Instruments
Pumps used for air sampling will be calibrated In accord with SOP ASTM D 3195 -90 prior to sampling and again at the termination of sampling to determine average air flow rates during the sampling.
Laboratory Instruments
SOPs will identify requirements needed to be met by the laboratories to meet adequate instrument calibration frequency, and QA/QC for raw data and reports.
B7. DATA MANAGEMENT
Data generated during this project will be managed using the same basic methods and procedures established for Phase 1 (USEPA 2000b). In brief, all data are entered into a project-specific database by appropriately trained data entry staff. The data entered into the database includes all relevant field information regarding each environmental samples collected, as recorded on the Field data Sheets and in the field log book, as well as the analytical results provided by the laboratory. All data entries are reviewed and validated for accuracy by the data entry manager or his/her delegate. All original data records (both hard copy and electronic) will be cataloged and stored in their original form by the Project Director until otherwise directed by the EPA On-Scene Coordinator.
C. ASSESSMENT AND OVERSIGHT
C1. ASSESSMENTS AND RESPONSE ACTIONS
Quality Assurance assessments performed during this project will include the following:
1) Oversight of field sampling activities 2) Oversight of sample handling and chain of custody procedures 3) Laboratory inspections
The following individuals or their delegates are authorized to perform any of the assessments above:
EPA On-Scene Coordinator EPA Scientific Support Coordinator Project Manager Technical Lead EPA QA Coordinator
28

EPA R8 Phase 2 QAPP: Ljbby, MT March, 2001
Assessment of field sampling and other project activities may occur at any time and without prior notification. The frequency of such assessments will be no less than once per week during active field work, and may be more often, especially if issues or problems are detected during an assessment. Each of the individuals above has authority to specify any appropriate response action that may be deemed necessary to resolve problems detected during the assessments. This could range from a simple review of approved SOPs with field staff to address minor problems, up to a temporary stop work order to provide time for senior project managers to address more significant issues.
C2. REPORTS TO MANAGEMENT
The Project Director will provide the EPA On-Scene Coordinator, the EPA Scientific Support Coordinator, and/or their delegates, with regular verbal reports on project status. These reports will cover data quality assessment issues, and will identify any significant problems and recommended solutions. The Project Director will prepare a complete written QA report at the end of the project, and may prepare interim written reports at any time during the project, as needed to document important issues and actions.
D. DATA VALIDATION AND USABILITY
D1. DATA REVIEW, VERIFICATION, and VALIDATION
Data Verification
Data verification is a consistent and systematic process that determines whether the data have been collected in accordance to the specifications as listed in the approved Quality Assurance Project Plan (QAPP). This process is independent of data validation, and is conducted at various levels both internal and external to the data generator (laboratory).
Data Validation
Data validation is an evaluation of the technical usability of the verified data with respect to planned objectives. Data validation is performed external to the data generator (laboratory) by applying a defined set of performance criteria to the body of data in the evaluation process. This may include checks of some or all of the calculations in the data set, and reconstruction of some or ail final reported data from initial laboratory data (e.g., chromatograms, instrument printouts). It is in the data validation process that data qualifiers for each verified datum are evaluated and assigned. It extends beyond the analytical method or contractual compliance to protocols to address the overall technical usability of the generated data.
29

EPA R8 Phase 2 QAPP: Libby, MT March, 2001
D2 . VERIFICATION AND VALIDATION METHODS
Data Verification
Data verification will include a review of the findings of all QA assessment activities (see Section C), including assessments of field collection procedures, sample labeling methods, chain-of-custody procedures, and all assessments of analytical data collection, recording and reporting. If any deviations are identified, the potential impact of those deviations on the reliability of the data will be assessed, and that information will be provided to the EPA On-Scene Coordinator and the Science Support Coordinator.
Data Validation
The data validation process consists of evaluation of all individual samples collected and analyzed to determine if results are within acceptable limits. These quantitative or qualitative limits of acceptability are defined for Precision, Accuracy, Representativeness, Comparability, and Completeness (PARCC), as discussed below.
Precision: Precision is defined as the agreement between a set of replicate measurements without assumption or knowledge of the true value. Agreement is expressed as either the relative percent difference (RPD) for duplicate measurements, or the range and standard deviation for larger numbers of replicates. Data on precision are obtained by analyzing duplicate or replicate samples.
Accuracy: Accuracy is a measure of the closeness of a sample analysis result to the "true" value. The accuracy of an analytical method is generally assessed by inserting a series of blind "performance evaluation" (PE) samples into the laboratory sample stream, where the "true" concentration of analyte in each PE sample is known. With regard to asbestos, PE samples are not available for most of the media being analyzed in this project, so accuracy will be determined primarily by an evaluation of agreement between repeat analyses, both within a laboratory and between laboratories.
Representativeness: Representativeness is the degree to which data accurately and precisely represent characteristics of a population, parameter variations at a sampling point, or an environmental condition. For this QAPP, representativeness is ensured by the selection of sampling locations in accordance with the sampling design requirements presented above.
Comparability: Data are comparable if collection techniques, measurement procedures, methods, and reporting units are equivalent for the samples within a sample set. These criteria allow comparison of data from different sources. Comparable data will be obtained by specifying standard units for physical
30

EPAR8 Phase 2 QAPP: Libby, MT March, 2001
measurements and standard procedures for sample collection, processing, and analysis. These requirements are specified in the attached SOPs for sample analysis procedures.
Completeness: Data are considered complete when a prescribed percentage of the total intended measurements and samples are obtained. Analytical completeness is defined as the percentage of valid analytical results requested. For this sampling program, a minimum of 90% percent of the planned collection of individual samples for quantification must be obtained to achieve a satisfactory level of data completeness.
Validation of QC Samples for TEM
Re-Analysis. All re-analysis samples (either different or same) will be validated by comparing the raw data sheets prepared by each analyst. The following acceptance criteria will be used to identify cases where results are not within acceptable limits:
Measurement parameter Acceptance Criterion
Number of fibers within each grid opening Must be the same
Type of fiber Must be the same
Fiber length 0.5 urn or 10% (whichever is less stringent)
Fiber width 0.1 urn or 10% (whichever is less stringent)
Whenever an exception is identified, the sample will undergo validated analysis as described by NIST (1994), and the senior laboratory analyst will use the results of the validated analysis to determine the basis of the discrepancy, and will then take appropriate remedial action as needed (e.g., re-training in counting rules, quantification of size, identification of types, etc).
Re-Preparation. Re-preparation samples will be evaluated by binning the results from each of the two analyses into the following categories:
Fiber Size Fiber Type
Code diam (um)
length (um)
Libby Amphibole (L)
Other Amphibole (O)
Chrysotile (C)
a aspect ratio <5:1 L-a O-a C-a
b <0.5 L-b O-b C-b
c >0.5 L-c O-c C-c
d <0.5 <5 L-d O-d C-d
e <0.5 5-10 L-e O-e C-e
f. <0.5 > 10 L-f O-f C-f
31

EPAR8 Phase 2 QAPP: Libby, MT March, 2001
The results for bins L-d, L-e, and L-f must not be statistically different from each other at the 90% confidence interval, tested using the statistical procedure documented in Appendix F. No formal test will be performed for other bins, but it is expected that there should be no more than about 5% of all bins that differ at the 95% confidence level using the statistical comparison approach in Appendix F.
Validation of QC Samples for PCM
All QA samples for PCM analysis (both re-analysis and re-preparation) must conform with the acceptance criteria specified in NIOSH Method 7400. In brief, the coefficient of variation between the original and the re-preparation sample must not be greater than 0.45. If the laboratory has established values more stringent than this (as described in NIOSH 7400), these more stringent standards will apply.
Validation of Field Data
Data validation for field samples will be performed by ensuring that each sample is accompanied by a complete chain of custody record, a complete field data sheet, and a properly completed and signed laboratory data sheet. Any sample that lacks one or more of the required sets of documentation will be excluded unless the missing sample identification and documentation can reliably be obtained. In addition, the field log book and the analytical report for each sample will be reviewed to determine if there are any notations which indicate that the sample may not be reliable. Any sample with a notation which indicates that the result may not be reliable will be considered unreliable unless a subsequent review determines that the datum is reliable. Data points determined to be unreliable or invalid will be permanently flagged with an "R" qualifier in the original raw data set and excluded from subsequent data analyses, summaries, and reports.
D3. RECONCILIATION with DQOs
The data reports will be reviewed by the On Scene Coordinator, the EPA Science Support Coordinator, and State officials to assess data quality in accordance with DURA (1992), and to determine whether the data are adequate to meet the project objectives. In particular, the project team will review any results which fall outside the DQOs and decide (per DURA 1992 and RAGS 1992) the extent of useability of results for risk assessment.
32

EPAR8 Phase 2 QAPP: Libby, MT March, 2001
E. REFERENCES
ACGIH. 1998. TLVs and BEIs- Threshold limit values for chemical substances and physical agents.
Amandus, H.E. Wheeler, P.E., Jankovic, J., and Tucker, J. 1987. The morbidity and mortality of vermiculite miners and millers exposed to tremolite-actinolite: Part I. Exposure estimates. Am J of Ind. Med 11:1-14. .
Amandus, H.E., and Wheeler, R. 1987. The morbidity and mortality of vermiculite miners and millers exposed to tremolite-actinolite: Part II. Mortality. Am. J. of Ind Med. 11:15-26.
Amandus, H.E., Althouse, R., Morgan, W.K.C., Sargent, E.N., and Jones, R. 1987. The morbidity and mortality of vermiculite miners and millers exposed to tremolite-actinolite: Part III, Radiographic findings. Am. J. of Ind Med 11:27-37.
ATSDR. 1999. Toxicological Profile for Asbestos (Update). Agency for Toxic Substances and Disease Registry. August 1999.
Berman DW, and Crump, K. 1999, Methodology for Conducting Risk Assessment at Asbestos Superfund Sites. February 1999.
McDonald, J.C., McDonald, A.D., Armstrong, B, Sebastien. 1986. Cohort study of mortality of vermiculite miners exposed to tremollte. British Journal of Ind. Med. 43:436-444.
NAS. 1984. National Research Council/National Academy of Sciences: Asbestiform Fibers-Nonoccupational Health Risks. Washington, DC, National Academy Press.
NIST. 1994. Airborne Asbestos Method: Standard Test Method for Verified Analysis of Asbestos by Transmission Electron Microscopy - Version 2.0. SOP prepared by S. Turner and E.B. Steel, U.S. Department of Commerce, National Institute of Standards and Technology. NIST IR 5351. March 1994.
OSHA. 1998. Occupational Exposure to Asbestos. 29 CFR Part 1910. Specifically Regulated Chemicals- Subpart Z - Toxic and Hazardous Substances. Occupational Safety and Health Administration, Department of Labor.
OSHA. 1998. Occupational Exposure to Asbestos. 29 CFR Part 1926. Safety and Health Regulations for Construction. Occupational Safety and Health Administration, Department of Labor.
USEPA. 1986. Airborne Asbestos Health Assessment Update EPA/8-84/003F June 1986.
USEPA. 1987. Asbestos-Containing Materials in Schools; Final Rule and Notice. Federal Register 52(210):4l 826-41905. October 30, 1987.
33

EPAR8 Phase 2 QAPP: Libby, MT March, 2001
USEPA. 1991. Health Assessment Document for Vermiculite. EPA/600/8-91/037 September 1991.
USEPA. 1992. Guidance for Data Useability for Risk Assessment (Part A). U. S. Environmental Protection Agency, Office of Emergency and Remedial Response. Publication 9285.7-09A. April, 1992.
USEPA. 1997. Superfund Method for the Determination of Releasable Asbestos in Soils and Bulk Materials. OSWER 9240.1-33
USEPA. 2000a. Integrated Risk Information System (IRIS). Retrieval from on-line IRIS database for asbestos.
USEPA. 2000b. Sampling and Quality Assurance Project Plan (Revision 1) for Libby Montana. Environmental Monitoring for Asbestos. Baseline Monitoring for Source Area and Residential Exposure to Tremolite-Actinolite Asbestos Fibers. Project Plan prepared for USEPA Region 8 by ISSI Consulting Group. January 4, 2000.
USEPA. 2000c. Draft Project Plan for the Performance Evaluation Study for Analytical Methods for Asbestos in Soil. Libby Asbestos Site, Libby, Montana, (in preparation)
34

INSERT TABLES AND FIGURES DIVIDER PAGE

EPA R8 Phase 2 QAPP: Libby, MT March, 2001
TABLE B-1 SUMMARY OF PHASE 2 SAMPLING DESIGN
Number of Sample Number of Samples per Location Total number of samples Scenario Properties Type Pre During Post Air Dust Soil Ins.
Routine activity 12 Personal Air Stationary Air (main house)
1 1 24
Active Cleaning 12
Personal Air (work area) Stationary Air (main house) RAM (work area) RAM (main house) Dust
1 1 1 1
• : •
1 1
48 24
Simulated Remodeling 4
Personal Air (work area) Stationary Air (work area) Stationary Air (main house) RAM (work area) RAM (main house) Insulation
1 1 - 3 1 1 3
• — = •
1
40 4
Garden Rototilling 3
Personal Air (while tilling) Stationary Air (downwind) Stationary Air (upwind) RAM (downwind) Soil (composite)
1 1 1 1
1 | -•
1
15 3
35

EPA R8 Phase 2 QAPP: Libby, MT March, 2001
TABLE B-2 SUMMARY OF QC AND RELATED SAMPLES
Medium Number of Field Samples
QC and Related Samples Medium Number of
Field Samples Category Type N
Air (filters) 127 Laboratory Recount (a) 6 Air (filters) 127 Laboratory
Re-preparation (b) 6
Air (filters) 127 Laboratory
Verified analysis As needed
Air (filters) 127
Field Replicates 6
Air (filters) 127
Field
Blanks 6
Dust (filters)
12-24 Laboratory Recount (a) 2 Dust (filters)
12-24 Laboratory
Re-preparation (b) 2
Dust (filters)
12-24 Laboratory
Verified analysis As needed
Dust (filters)
12-24
Field Duplicates (c) 2
Dust (filters)
12-24
Field
Blanks 2
Soil 3 Laboratory Re-preparation 1 Soil 3
Field Duplicates (b) 2
Soil 3
Field
PE Samples TBD (d)
Insulation 4 Laboratory Re-preparation 1 Insulation 4
Field Duplicates (b) 2
Insulation 4
Field
PE Samples TBD (d)
a Re-count different should be used whenever possible
b All re-preparation samples should be prepared and analyzed by different individuals than those who performed the original preparation and analysis, if possible.
c Field duplicates of dust, soil and insulation will not be considered QC samples, since there are no guidelines for evaluating whether paired results are within some specified acceptance criterion. These samples will be used to help evaluate the degree of inter-sample variability from a location.
d The USEPA is currently working to develop PE samples for amphibole asbestos in soil and vermiculite insulation, and these will be included if they become available in time.
36
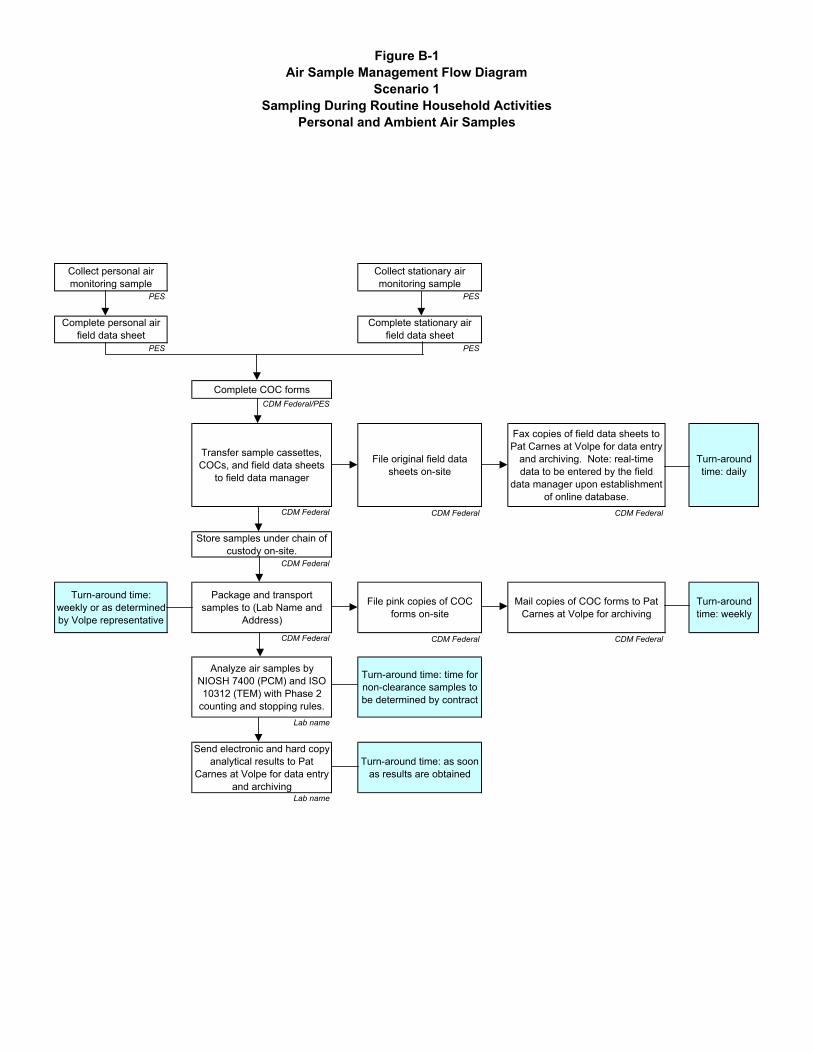
Figure B-1Air Sample Management Flow Diagram
Scenario 1Sampling During Routine Household Activities
Personal and Ambient Air Samples
Collect personal air monitoring sample
Collect stationary air monitoring sample
PES PES
Complete personal air field data sheet
Complete stationary air field data sheet
PES PES
Complete COC formsCDM Federal/PES
Transfer sample cassettes, COCs, and field data sheets
to field data manager
File original field data sheets on-site
Fax copies of field data sheets to Pat Carnes at Volpe for data entry
and archiving. Note: real-time data to be entered by the field
data manager upon establishment of online database.
Turn-around time: daily
CDM Federal CDM Federal CDM Federal
Store samples under chain of custody on-site.
CDM Federal
Turn-around time: weekly or as determined by Volpe representative
Package and transport samples to (Lab Name and
Address)
File pink copies of COC forms on-site
Mail copies of COC forms to Pat Carnes at Volpe for archiving
Turn-around time: weekly
CDM Federal CDM Federal CDM Federal
Analyze air samples by NIOSH 7400 (PCM) and ISO 10312 (TEM) with Phase 2
counting and stopping rules.
Turn-around time: time for non-clearance samples to be determined by contract
Lab name
Send electronic and hard copy analytical results to Pat
Carnes at Volpe for data entry and archiving
Turn-around time: as soon as results are obtained
Lab name

Figure B-2Air Sample Management Flow Diagram
Scenario 2Sampling During Active Household Cleaning Activities
Personal, Ambient Air, and Dust Samples
Collect pre-activity dust sample
Collect pre-cleaning stationary air monitoring
samplePES PES
Complete dust field data sheet
Complete stationary air field data sheet
PES PES
Initiate cleaning activities including one vacuuming, one sweeping, and one
dusting session. Videotape cleaning
activities and conduct real-time aerosol monitoring
during all sampling activities .
Transfer videotapes and aerosol monitoring logs to
field data manager
Archive videotapes and aerosol monitoring logs on-
site
PES PES CDM Federal
Collect stationary air monitoring sample
Collect personal air monitoring sample
If cleaning activities generate a visible pile of
dust or dirt, collect second composite dust sample
PES PES PES
Complete stationary air field data sheet
Complete personal air fielddata sheet
Complete dust field data sheet
PES PES PES
Collect post-cleaning stationary air monitoring
(clearance) samplePES
Complete stationary air field data sheet Complete COC forms
Transfer sample cassettes, COCs, and
field data sheets to field data manager
File original field data sheets on-site
Fax copies of field data sheets to Pat Carnes at Volpe for data entry and
archiving. Note: real-time data to be entered by the field data manager upon establishment of online
database.
Turn-around time: daily
PES CDM Federal/PES CDM Federal CDM Federal CDM Federal
Store all samples under chain of custody on-site
CDM Federal
Turn-around time: daily or as determined by Volpe
representative
Package and transport samples to (Lab Name and
Address)
File pink copies of COC forms on-site
Mail copies of COC forms to: Pat Carnes at Volpe for
archiving
Turn-around time: weekly
CDM Federal CDM Federal CDM Federal
Analyze air and dust samples by NIOSH 7400 (PCM) and
ISO 10312 (TEM) with Phase 2 counting and stopping rules. Analyze clearance
samples by AHERA method; post-activity sample to be
analyzed first.
Turn-around time: ASAP (<24 hours) for clearance
samples; time for non-clearance samples to be determined by contract
Lab name
Take action as determined by EPA OSC (Paul
Peronard) and Chris Weis
If post-activity (clearance) sample results don't meet
AHERA standard
E-mail results to EPA OSC (Paul Peronard) and Chris
Weis
If post-activity (clearance) sample results meet
AHERA standard
Notify resident(s) for relocation back into
residence
EPA Lab name EPA/Volpe
Send electronic and hard copy analytical results to Pat
Carnes at Volpe for data entry and archiving
Turn-around time: as soon as results are obtained
Lab name

Figure B-3Air Sample Management Flow Diagram
Scenario 3 Sampling During Simulated House Remodeling Activities
Collect pre-remodeling stationary air monitoring sample within the work
enclosure
Collect pre-remodeling stationary air monitoring
sample in the main living area
PES PES
Complete stationary air field data sheets
PES
Initiate simulated remodeling activities. Videotape cleaning activities and conduct real-
time aerosol monitoring during all sampling activities.
Transfer videotapes and aerosol monitoring logs to
field data manager
Archive videotapes and aerosol monitoring logs
on-site
PES PES CDM Federal
Collect personal air monitoring sample
Collect stationary air monitoring sample within
the work enclosure
Collect stationary air monitoring sample in the main
living areaCollect bulk insulation sample
PES PES PES PES
Complete personal air field data sheet
Complete stationary air field data sheet
Complete stationary air field data sheet
Complete bulk insulation field data sheet
PES PES PES PES
Collect 3 sequential post-cleaning stationary air monitoring (clearance)
samples from work enclosure
Collect 3 sequential post-cleaning stationary air monitoring (clearance)
samples from main living area
PES PES
Complete stationary air field data sheet Complete COC forms
Transfer sample cassettes, bulk sample, COCs, and
field data sheets to field data manager
File original field data sheets on-site
Fax copies of field data sheets to Pat Carnes at Volpe for data entry and
archiving. Note: real-time data to be entered by the field data manager upon establishment of online
database.
Turn-around time: daily
PES CDM Federal/PES CDM Federal CDM Federal CDM Federal
Store all samples under chain of custody on-site
CDM Federal
Collect additional clearance sample
Turn-around time: daily or as determined by Volpe
representative
Package and transport samples to (Lab Name and
Address)
File pink copies of COC forms on-site
Mail copies of COC forms to: Pat Carnes at Volpe
for archiving
Turn-around time: weekly
CDM Federal CDM Federal CDM Federal
Analyze air samples by NIOSH 7400 (PCM) and ISO 10312 (TEM) with Phase 2 counting and stopping rules. Analyze
clearance samples by AHERA method; post-activity sample to be analyzed first. Analyze bulk insulation sample by NIOSH
9002 (PLM).
Turn-around time: ASAP (<24 hours) for clearance
samples; time for non-clearance samples to be determined by contract
Lab name
Take action as determined by EPA OSC
(Paul Peronard) and Chris Weis
If post-activity (clearance) sample results don't meet
AHERA standard
E-mail results to EPA OSC (Paul Peronard) and Chris
Weis
If post-activity (clearance) sample results meet
AHERA standard
Notify resident(s) for relocation back into
residence
EPA Lab name EPA/Volpe
Send electronic and hard copy analytical results to Pat Carnes
at Volpe for data entry and archiving
Turn-around time: as soon as results are obtained

Figure B-4Air Sample Management Flow Diagram
Scenario 4Sampling During Garden Rototilling Activities
Collect pre-activity downwind stationary air monitoring
sample and initiate downwind aerosol monitoring
PES
Complete stationary air field data sheet
PES
Initiate rototilling (area?)PES
Collect personal air monitoring sample
Collect stationary air monitoring sample. Record wind speed and direction in
field logbook.
Collect garden soil sample
PES PES CDM Federal
Complete personal air field data sheet
Complete stationary air field data sheet
Complete soil-like materials field data sheet
PES PES CDM Federal
Collect post-activity downwind stationary air monitoring
sample and complete downwind aerosol monitoring
Transfer aerosol monitoring logs to field data manager
Archive aerosol monitoring logs
on-site
PES PES CDM Federal
Complete COC formsCDM Federal/PES
Transfer sample cassettes, soil samples, COCs, and field
data sheets to field data manager
File original field data sheets on-site
Fax copies of field data sheets to Pat Carnes at Volpe for data entry
and archiving. Note: real-time data to be entered by the field data
manager upon establishment of online database.
Turn-around time: daily
CDM Federal CDM Federal CDM Federal
Store samples under chainof custody on-site
CDM Federal
Turn-around time: once a week or as
determined by Volpe representative
Package and transport samples to (Lab Name and
Address)
File pink copies of COC forms on-site
Mail copies of COC forms to Pat Carnes at Volpe for
archiving
Turn-around time: weekly
CDM Federal CDM Federal CDM Federal
Analyze air samples by NIOSH 7400 (PCM) and ISO 10312 (TEM) with Phase 2
counting and stopping rules. Analytical method for soil
samples is under development.
Turn-around time: time for non-clearance samples to be
determined by contract
Lab name
Send electronic and hard copyanalytical results to Pat
Carnes at Volpe for data entry and archiving
Turn-around time: as soon as results are obtained
Lab name

EPAR8 Phase 2 QAPP: Libby, MT March, 2001
APPENDICES
APPENDIX TITLE
A FIELD DATA SHEETS
B SAMPLING AND ANALYSIS SOPs
C LABORATORY DATA SHEETS
D RESIDENTIAL ACTIVITY LOG
E CHAIN OF CUSTODY FORM
F STATISTICAL COMPARISON OF TWO POISSON RATES
G CALCULATION OF TARGET DETECTION LIMITS
v

INSERT APPENDIX A DIVIDER PAGE
EPA R8 Phase 2 QAPP: Libby, MT March, 2001
APPENDIX A
FIELD DATA SHEETS

Sheet No. H-LIBBYMONTANA SITE INVESTIGATION
FIELD SAMPLE DA TA SHEET FOR HOUSE ATTRIBUTES
Attribute Value Notes
Address
Type Residential Commercial Mixed
Status Occupied Vacant
Approx. year of construction
Number of Floors
Number of rooms
Approx. sq. footage
Heating Source Wood Electric Propane/gas Other
Heat distribution Convection Forced air Radiant Other
Ventilation rate (fan on)
Indoor temperature
Indoor humidity
Vermiculite insulation None Attic Walls Other
Vermiculite type Expanded Unexpanded Mixture
Attic access Interior Exterior
Is attic used by resident? Rare/Never Occasional Often
Videotape Number
Field Diagram PROVIDE DIAGRAM AND INFORMATION ON REVERSE OF THIS SHEET

FIELD DIAGRAM OF HOUSE
Include approximate dimensions of rooms, floor covering type, location of stationary air monitor, location of activities performed,, location or air ducts, direction and rate of air flow (smoke), and location of vermiculite insulation. Use more than one diagram if needed.
i \ \
i
I l l
1
s i i
1
i 1 i 1— I
1 1 1
1
\ i i
\
1 i i 1 I
I I l
I
1 1 I
r*"
t i i
r
l i i
i
i i i
i
I !
f
i 1 i
t L. 1
\ ..J,
t --J—
i
t
1
\ i \
i
i -J-... : —
t L._
t —
i
I
""""
i -j--
i
i I »
I 1-I
-J i
i 1 i
1 — J
1 -J
i
\
i ...J
I L-- ___
I
i
t
i
r
i
i j
r*
I 1 1
I
i
1
1
1 r™
t
r~
i
f
l
1
! i
i
i
i
i
i 1
5
i
1
1 ~
\
i
f i JL-.. !
i i i
i
i
I
r
i
r~~
i
i
1
1
i
I
i I
i
I
1
i
t
i
I
1 i
t
!
i
!
i
j i
l
i ,
I
1 -J
t
i
i
i -.J-.-.
~
i u 1
I
r 1
1
i
i
I
i
i
t
i
i
i
I
i
i
J
1
i
\
i
1
t
\
i
l t i
I
i „
I
i
I
i
t
1
i
\ 1 1
\
i
I
I
i
1
1
i
t
!
i
*
1
i
i
\
— S
f
I
l
1
t
I
1 -J
1 L._ i
i I
-H
--
1 f i
i L.„ ...
1
1
i
r~~
\
1
l
l -JL.-
1 , L._
I
1 —JL.
1 -J—
\
i
1 -J
1 1™ ... —
l
1 J -J—
I 1 f
i 1 I
t
1
1
1 """"
I 1 i r
1
1 r~™ ""
L.„ \
—J.. I
i
i
1 1 i
i -J—
1
{
1 I I
„J \ L._ i
1 1 i
t I
l
i
{ J~ i
1
1
\ J l
~J f
1
t
i
j
l
i
i
i
i J _
l
I
i
l j ..
1
1
1 L-I
I
l
t
*
i i l
1
i
I
1
1
l
l
i
l
j
r
i
I
1
f
\
1 i
I
t
t
— » i
1 5 1 I
!
L._ l 1 1
— -J— l
i
t 1 1
-J— — -J..-. I
t
i
~~~ I 1
— f
1
I L._ I
1 i
\
1 j ... -J—
J
\
\ j 1
1
1 f™ 1
1 -J—.
i —J—
i
1 J 1
___ — i
C
I
t
— 1
l
i 1 i
1
r~ L— l
J I
f~
t
— s I
i 1 1
— r"~ ~
— L.~ i L. 1
I
J J
I
1 ~
i
r~
l f
i r
i ~JI
1 r'
t
i r"
l L, i
I
f J
— I \ I
i 1 I i
i
i L.~
i—
i
i i— r"
i 1 i
— \ l„ \
1
| 1
— i
I ..J—
i
\ „J
i
r
1
1 r
i
, \ L, j
J
i J
— l 1 f
\ I i
.—p
. i f J j
i
i
1
}
\
i
i L \
i
1 i
— I
_ 1 I
l
i i
j L l i—
1
1
l
r „j
\ L. f
1
1 l
_ I L_ I
—L.« 1 L._ l
1 \
l
I
I
t
i
i ..J
I
t
r"~~ -J.,-
i
i — -j
i l„ {
i
r^ L~ I
— 1 L-1 l l
~ \
: ^
1 \
i f
f l l
i
!
l
I I I
-J— r*
j
i i i
—
\ i„ i \ \
i
r~" j i
1

Sheet No. A-LIBBY MONTANA SITE INVESTIGATION FIELD SAMPLE DATA SHEET FOR
STATIONARY AIR Address or Location ID: GPS (if no address available): Northing . Easting Owner: Land Use Category: Residential School Commercial Mining Other ( )
Site Visit Date: Sampling Team: • ,
Data Item Cassette 1 Cassette 2 Cassette 3
Field ID Number
Index ID
Category (circle) FS ReD
FS ReD
FS Rep
Category (circle)
Blank Blank Blank
Matrix Type (circle) Indoor Outdoor
Indoor Outdoor
Indoor Outdoor
Location Description
Flow Meter Type
Flow Meter ID No.
Pump ID Number
Start-Date
Start-Time
Start-Counter
Start-Flow (L/min)
Stop-Date
Stop-Time
Stop-Counter
Stop-Flow (L/min)
Pump fault? No Yes No Yes No Yes
MET Station onsite? No Yes No Yes No Yes
Field Comments

Sheet No. A-LIBBYMONTANA SITE INVESTIGATION
FIELD SAMPLE DA TA SHEET FOR PERSONAL AIR
Address or Location ID: GPS (if no address available): Northing Easting Owner: Land Use Category: Residential School Commercial Mining Other ( ) Name of sampler: SSN: Activity: Site Visit Date: Sampling Team:
Data Item Cassette 1 Cassette 2
Field ID Number
Index ID
Category (circle) FS ReD Blank
FS ReD Blank
Matrix Type (circle) Indoor Outdoor
Indoor Outdoor
Location Description
Flow Meter Type
Flow Meter ID No.
Pump ID Number
Start-Date
Start-Time
Start-Counter
Start-Flow (L/min)
Stop-Date
Stop-Time
Stop-Counter
Stop-Flow (L/min)
Pump fault? No Yes No Yes No Yes No Yes No Yes No Yes
MET Station onsite? No Yes No Yes
Field Comments

Sheet No: D-LIBBY MONTANA SITE INVESTIGATION
FIELD SAMPLE DATA SHEET FOR DUST
Address or Location ID: GPS (if no address available): Northing Easting Owner: Land Use Category: Residential School Commercial Mining Other ( )
Date: ; Sampling Team:
Data Item Cassette 1 Cassette 2 Cassette 3
Field ID Number
Index ID
Category (circle) FS Blank
FS Blank
FS, Blank
Location Description
Sample area (cm2)
Flow Meter Type
Flow Meter ID Number
Pump ID Number
Start-Time
Start-Flow (L/min)
Stop-Time
Stop-Flow (L/min)
Pump fault? No Yes No Yes No Yes
Field Comments

Sheet No: I -
LIBBY MONTANA SITE INVESTIGATION FIELD SAMPLE DATA SHEET FOR
BULK INSULATION
Address or Location ID: GPS (if no address available): Northing Easting Owner: Land Use Category: Residential School Commercial Mining Other ( )
Date: Sampling Team:
Data Item Sample 1 Sample 2 Sample 3
Field ID Number
Index ID
Matrix Type Insulation Insulation Insulation
Category (circle) FS FD
FS FD
FS FD
Description of sampling location
Field Comments

Sheet No: S -
LIBBYMONTANA SITE INVESTIGATION FIELD SAMPLE DATA SHEET FOR
SOIL-LIKE MATERIALS Address or Location ID: GPS: Northing Easting: Owner: " Land Use Category: Residential School Commercial Mining Future Residential
Commercial Logging Roadway Other ( )
Sample Date: Sampling Team:
Data Item Sample 1 Sample 2 Sample 3
Field ID Number
Index ID
Sample Time
Matrix Type (circle) Soil Yard Soil Garden Soil Play Area Driveway Mining waste Other ( )
Soil Yard Soil Garden Soil Play Area Driveway Mining Waste Other ( )
Soil Yard Soil Garden Soil Play Area Driveway Mining Waste Other ( )
Category (circle) FS FD
FS FD
FS FD
Type (circle) Grab Comp
# subsamDles
Grab Comp
# subsamDles
Grab Comp
# subsamDles
Top Depth (in.)
Bottom Depth (in.)
Map Location(s) (Indicate on field sketch)
Comments

INSERT APPENDIX B DIVIDER PAGE
i

APPENDIX B STANDARD OPERATING PROCEDURES
SAMPLE COLLECTION
Medium Sampling SOP
Air EPA SOP LIBBY-01
Indoor Dust ASTM D 5755-95
Soil (gardens) CDM SOP 1-3 (sampling) CDM SOP 4-5 (decontamination)
Bulk Insulation NIOSH 9002
SAMPLE PREPARA TION AND ANALYSIS
Medium Method Sampling SOP
Air TEM ISO 10312 Air
PCM NIOSH 7400 (Revision 2)
Dust TEM (secondary) ASTM D 5755-95
Insulation PLM NIOSH 9002
Soil TBD ISSI- Libby-01 (preparation) TBD (analysis)
FIELD DOCUMENTATION AND MONITORING
Activity SOP
Video Exposure Monitoring EPA SOP-LIBBY-02
Field Logbook Content and Control CDM SOP 4-1
Dust monitoring EPA SOP-LIBBY-0323
GENERAL PROCEDURES
Procedure SOP
Sample Custody CDM SOP 1-2
Packaging and Shipping of Environmental Samples CDM SOP 2-5

INSERT SIGNATURE PAGE: EPA SOP LIBBY-01

SOP EPA-LIBBY-01 Revision # 1
Date: March 2001
REVISION LOG
Revision Date Reason for Revision
02/28/01 ~
03/07/01 Further define pump calibration procedures.
1
Page 2 of 9

SOP EPA-LIBBY-01 Revision # 1
Date: March 2001
PROCEDURAL SECTION
1.0 Scope and Applicability
This Standard Operating Procedure (SOP) provides a standardized method for sampling air to measure the concentration of asbestos fibers. This SOP is applicable to any type of asbestos fiber (amphibole, chrysotile) that may exist in air (either indoor or outdoor), and is applicable to both personal and ambient air (referred as stationary air throughout this SOP) sampling techniques. Filters collected in this way are suitable for examination by a variety of microscopic techniques, including TEM, PCM, and SEM.
2.0 Summary of Method
This SOP is based on air sampling techniques described in EPA SOP 2015, ISO 10312, OSHA Technical Manual, NIOSH 7400 and NIOSH 7402.
Air is drawn through a fine-pore filter in order to trap any suspended particulate matter in the air, including suspended asbestos fibers and other mineralogic materials. The filters are then examined using an appropriate microscopic technique to observe, characterize and quantify the number of asbestos fibers on the filter. TTie concentration of fibers in air is then calculated by dividing the total number of fibers on the filter by the volume of air drawn through the filter.
3.0 Health and Safety Warnings
Asbestos fibers are hazardous to human health when inhaled. Exposure to excessive levels may increase the risk of lung cancer, mesothelioma, and asbestosis. All personnel engaged in collection of air samples in areas where asbestos fibers may be present must have adequate health and safety training and must wear an appropriate level of personal protective equipment (PPE). Refer to the Health and Safety Plan for further details.
4.0 Cautions
None, refer to Section 3.0.
5.0 Interferences
High levels of dust or other suspended particulates may clog or overload the filter and reduce the ability to observe and characterize asbestos fibers on the filters. Precautions should be taken to avoid any unnecessary sources of dust emissions or use of aerosol sprays. Sampling
Page 3 of 9
\

SOP EPA-LIBBY-01 Revision # 1
Date: March 2001
conditions (flow rate, sampling time) should be adjusted accordingly to avoid filter overload.
6.0 Personnel Qualifications
Field personnel engaged in collection of filter cassettes must be trained in the proper use and calibration of the air sampling equipment (as specified in this SOP), as well as proper methods for data recording and sample handling. Additionally, all field personnel must maintain appropriate and current training and/or certifications to meet all federal, state, and local regulations.
7.0 Apparatus and Equipment
Filter Cassettes
All samples will be collected on conductive filter holders consisting of 25-mm diameter, three piece filter cassettes having a 50-mm long electrically conductive extension cowl. The cassette shall be pre-loaded with a mixed cellulose ester (MCE) filter with pore size 0.8 um. Use of the 0.8 um pore size is recommended for all samples so that samples collected using a high volume pump are comparable to samples collected with a low volume pump. The 0.8 um pore size filters are used for samples collected with a low volume pump in order to decrease back-pressure and increase flow rate.
To reduce contamination and to hold the cassette tightly together, seal the crease between the cassette base and the cowl with a shrink band or adhesive tape. If particle deposition on the inside of the cowl is observed, it may be necessary to ground the cowl to reduce static charge. This is done by attaching one end of a length of flexible wire to the plastic cowl with a hose clamp and attaching the other end of the wire to a suitable ground (e.g., a cold water pipe).
Air Pumps
The sampling pump used shall provide a non-fluctuating airflow through the filter and shall maintain the initial flow rate within ± 10% throughout the sampling period.
A variety of different types of air pump may be used, depending on the flow rates that are required to achieve the data quality objectives and desired analytical sensitivity of the project. In general, the pump should be selected to deliver a flow rate that is as high as possible without overloading the filter with dust or fibers. The minimum flow rate is 0.5 L/min, and rates up to 10 L/min may be appropriate in some cases.
For stationary air monitors, a high volume pump that operates on AC power is recommended.
Page 4 of 9

SOP EPA-LIBBY-01 Revision # 1
Date: March 2001
For personal air sampling, either a portable high volume AC powered sampler or a low volume battery-operated pump are acceptable, depending on whether the activities of the individual are impaired by the tethering imposed by the power cord needed for the high volume pump.
Tripod
For stationary air monitors, a tripod or other similar device is required to hold the filter cassette at a specified elevation above the floor. As noted below, this will typically be a height that represents the breathing zone (1.5-2 meters).
Spring Clips
For personal air monitors, the filter cassette is held in place using spring clips or other similar devices.
Rotameter
A rotameter that has been calibrated to a primary calibration source is required to calibrate the air flow rate at the start and the end of each sampling period. Due to its dependency on changes in atmospheric pressure, the rotameter must be calibrated to a primary calibration source at the site location (e.g., City of Libby) prior to sampling and re-calibrated on-site every week. Record calibration and re-calibration to the primary standard in the field logbook.
Primary Calibration Source
A bubble buret or other primary calibration standard may be used to calibrate the rotameter.
Sample Labels
A pre-printed sheet of sample labels (2 identical labels per sample number) is required. One label should be attached to the filter cassette before the sample collection period begins, and the matching label should be attached to the field data sheet that records relevant data on the sample being collected.
Field Log Book
A field log book is required to record relevant information regarding the collection of samples (location, time, unusual conditions or problems, etc.).
Field Data Sheet
Page 5 of 9

SOP EPA-LIBBY-01 Revision # 1
Date: March 2001
A personal air or stationary air monitoring field data sheet (as appropriate) is required to record the relevant sampling information. Refer to the Phase 2 QAPP (EPA, March 2001) for the form.
8.0 Instrument Calibration
External calibration devices such as a bubble buret or a rotometer that have been calibrated to a primary calibration source may be used to calibrate air flow rate prior to air sampling. The flow rate must also be measured by the same method at the end of the sampling period.
8.1 Calibrating a Rotameter with an Electronic Calibrator (DryCall
• See manufacturer's manual for operational instructions. • To set up the calibration train, attach one end of the tygon tubing to the outlet plug of the
rotameter; attach the other end of the tubing to the inlet plug on the pump. Another piece of tubing is attached from the inlet plug of the rotameter to the outlet plug on the DryCal.
• Rest or firmly stabilize the rotameter so that it is vertical (± 6°). • Attach an isolating load with a pressure drop of about 10 to 20 inches of water column in
series with a stable pump (a filter cassette of same lot number as will be used for field samples works well for this).
• Turn the DryCal and sampling pump on. Turn the flow adjust screw (or knob) on the pump until the desired flow rate is attained.
• Record the DryCal flow rate reading and the corresponding rotameter reading in the field logbook. The rotameter should be able to work within the desired flow range. Perform the calibration three times until the desired flow rate of ± 5% is attained. Once at the sampling location, a secondary calibrator (e.g., rotameter) may be used to calibrate sampling pumps.
8.2 Calibrating an Air Pump with a Rotameter
A rotameter can be used provided it has been precalibrated to a primary calibration source at the site location (e.g., City of Libby). Three separate constant flow calibration readings should be obtained both before sampling and after sampling. The mean value of these flow rate measurements shall be used to calculate the total air volume sampled.
Turn on the sampling pump and run for 5 minutes before performing calibration. Remove the end plugs on the filter cassette. A cassette, representative of the lot planned for use in air sampling, must be used.
• To set up the calibration train, attach one end of the tygon tubing to the cassette base; attach the other end of the tubing to the inlet plug on the pump. Another piece of tubing is attached from the cassette cap to the rotameter.
Page 6 of 9
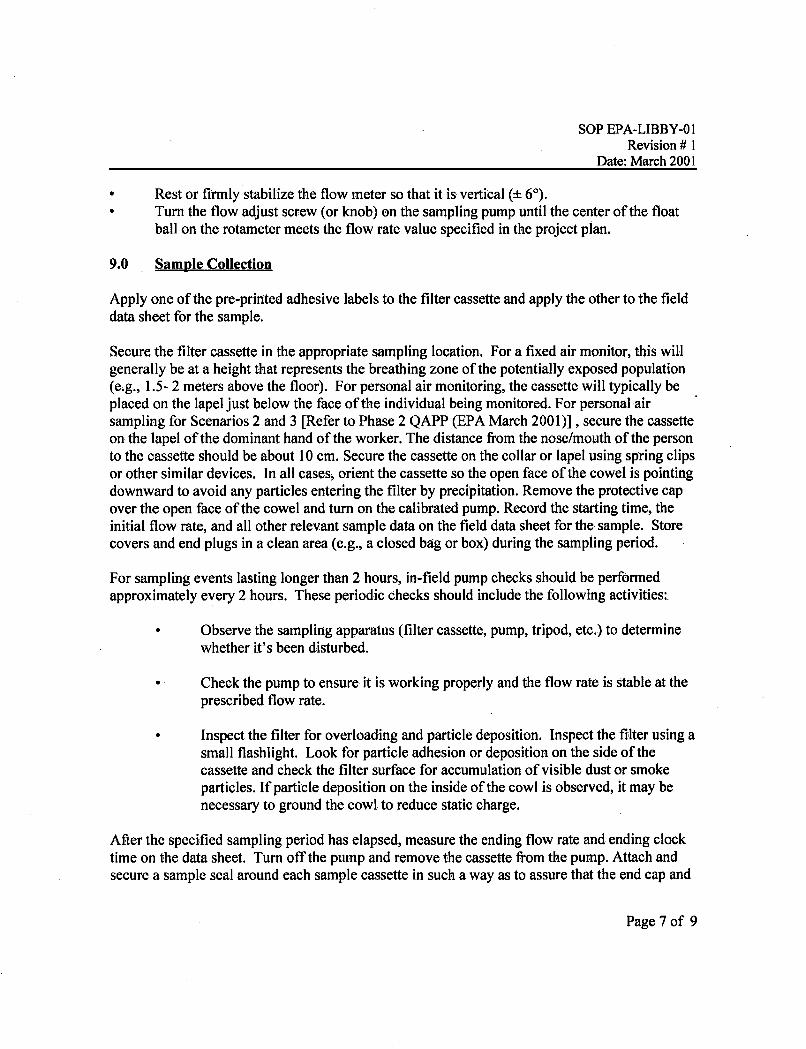
SOP EPA-LIBBY-01 Revision # 1
Date: March 2001
• Rest or firmly stabilize the flow meter so that it is vertical (± 6°). • Turn the flow adjust screw (or knob) on the sampling pump until the center of the float
ball on the rotameter meets the flow rate value specified in the project plan.
9.0 Sample Collection
Apply one of the pre-printed adhesive labels to the filter cassette and apply the other to the field data sheet for the sample.
Secure the filter cassette in the appropriate sampling location. For a fixed air monitor, this will generally be at a height that represents the breathing zone of the potentially exposed population (e.g., 1.5- 2 meters above the floor). For personal air monitoring, the cassette will typically be placed on the lapel just below the face of the individual being monitored. For personal air sampling for Scenarios 2 and 3 [Refer to Phase 2 QAPP (EPA March 2001)], secure the cassette on the lapel of the dominant hand of the worker. The distance from the nose/mouth of the person to the cassette should be about 10 cm. Secure the cassette on the collar or lapel using spring clips or other similar devices. In all cases, orient the cassette so the open face of the cowel is pointing downward to avoid any particles entering the filter by precipitation. Remove the protective cap over the open face of the cowel and turn on the calibrated pump. Record the starting time, the initial flow rate, and all other relevant sample data on the field data sheet for the sample. Store covers and end plugs in a clean area (e.g., a closed baig or box) during the sampling period.
For sampling events lasting longer than 2 hours, in-field pump checks should be performed approximately every 2 hours. These periodic checks should include the following activities:
• Observe the sampling apparatus (filter cassette, pump, tripod, etc.) to determine whether it's been disturbed.
• Check the pump to ensure it is working properly and the flow rate is stable at the prescribed flow rate.
Inspect the filter for overloading and particle deposition. Inspect the filter using a small flashlight. Look for particle adhesion or deposition on the side of the cassette and check the filter surface for accumulation of visible dust or smoke particles. If particle deposition on the inside of the cowl is observed, it may be necessary to ground the cowl to reduce static charge.
After the specified sampling period has elapsed, measure the ending flow rate and ending clock time on the data sheet. Turn off the pump and remove the cassette from the pump. Attach and secure a sample seal around each sample cassette in such a way as to assure that the end cap and
Page 7 of 9

SOP EPA-LIBBY-01 Revision # 1
Date: March 2001
base plug cannot be removed without destroying the seal. Tape the ends of the seal together since the seal is not long enough to be wrapped end-to-end. Initial and date the seal.
10. Sample Handling and Preservation
Package the cassettes so they will not rattle during shipment nor be exposed to static electricity. Place custody seals, dated and marked with the packager's signature, onto the shipping container. Do not ship samples in polystyrene peanuts, vermiculite, paper shreds, or excelsior. Tape sample cassettes to sheet bubbles and place in a container that will cushion the samples in such a manner that they will not rattle. For additional shipping requirements, see the project plan.
Ship the sealed cassette to the analytical laboratory under proper chain of custody procedures. No preservation of the cassette is required.
QUALITY CONTROL and QUALITY ASSURANCE
Pre-Proiect Filter (""Lot"! Blanks
Before samples are collected, two cassettes from each filter lot of 100 cassettes should be randomly selected and submitted for analysis. The lot blanks will be analyzed for asbestos fibers by the same method as will be used for field samples. The entire batch of cassettes should be rejected if any asbestos fiber is detected on any filter.
Field Blanks
Blank samples are used to determine if any contamination has occurred during sample handling, Prepare two blanks (from the sample lot used for field sampling) for the first 1 to 20 samples. For sets containing greater than 20 samples, prepare blanks as 10% of the samples. Filter blanks should be taken to a sampling location and prepared there. Remove the caps on the filter cassette and hold the cassette open for about 30 seconds. Close and seal the cassette as described in Section 9. Store blanks for shipment with the sample cassettes.
Page 8 of 9

SOP EPA-LIBBY-01 Revision # 1
Date: March 2001
REFERENCES
NIQSH 7400
NIOSH 7402
ISO 10312
OSHA Technical Manual
EPA SOP 2015
Page 9 of 9

INSERT SIGNATURE PAGE: EPA SOP LIBBY-02

SOP EPA-LIBBY-02Revision # 1
Date: March 2001
Page 1 of 9
U.S. ENVIRONMENTAL PROTECTION AGENCYREGION 8
STANDARD OPERATING PROCEDURE (SOP)FOR VIDEO EXPOSURE MONITORING OF ACTIVITIES
POTENTIALLY ASSOCIATED WITH EXPOSURE TO ASBESTOS IN AIR
Prepared by: ________________________________________ Date: ___________(Author)
Reviewed by: ________________________________________ Date: ___________(Project Director)
________________________________________ Date: ___________(Quality Assurance Coordinator)
Approved by: ________________________________________ Date: ___________(On-Scene Coordinator)
SOP EPA-LIBBY-02 Revision # 1
Date: March 2001
REVISION LOG
Revision Date Reason for Revision
02/28/01 —
03/13/01 Provide greater detail for aerosol monitoring and video production
Page 2 of 9

SOP EPA-LIBBY-02 Revision # 1
Date: March 2001
PROCEDURAL SECTION
1.0 Scope and Applicability
This Standard Operating Procedure (SOP) provides a standardized method for conducting Video Exposure Monitoring of people who are engaged in activities that may lead to exposure to asbestos fibers or other airborne particulate material in air. The method is generally applicable to any routine or special activity being investigated.
2.0 Summary of Method
Video Exposure Monitoring (VEM) is an exposure assessment technique developed by the National Institute for Occupational Safety and Health, Engineering Control Technology Branch (NIOSH 1992). The method allows for the identification and quantitation of worker exposures for specific job tasks. Through this technique* occupational exposures to a variety of contaminants can be more fully characterized than is possible with integrated sampling techniques such as sorbent tubes or filters. In addition to identifying critical tasks contributing to the workers' exposures, the exposure data and work activity video recording can be combined to fully illustrate the impact that these tasks have. The collection and analysis of exposure data using the Video Exposure Monitoring technique requires three major components: 1) a suitable , direct reading instrument for measuring and recording exposure concentrations; 2) a video recording system (camcorder) for documenting work activities; and 3) a computer system with video overlay capabilities for analyzing and combining the two different types of data. The overall goal of the Video Exposure Monitoring technique is to determine how a worker's activities affect his or her exposure to hazardous compounds or conditions. The production of the video recording, showing the graphical representation of the exposure concentration, helps to communicate these results. By knowing what job element and activities are contributing most to the worker's exposure, appropriate controls can be implemented to adequately protect the worker.
3.0 Health and Safety Warnings
Asbestos fibers are hazardous to human health when inhaled. Exposure to excessive levels may increase the risk of lung cancer, mesothelioma, and asbestosis. All personnel engaged in VEM of persons engaged in activities that may release asbestos fibers into air must have adequate health and safety training and must wear an appropriate level of personal protective equipment (PPE) as specified in the Health and Safety Plan.
Page 3 of 9

SOP EPA-LIBBY-02 Revision # 1
Date: March 2001
4.0 Cautions
None, refer to Section 3.0.
5.0 Interferences
None.
6.0 Personnel Qualifications
Field personnel engaged in VEM must be trained in the proper use of the direct-reading exposure monitor as well as the video and lighting equipment, and must have adequate health and safety training.
7.0 Apparatus and Equipment
Video Camera
The work activities being monitored using the Video Exposure Monitoring technique are recorded using off-the-shelf video recording equipment such as consumer quality camcorders. Professional quality video recording systems will result in better quality video images; these enhancements are not critical to the success of the technique. The one requirement for the video recording system, both consumer and professional quality, is the ability to display an on-screen clock or time with a resolution of at least one second. This clock or timer display must be recorded on the video tape with the work activity images. To ease the collection of the work activity data, the video camera should be mounted on a tripod if possible. It is also helpful to have a video camera with an LCD display. This allows the camera operator to control what is being recorded without looking into the viewfinder.
Lighting Source
The lighting of the general scene may be ambient light or any other suitable light source that allows clear visualization of the activities of the person being monitored. The light source used for Tyndall lighting may be any high intensity light, preferably with a narrow beam with low divergence.
Direct Reading Exposure Monitor
For aerosols such as asbestos fibers or other airborne dusts, direct reading measurement of exposure is made with a light scattering aerosol photometer. These devices measure the aerosol
Page 4 of 9

SOP EPA-LIBBY-02 Revision # 1
Date: March 2001
concentration based upon the amount of light scattered by the aerosol in the sensing chamber of the instrument. For this study, the HazDust II Real-time Personal Dust Monitor, Model HD-1002 (Environmental Devices Corporation, Haverhill, MA) will be used to measure exposure concentrations. This instrument can be configured with various sampling heads to sample for inhalable, thoracic and respirable aerosols. It contains an internal sampling pump and can be outfitted to collect filter samples for post-collection calibration. The HazDust II is calibrated for Arizona Road Dust, with the instrument output relative to this standard. The monitor has a data logging system for recording the real-time data. This data logging system can then be downloaded to a personal computer for storage and analysis.
Computer System
A personal computer system is used for several different purposes. First, the HazDust II monitor downloads its data to the computer through an RS232 port. The downloading procedure is controlled by the HazComm software supplied with the HazDust II monitor. Once the data are downloaded to the computer, the data can be evaluated and analyzed to determine the contribution of the workers' activities to the overall exposure. This analysis is typically done using a spreadsheet program such as Excel (Microsoft Corp., Redmond, WA). The computer system is also used to combine the video recording of the work activities with the exposure data. The computer is outfitted with a video overlay system which will overlay a graphical representation of the exposure onto the work activity video image. The overlay system to be used in this study is the DeltaScan GL (Vine Micros, Ltd., Margate, Kent, UK). This is an external computer device that interfaces to the computer through the VGA video port. The computer display resolution should be set to 800x600 for proper operation of the DeltaScan. A special computer program has been developed to read the data from the direct reading instrument, and display the data as a graphical representation of the exposure concentration. This program, VEM 3.0, creates the graphical image that is overlaid onto the work activity video by the DeltaScan device. '
Filter Cassettes
All samples will be collected on conductive filter holders consisting of 37-mm diameter, three piece filter cassettes. The cassette shall be pre-loaded with a mixed cellulose ester (MCE) filter with pore size 0.8 um.
To reduce contamination and to hold the cassette tightly together, seal the crease between the cassette base and the cowl with a shrink band or adhesive tape. If particle deposition on the inside of the cowl is observed, it may be necessary to ground the cowl to reduce static charge. This is done by attaching one end of a length of flexible wire to the plastic cowl with a hose clamp and attaching the other end of the wire to a suitable ground (e.g., a cold water pipe).
Page 5 of 9

SOP EPA-LIBBY-02 Revision # 1
Date: March 2001
Sample Labels
A pre-printed sheet of sample labels (2 identical labels per sample number) is required. One label should be attached to the filter cassette before the sample collection period begins, and the matching label should be attached to the field log book that records relevant data on the sample being collected.
Field Log Book
A field log book is required to record relevant information regarding the VEM activity (e.g., location, time, activity being recorded, unusual conditions or problems, etc.).
8.0 Instrument Preparation/Calibration
Video Camera
Ensure that the video camera has adequate battery power to record for length of time sufficient to document the activity being investigated. Ensure that a fresh video tape is loaded into the camera for each new activity being recorded.
Direct Reading Exposure Monitor
The HazDust II monitor is factory-calibrated. For field operation, the monitor needs to be zeroed, the calibration span checked with a reference scatter, and the sampling pump calibrated. This should be performed at the start of a sampling day, as well as periodically throughout the day (every 2-4 hours). The HazDust II should be zeroed before checking the span or the pump flow rate. A empty filter cassette is connected to the sensor housing, and the pump tube is connected to the cassette. The thoracic sampling inlet is inserted into the sensor housing, and the zero filter is inserted into the sampling inlet. The zeroing procedure of the HazDust II is then started according to the operation manual. Following zeroing, the calibration span of the HazDust II should be checked. The pump tubing is removed from the filter cassette, and the thoracic inlet is removed from the sensor housing. The reference scatter is inserted into the sensor housing and the HazDust II is started with the sampling time set to 1 second. The readout of the instrument should match the "k" value on the reference scatter. Details of this procedure are given in the operation manual of the HazDust II. Next, the pump on the HazDust II should be calibrated. A filter cassette of the same type being used during data collection should be connected to the sensor housing, and the pump tubing connected to the filter cassette. The thoracic sampling inlet is inserted into the sampling head, and the tubing from the calibrator is connected to the inlet. The instrument sample time is set to 1 second and sampling is started. The pump flow rate should be set to 2.0 1/min, and is set by adjusting a potentiometer on the
Page 6 of 9

SOP EPA-LIBBY-02 Revision # 1
Date: March 2001
bottom of the HazDust II. Once the flow rate is adjusted properly, instrument sampling is stopped, the calibrator tube is removed, and the inhalable inlet is inserted into the thoracic inlet.
The final items to set on the HazDust II are the sampling inlet and date and time. Details of these procedures are given in the operation manual of the HazDust II monitor. The inlet type used for this study is the inhalable inlet. The internal clock of the HazDust must be synchronized with the clock or time on the video camera system. Synchronizing the clocks allows specific work activities to be matched with the associated exposures. IT IS VITAL THAT THE CLOCKS BE SYNCHRONIZED. FAILURE TO DO SO WILL RESULT IN THE DATA OF MARGINAL VALUE. The clocks are synchronized manually, which with practice, will allow the clocks to be set to within one second of each other.
9.0 Videotape Production
Lighting
Whenever possible, the activity will be videotaped using Tyndall lighting so that a direct visual indication of dust particle exposure can be observed. Use a high-powered narrow beam divergence spotlight in a relatively dark area. Aim the lightbeam across the area where dust will be generated. For best viewing results, videotape at an angle of 10° to 15° from the light source. Use some type of shielding to keep the light beam from interfering with video camera.
Data Collection
The HazDust monitor is fastened to the worker's waist by a belt, and the sampling head is clipped to the worker's collar near the breathing zone with the sampling inlet oriented downward. The sampling head should be fastened securely enough to prevent it from interfering with the work being performed. Data collect begins by starting the HazDust monitor and starting recording on the video camera system, When starting the HazDust II monitor, the sampling time should be set to 1 second. The video camera should be operated to ensure the worker's movements are recorded. It is recommended that the HazDust II monitor be downloaded frequently throughout the sampling day (i.e., every 1-2 hours). This prevents the loss of large qualities of data in the event of in instrument failure. The HazDust II is downloaded to a personal computer through a download cable, using the HazComm software. This software saves the exposure data, and allows it to be imported into a spreadsheet program. Details for using this software are given in the HazDust II operation manual.
Page 7 of 9

SOP EPA-LIBBY-02 Revision # 1
Date: March 2001
10.0 Data Analysis and Presentation
After the data have been downloaded and saved by the HazComm software, the data need to be analyzed. Working with the data in a spreadsheet program, activity variables are developed and coded into the dataset. The result is a set of exposure measurements with the corresponding activities. Before analyzing this dataset, the data need to be adjusted for the transportation lag associated with the transport of the contaminant to the monitor's sensor. The actual source of a worker's exposure is usually at least 2-3 feet from the worker's breathing zone. If the contaminant is release into the air, it may take one to five seconds for the contaminant to reach the sensor and for the sensor to respond. This lag must be estimated by viewing the video recording and tracking the exposures in the data set. When an obvious release of a contaminant is detected on the video recording, the response of the monitor will be offset by the magnitude of the transportation lag. The data set can be adjusted for the transportation lag by moving the exposure data column up in the spreadsheet. For example, if the lag is three seconds, the entire column of exposure data would be moved up three rows, assuming a one second interval between readings. By adjusting for the transportation lag, the activity codes will be matched with the resultant exposure concentrations.
Analysis of the data collected can be very simple, or extremely complex. The NIOSH publication "Analyzing Workplace Exposure Using Direct Reading Instruments and Video Exposure Monitoring Techniques" provides several options for the analysis of this data. At the very least, these data should be analyzed to determine mean exposure concentrations by work activity. This way, the critical work activities contributing most to the worker's overall exposure can be determined.
After evaluating the dataset, portions of the exposure data can be overlaid onto the work activity video to highlight the results of the study. Segments to be overlaid should be kept short, 5 to 10 minutes in duration, and should be produced to demonstrate how specific activities affect the worker's exposure. The exposure data are presented graphically by the VEM 3.0 program, which reads the data copied from the spreadsheet, and displays the data in the form of a moving bar. When using the DeltaScan GL, this graphical representation of the exposure data is overlaid onto the work activity video, and recorded to a second video recording system. When properly synchronized with the exposure dataset, the work activity video will show how the worker's exposure changes with the activities being performed.
Page 8 of 9

SOP EPA-LIBBY-02 Revision # 1
Date: March 2001
QUALITY CONTROL and QUALITY ASSURANCE
Pre-Proiect Filter ("Lot") Blanks
Before samples are collected, two cassettes from each filter lot of 100 cassettes should be randomly selected and submitted for analysis. The lot blanks will be analyzed for asbestos fibers and other mineralogic materials by the same method as will be used for field samples. The entire batch of cassettes should be rejected if any asbestos fiber is detected on any filter.
Field Blanks
Blank samples are used to determine if any contamination has occurred during sample handling. Prepare two blanks (from the sample lot used for field sampling) at each sampling location (residence). Filter blanks should be taken to a sampling location, prepared there, and remain at the sampling location as long as field samples are collected. Remove the caps on the filter cassette and hold the cassette open for about 30 seconds. Attach and secure a sample seal around each sample cassette in such a way as to assure that the end cap and base plug cannot be removed without destroying the seal. Tape the ends of the seal together since the seal is not long enough to be wrapped end-to-end. Initial and date the seal. Store blanks for shipment with the sample cassettes.
REFERENCES
NIOSH. 1992. Analyzing Workplace Exposures Using Direct Reading Instruments and Video Exposure Monitoring Techniques. Cincinnati, OH: U.S. Department of Health and Human Services, Public Health Service, Centers for Disease Control and Prevention, National Institute for Occupational Safety and Health, DHHS (NIOSH) Publication No. 92-104
Page 9 of 9

INSERT SIGNATURE PAGE: EPA SOP LIBBY-03

SOP EPA-LIBBY-03Revision # 1
Date: March 2001
Page 1 of 7
U.S. ENVIRONMENTAL PROTECTION AGENCYREGION 8
STANDARD OPERATING PROCEDURE (SOP)FOR REAL-TIME AEROSOL MONITORING
Prepared by: ________________________________________ Date: ___________(Author)
Reviewed by: ________________________________________ Date: ___________(Project Director)
________________________________________ Date: ___________(Quality Assurance Officer)
Approved by: ________________________________________ Date: ___________(Project Manager)

SOP EPA-LIBBY-03 Revision # 1
Date: March 2001
REVISION LOG
Date Revision
02/28/01 —
03/15/01 Update for specific instrumentation being used
Page 2 of 7

SOP EPA-LIBBY-03 Revision # 1
Date: March 2001
PROCEDURAL SECTION
1.0 Scope and Applicability
This Standard Operating Procedure (SOP) provides a standardized method for real-time measurement and recording of aerosol (dust) concentrations in air using an aerosol monitor. It is intended to be used as a semi-quantitative (relative) index of the concentration of airborne dust particles in the vicinity of people engaged in activities that may result in the release of asbestos fibers into air.
2.0 Summary of Method
A microprocessor controlled real-time monitor with an internal air sampling pump is used to monitor particulate concentrations. The monitor uses a detached sensor to measure particles using the principle of near forward light scattering of infrared radiation. The monitor also contains an in-line 37mm filter cassette in order to allow the user to collect concurrent filter samples for asbestos analysis.
3.0 Health and Safety Warnings
Asbestos fibers are hazardous to human health when inhaled. Exposure to excessive levels may increase the risk of lung cancer, mesothelioma, and asbestosis. All personnel engaged in activities that may release asbestos fibers into air must have adequate health and safety training and must wear an appropriate level of personal protective equipment (PPE).
4.0 Cautions
None
5.0 Interferences
None. However, because aerosol monitors measure the concentration of all particles in air, it is important to understand that the real-time results are not specific for asbestos fibers.
Page 3 of 7

SOP EPA-LIBBY-03 Revision # 1
Date: March 2001
6.0 Personnel Qualifications
Field personnel that deploy and operate the real-time aerosol monitor must be trained in the proper use of the equipment, and must have adequate health and safety training when working in areas where asbestos fibers might be present.
7.0 Apparatus and Equipment
Direct Reading Exposure Monitor
For aerosols such as asbestos fibers or other airborne dusts, direct reading measurement of exposure is made with a light scattering aerosol photometer. These devices measure the aerosol concentration based upon the amount of light scattered by the aerosol in the sensing chamber of the instrument. For this study, the HazDust II Real-time Personal Dust Monitor, Model HD-1002 (Environmental Devices Corporation, Haverhill, MA) will be used to measure exposure concentrations. This instrument can be configured with various sampling heads to sample for inhalable, thoracic and respirable aerosols. It contains an internal sampling pump and can be outfitted to collect filter samples for post-collection analysis. The HazDust II is calibrated for Arizona Road Dust, with the instrument output relative to this standard. The monitor has a data logging system for recording the real-time data. This data logging system can then be downloaded to a personal computer for storage and analysis.
Computer System
A personal computer system is used for several different purposes. First, the HazDust II monitor downloads its data to the computer through an RS232 port. The downloading procedure is controlled by the HazComm software supplied with the HazDust II monitor. Once the data are downloaded to the computer, the data can be evaluated and analyzed to determine the contribution of the workers' activities to the overall exposure. This analysis is typically done using a spreadsheet program such as Excel (Microsoft Corp., Redmond, WA).
Filter Cassettes
All samples will be collected on conductive filter holders consisting of 37-mm diameter, three
Page 4 of 7
SOP EPA-LIBBY-03 Revision# 1
Date: March 2001
piece filter cassettes. The cassette shall be pre-loaded with a mixed cellulose ester (MCE) filter with pore size 0.8 um.
To reduce contamination and to hold the cassette tightly together, seal the crease between the cassette base and the cowl with a shrink band or adhesive tape. If particle deposition on the inside of the cowl is observed, it may be necessary to ground the cowl to reduce static charge. This is done by attaching one end of a length of flexible wire to the plastic cowl with a hose clamp and attaching the other end of the wire to a suitable ground (e.g., a cold water pipe).
Sample Labels
A pre-printed sheet of sample labels (2 identical labels per sample number) is required. One label should be attached to the filter cassette before the sample collection period begins, and the matching label should be attached to the field log book that records relevant data on the sample being collected.
Field Log Book
A field log book is required to record relevant information regarding sampling (e.g., location, time, activity being recorded, unusual conditions or problems, etc.).
8.0 Instrument Preparation/Calibration
Direct Reading Exposure Monitor
The HazDust II monitor is factory-calibrated. For field operation, the monitor needs to be zeroed, the calibration span checked with a reference scatter, and the sampling pump calibrated. This should be performed at the start of a sampling day, as well as periodically throughout the day (every 2-4 hours). The HazDust II should be zeroed before checking the span or the pump flow rate. A empty filter cassette is connected to the sensor housing, and the pump tube is connected to the cassette. The thoracic sampling inlet is inserted into the sensor housing, and the zero filter is inserted into the sampling inlet. The zeroing procedure of the HazDust II is then started according to the operation manual. Following zeroing, the calibration span of the HazDust II should be checked. The pump tubing is removed from the filter cassette, and the
Page 5 of 7

SOP EPA-LIBBY-03 Revision # 1
Date: March 2001
thoracic inlet is removed from the sensor housing. The reference scatter is inserted into the sensor housing and the HazDust II is started with the sampling time set to 1 second. The readout of the instrument should match the "k" value on the reference scatter. Details of this procedure are given in the operation manual of the HazDust II. Next, the pump on the HazDust II should be calibrated. A filter cassette of the same type being used during data collection should be connected to the sensor housing, and the pump tubing connected to the filter cassette. The thoracic sampling inlet is inserted into the sampling head, and the tubing from the calibrator is connected to the inlet. The instrument sample time is set to 1 second and sampling is started. The pump flow rate should be set to 2.0 1/min, and is set by adjusting a potentiometer on the bottom of the HazDust II. Once the flow rate is adjusted properly, instrument sampling is stopped, the calibrator tube is removed, and the inhalable inlet is inserted into the thoracic inlet.
The final items to set on the HazDust II are the sampling inlet and date and time. Details of these procedures are given in the operation manual of the HazDust II monitor. The inlet type used for this study is the inhalable inlet.
9.0 Data Collection
For personal samples, the HazDust monitor is fastened to the worker's waist by a belt, and the sampling head is clipped to the worker's collar near the breathing zone with the sampling inlet oriented downward. The sampling head should be fastened securely enough to prevent it from interfering with the work being performed. For stationary air samples, the sampling head should be mounted on a tripod or other suitable device with the sampling inlet oriented downward so that the air is collected from an appropriate height, generally intended to represent the breathing zone of the exposed individual (e.g., 1.5 to 2 meters above the floor). Data collection begins by starting the HazDust monitor. When starting the HazDust II monitor, the sampling time should be set to 1 second. It is recommended that the HazDust II monitor be downloaded frequently throughout the sampling day (i.e., every 1-2 hours). This prevents the loss of large qualities of data in the event of in instrument failure. The HazDust II is downloaded to a personal computer through a download cable, using the HazComm software. This software saves the exposure data, and allows it to be imported into a spreadsheet program. Details for using this software are given in the HazDust II operation manual. All relevant information on location, time, and activities should be recorded in the field logbook.
Page 6 of 7

SOP EPA-LIBBY-03 Revision # 1
Date: March 2001
QUALITY CONTROL and QUALITY ASSURANCE
Pre-Project Filter f'Lof'l Blanks
Before samples are collected, two cassettes from each filter lot of 100 cassettes should be randomly selected and submitted for analysis. The lot blanks will be analyzed for asbestos fibers and other mineralogic materials by the same method as will be used for field samples. The entire batch of cassettes should be rejected if any asbestos fiber is detected on any filter.
Field Blanks
Blank samples are used to determine if any contamination has occurred during sample handling. Prepare two blanks (from the sample lot used for field sampling) at each sampling location (residence). Filter blanks should be taken to a sampling location, prepared there, and remain at the sampling location as long as field samples are collected. Remove the caps on the filter cassette and hold the cassette open for about 30 seconds. Attach and secure a sample seal around each sample cassette in such a way as to assure that the end cap and base plug cannot be removed without destroying the seal. Tape the ends of the seal together since the seal is not long enough to be wrapped end-to-end. Initial and date the seal. Store blanks for shipment with the sample cassettes.
Page 7 of 7

INSERT METHOD: ASTM D 5755 - 95

INSERT METHOD: CDM SOP 1-3

INSERT METHOD: CDM SOP 4-5

INSERT METHOD: NIOSH 9002

INSERT METHOD: ISO 10312

ASBESTOS and OTHER FIBERS by PCM 7400
Various MW: Various CAS: Various RTECS: Various
METHOD: 7400, Issue 2 EVALUATION: FULL Issue 1: Rev. 3 on 15 May 1989 Issue 2: 15 August 1994
OSHA : 0.1 asbestos fiber (> 5 pm long)/cc; 1 f/cc/30 min excursion; carcinogen
MSHA: 2 asbestos fibers/cc NIOSH: 0.1 f/cc (fibers > 5 pm long)/400 L; carcinogen ACGIH: 0:2 crocidolite; 0.5 amosite; 2 chrysotile and other
asbestos, fibers/cc; carcinogen
PROPERTIES: solid, fibrous, crystalline, anisotropic
SYNONYMS [CAS#]: actinolite [77536-66-4]orferroactinolite [15669-07-5]; amosite [12172-73-5]; anthophyllite [77536-67-5]; chrysotile [12001-29-5]; serpentine [18786-24-8]; crocidolite [12001-28-4J tremolite [77538-68-6]; amphibole asbestos [1332-2,1-4]; refractory ceramic fibers [142844-00-8]; fibrous glass.
SAMPLING MEASUREMENT
SAMPLER:
FLOW RATE*
VOL-MIN*: -MAX*:
SHIPMENT:
SAMPLE STABILITY:
BLANKS:
FILTER (0.45- to 1.2-pm cellulose ester membrane, 25-mm; conductive cowl on cassette)
0.5 to 16 L/min
400 L @ 0.1 fiber/cc (step 4, sampling) 'Adjust to give 100 to 1300 fiber/mm2
routine (pack to reduce shock)
stable
2 to 10 field blanks per set
ACCURACY
RANGE STUDIED: 80 to 100 fibers counted
BIAS: see EVALUATION OF METHOD
OVERALL PRECISION (S^): 0.115 to 0.13 [1]
ACCURACY: see EVALUATION OF METHOD
TECHNIQUE:
ANALYTE:
SAMPLE PREPARATION:
COUNTING RULES:
EQUIPMENT:
CALIBRATION:
RANGE;
ESTIMATED LOD:
PRECISION (S,):
LIGHT MICROSCOPY, PHASE CONTRAST
fibers (manual count)
acetone - collapse/triacetin - immersion method [2]
described in previous version of this method as "A" rules [1,3]
1. positive phase-contrast microscope 2. Walton-Beckett graticule (100-pm
field of view) Type G-22 3. phase-shift test slide (HSE/NPL)
HSE/NPL test slide -
100 to 1300 fibers/mm2 filter area
7 fibers/mm2 filter area
0.10 to 0.12 [1]; see EVALUATION OF METHOD
APPLICABILITY: The quantitative working range is 0.04 to 0.5 fiber/cc for a 1000-L air sample. The LOD depends on sample volume and quantity of interfering dust, and is <0.01 fiber/cc for atmospheres free of interferences. The method gives a n index of airborne fibers. It is primarily used for estimating asbestos concentrations, though PCM does not differentiate betwe en asbestos and other fibers. Use this method in conjunction with electron microscopy (e.g., Method 7402) for assistance in identifi cation of fibers. Fibers < ca. 0.25 pm diameter will not be detected by this method [4], This method may be used for other materia Is such as fibrous glass by using alternate counting rules (see Appendix C).
INTERFERENCES: If the method is used to detect a specific type of fiber, any other airborne fiber may interfere since all particles meeting the counting criteria are counted. Chain-like particles may appear fibrous. High levels of non-fibrous dust part icles may obscure fibers in the field of view and increase the detection limit.
OTHER METHODS: This revision replaces Method 7400, Revision #3 (dated 5/15/89).
NIOSH Manual of Analytical Methods (NMAM), Fourth Edition, 8/15/94

ASBESTOS and OTHER FIBERS by PCM: METHOD 7400, Issue 2, dated 15 August 1994 - Page 2 of 15
REAGENTS: EQUIPMENT:
1. Acetone,* reagent grade. 2. Triacetin (glycerol triacetate), reagent grade.
See SPECIAL PRECAUTIONS.
1. Sampler: field monitor, 25-mm, three-piece cassette with ca. 50-mm electrically conductive extension cowl and cellulose ester filter, 0.45- to 1.2-pm pore size, and backup pad. NOTE 1: Analyze representative filters for
fiber background before use to check for clarity and background. Discard the filter lot if mean is >5 fibers per 100 graticule fields. These are defined as laboratory blanks. Manufacturer-provided quality assurance checks on filter blanks are normally adequate as long as field blanks are analyzed as described below.
NOTE 2: The electrically conductive extension cowl reduces electrostatic effects. Ground the cowl when possible during sampling.
NOTE 3: Use 0.8-pm pore size filters for personal sampling. The 0.45-pm filters are recommended for sampling when performing TEM analysis on the same samples. However, their higher pressure drop precludes their use with personal sampling pumps.
NOTE 4: Other cassettes have been proposed that exhibit improved uniformity of fiber deposit on the filter surface, e.g., bellmouthed sampler (Envirometr ics, Charleston, SC). These may be used if shown to give measured concentrations equivalent to sampler indicated above for the application.
Personal sampling pump, battery or line-powered vacuum, of sufficient capacity to meet flow-rate requirements (see step 4 for flow rate), with flexible connecting tubing. Wire, multi-stranded, 22-gauge; 1", hose clamp to attach wire to cassette. Tape, shrink- or adhesive-. Slides, glass, frosted-end, pre-cleaned, 25 x 75-mm. Cover slips, 22- x 22-mm, No. 1-1/2, unless otherwise specified by microscope manufacturer. Lacquer or nail polish. Knife, #10 surgical steel, curved blade. Tweezers.
NIOSH Manual of Analytical Methods (NMAM), Fourth Edition, 8/15/94

ASBESTOS and OTHER FIBERS by PCM: METHOD 7400, Issue 2, dated 15 August 1994 - Page 3 of 15
EQUIPMENT:
10. Acetone flash vaporization system for clearing filters on glass slides (see ref. [5] for specifications or see manufacturer's instructions for equivalent devices).
11. Micropipets or syringes, 5-pL and 100- to 500-pL.
12. Microscope, positive phase (dark) contrast, with green or blue filter, adjustable field iris, 8 to 10X eyepiece, and 40 to 45X phase objective (total magnification ca. 400X); numerical aperture = 0.65 to 0.75.
13. Graticule, Walton-Beckett type with 100-pm diameter circular field (area = 0.00785 mm z)at the specimen plane (Type G-22). Available from Optometries USA, P.O. Box 699, Ayer, MA 01432 [phone (508)-772-1700j, and McCrone Accessories and Components, 850 Pasquinelli Drive, Westmont, IL 60559 [phone (312) 887-7100]. NOTE: The graticule is custom-made for each
microscope, (see APPENDIX A for the custom-ordering procedure).
14. HSE/NPL phase contrast test slide, Mark II. Available from Optometries USA (address above).
15. Telescope, ocular phase-ring centering. 16. Stage micrometer (0.01-mm divisions).
SPECIAL PRECAUTIONS: Acetone is extremely flammable. Take precautions not to ignite it, Heating of acetone in volumes greater than 1 mL must be done in a ventilated laboratory fume hood using a flameless, spark-free heat source.
SAMPLING:
1. , Calibrate each personal sampling pump with a representative sampler in line. 2. To reduce contamination and to hold the cassette tightly together, seal the crease between the
cassette base and the cowl with a shrink band or light colored adhesive tape. For personal sampling, fasten the (uncapped) open-face cassette to the worker's lapel. The open face should be oriented downward. NOTE: The cowl should be electrically grounded during area sampling, especially under
conditions of low relative humidity. Use a hose clamp to secure one end of the wire (Equipment, Item 3) to the monitor's cowl. Connect the other end to an earth ground (i.e., cold water pipe).
3. Submit at least two field blanks (or 10% of the total samples, whichever is greater) for each set of samples. Handle field blanks in a manner representative of actual handling of associated samples in the set. Open field blank cassettes at the same time as other cassettes just prior to sampling. Store top covers and cassettes in a clean area (e.g., a closed bag or box) with the top covers from the sampling cassettes during the sampling period.
4. Sample at 0.5 L/min or greater [6]. Adjust sampling flow rate, Q (L/min), and time, t (min), to produce a fiber density, E, of 100 to 1300 fibers/mm 2 (3.85-104 to 5-105 fibers per 25-mm filter with effective collection area A c= 385 mm2) for optimum accuracy. These variables are related
NIOSH Manual of Analytical Methods (NMAM), Fourth Edition, 8/15/94

ASBESTOS and OTHER FIBERS by PCM: METHOD 7400, Issue 2, dated 15 August 1994 - Page 4 of 15
to the action level (one-half the current standard), L (fibers/cc), of the fibrous aerosol being sampled by:
t = ———-—, min. Q • L • 103
NOTE 1: The purpose of adjusting sampling times is to obtain optimum fiber loading on the filter. The collection efficiency does not appear to be a function of flow rate in the range of 0.5 to 16 L/min for asbestos fibers [7]. Relatively large diameter fibers (>3 pm) may exhibit significant aspiration loss and inlet deposition. A sampling rate of 1 to 4 L/min for 8 h is appropriate in atmospheres containing ca. 0.1 fiber/cc in the absence of significant amounts of non-asbestos dust. Dusty atmospheres require smaller sample volumes ( <400 L) to obtain countable samples. In such cases take short, consecutive samples and average the results over the total collection time. For documenting episodic exposures, use high flow rates (7 to 16 L/min) over shorter sampling times. In relatively clean atmospheres, where targeted fiber concentrations are much less than 0.1 fiber/cc, use larger sample volumes (3000 to 10000 L) to achieve quantifiable loadings. Take care, however, not to overload the filter with background dust. If > 50% of the filter surface is covered with particles, the filter may be too overloaded to count and will bias the measured fiber concentration.
NOTE 2: OSHA regulations specify a minimum sampling volume of 48 L for an excursion measurement, and a maximum sampling rate of 2.5 L/min [3],
5. At the end of sampling, replace top cover and end plugs. 6. Ship samples with conductive cowl attached in a rigid container with packing material to prevent
jostling or damage. NOTE: Do not use untreated polystyrene foam in shipping container because electrostatic
forces may cause fiber loss from sample filter.
SAMPLE PREPARATION:
NOTE 1: The object is to produce samples with a smooth (non-grainy) background in a medium with refractive index <1.46. This method collapses the filter for easier focusing and produces permanent (1-10 years) mounts which are useful for quality control and interlaboratory comparison. The aluminum "hot block" or similar flash vaporization techniques may be used outside the laboratory [2], Other mounting techniques meeting the above criteria may also be used (e.g., the laboratory fume hood procedure for generating acetone vapor as described in Method 7400 -revision of 5/15/85, or the non-permanent field mounting technique used in P&CAM 239 [3,7,8,9]). Unless the effective filtration area is known, determine the area and record the information referenced against the sample ID number [1,9,10,11],
NOTE 2: Excessive water in the acetone may slow the clearing of the filter, causing material to be washed off the surface of the filter. Also, filters that have been exposed to high humidities prior to clearing may have a grainy background.
7. Ensure that the glass slides and cover slips are free of dust and fibers. 8. Adjust the rheostat to heat the "hot block" to ca. 70 °C [2],
NOTE: If the "hot block" is not used in a fume hood, it must rest on a ceramic plate and be isolated from any surface susceptible to heat damage.
9. Mount a wedge cut from the sample filter on a clean glass slide. a. Cut wedges of ca. 25% of the filter area with a curved-blade surgical steel knife using a
rocking motion to prevent tearing. Place wedge, dust side up, on slide. NOTE: Static electricity will usually keep the wedge on the slide.
NIOSH Manual of Analytical Methods (NMAM), Fourth Edition, 6/15/94

ASBESTOS and OTHER FIBERS by PCM: METHOD 7400, Issue 2. dated 15 August 1994 - Page 5 of 15
Insert slide with wedge into the receiving slot at base of "hot block". Immediately place tip of a micropipet containing ca. 250 pL acetone (use the minimum volume needed to consistently clear the filter sections) into the inlet port of the PTFE cap on top of the "hot block" and inject the acetone into the vaporization chamber with a slow, steady pressure on the plunger button while holding pipet firmly in place. After waiting 3 to 5 sec for the filter to clear, remove pipet and slide from their ports. CAUTION: Although the volume of acetone used is small, use safety precautions. Work in
a well-ventilated area (e.g., laboratory fume hood). Take care not to ignite the acetone. Continuous use of this device in an unventilated space may produce explosive acetone vapor concentrations.
Using the 5-pL micropipet, immediately place 3.0 to 3.5 pL triacetin on the wedge. Gently lower a clean cover slip onto the wedge at a slight angle to reduce bubble formation. Avoid excess pressure and movement of the cover glass. NOTE: If too many bubbles form or the amount of triacetin is insufficient, the cover slip may
become detached within a few hours. If excessive triacetin remains at the edge of the filter under the cover slip, fiber migration may occur.
Mark the outline of the filter segment with a glass marking pen to aid in microscopic evaluation. Glue the edges of the cover slip to the slide using lacquer or nail polish [12]. Counting may proceed immediately after clearing and mounting are completed. NOTE: If clearing is slow, warm the slide on a hotplate (surface temperature 50 °C) for up
to 15 mln to hasten clearing. Heat carefully to prevent gas bubble formation.
CALIBRATION AND QUALITY CONTROL:
10. Microscope adjustments. Follow the manufacturers instructions. At least once daily use the telescope ocular (or Bertrand lens, for some microscopes) supplied by the manufacturer to ensure that the phase rings (annular diaphragm and phase-shifting elements) are concentric. With each microscope, keep a logbook in which to record the dates of microscope cleanings and major servicing. a. Each time a sample is examined, do the following:
(1) Adjust the light source for even illumination across the field of view at the condenser iris. Use Kohler illumination, if available. With some microscopes, the illumination may have to be set up with bright field optics rather than phase contract optics.
(2) Focus on the particulate material to be examined. (3) Make sure that the field Iris is in focus, centered on the sample, and open only enough
to fully illuminate the field of view. b. Check the phase-shift detection limit of the microscope periodically for each
analyst/microscope combination: (1) Center the HSE/NPL phase-contrast test slide under the phase objective. (2) Bring the blocks of grooved lines into focus in the graticule area.
NOTE: The slide contains seven blocks of grooves (ca. 20 grooves per block) in descending order of visibility. For asbestos counting the microscope optics must completely resolve the grooved lines in block 3 although they may appear somewhat faint, and the grooved lines in blocks 6 and 7 must be invisible when centered in the graticule area. Blocks 4 and 5 must be at least partially visible but may vary slightly in visibility between microscopes. A microscope which fails to meet these requirements has resolution either too low or too high for fiber counting.
(3) If Image quality deteriorates, clean the microscope optics. If the problem persists, consult the microscope manufacturer.
11. Document the laboratory's precision for each counter for replicate fiber counts. a. Maintain as part of the laboratory quality assurance program a set of reference slides to be
used on a daily basis [13]. These slides should consist of filter preparations including a range of loadings and background dust levels from a variety of sources including both field
NIOSH Manual of Analytical Methods (NMAM), Fourth Edition, 8/15/94
d.
e.

ASBESTOS and OTHER FIBERS by PCM: METHOD 7400, Issue 2, dated 15 August 1994 - Page 6 of 15
and reference samples (e.g., PAT, AAR, commercial samples). The Quality Assurance Officer should maintain custody of the reference slides and should supply each counter with a minimum of one reference slide per workday. Change the labels on the reference slides periodically so that the counter does not become familiar with the samples,
b. From blind repeat counts on reference slides, estimate the laboratory intra- and intercounter precision. Obtain separate values of relative standard deviation (S r) for each sample matrix analyzed in each of the following ranges: 5 to 20 fibers in 100 graticule fields, >20 to 50 fibers in 100 graticule fields, and >50 to 100 fibers in 100 graticule fields. Maintain control charts for each of these data files. NOTE: Certain sample matrices (e.g., asbestos cement) have been shown to give poor
precision [9] 12. Prepare and count field blanks along with the field samples. Report counts on each field blank.
NOTE 1: The identity of blank filters should be unknown to the counter until all counts have been completed.
NOTE 2: If a field blank yields greater than 7 fibers per 100 graticule fields, report possible contamination of the samples.
13. Perform blind recounts by the same counter on 10% of filters counted (slides relabeled by a person other than the counter). Use the following test to determine whether a pair of counts by the same counter on the same filter should be rejected because of possible bias: Discard the sample if the absolute value of the difference between the square roots of the two counts (in fiber/mm2) exceeds 2.77 (X)S r where X = average of the square roots of the two fiber counts (in
fiber/mm2) and S^= ^ , where Sr is the intracounter relative standard deviation for the
appropriate count range (in fibers) determined in step 11. For more complete discussions see reference [13]. NOTE 1: Since fiber counting is the measurement of randomly placed fibers which may be
described by a Poisson distribution, a square root transformation of the fiber count data will result in approximately normally distributed data [13].
NOTE 2: If a pair of counts is rejected by this test, recount the remaining samples in the set and test the new counts against the first counts. Discard all rejected paired counts. It is not necessary to use this statistic on blank counts.
14. The analyst is a critical part of this analytical procedure. Care must be taken to provide a non-stressful and comfortable environment for fiber counting. An ergonomically designed chair should be used, with the microscope eyepiece situated at a comfortable height for viewing. External lighting should be set at a level similar to the illumination level in the microscope to reduce eye fatigue. In addition, counters should take 10-to-20 minute breaks from the microscope every one or two hours to limit fatigue [14]. During these breaks, both eye and upper back/neck exercises should be performed to relieve strain.
15. All laboratories engaged in asbestos counting should participate in a proficiency testing program such as the AIHA-NIOSH Proficiency Analytical Testing (PAT) Program for asbestos and routinely exchange field samples with other laboratories to compare performance of counters.
MEASUREMENT:
16. Center the slide on the stage of the calibrated microscope under the objective lens. Focus the microscope on the plane of the filter.
17. Adjust the microscope (Step 10). NOTE: Calibration with the HSE/NPL test slide determines the minimum detectable fiber
diameter (ca. 0.25 pm) [4]. 18. Counting rules: (same as P&CAM 239 rules [1,10,11]: see examples in APPENDIX B).
a. Count any fiber longer than 5 pm which lies entirely within the graticule area. (1) Count only fibers longer than 5 pm. Measure length of curved fibers along the curve. (2) Count only fibers with a length-to-width ratio equal to or greater than 3:1.
b. For fibers which cross the boundary of the graticule field:
NIOSH Manual of Analytical Methods (NMAM), Fourth Edition, 8/15/94

ASBESTOS and OTHER FIBERS by PCM: METHOD 7400, Issue 2, dated 15 August 1994 - Page 7 of 15
(1) Count as 1/2 fiber any fiber with only one end lying within the graticule area, provided that the fiber meets the criteria of rule a above.
(2) Do not count any fiber which crosses the graticule boundary more than once. (3) Reject and do not count all other fibers.
c. Count bundles of fibers as one fiber unless individual fibers can be identified by observing both ends of a fiber.
d. Count enough graticule fields to yield 100 fibers. Count a minimum of 20 fields, Stop at 100 graticule fields regardless of count.
19. Start counting from the tip of the filter wedge and progress along a radial line to the outer edge. Shift up or down on the filter, and continue in the reverse direction. Select graticule fields randomly by looking away from the eyepiece briefly while advancing the mechanical stage. Ensure that, as a minimum, each analysis covers one radial line from the filter center to the outer edge of the filter. When an agglomerate or bubble covers ca. 1/6 or more of the graticule field, reject the graticule field and select another. Do not report rejected graticule fields in the total number counted. NOTE 1: When counting a graticule field, continuously scan a range of focal planes by
moving the fine focus knob to detect very fine fibers which have become embedded in the filter. The small-diameter fibers will be very faint but are an important contribution to the total count. A minimum counting time of 15 seconds per field is appropriate for accurate counting.
NOTE 2: This method does not allow for differentiation of fibers based on morphology. Although some experienced counters are capable of selectively counting only fibers which appear to be asbestiform, there is presently no accepted method for ensuring uniformity of judgment between laboratories. It is, therefore, incumbent upon all laboratories using this method to report total fiber counts. If serious contamination from non-asbestos fibers occurs in samples, other techniques such as transmission electron microscopy must be used to identify the asbestos fiber fraction present in the sample (see NIOSH Method 7402). In some cases (i.e., for fibers with diameters >1 pm), polarized light microscopy (as in NIOSH Method 7403) may be
< used to identify and eliminate interfering non-crystalline fibers [15]. NOTE 3: Do not count at edges where filter was cut. Move in at least 1 mm from the edge. NOTE 4: Under certain conditions, electrostatic charge may affect the sampling of fibers.
These electrostatic effects are most likely to occur when the relative humidity is low (below 20%), and when sampling is performed near the source of aerosol. The result is that deposition of fibers on the filter is reduced, especially near the edge of the filter. If such a pattern is noted during fiber counting, choose fields as close to the center of the filter as possible [5].
NOTE 5: Counts are to be recorded on a data sheet that provides, as a minimum, spaces on which to record the counts for each field, filter identification number, analyst's name, date, total fibers counted, total fields counted, average count, fiber density, and commentary. Average count is calculated by dividing the total fiber count by the number of fields observed. Fiber density (fibers/mm 2) is defined as the average count (fibers/field) divided by the field (graticule) area (mm 2/field).
CALCULATIONS AND REPORTING OF RESULTS
20. Calculate and report fiber density on the filter, E (fibers/mm 2), by dividing the average fiber count per graticule field, F/n f, minus the mean field blank count per graticule field, B/n b, by the graticule field area, A f (approx. 0.00785 mm 2):
-, fibers/mm2.
NIOSH Manual of Analytical Methods (NMAM), Fourth Edition, 8/15/94

ASBESTOS and OTHER FIBERS by PCM: METHOD 7400, Issue 2, dated 15 August 1994 - Page 8 of 15
NOTE: Fiber counts above 1300 fibers/mm 2 and fiber counts from samples with >50% of filter area covered with particulate should be reported as "uncountable" or "probably biased." Other fiber counts outside the 100-1300 fiber/mm 2 range should be reported as having
"greater than optimal variability" and as being "probably biased."
21. Calculate and report the concentration, C (fibers/cc), of fibers in the air volume sampled, V (L), using the effective collection area of the filter, A 0 (approx. 385 mm2 for a 25-mm filter):
„ ( E )( A, > C"~VTW
NOTE: Periodically check and adjust the value of A c, if necessary. 22. Report intralaboratory and interlaboratory relative standard deviations (from Step 11) with each
set of results. NOTE: Precision depends on the total number of fibers counted [1,16]. Relative standard
deviation is documented in references [1,15-17] for fiber counts up to 100 fibers in 100 graticule fields. Comparability of interlaboratory results is discussed below. As a first approximation, use 213% above and 49% below the count as the upper and lower confidence limits for fiber counts greater than 20 (Fig. 1).
EVALUATION OF METHOD:
A. This method is a revision of P&CAM 239 [10]. A summary of the revisions is as follows: 1. Sampling:
The change from a 37-mm to a 25-mm filter improves sensitivity for similar air volumes. The change in flow rates allows for 2-m 3 full-shift samples to be taken, providing that the filter is not overloaded with non-fibrous particulates. The collection efficiency of the sampler is not a function of flow rate in the range 0.5 to 16 L/min [10].
2. Sample Preparation Technique: The acetone vapor-triacetin preparation technique is a faster, more permanent mounting technique than the dimethyl phthalate/diethyl oxalate method of P&CAM 239 [2,4,10]. The aluminum "hot block" technique minimizes the amount of acetone needed to prepare each sample.
3. Measurement: a. The Walton-Beckett graticule standardizes the area observed [14,18,19]. b. The HSE/NPL test slide standardizes microscope optics for sensitivity to fiber diameter
[4,14]. c. Because of past inaccuracies associated with low fiber counts, the minimum recommended
loading has been increased to 100 fibers/mm 2 filter area (a total of 78.5 fibers counted in 100 fields, each with field area = .00785 mm 2.) Lower levels generally result in an overestimate of the fiber count when compared to results in the recommended analytical range [20]. The recommended loadings should yield intracounter S r in the range of 0.10 to 0.17 [21,22,23].
B. Interlaboratory comparability: An international collaborative study involved 16 laboratories using prepared slides from the asbestos cement, milling, mining, textile, and friction material industries [9], The relative standard deviations (Sr) varied with sample type and laboratory. The ranges were:
NIOSH Manual of Analytical Methods (NMAM), Fourth Edition, 8/15/94

ASBESTOS and OTHER FIBERS by PCM: METHOD 7400, Issue 2, dated 1:5 August 1994 - Page 9 of 15
Intralaboratorv Sr Interlaboratorv Sr Overall S,
AIA (NIOSH A Rules)* Modified CRS (NIOSH B Rules)**
0.12 to 0.40 0.27 to 0.85 0.46 0.11 to 0.29 0.20 to 0.35 0,25
* Under AIA rules, only fibers having a diameter less than 3 pm are counted and fibers attached to particles larger than 3 pm are not counted. NIOSH A Rules are otherwise similar to the AIA rules.
** See Appendix C.
A NIOSH study conducted using field samples of asbestos gave intralaboratory S r in the range 0.17 to 0.25 and an interlaboratory S r of 0.45 [21], This agrees well with other recent studies [9,14^16],
At this time, there is no independent means for assessing the overall accuracy of this method. One measure of reliability is to estimate how well the count for a single sample agrees with the mean count from a large number of laboratories. The following discussion indicates how this estimation can be carried out based on measurements of the interlaboratory variability, as well as showing how the results of this method relate to the theoretically attainable counting precision and to measured intra- and interlaboratory S r. (NOTE: The following discussion does not include bias estimates and should not be taken to indicated that lightly loaded samples are as accurate as properly loaded ones).
Theoretically, the process of counting randomly (Poisson) distributed fibers on a filter surface will give an Sr that depends on the number, N, of fibers counted:
Thus Sr is 0.1 for 100 fibers and 0.32 for 10 fibers counted. The actual S r found in a number of studies is greater than these theoretical numbers [17,19,20,21],
An additional component of variability comes primarily from subjective interlaboratory differences. In a study often counters in a continuing sample exchange program, Ogden [15] found this subjective component of intralaboratory S r to be approximately 0.2 and estimated the overall S r by the term:
Ogden found that the 90% confidence interval of the individual intralaboratory counts in relation to the means were +2 S r and -1.5 Sr. In this program, one sample out of ten was a quality control sample. For laboratories not engaged in an intensive quality assurance program* the subjective component of variability can be higher.
In a study of field sample results in 46 laboratories, the Asbestos Information Association also found that the variability had both a constant component and one that depended on the fiber count [14]. These results gave a subjective interlaboratory component of S r (on the same basis as Ogden's) for field samples of ca. 0.45. A similar value was obtained for 12 laboratories analyzing a set of 24 field samples [21]. This value falls slightly above the range of S r (0.25 to 0.42 for 1984-85) found for 80 reference laboratories in the NIOSH PAT program for laboratory-generated samples [17].
A number of factors influence S , for a given laboratory, such as that laboratory's actual counting performance and the type of samples being analyzed. In the absence of other information, such as from an interlaboratory quality assurance program using field samples, the value for the subjective component of variability is chosen as 0.45. It is hoped that the laboratories will carry out the recommended interlaboratory quality assurance programs to improve their performance and thus reduce the S r.
Sr = 1/( N )1'2 (1)
[ N + ( 0.2 • N )2 p N
(2)
NIOSH Manual of Analytical Methods (NMAM), Fourth Edition, 8/15/94

ASBESTOS and OTHER FIBERS by PCM: METHOD 7400, Issue 2, dated 15 August 1994 - Page 10 of 15
The above relative standard deviations apply when the population mean has been determined. It is more useful, however, for laboratories to estimate the 90% confidence interval on the mean count from a single sample fiber count (Figure 1). These curves assume similar shapes of the count distribution for interlaboratory and intralaboratory results [16].
For example, if a sample yields a count of 24 fibers, Figure 1 indicates that the mean interlaboratory count will fall within the range of 227% above and 52% below that value'90% of the time. We can apply these percentages directly to the air concentrations as well. If, for instance, this sample (24 fibers counted) represented a 500-L volume, then the measured concentration is 0.02 fibers/mL (assuming 100 fields counted, 25-mm filter, 0.00785 mm 2 counting field area). If this same sample were counted by a group, of laboratories, there is a 90% probability that the mean would fall between 0.01 and 0.08 fiber/mL. These limits should be reported in any comparison of results between laboratories.
Note that the S r of 0.45 used to derive Figure 1 is used as an estimate for a random group of laboratories. If several laboratories belonging to a quality assurance group can show that their interlaboratory S r is smaller, then it is more correct to use that smaller S r. However, the estimated S r of 0.45 is to be used in the absence of such information. Note also that it has been found that S r can be higher for certain types of samples, such as asbestos cement [9].
Quite often the estimated airborne concentration from an asbestos analysis is used to compare to a regulatory standard. For instance, if one is trying to show compliance with an 0.5 fiber/mL standard using a single sample on which 100 fibers have been counted, then Figure 1 indicates that the 0.5 fiber/mL standard must be 213% higher than the measured air concentration. This indicates that if one measures a fiber concentration of 0.16 fiber/mL (100 fibers counted), then the mean fiber count by a group of laboratories (of which the compliance laboratory might be one) has a 95% chance of being less than 0.5 fibers/mL; i.e., 0.16 + 2.13 x 0.16 = 0.5.
It can be seen from Figure 1 that the Poisson component of the variability is not very important unless the number of fibers counted is small. Therefore, a further approximation is to simply use +213% and -49% as the upper and lower confidence values of the mean for a 100-fiber count.
Figure 1. Interlaboratory Precision of Fiber Counts
NIOSH Manual of Analytical Methods (NMAM), Fourth Edition, 8/15/94

ASBESTOS and OTHER FIBERS by PCM: METHOD 7400, Issue 2, dated 15 August 1994 - Page 11 of 15
The curves in Figures 1 are defined by the following equations:
UCL = 2 X + 2,25 » [(2,25 • 2 X)2 - 4 ( 1 - 2.26 St2) X2]1"
2(1- 2.25 S,2)
LCL • 2 X • 4 - [(4 + 2 X )2 - 4 (1 - 4 S,2 ) X* ]w
2(1 - 4 Sf2 )
where Sr = subjective interlaboratory relative standard deviation, which is close to the total intertoboratory Sr when approximately 100 fibers are counted.
X = total fibers counted on sample LCL = lower 95% confidence limit. UCL = upper 95% confidence limit.
Note that the range between these two limits represents 90% of the total range.
REFERENCES;
[ I ] Leidel , N. A. , S. G. Bayer, R. D. Zumwalde, and K. A. Busch. USPHS/NIOSH Membrane Fi l ter Method for Evaluating Airborne Asbestos Fibers, U.S. Department of Health, Education, and Welfare, Publ. (NIOSH) 79-127 (1979).
12] Baron, P. A. and G. C. Pickford. "An Asbestos Sample Filter Clearing Procedure," ADDI. Ind. Hva.. 1:169-171, 199 (1986).
[3] Occupational Safety and Health Administration, U.S. Department of Labor, Occupational Exposure to Asbestos, Tremolite, Anthophyllite, and Actinolite Asbestos; Final Rules, 29 CFR Part 1910.1001 Amended June 20, 1986.
[4] Rooker, S. J., N. P. Vaughn, and J. M. LeGuen. "On the Visibility of Fibers by Phase Contrast Microscopy," Amer. Ind. Hva. Assoc. J., 43, 505-515 (1982).
[5] Baron, P. and G. Deye, "Electrostatic Effects in Asbestos Sampling," Parts I and II Amer. JQJL Hya. Assoc. J.. 51, 51-69 (1990).
[6] Johnston, A. M., A. D. Jones, and J. H. Vincent. "The Influence of External Aerodynamic Factors on the Measurement of the Airborne Concentration of Asbestos Fibers by the Membrane Filter Method," AOQ. OCCUD. HVo.. 25, 309-316 (1982).
[7] Beckett, ST,, "The Effects of Sampling Practice on the Measured Concentration of Airborne Asbestos," Aon- Occup. Hya.. 21. 259-272 (1980).
[8] Jankovie, J. T., W. Jones, and J. Clere. "Field Techniques for Clearing Cellulose Ester Filters Used in Asbestos Sampling," ADDI. Ind. Hya.. 1, 145-147 (1986).
[9] Crawford, N. P., H. L. Thorpe, and W. Alexander. "A Comparison of the Effects of Different Counting Rules and Aspect Ratios on the Level and Reproducibility of Asbestos Fiber Counts," Part I: Effects on Level (Report No. TM/82/23), Part ll: Effects on Reproducibility (Report No. TM/82/24), Institute of Occupational Medicine, Edinburgh, Scotland (December, 1982).
[10] NIOSH Manual of Analytical Methods, 2nd ed., Vol. 1., P&CAM 239, U.S. Department of Health, Education, and Welfare, Publ. (NIOSH) 77-157-A (1977).
[ I I ] Revised Recommended Asbestos Standard, U.S. Department of Health, Educat ion, and Welfare, Publ. (NIOSH) 77-169 (1976); as amended in NIOSH statement at OSHA Public Hearing, June 21, 1984.
[12] Asbestos International Association, AIA Health and Safety Recommended Technical Method #1 (RTMI). "Airborne Asbestos Fiber Concentrations at Workplaces by Light Microscopy" (Membrane Filter Method), London (1979),
[13] Abell, M., S. Shulman and P. Baron. The Quality of Fiber Count Data, Appl. Ind. Hyp.. 4, 273-285 (1989).
NIOSH Manual of Analytical Methods (NMAM), Fourth Edition, 8/15/94

ASBESTOS and OTHER FIBERS by PCM: METHOD 7400, Issue 2, dated 15 August 1994 - Page 12 of 15
[14] "A Study of the Empirical Precision of Airborne Asbestos Concentration Measurements in the Workplace by the Membrane Filter Method," Asbestos Information Association, Air Monitoring Committee Report, Arlington, VA (June, 1983).
[15] McCrone, W., L. McCrone and J. Delly, "Polarized Light Microscopy," Ann Arbor Science (1978). [16] Ogden, T. L. "The Reproducibility of Fiber Counts," Health and Safety Executive Research
Paper 18 (1982). [17] Schlecht, P. C. and S. A. Schulman. "Performance of Asbestos Fiber Counting Laboratories in
the NIOSH Proficiency Analytical Testing (PAT) Program," Am. [Qd. Hva. Assoc. J., 47, 259-266 (1986).
[18] Chatfield, E. J. Measurement of Asbestos Fiber Concentrations in Workplace Atmospheres, Royal Commission on Matters of Health and Safety Arising from the Use of Asbestos in Ontario, Study No. 9, 180 Dundas Street West, 22nd Floor, Toronto, Ontario, CANADA M5G 1Z8.
[19] Walton, W. H. "The Nature, Hazards, and Assessment of Occupational Exposure to Airborne Asbestos Dust: A Review," Ann. Occup. Hya.. 25, 115-247 (1982).
[20] Cherrie, J., A.D. Jones, and A.M. Johnston. 'The Influence of Fiber Density on the Assessment of Fiber Concentration Using the membrane filter Method." Am- 1M- Hva. Assoc. J., 47(81. 465-74(1986).
[21] Baron, P. A. and S. Shulman. "Evaluation of the Magiscan Image Analyzer for Asbestos Fiber Counting." Am. JM- Hva. Assoc. J., (in press).
[22] Taylor, D. G., P. A. Baron, S. A. Shulman and J. W. Carter. "Identification and Counting of Asbestos Fibers," Am- 1M- Hvq. Assoc. J. 45(21. 84-88 (1984).
[23] "Potential Health Hazards of Video Display Terminals," NIOSH Research Report, June 1981. [24] "Reference Methods for Measuring Airborne Man-Made Mineral Fibers (MMMF)," WHO/EURO
Technical Committee for Monitoring an Evaluating Airborne MMMF, World Health Organization, Copenhagen (1985).
[25] Criteria for a Recommended Standard...Occupational Exposure to Fibrous Glass, U.S. Department of Health, Education, and Welfare, Publ. (NIOSH) 77-152 (1977).
METHOD WRITTEN BY:
Paul A. Baron, Ph.D., NIOSH/DPSE.
APPENDIX A: CALIBRATION OF THE WALTON-BECKETT GRATICULE:
Before ordering the Walton-Beckett graticule, the following calibration must be done to obtain a counting area (D) 100 pm in diameter at the image plane. The diameter, d c (mm), of the circular counting area and the disc diameter must be specified when ordering the graticule.
1. Insert any available graticule into the eyepiece and focus so that the graticule lines are sharp and clear.
2. Set the appropriate interpupillary distance and, if applicable, reset the binocular head adjustment so that the magnification remains constant.
3. Install the 40 to 45X phase objective. 4. Place a stage micrometer on the microscope object stage and focus the microscope on the
graduated lines. 5. Measure the magnified grid length of the graticule, L „ (pm), using the stage micrometer. 6. Remove the graticule from the microscope and measure its actual grid length, L a (mm). This can
best be accomplished by using a stage fitted with verniers. 7. Calculate the circle diameter, d c (mm), for the Walton-Beckett graticule:
NIOSH Manual of Analytical Methods (NMAM), Fourth Edition, 8/15/94

ASBESTOS and OTHER FIBERS by PCM: METHOD 7400, Issue 2, dated 15 August 1994 - Page 13 of 15
i = SD. (5)
Example: If L0 = 112 pm, La = 4.5 mm and D = 100 pm* then d c = 4.02 mm.
8. Check the field diameter, D (acceptable range 100 pm ± 2 pm) with a stage micrometer upon receipt of the graticule from the manufacturer. Determine field area (acceptable range 0.00754 mm2 to 0.00817 mm2).
APPENDIX B: COMPARISON OF COUNTING RULES:
Figure 2 shows a Walton-Beckett graticule as seen through the microscope. The rules will be discussed as they apply to the labeled objects in the figure.
Figure 2. Walton-Beckett graticule with fibers.
NIOSH Manual of Analytical Methods (NMAM), Fourth Edition, 6/15/94

ASBESTOS and OTHER FIBERS by PCM: METHOD 7400, Issue 2, dated 15 August 1994 - Page 14 of 15
These rules are sometimes referred to as the "A" rules.
FIPER COUNT
Qbject Count
1 1 fiber
2 fiber
DISCUSSION
1 fiber
1 fiber
Do not count
1 fiber
1/2 fiber
Optically observable asbestos fibers are actually bundles of fine fibrils. If the fibrils seem to be from the same bundle the object is counted as a single fiber. Note, however, that all objects meeting length and aspect ratio criteria are counted whether or not they appear to be asbestos.
If fibers meeting the length and aspect ratio criteria (length >5 pm and length-to-width ratio >3 to 1) overlap, but do not seem to be part of the same bundle, they are counted as separate fibers.
Although the object has a relatively large diameter (>3 pm), it is counted as fiber under the rules. There Is no upper limit on the fiber diameter in the counting rules. Note that fiber width is measured at the widest compact section of the object.
Although long fine fibrils may extend from the body of a fiber, these fibrils are considered part of the fiber if they seem to have originally been part of the bundle.
If the object is <5 pm long, it is not counted.
A fiber partially obscured by a particle is counted as one fiber. If the fiber ends emanating from a particle do not seem to be from the same fiber and each end meets the length and aspect ratio criteria, they are counted as separate fibers.
A fiber which crosses into the graticule area one time is counted as 1/2 fiber.
Do not Ignore fibers that cross the graticulate boundary more than once, count count
Do not count
Ignore fibers that lie outside the graticule boundary.
NIOSH Manual of Analytical Methods (NMAM), Fourth Edition, 8/15/94

ASBESTOS and OTHER FIBERS by PCM: METHOD 7400, Issue 2, dated 15 August 1994 - Page 15 of 15
APPENDIX C. ALTERNATE COUNTING RULES FOR NON-ASBESTOS FIBERS
Other counting rules may be more appropriate for measurement of specific non-asbestos fiber types, such as fibrous glass. These include the "B" rules given below (from NIOSH Method 7400, Revision #2, dated 8/15/87), the World Health Organization reference method for man-made mineral fiber [24], and the NlOSH fibrous glass criteria document method [25]. The upper diameter limit in these methods prevents measurements of non-thoracic fibers, it is important to note that the aspect ratio limits included in these methods vary. NIOSH recommends the use of the 3:1 aspect ratio in counting fibers.
It is emphasized that hybridization of different sets of counting rules is not permitted. Report specifically which set of counting rules are used with the analytical results.
"B" COUNTING RULES:
1. Count only ends of fibers. Each fiber must be longer than 5 pm and less than 3 pm diameter. 2. Count only ends of fibers with a length-to-width ratio equal to or greater than 5:1. 3. Count each fiber end which falls within the graticule area as one end, provided that the fiber meets
rules 1 and 2 above. Add split ends to the count as appropriate if the split fiber segment also meets the criteria of rules 1 and 2 above.
4. Count visibly free ends which meet rules 1 and 2 above when the fiber appears to be attached to another particle, regardless of the size of the other particle. Count the end of a fiber obscured by another particle if the particle covering the fiber end is less than 3 pm in diameter,
5. Count free ends of fibers emanating from large clumps and bundles up to a maximum of 10 ends (5 fibers), provided that each segment meets rules 1 and 2 above.
6. Count enough graticule fields to yield 200 ends. Count a minimum of 20 graticule fields. Stop at 100 graticule fields, regardless of count.
7. Divide total end count by 2 to yield fiber count.
APPENDIX D. EQUIVALENT LIMITS OF DETECTION AND QUANTITATION
fiber density on filter* fiber concentration in air, f/cc fibers 400-L air 1000-L air
Der tOO fields fibers/mm2 sample sample
200 255 0.25 0.10 100 127 0.125 0.05
LOQ 80 102 0.10 0.04 50 64 0.0625 0.025 25 32 0.03 0.0125 20 , 25 0.025 0.010 10 12.7 0.0125 0.005 8 10.2 0.010 0.004
LOD. 5.5 ..7 0.00675 0.0027
* Assumes 385 mm2 effective filter collection area, and field area = 0.00785 mm 2, for relatively "clean" (little particulate aside from fibers) filters.
NIOSH Manual of Analytical Methods (NMAM), Fourth Edition, 8/15/94

INSERT SIGNATURE PAGE: ISSI-Libby-01

TECHNICAL STANDARD OPERATING PROCEDURESOIL SAMPLE PREPARATION
Technical Standard Operating ProceduresISSI Consulting Group, Inc.Contract No. N00174-99-D-003Account No.: N120-023-003R:\Libby Asbestos\Project Plans\Env Media QAPP\Phase 2\Phase 2 QAPP\Phase 2 SOPs\Soil Prep SOP.wpd
SOP No. ISSI-LIBBY-01Revision No.: 2
Date: 07/2000
Page 1 of 6
Date: July 12, 2000 (Rev. # 2) SOP No. ISSI-LIBBY-01
Title: SOIL SAMPLE PREPARATION
APPROVALS:
Author William Brattin ISSI Consulting Group Inc. Date: July 12, 1999
_________________________________________________________________________
SYNOPSIS: A standardized method for homogenization of surface soil samples isdescribed. Protocols for sample preparation and handling are provided.
_________________________________________________________________________
Received by QA Unit:
REVIEWS:
TEAM MEMBER SIGNATURE/TITLE DATE
EPA Region 8 _____________________________ _________
ISSI Consulting Group, Inc. _____________________________ _________
Revision Date Reason for Revision
1/7/99 Incorporation of sieving to the sample preparation.
7/12/00 Revision in sieve size, other minor edits.

TECHNICAL STANDARD OPERATING PROCEDURE SOIL SAMPLE PREPARATION
1.0 PURPOSE
The purpose of this Standard Operating Procedure (SOP) is to provide a standardized method for homogenizing surface soil samples. This procedure will be used by employees of USEPA Region 8 and by contractors/subcontractors supporting USEPA Region 8 projects and tasks. This SOP describes the equipment and operations used for homogenizing surface soil samples in a manner that will produce data that can be used to support risk evaluations. Site-specific deviations from the procedures outlined in this document must be approved by the USEPA Region 8 Remedial Project Manager, or Regional Toxicologist prior to initiation of the sampling activity.
2.0 RESPONSIBILITIES
The Field Project Leader (FPL) may be an USEPA employee or contractor who is responsible for overseeing the surface soil sampling activities. The FPL is also responsible for checking all work performed and verifying that the work satisfies the specific tasks outlined by this SOP and the Project Plan. It is the responsibility of the FPL to communicate with the Field Personnel regarding specific collection objectives and anticipated situations that require any deviation from the Project Plan. It is also the responsibility of the FPL to communicate the need for any deviations from the Project Plan with the appropriate USEPA Region 8 personnel (Remedial Project Manager, or Regional Toxicologist).
Field personnel performing surface soil sampling are responsible for adhering to the applicable tasks outlined in this procedure while homogenizing surface soil samples.
3.0 EQUIPMENT
• General purpose laboratory oven - must be capable of maintaining a constant temperature of approximately 103-105°C.
• Sample drying travs - capable of holding an even layer of the complete sample volume of each sample. To minimize the decontamination effort, disposable drying trays are recommended.
• Analytical balance - accurate to 0.1 g, range of 0.1 g to 1000 g
• Riffle splitter - with 3/4 to 1 inch chutes to split samples
• Stainless steel or teflon SCOOP or spoon - for transferring samples
• 1-cm mesh stainless steel sieve and catch pan - for coarse sieving samples
Collection containers - plastic ziplock bags.
Technical Standard Operating Procedures SQp No ISSI.LIBBY.01
ISSI Consulting Group, Inc. „ . . XT Contract No. N00174-99-D-003 Account No.: N120-023-003 Date. 07/2000 R:\Libby Asbestos\Project PlansVEnv Media QAPPVPhase 2\Phase 2 QAPP\Phase 2 SOPs\Soi! Prep SOP.wpd Page 2 of 6

TECHNICAL STANDARD OPERATING PROCEDURE SOIL SAMPLE PREPARATION
• Gloves - for personal protection and to prevent cross-contamination of samples. May be plastic or latex. Disposable, powderless.
• Field clothing and Personal Protective Equipment - as specified in the Health and Safety Plan.
• Field notebook -used to record progress, any problems or observations.
• Permanent marking pen - used to label sample containers.
• Three-ring binder book - binders will contain Soil Preparation Sheets, Field Split Sample Log sheets, and sample labels.
• Trash Bag - used to dispose of gloves and wipes.
4.0 METHOD SUMMARY
Soil samples will be dried in a standard laboratory oven, then homogenized and split for subsequent analysis.
5.0 BULK SOIL DRYING
Set the oven temperature to 103-105 °C (not to exceed 115 °C). Establish the drying time by weighing a representative sample before drying, at estimated completion, and following an additional 15 minute drying time to confirm stable weight. Verify that the sample is completely dry using the "squeeze test", squeezing a portion of the sample between a freshly gloved thumb and forefinger. Sample dryness is indicated by a lack of cohesiveness in the soil.
Prior to drying each sample, record the weight on the Sample Preparation Logbook Sheet. Spread the sample on the drying tray in an even layer to promote even drying. Check the oven temperature to verify that proper temperature has been reached. Mark each tray with the sample ID number. Cover each sample with cheesecloth to minimize the potential for cross-sample contamination. Place the drying trays containing the samples in the oven. Leave the samples in the oven until completely dry. Verify that each sample is dry by testing cohesiveness using a freshly gloved thumb and forefinger. Record the weight after drying on the Sample Preparation Logbook Sheet. Document the sample drying time for each sample on the Soil Preparation Logbook Sheet (Attachment 1).
When samples are dry, remove from the oven area and place in the ventilation area. Before placing samples in the ventilation area, verify that the hood is turned on. A new pair of gloves must be worn for each sample.
The sample should be coarse sieved using a 1-cm screen. Pour the material which passed through the sieve into a new sample bag, and mark the outside of the bag with the sample ID. Gently knead contents of the bag to break up any remaining soil clumps. Completely seal the
SOP No. imippV-OI Contract No. N00174-99-D-003 ®VISI°" Account No.: N120-023-003 Date: 07/2000
R:\Libby AsbestosXProject PlansXEnv Media QAPPXPhase 2\Phase 2 QAPPXPhase 2 SOPsXSoil Prep SOP.wpd Page 3 of 6
TECHNICAL STANDARD OPERATING PROCEDURE SOIL SAMPLE PREPARATION
bag, then mix by turning the bag end-over-end slowly, for a minimum of ten times.
6.0 SAMPLE SPLITTING
Following the procedures outlined in Section 5.0, the soil sample should be well-homogenized. With the hood turned on, open the sample bag and use a clean and dry riffle splitter to split each sample.
The following method for splitting a soil sample was adapted from EPA 540-R-97-028 (USEPA, 1997). The sample is split by placing soil onto a splitter tray. Shake the tray to evenly distribute the sample. Place the long lip of the tray against the long lip of the splitter hopper and slowly rotate the tray so that the sample slowly empties into the splitter and slides down the near wall of the hopper to the chutes, collecting the sample in two receiving trays. Tap the sample tray vigorously several times to free any remaining material. Tap the splitter to facilitate the flow of all material through the chutes into the receiving trays. The corners and nooks of the splitter may be cleaned with a coarse nylon brush.
Pour the material from one of the receiving trays into a clean bucket and tap the tray vigorously to assure complete transfer. This portion is designated for archive. The original sample tray (which is now empty), and the emptied receiving tray should be placed under the splitter as the new receiving trays.
Repeat the process of dispersing the remaining sample material (containing half the mass of the original sample) by shaking the sample tray so that it is uniformly distributed. Repeat the procedure described above for splitting the sample. At the end of the second split, carefully transfer the material from each of the receiving trays into a clean, pre-weighed sample bag to be weighed and packaged for shipment to the laboratory and to W.R. Grace. Record each split sample ID, and the original sample ID on the Field Split Sample Log Sheet (Attachment 1).
7.0 FIELD DOCUMENTATION
Each sample ID must be recorded on the data sheets. Original sample ID numbers are recorded on the Soil Preparation Sheets, and the Field Split Sample Log sheets. When the original sample is split, the original sample ID number, and each new sample, must be recorded.
In addition, a field notebook should be maintained by each individual or team that is preparing samples. For each day that samples are processed, the following information should be collected:
date time personnel weather conditions analytical balance calibration drying oven temperature descriptions of any deviations to the Project Plan and the reason for the deviation
Technical Standard Operating Procedures ISSI Consulting Group, Inc. Contract No. N00174-99-D-003 Account No.: N120-023-003 R:\Libby AsbestosVProject Plans\Env Media QAPP\Phase 2\Phase 2 QAPP\Phase 2 SOPs\Soil Prep SOP.wpd
SOP No ISSI-L1BBY-01 Revision No.: 2
Date: 07/2000
Page 4 of 6
TECHNICAL STANDARD OPERATING PROCEDURE SOIL SAMPLE PREPARATION
Field personnel will prepare the proper type and quantity of quality control samples as prescribed in the Project Plan.
8.0 DECONTAMINATION
All non-dedicated equipment used during sample preparation must be decontaminated prior to use. It is recommended that disposable oven trays be used to minimize the decontamination effort. Stainless steel or teflon scoops or spoons, splitters, sieves and drying trays that will be reused, must be decontaminated with de-ionized (DI) water and disposable wipes or towels. DI water is poured over the equipment, then wiped, then rinsed again with DI water. If soil particles are visible on any of the equipment, repeat this procedure until the equipment is clean. All equipment must be dry before it is re-used.
9.0 GLOSSARY
Project Plan - The written document that spells out the detailed site-specific procedures to be followed by the Project Leader and the Field Personnel.
10.0 REFERENCES
American Society for Testing and Materials. 1998. Standard Practice for Reducing Samples of Aggregate to Testing Size, ASTM Designation: C 702 - 98, 4 p.
USEPA. 1997. Superfund Method for the Determination of Releasable Asbestos in Soils and Bulk Materials. EPA 540-R-97-028.
SOP No. ISSI-L1BBY-0I Contract No. N00174-99-D-003 Account No.: N120-023-003 Date 07/2000
R:\Libby Asbestos\Project Plans\Env Media QAPP\Phase 2\Phase 2 QAPP\Phase 2 SOPs\Soil Prep SOP.wpd Page 5 of 6

TECHNICAL STANDARD OPERATING PROCEDURESOIL SAMPLE PREPARATION
Technical Standard Operating ProceduresISSI Consulting Group, Inc.Contract No. N00174-99-D-003Account No.: N120-023-003R:\Libby Asbestos\Project Plans\Env Media QAPP\Phase 2\Phase 2 QAPP\Phase 2 SOPs\Soil Prep SOP.wpd
SOP No. ISSI-LIBBY-01Revision No.: 2
Date: 07/2000
Page 6 of 6
ATTACHMENT 1
INSERT SAMPLE PREPARATION LOGBOOK SHEET

INSERT FIELD SPLIT SHEET

INSERT METHOD: CDM SOP 4-1

INSERT METHOD: CDM SOP 1-2


INSERT METHOD: CDM SOP 2-5

INSERT APPENDIX C DIVIDER PAGE

APPENDIX C
LABORATORY DATA SHEETS

TEM Asbestos Structure Count ISO 10312 Rules
Page of
Laboratory Name:
Lab Sample Number: Filter Type: Preparation Date:
EPA Sample Number: Filter Area : Prepared By:
Instrument: Grid Opening Area: Analyst:
Mag/Volts: No. GO'S Analyzed: Date Analyzed:
Grid Grid Opening Number of Structures Identification Structure Type Length Width Comments Grid Grid Opening
Primary Secondary
Identification Structure Type Length Width Comments
Page of PCM Asbestos Structure Count

NIOSH 7400 Rules
Laboratory Name:
Prepared By: Preparation Date: Filter Area:
Analyzed By: Date Analyzed: Field Area:
Laboratory ID Client Sample # # Fibers # Fields Fibers /mm3 Overloaded
~
•

INSERT APPENDIX D DIVIDER PAGE

APPENDIX D RESIDENTIAL ACTIVITY LOG Resident Address: Volunteer Name: Sampling Date: Personal air pump start: AM Personal air pump stop: PM
Time Interval Go outside? Clean? Pump problem? General Activities
No Yes ( min)
No Yes (describe)
No Yes (describe)
No Yes ( min)
No Yes (describe)
No Yes (describe)
No Yes ( min)
No Yes (describe)
No Yes (describe)
No Yes ( min)
No Yes (describe)
No Yes (describe)
-
No Yes ( min)
No Yes (describe)
No Yes (describe)
No Yes ( min)
No Yes (describe)
t '
No Yes (describe)
No Yes ( min)
No Yes (describe)
No Yes (describe)

INSERT APPENDIX E DIVIDER PAGE

APPENDIX E
CHAIN OF CUSTODY FORM

INSERT E-COC FORM


INSERT APPENDIX F DIVIDER PAGE
I

APPENDIX F STATISTICAL COMPARISON OF TWO POISSON RATES
1,0 INTRODUCTION
An important part of the Quality Control plan for this project is the re-preparation and re-
analysis of a number of TEM grids for quantification of asbestos fiber concentrations in
air. Because of random variation, it is not expected that results from re-preparations
samples should be identical. This appendix presents the statistical method for
comparing two measur3ements and determining whether they are statistically different or not,
2.0 STATISTICAL METHOD
This method is taken from the textbook entitled "Applied Life Data Analysis" (Nelson
1982). Input values required for the test are as follows:
Y1 - Fiber count in first evaluation
t1 = Number of grid openings in first evaluation
Y2 = Fiber count in second evaluation
t2 = Number of grid openings in second evaluation
The test is performed by following the following steps:
Step 1:
Calculate Y = (Y1+Y2)/2 t = (t1 + t2) / 2 A = Y /1
F-1

Step 2:
Calculate Q = (Y1-Y)2 / (X t1) + (Y2-Y)2 / (Xt2)
Step 3:
Compare Q to the critical value of CHISQ(1-a,1) from the following table:
Alpha CHISQ(1-a,1)
0.05 3.841
0.10 2.706
0.20 1.642
0.30 1.074
If Q is less than or equal to CHISQ(1-a,1), conclude that the two results are not
statistically different at the 100(1-oc)% confidence level.
If Q is greater than CHISQ(1-a,1), conclude that the two results are statistically different
at the 100(1-a)% confidence level.
F-2

INSERT APPENDIX G DIVIDER PAGE

APPENDIX G
CALCULATION OF TARGET DETECTION LIMITS AND ASSOCIATED SAMPLING AND ANALYSIS PARAMETERS
FOR ASBESTOS FIBERS IN AIR SAMPLES
1.0 Basic Equations
As noted above, risk from inhalation exposure to asbestos fibers may be calculated using two alternative risk models (IRIS 2000, Berman and Crump 1999). In either case, the basic risk equation is:
Risk = C * UR * TWF
where:
C = Concentration of fibers in air (f/mL) UR = Unit Risk (risk per f/mL) TWF = Time weighting factor (fraction of full time that exposure occurs)
The target detection limit needed to achieve some specified Target Risk level is then:
DL = TR / (UR * TWF)
where:
TR = Target cancer risk
2.0 Calculation of Target Detection Limits
Each of the three input parameters needed to calculate the target Detection Limit are discussed below, along with the resulting values.
Target Risk
G-1

Target Risk is a risk management judgement, and may depend on a number of factors. For the purposes of these calculations, the Target Risk was assumed to be 1E-04.
Unit Risk
As noted above, there are two alternative methods for estimating cancer risk from asbestos, and hence there are 2 alternative values for UR:
IRIS (2000) identifies a unit risk of 0.23 per PCM fiber per mL
Berman and Crump (1999) identify a unit risk of 5.72 per TEM protocol structures per mL, assuming that 30% of the protocol structures are longer than 10 urn in length. This value is the average across males and females, and across smokers and non-smokers.
Time Weighting Factor
The time weighting factor is the fraction of full time that exposure occurs. This in turn depends on the assumed time, frequency, and duration of exposure. For the purposes of these calculations, the following assumptions were used:
Activity Exposure Time (hr/day)
Exposure Freq. (days/yr)
Exposure Duration (years)
TWF
Routine 24 365 70 1.000
Cleaning 2 50 50 0.0082
Remodeling 4 5 5 0.002
Rototilling 2 5 50 0.008
Note that these assumptions may not be identical to those that are used in actual risk calculations. Rather, these are values selected to represent a conservative estimate of the actual exposure associated with each scenario.
G-2

Results
Based on these inputs, the target detection limits are as follows:
Activity Target Detection Limit
Activity IRIS
(PCM fibers/mL) Berman and Crump (TEM fibers/mL)
Routine 4E-04 2E-05
Cleaning 5E-02 2E-03
Remodeling 3E+00 1E-01
Rototilling 5E-01 2E-02
3.0 Selection of Sampling and Analysis Parameters
The basic equation for calculating the Limit of Detection (LOD) which will be achieved for a specified set of sampling and analysis parameters is as follows:
LOD =95%UCL(0) * Af / (N * Ag * V)
where:
95% UCL(O) = 95% upper confidence limit on an observed count of zero Af = effective area of the filter N = Number of grid openings or fields counted Ag = area of a grid opening or a field V = volume of air drawn through the filter
The values of 95% UCL(O) are 5.5 for PCM (NIOSH 7400) and 3.0 for TEM (ISO 10312). Assuming that Af and Ag are fixed, there are then two variables which may be controlled to achieve a required LOD:
V (Air volume) N (Number of grids or fields counted)
Air volume is in turn a function of two independent variables: flow rate and sampling
G-3
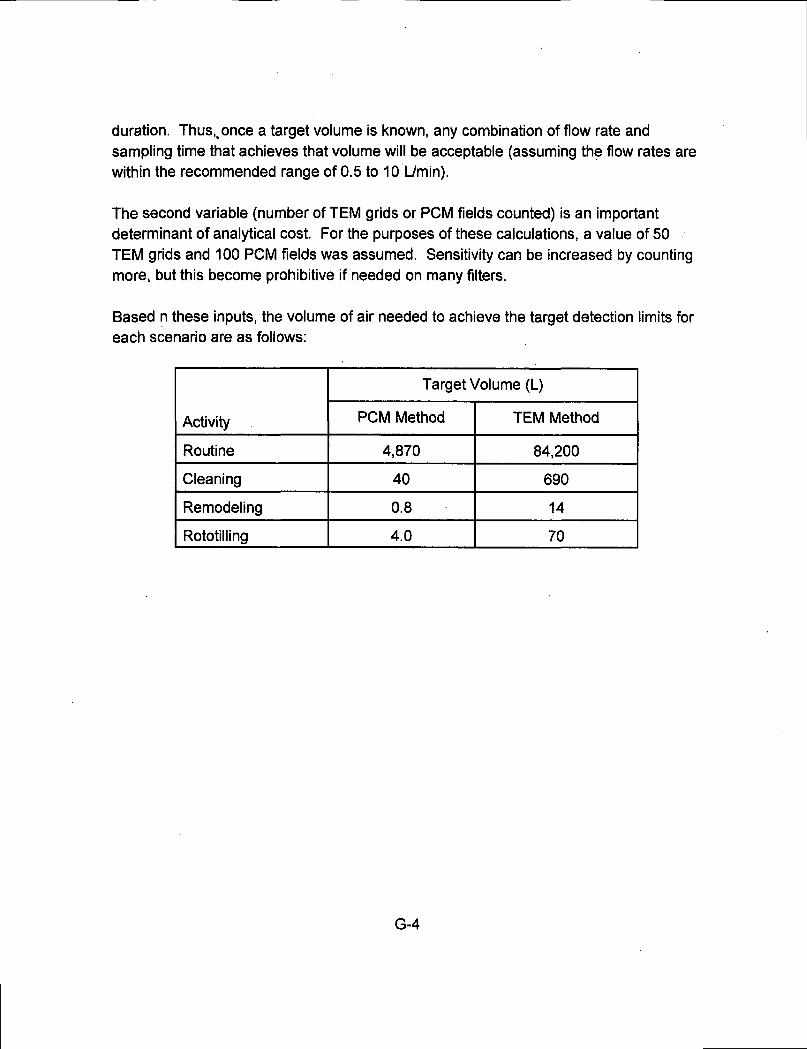
duration. Thus,.once a target volume is known, any combination of flow rate and sampling time that achieves that volume will be acceptable (assuming the flow rates are within the recommended range of 0.5 to 10 L/min),
The second variable (number of TEM grids or PCM fields counted) is an important determinant of analytical cost. For the purposes of these calculations, a value of 50 TEM grids and 100 PCM fields was assumed. Sensitivity can be increased by counting more, but this become prohibitive if needed on many filters.
Based n these inputs, the volume of air needed to achieve the target detection limits for each scenario are as follows:
Activity
Target Volume (L)
Activity PCM Method TEM Method
Routine 4,870 84,200
Cleaning 40 690
Remodeling 0.8 14
Rototilling 4.0 70
G-4

INSERT ADDENDUM A DIVIDER PAGE

Phase 2 Sampling and Quality Assurance Project Revision 0
Addendum A
\ For Lib by, Montana
Environmental Monitoring for Asbestos
Evaluation of Exposure to Airborne Asbestos Fibers
At PRCJ^cP
On Scene Coordinator: !\ Paul Pel ¥nard, OSC 8EPR-PAER
Science Support Coordinator: fM/o/
Chris Weis, PhD, DABT 8EPR-PS
QAPP Addendum A.wpd

ADDENDUM A LIST OF MODIFICATIONS TO
PHASE 2 SAMPLING AND QUALITY ASSURANCE PROJECT PLAN (REV 0) FOR LIBBY, MONTANA
This document summarizes a number of clarifications and revisions to the Phase 2 Sampling and Quality Assurance Project Plan (Rev 0) for Libby, Montana, and its associated attachments. These changes and clarifications have been developed during the initial phases of implementing the Phase 2 Project Plan in Libby, and apply mainly to activities associated with Scenario 1 (routine household activities) and Scenario 2 (active cleaning). The changes listed in this addendum will be incorporated into Revision 1 of the Project Plan at an appropriate time in the future. In the interim, all acti vities performed under Revision 0 of the plan will conform to the changes described herein.
Page Section Change/Clarification
6, 12, 18 Scenario 1 Delete the text which states that residents may engage in all normal activities EXCEPT CLEANING. If cleaning is a part of the normal daily activities, these activities may be performed.
12 Scenario 1 Delete text stating that when feasible, all pumps should be set up the night before. Rather, all pumps should be set up and calibrated immediately before use, as indicated in SOP EPA-LIBBY-01.
12 Scenario 2 Record info on make, model and general type (upright, canister, HEPA filter, etc) of vacuum cleaner used for Scenario 2 in field log book
12, 13, 15 Scenario 1 Scenario 2 Scenario 3
If the residence has multiple floors or levels that are used for regular living activities, one stationary air sample will be collected on each floor/ level. Levels/floors that are not used as a regular living space will not be sampled.
14 Scenario 2 Following completion of the active cleaning activities by EPA staff, the home will be prepared for re-occupancy by a thorough general cleaning (wet cloth wipe down, HEPA vacuuming as needed), prior to collection of the air clearance sample(s). The clearance sample(s) will be collected after allowing the house to "settle" overnight.
QAPP Addendum A.wpd Page 1 of 2

14 Scenario 2 All air samples from Scenario 2 will be sent to the on-site field laboratory for quick turn-around by AHERA and by ISO 10312 (10 grids). A property will be considered suitable for re-occupancy if the following are true: 1) the post-activity clearance sample is lower than the AHERA standard; 2) the post-activity clearance sample is not higher(a) than the pre-activity sample, both by AHERA and by ISO 10312. If one or more of these tests are not true, the home will undergo a second cleaning and the same tests will be performed. If one or more of the tests still fail, the matter will be referred to the EPA OSC for resolution. Note that all samples will also be sent off-site for more thorough quantification by TEM and PCM. (a) Statistical test for "not higher" is defined by the Poisson confidence intervals.
18 B i b For homes involved in Scenarios 1 and 2, data on the rate and direction of airflow (as indicated by use of a smoke generator) will be collected in the interval between Scenario 1 and Scenario 2.
19 SOP-EPA-Libby-01
B2 All cellulose acetate filters used during this project will have 0.8 um pores, both for personal air and stationary air samplers.
22 B3 Sample labels will be tracked in a logbook maintained by the field data manager.
26 B5 (Laboratory-based QC)
All samples collected in a week will be shipped at the end of the week, and each shipment will be considered an analytical batch. The laboratory must perform laboratory-based QC samples for each analytical batch at the required frequency indicated in the QAPP.
27 B5 (Field- . based QC)
A total of 2 field blanks for air will be collected at each residence per scenario (1, 2, 3, or 4). In addition, 2 field blanks for dust will be collected at each residence per scenario. For both air and dust, one of the two field blanks will be randomly selected for analysis along with the field sample. Mark "Archive" on the COC for the second field blank. While the second field blank will travel to the laboratory with the other samples, it will be archived and may be analyzed at a later date at the discretion of the SCC.
Appendix B SOP EPA-LIBBY-01
See Revision 1 (includes additional detail on calibration)
QAPP Addendum A.wpd Page 2 of 2


