Embed Size (px)
Citation preview

Department of Science and Technology Institutionen för teknik och naturvetenskap Linköping University Linköpings universitet
gnipökrroN 47 106 nedewS ,gnipökrroN 47 106-ES
LiU-ITN-TEK-A--11/064--SE
QoS-Aware LTE DownlinkScheduler for VoIP in Relation
With Power SavingMuhammad Sajid Mushtaq
Abdussalam Shahid
2011-09-30

LiU-ITN-TEK-A--11/064--SE
QoS-Aware LTE DownlinkScheduler for VoIP in Relation
With Power SavingExamensarbete utfört i elektroteknik
vid Tekniska högskolan vidLinköpings universitet
Muhammad Sajid MushtaqAbdussalam Shahid
Examinator Scott Fowler
Norrköping 2011-09-30

Upphovsrätt
Detta dokument hålls tillgängligt på Internet – eller dess framtida ersättare –under en längre tid från publiceringsdatum under förutsättning att inga extra-ordinära omständigheter uppstår.
Tillgång till dokumentet innebär tillstånd för var och en att läsa, ladda ner,skriva ut enstaka kopior för enskilt bruk och att använda det oförändrat förickekommersiell forskning och för undervisning. Överföring av upphovsrättenvid en senare tidpunkt kan inte upphäva detta tillstånd. All annan användning avdokumentet kräver upphovsmannens medgivande. För att garantera äktheten,säkerheten och tillgängligheten finns det lösningar av teknisk och administrativart.
Upphovsmannens ideella rätt innefattar rätt att bli nämnd som upphovsman iden omfattning som god sed kräver vid användning av dokumentet på ovanbeskrivna sätt samt skydd mot att dokumentet ändras eller presenteras i sådanform eller i sådant sammanhang som är kränkande för upphovsmannens litteräraeller konstnärliga anseende eller egenart.
För ytterligare information om Linköping University Electronic Press seförlagets hemsida http://www.ep.liu.se/
Copyright
The publishers will keep this document online on the Internet - or its possiblereplacement - for a considerable time from the date of publication barringexceptional circumstances.
The online availability of the document implies a permanent permission foranyone to read, to download, to print out single copies for your own use and touse it unchanged for any non-commercial research and educational purpose.Subsequent transfers of copyright cannot revoke this permission. All other usesof the document are conditional on the consent of the copyright owner. Thepublisher has taken technical and administrative measures to assure authenticity,security and accessibility.
According to intellectual property law the author has the right to bementioned when his/her work is accessed as described above and to be protectedagainst infringement.
For additional information about the Linköping University Electronic Pressand its procedures for publication and for assurance of document integrity,please refer to its WWW home page: http://www.ep.liu.se/
© Muhammad Sajid Mushtaq, Abdussalam Shahid

i

i
Abstract
The addition of multimedia services in cellular communication systems has created new challenges of resource allocation and power optimization. The requirement of efficient resource allocation is vital in downlink than uplink due to high traffic flows. These multimedia applications require more power therefore power optimization has gained a key role in future communication systems.
This study investigates the performance of the downlink scheduling of Long Term Evolution (LTE) cellular communication network along efficient power utilization of User Equipment (UE). The goal is to develop a downlink scheduling technique that improves the QoS for multimedia services in relation to the use of power saving scheme i.e. Discontinuous Reception (DRX). The DRX effectively improves power consumption at the cost of QoS degradation due to higher packet delays and packet losses. The traditional scheduling schemes were not designed to guarantee LTE QoS constraints in relation to energy. The proposed algorithm considers key QoS parameters during scheduling with fair resource allocation while minimizing packet delay and packet loss even in power saving environment.
The performance of proposed scheduler with power saving technique is analyzed and its impact on QoS is evaluated in term of throughput, packet loss rate, fairness and packet delay. The proposed scheduler is compared with traditional scheduling algorithms such as Round Robin, Proportional Fair and Best CQI. The simulation results show that the proposed algorithm’s performance is better as compared to traditional scheduling algorithms in power saving and non-power saving environments.

ii
Acknowledgement
This study research work is a result of Master Thesis which is carried out within the Department of Science and Technology (ITN) Linköping University.
It is a pleasure to thank all those people who made this study work possible. First of all, we would like to pay sincerest thanks to our supervisor, Professor Dr. Scott Fowler, whose continuous guidance, encouragement, and support from the start to the end of this study work, enabled us to develop a better understanding of this research subject and provides all necessary knowledge to complete this research work. We would like to say that it is excellent experienced to work with such a great researcher, who is constantly encouraging and willing to help us.
We would like to thank our family members and specially our parent for their continuous encouragement and support to complete this thesis work.
Finally, we would like to offer our kind regards and blessings to all those people who supported and helped us with their capabilities in completing this research work.
iii
Table of Contents
List of Figures ............................................................................................................................................ v
List of Tables ............................................................................................................................................ vi
List of Abbreviations ............................................................................................................................... vii
Chapter 1 – Introduction ......................................................................................................................... 1
1.1 Purpose .................................................................................................................................... 1
1.2 Objectives ................................................................................................................................ 2
1.3 Scope ....................................................................................................................................... 2
1.4 Outline ..................................................................................................................................... 2
Chapter 2 - Theory ................................................................................................................................... 3
2.1 LTE Overview ........................................................................................................................... 3
2.2 Scheduling in LTE ..................................................................................................................... 5
2.2.1 Quality of Service (QoS) parameters ............................................................................... 5
2.2.2 Channel Quality Indicator (CQI) ....................................................................................... 7
2.2.3 Buffer State ...................................................................................................................... 8
2.2.4 Resource Allocation History ............................................................................................ 8
2.3 User Equipment Power Saving in LTE ...................................................................................... 8
2.3.1 Light Sleep Discontinuous Reception (DRX) .................................................................... 9
Chapter 3 - Related Work ...................................................................................................................... 12
3.1 Scheduler Algorithms ............................................................................................................ 12
3.2 Power Saving ......................................................................................................................... 14
Chapter 4 - Methodology and Implementation .................................................................................... 16
4.1 Implementation ..................................................................................................................... 16
4.1.1 Simulator Overview ....................................................................................................... 16
4.2 Proposed Methodology ......................................................................................................... 19
4.2.1 Scheduling Dependencies .............................................................................................. 20
4.2.2 Scheduler Architecture .................................................................................................. 21
4.2.3 Scheduling Algorithm .................................................................................................... 22
Chapter 5 - Simulation Results and Discussion ..................................................................................... 24
5.1 Simulation Setup ................................................................................................................... 24
5.2 Simulation Results ................................................................................................................. 25
5.2.1 Normal operational mode ............................................................................................. 26
5.2.2 DRX Light Sleep/ Power Saving Mode ........................................................................... 29

iv
5.3 Power saving and QoS ........................................................................................................... 31
Chapter 6 - Conclusion and Future Work .............................................................................................. 35
References ......................................................................................................................................... 38
v
List of Figures
Figure 2-1: LTE Architecture .................................................................................................................................... 3Figure 2-2: Resource Block grid structure in frequency domain .............................................................................. 4Figure 2-3: Frame Structure in time domain ........................................................................................................... 5Figure 2-4: LTE DRX transition diagram .................................................................................................................. 9Figure 2-5: DRX cycle (No packet scheduled) ........................................................................................................ 10Figure 2-6: DRX cycle (Packet scheduled) .............................................................................................................. 10Figure 3-1: CABA packet scheduler in downlink LTE [10]. ..................................................................................... 14Figure 4-1: Schematic Block Diagram of LTE System Level Simulator ................................................................... 17Figure 4-2: BLER for CQIs 1 to 15 ........................................................................................................................... 19Figure 4-3: SNR to CQI mapping Model ................................................................................................................. 19Figure 4-4: Entities involved in downlink packet scheduler ................................................................................... 21Figure 5-1: Simulation network topology in relation from eNodeB and UE position ............................................ 24Figure 5-2: Downlink System Throughput with no DRX Light Sleep ...................................................................... 27Figure 5-3: Downlink Throughput Fairness Index with no DRX Light Sleep ........................................................... 28Figure 5-4: LTE Downlink System Throughput with DRX Light Sleep. .................................................................... 29Figure 5-5: Downlink Throughput Fairness Index with DRX Light Sleep ................................................................ 30Figure 5-6: System Throughput vs. Power Saving ................................................................................................. 31Figure 5-7: Throughput Fairness Index vs. Power Saving ...................................................................................... 32Figure 5-8: Average Packet Delay vs. Power Saving .............................................................................................. 33Figure 5-9: Packet Loss Rate vs. Power Saving ...................................................................................................... 34

vi
List of Tables
Table 2-1: QCI characteristics for the bearer QoS profile [4]. .................................................................................. 6Table 2-2: 4-bit CQI Table [9] .................................................................................................................................. 8Table 4-1: Simulator pseudo-code ......................................................................................................................... 17Table 5-1: Simulation Parameters ......................................................................................................................... 25Table 5-2: Performance Evaluation of Proposed scheduler and conventional schedulers in normal mode .......... 28Table 5-3: Performance Evaluation of Proposed scheduler and conventional schedulers with light sleep mode . 30

vii
List of Abbreviations
3GPP Third Generation Partnership Project ACK Acknowledgement AMBR Aggregate Maximum Bit Rate APN Access Point Name ARP Allocation and Retention Priority AWGN Additive White Gaussian Noise B-CQI Best Channel Quality Indicator BLER Block Error Ratio BSR Buffer Status Report CABA Channel-Adapted Buffer-Aware CDMA-HDR Code Division Multiple Access High Data Rate CQI Channel Quality Indicator DFT Discrete-Time Fourier Transform DRX Discontinuous Reception eNodeB Evolved Node Base-station FFT Fast Fourier Transform GBR Guarantee Bit Rate GSM Global System for Mobile Communication HSDPA High Speed Downlink Packet Access HSUPA High Speed Uplink Packet Access IMS IP Multimedia Subsystem IP Internet Protocol I-Timer In-active Timer LTE Long Term Evolution MCS Modulation and Coding Scheme MIMO Multiple Input and Multiple Output MME Mobility Managment Entity NACK Negative Acknowledgement NRT Non-Real Time OFDM Orthogonal Frequency Division Multiplexing OFDMA Orthogonal Frequency Division Multiple Access PDCCH Physical Downlink Control Channel PF Proportional Fair PLR Packet Loss Rate QCI Quality of Service Class Identifier QoS Quality of Service RB Resource Block ROI Region of Interest RR Round Robin RRM Radio Resource Management RT Real Time SC-FDMA Single Carrier Frequency Division Multiple Access SCS Scheduling Candidate Set S-GW Serving Gateway

viii
SINR Signal to Interference and Noise Ratio SISO Single Input Single Output SNR Signal to Noise Ratio TB Transport Block TTI Transmission Time Interval UE User Equipment UMTS Universal Mobile Telecommunication System VoIP Voice over Internet Protocol WiMAX Worldwide Interoperability for Microwave Access
1
Chapter 1 – Introduction
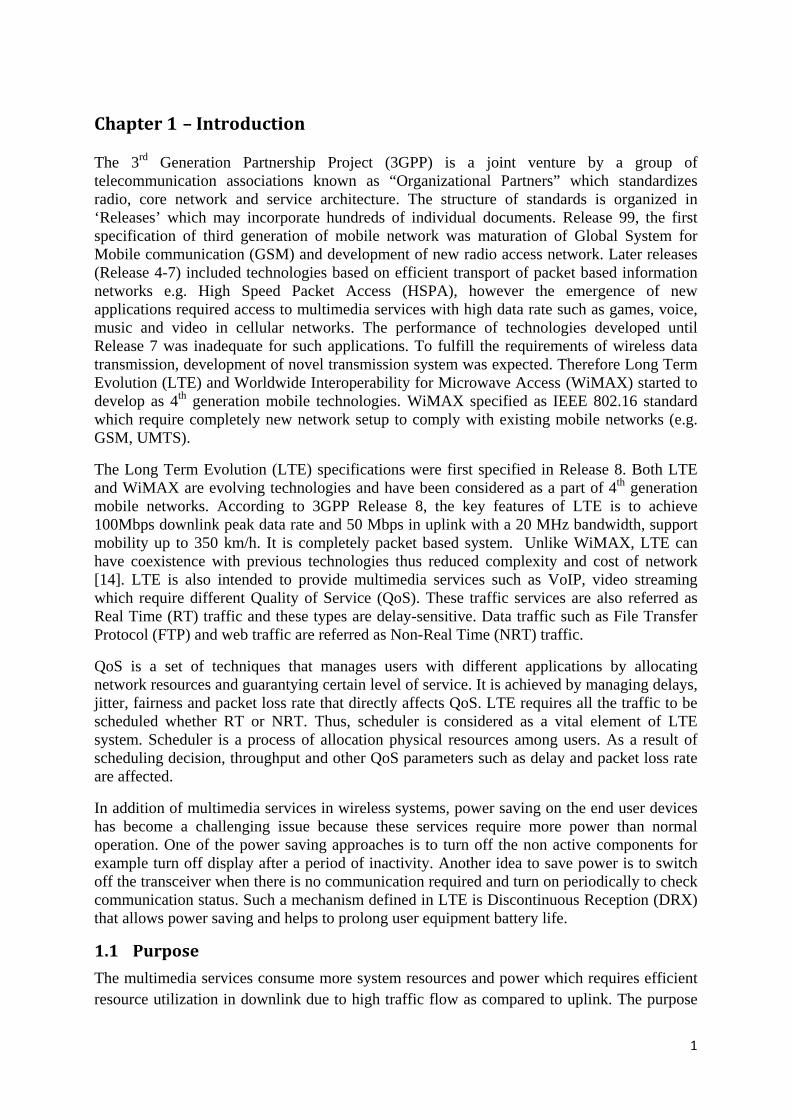
The 3rd Generation Partnership Project (3GPP) is a joint venture by a group of telecommunication associations known as “Organizational Partners” which standardizes radio, core network and service architecture. The structure of standards is organized in ‘Releases’ which may incorporate hundreds of individual documents. Release 99, the first specification of third generation of mobile network was maturation of Global System for Mobile communication (GSM) and development of new radio access network. Later releases (Release 4-7) included technologies based on efficient transport of packet based information networks e.g. High Speed Packet Access (HSPA), however the emergence of new applications required access to multimedia services with high data rate such as games, voice, music and video in cellular networks. The performance of technologies developed until Release 7 was inadequate for such applications. To fulfill the requirements of wireless data transmission, development of novel transmission system was expected. Therefore Long Term Evolution (LTE) and Worldwide Interoperability for Microwave Access (WiMAX) started to develop as 4th generation mobile technologies. WiMAX specified as IEEE 802.16 standard which require completely new network setup to comply with existing mobile networks (e.g. GSM, UMTS).
The Long Term Evolution (LTE) specifications were first specified in Release 8. Both LTE and WiMAX are evolving technologies and have been considered as a part of 4th generation mobile networks. According to 3GPP Release 8, the key features of LTE is to achieve 100Mbps downlink peak data rate and 50 Mbps in uplink with a 20 MHz bandwidth, support mobility up to 350 km/h. It is completely packet based system. Unlike WiMAX, LTE can have coexistence with previous technologies thus reduced complexity and cost of network [14]. LTE is also intended to provide multimedia services such as VoIP, video streaming which require different Quality of Service (QoS). These traffic services are also referred as Real Time (RT) traffic and these types are delay-sensitive. Data traffic such as File Transfer Protocol (FTP) and web traffic are referred as Non-Real Time (NRT) traffic.
QoS is a set of techniques that manages users with different applications by allocating network resources and guarantying certain level of service. It is achieved by managing delays, jitter, fairness and packet loss rate that directly affects QoS. LTE requires all the traffic to be scheduled whether RT or NRT. Thus, scheduler is considered as a vital element of LTE system. Scheduler is a process of allocation physical resources among users. As a result of scheduling decision, throughput and other QoS parameters such as delay and packet loss rate are affected.
In addition of multimedia services in wireless systems, power saving on the end user devices has become a challenging issue because these services require more power than normal operation. One of the power saving approaches is to turn off the non active components for example turn off display after a period of inactivity. Another idea to save power is to switch off the transceiver when there is no communication required and turn on periodically to check communication status. Such a mechanism defined in LTE is Discontinuous Reception (DRX) that allows power saving and helps to prolong user equipment battery life.
1.1 Purpose The multimedia services consume more system resources and power which requires efficient resource utilization in downlink due to high traffic flow as compared to uplink. The purpose
2
of this study work is to improve QoS in relation with power saving techniques in LTE network. The focus will be on downlink scheduling and power saving at the user equipment.
1.2 Objectives The thesis entailed development of scheduling and power saving technique in LTE networks and investigate its impact on QoS parameters. The analysis of this study includes following objectives;
• Implementation of a downlink scheduling technique. • Implementation of a power saving mechanism at the user equipment. • Investigate impact of scheduler and power saving technique on QoS. • Comparison with traditional scheduling schemes.
1.3 Scope This thesis requires in-depth study of LTE network architecture. The focus of this study is to develop a scheduling algorithm that manages RT and NRT users in order to fulfill QoS requirement for different traffic conditions while making a balance between QoS and power consumption at the user equipment. The algorithm is evaluated only for VoIP traffic. The underlying QoS parameters are throughput, fairness, final-hop packet delay and packet loss rate.
1.4 Outline
This thesis is divided into six major chapters. The short introduction of chapter work is presented as;
Chapter 2 - Theory: Overview of LTE networks, QoS parameters and DRX power saving mechanism.
Chapter 3 - Related Work: Discussion about the work done in relation to this thesis and problem identification.
Chapter 4 - Methodology and Implementation: Implementation of system modeling and solution for identified problems are presented.
Chapter 5 - Simulation Results and Discussion: Discussion of the results gathered through implementation and its comparison to traditional approaches.
Chapter 6 - Conclusion and Future Work: This chapter concludes the thesis work and future recommendations are included.

3
Chapter 2 - Theory
2.1 LTE Overview The increasing demand of high speed data services such as conversional voice, video and online gaming; the 3GPP introduced the new radio access technology LTE which has capability to move towards fourth generation wireless systems. The radio network architecture proposed by the 3GPP LTE consists of evolved NodeB (eNodeB) which provides a link between UE and core network. The eNodeB is responsible for major radio resource management (RRM) functions such as packet scheduling. The UE is connected with eNodeB via Uu interface. The eNodeB is connected to core network (MME/S-GW) via S1 interface and each eNodeB is interconnected via X2 interface as shown in Figure 2-1. The Mobility Management Entity (MME) is an important part of LTE architecture which is responsible for paging and UE mobility in idle mode within the network. The Serving Gateway (S-GW) node is responsible to route user data packets and handle other user requests e.g. handover. The MME and S-GW are part of core networks.
Figure 2-1: LTE Architecture
LTE uses Orthogonal Frequency Division Multiple Access (OFDMA) as radio interface which divides the bandwidth into subcarrier and assign to the users depending on their current demand of service. Each subcarrier carry data at low rate but at the same time uses multiple subcarriers to provide high data rates [3].
There are some advantages of OFDM as compared to other techniques. Firstly, OFDM uses the multiple carrier transmission technique which makes the symbol time substantially larger than channel delay spread. Consequently, the effect of inter-symbol interference (ISI) reduces significantly. In other words, against the multi-path interference (frequency selective fading) the OFDM provides high robustness with less complexity. Secondly, the use of Fast Fourier Transform (FFT) processing, the OFDM allows low-complexity implementation. Thirdly, OFDM offers the complete freedom to the scheduler by using the frequency access technique

4
180 kHz
Resource Block: 12 subcarriers, 0.5 ms
Total bandwidth
Sub-frame length (1 ms)
0.5 ms
(OFDMA). Lastly, it provides the spectrum flexibility which helps for smooth evolution from all the existing radio access technologies toward LTE.
The instantaneous transmit Radio Frequency (RF) power can change drastically within a single OFDM symbol which leads to Peak to Average Power Ratio (PAPR). This requires costly transmission equipment which consumes high power due to which these equipments can be used at eNodeBs but not at user equipment (UE). To cope with high PARP problem Single Carrie- Frequency Division Multiple Access (SC-FDMA) is used at uplink rather than OFDMA. SC-FDMA is also called as DFT-spread OFDM modulation. Fundamentally, before the OFDM modulation, if initial FFT is not applied then OFDM is similar to SC-FDMA. The main purpose of this modification is to decrease the power consumption at the user terminal by reducing the peak to average power ratio [5].
Each downlink frame in LTE consists of 10 ms duration and contains 10 sub-frames. Each sub-frame has duration of 1 ms, which is known as Transmission Time Interval (TTI), consists of two time slots and each time slot has duration of 0.5 ms [8].
The radio resources available for users are called Resource Blocks (RBs) which are defined in frequency as well as time domain. In frequency domain, one RB is a collection of 12 contiguous subcarriers and each RB consisting of 180 kHz bandwidth (12 subcarriers, each subcarrier is 15 kHz) as shown in Figure 2-2 while in time domain each RB is defined as 0.5 ms time slot and each time slot carries 7 OFDM symbols [6] as shown in Figure 2-3. Two consecutive time domain RBs make a TTI which is equal to one sub-frame of 1 ms duration. Each UE reports its channel condition to its corresponding eNodeB on every TTI which includes received Signal to Noise Ratio (SNR) of each subcarrier at user side. These feedback reports also consist of other radio parameter status perceived by the UE such as CQI, Rank Indicator, and user buffer status.
Figure 2-2: Resource Block grid structure in frequency domain

5
2.2 Scheduling in LTE Scheduling is a process of allocating the physical resources among users. Wireless channel has time-varying behavior in comparison to wired network so both networks have different schemes for resource allocation. The aim of scheduling algorithm is to maximize the overall system throughout while keeping fairness, delay and packet loss rate within QoS requirements.
Generally, users are classified on their traffic characteristic, such as real time and non-real time traffic. For real time traffic (e.g. video, VoIP and gaming), scheduling must guarantee that QoS requirements are satisfied. The packet lost rate and delay play vital role in user experience. The real time traffic packet must arrive to user within the certain delay threshold otherwise packet is be considered lost or discarded.
The scheduling decisions can be made on the basis of following parameters.
2.2.1 Quality of Service (QoS) parameters Based on type of service, bearers1
• Guaranteed Bit Rate (GBR) bearer that guaranteed minimum bit rate for particular service such as multimedia services (e.g. VoIP, video)
can be classified into two categories:
• Non Guaranteed Bit Rate bearer that does not require to guarantee bit rate for particular service such as best effort services (e.g. FTP, HTTP)
The main QoS parameters at bearer level (i.e. per bearer or per bearer aggregate) are QCI, ARP, GBR, and AMBR which are defined as
1 Data flow between radio access network and user equipment in 3GPP terminology.
0 1 2 3 …………………… 10 11 ………………
19
One frame (10 ms)
One sub-frame (1 ms) RB: One slot( 0.5 ms)
0 1 2 3 4 5 6
7 OFDM symbols
Figure 2-3: Frame Structure in time domain

6
• QoS Class Identifier (QCI): It is used to provide the information how to perform packet forwarding treatment (e.g. scheduling weights, admission thresholds, queue management thresholds, link layer protocol configuration, etc.) by using the specific node parameters. These parameters are pre-configured by network operator at the eNodeB. It has number range from 1 to 9 which depends on priority of different traffic service. The mapping of QCI weights to QCI standardized characteristics is given in Table 2-1.
• Allocation and Retention Priority (ARP): Its aim is to make decision of call admission acceptance or rejection on the basis of available resources at the servicing eNodeB and dropped if the network gets congested. ARP also plays an important role by considering the requested service to drop in case of exceptional resource limitations (e.g. at handover).
• Guaranteed Bit Rate (GBR): It is expected bit rate which is provided by a GBR bearer.
• Aggregate Maximum Bit Rate (AMBR): It is the maximum instantaneous bit rate of non-GBR bearer for specific user.
Per Access Point Name Aggregate Maximum Bit Rate (APN-AMBR): The total bit rate of the non-GBR bearers achieved by UE through a particular access point name.
Per UE Aggregate Maximum Bit Rate (UE-AMBR): The total bit rate of all of the non-GBR bearers achieved by a particular UE [7].
QCI Resource Type Priority Packet Delay
Budget Packet Error
Loss rate Example Service
1 GBR 2 100 ms 10-2 Conversational Voice 2 GBR 4 150 ms 10-3 Conversational Video 3 GBR 5 300 ms 10-6 Buffer streaming 4 GBR 3 50 ms 10-3 Real-time gaming 5 Non-GBR 1 100 ms 10-4 IMS signaling 6 Non-GBR 7 100 ms 10-3 Live streaming 7 Non-GBR 6 300 ms 10-6 Buffered streaming, TCP,
Email, Web, P2P file sharing, etc.
8 Non-GBR 8 300 ms 10-6 9 Non-GBR 9 300 ms 10-6
Table 2-1: QCI characteristics for the bearer QoS profile [4].
The description of QCI characteristics presented in Table 2-1 are defined below
QCI: It is the QCI index which identifies set of QoS attributes (priority, packet delay and packet error loss rate).
Resource Type: The type of bearer either Guaranteed Bit Rate bearer or non-Guaranteed Bit Rate bearer.

7
Priority: Smaller number means higher priority at scheduler.
Packet Delay Budget: The maximum allowable packet delay for each bearer service.
Packet Error Loss Rate: Acceptable packet loss rate.
2.2.2 Channel Quality Indicator (CQI) The 4-bit value of CQI report is generated by the user on the basis of received SINR on the downlink and feedback to corresponding eNodeB. There are several CQI reporting schemes have been suggested such as wideband reporting, in which user reports one wideband CQI report for the whole system bandwidth and in sub-band reporting a user sends report for each sub-band. Wideband scheme does not allow frequency selective scheduling as feedback report considers whole bandwidth while sub-band scheme makes use of frequency selective nature of OFDM [8].
A suitable Modulation and Coding Scheme (MCS) is chosen on the basis of channel condition reported by the user to meet the QoS requirement. In case of sub-band CQI reporting scheme, if CQI value of a specific sub-band becomes lower as compared to previous value then the eNodeB will choose a lower order modulation and coding scheme for that sub-band. On the other hand if CQI value of a specific sub-band becomes higher as compared to previous value then the eNodeB will choose a higher order modulation and coding scheme for that sub-band [8].
There are two methods of CQI feedback report which are periodic feedback and aperiodic feedback. In periodic feedback method, a user sends CQI report periodically to the eNodeB on every TTI and this method only allows wideband and user selective feedbacks. In case of aperiodic feedback method, eNodeB first asks for CQI report for a specific user and in response the user sends the feedback to the eNodeB [8]. The list of different modulation and coding schemes on the basis of CQI index is presented in the Table 2-2.

8
CQI index Modulation Effective Coding rate= 𝒄𝒓𝒆𝒓
x 1024 Spectral Efficiency= 𝑹𝒃𝑩
0 out of range 1 QPSK 78 0.1523 2 QPSK 120 0.2344 3 QPSK 193 0.3770 4 QPSK 308 0.6016 5 QPSK 449 0.8770 6 QPSK 602 1.1758 7 16QAM 378 1.4766 8 16QAM 490 1.9141 9 16QAM 616 2.4063
10 64QAM 466 2.7305 11 64QAM 567 3.3223 12 64QAM 666 3.9023 13 64QAM 772 4.5234 14 64QAM 873 5.1152 15 64QAM 948 5.5547
Table 2-2: 4-bit CQI Table [9]
The parameters of CQI Table 2-2 are defined below;
CQI index: It identifies set of CQI attributes (modulation, effective coding rate and spectral efficiency).
Modulation: It defines the type of modulation scheme being used with corresponding CQI index.
Effective Coding Rate: It is the ratio of code block bits (𝑐𝑟) to rate matching bits (𝑒𝑟) by multiplication of 1024.
Spectral Efficiency: It is the ratio of bit rate (𝑅𝑏) to the bandwidth of the channel (𝐵).
2.2.3 Buffer State Buffer State refers to how much data is available for the user to be scheduled by eNodeB. The scheduler must take into account the data queued in the buffer at eNodeB. Packet delay and dropping rate can be minimized by giving higher priority to the users that have data in queues for longer period. The priority also depends on the basis of other QoS parameter [3].
2.2.4 Resource Allocation History Scheduling also depends on the resource allocation history of users. For example if a user has higher priority in the previous sub-frame but its priority may be lower in the current sub-frame. The more general approach is to update the average data rate of user on every TTI and try to maintain average data rate of user which is currently served [1].
2.3 User Equipment Power Saving in LTE Optimization of power consumption in user equipment (UE) is one of the main concerns in wireless networks. The idea is to improve UE’s battery life so that UE does not run out of power too quickly. To save power at UE, LTE specification includes concept of

9
Discontinuous Reception (DRX) with Light Sleep and Deep Sleep modes. Light Sleep DRX mechanism puts UE’s receiver into sleep mode for shorter durations. Light Sleep does not shut down the UE’s receiver completely; rather it consumes power less than active mode of operation. The receiver switches between active and sleep mode periodically to receive scheduled packets. If UE does not receive packets for a long period of time then the receiver is turned off completely and UE goes into Deep Sleep mode. In Deep Sleep mode receiver does not require any power and sleep durations become longer than Light Sleep.
Figure 2-4 shows DRX power transition diagram for LTE. LTE allows a UE to stay in either of three states Inactive (S1), Light Sleep (S2) and Deep Sleep (S3). In state S1, UE receives its scheduled packets and remains in S1 as long as packets are being scheduled. If packets are not being scheduled, then UE transits to Light Sleep mode S2. During S2 state, UE checks for packets through Physical Downlink Control Channel (PDCCH)2
periodically if it senses a packet scheduled then it moves back to S1 to receive packet. While in S2, if UE does not sense packets scheduled for a longer period then it moves to Deep Sleep mode S3. In Deep Sleep, the UE checks for packets periodically but with longer sleep durations. When it senses a packet scheduled for UE it transits to S1.
For VoIP traffic, packets are generated continuously every 20 ms during call activity and silence descriptor packets generated after 160 ms during silence period [19]. During call activity a UE receiver can be turned off for shorter periods (Light Sleep). If a silence period arrives during the call then the receiver can be turned off for longer period (Deep Sleep). Because simulations done in this study are assumed to have continuous VoIP calls for all UE therefore simulation setup does not allow UEs to use Deep Sleep mode of operation. If Deep Sleep is used for this simulations scenario then there are chances of buffer overflow at eNodeB because the number of packets being created would be much higher than packets being scheduled.
2.3.1 Light Sleep Discontinuous Reception (DRX) Discontinuous Reception (DRX) is a power saving technique in UE which switches off the receiver and turns the device into low power mode. With the development of new multimedia services, power consumption has become a major concern in wireless communication. Turning off the receiver and switching between active and sleep mode is not a new idea in telecommunication systems. The concept of DRX has already been applied to 2nd generation systems e.g. Global System for Mobile communications (GSM). LTE and LTE-Advanced specification has adopted DRX at link level to save power and extend battery life at UE [13].
2 PDCCH contains all scheduling control information
Figure 2-4: LTE DRX transition diagram
No packet scheduled No packet scheduled for a longer period
Packet Sensed
Received packet
Packet sensed
S1 S2 S3

10
Sleep Interval (Light/ Deep)
O-Timer
PDCCH (Packets Scheduled)
O-Timer
I-Timer
O-Timer
Figure 2-6: DRX cycle (Packet scheduled)
Sleep Interval (Light)
DRX Cycle
O-Timer
O-Timer
Sleep Interval (Deep)
DRX Cycle
Figure 2-5: DRX cycle (No packet scheduled)
O-Timer
O-Timer
The DRX framework in LTE allows UE’s receiver to be turned off. UE periodically turns on its receiver for short interval to sense packets through PDCCH. This improves power consumption significantly as RF components are turned off in case of no transmission. The DRX framework in LTE network is shown in Figure 2-5 and Figure 2-6 consisting of four main DRX parameters configured by network.
Figure 2-5 shows the behavior of DRX cycle when no packet is scheduled for the UE. During On-Duration Timer (O-Timer) of DRX cycle, the UE listens to PDCCH and if there is no packet is scheduled then UE moves into sleep interval and this process is continued until scheduled packet is listened.
Figure 2-6 shows the behavior of DRX cycle in case of packet is scheduled for UE. In this case UE checks the PDCCH during O-Timer and if it finds that packet is scheduled then it moves into In-active Timer (I-Timer) and UE remain in I-Timer until it continuously receives packet. When I-Timer is expired then UE moves into sleep interval.
The description of DRX framework parameters are given below;
1. DRX cycle: It is a time difference between start of two consecutive On-duration intervals in which UE remains active. One cycle consists of an On-Duration followed by a Sleep interval. Duration length of DRX cycle affects major QoS parameters e.g. delays. QoS requirement of traffic flow is mainly affected by DRX cycle periodicity. If DRX cycle is long then delay will increase and vice versa.
2. On-Duration (O-Timer): It is the time at which the user remains in active state and listens to PDCCH. If any data packet is scheduled for this user then it starts its Inactivity Timer otherwise it continues its DRX cycle by switching back to sleep interval either to Light Sleep or Deep Sleep.

11
3. Inactivity Timer (I-Timer): This timer prolongs UE’s active mode even after O-Timer has been expired. During O-Timer if a packet is listened through PDCCH, UE starts its I-Timer and receives data packets. During I-Timer, if another PDCCH packet arrives, the Inactivity time restarts itself to receive more incoming data packets. When I-timer expires, DRX cycle starts with a sleep interval.
4. Sleep Interval: It is duration during which UE uses low power in case of Light Sleep mode or no power in case of Deep Sleep mode. In case of Deep Sleep mode, the duration of sleep interval is longer than Light Sleep mode.

12
Chapter 3 - Related Work
The focus of this research study is to develop and implement scheduler and power saving mechanisms in relation how they can affect QoS in LTE. The work related is divided into two sections. First section focuses on scheduling algorithms and second focuses on power saving mechanisms.
3.1 Scheduler Algorithms In LTE networks, the uplink and downlink channels behave differently, so scheduling techniques adopted for uplink and downlink are different. The method of controlling the radio resources assign to each user is very important because it directly affects the performance of the network. The QoS attributes have made the scheduling of these radio resources very complex and scheduling decision are dependent on many other QoS parameters as discussed in the previous section. In addition of multiclass services, scheduling has become even complex as different users have different requirements e.g. delay tolerance, packet lost rate and available bandwidth [2].
Most of packet scheduling algorithms in wireless system are aimed to maximize the throughput and fairness amongst the users. Some of the common single carrier packet scheduling algorithms are discussed here which can be used in LTE.
The Best CQI (B-CQI) algorithm chooses the users that report highest downlink SNR values to corresponding eNodeB thus utilizes the radio resources efficiently among the users with good channel condition. On the other hand, the users experiencing bad channel conditions would never get resources. As a result, overall system throughput increases but it outcomes in starvation of resources for some users specially the user far away from eNodeB. Thus B-CQI algorithm performs good in terms of throughput but poor in terms of fairness among the users [3].
In order to cope with fairness problem in B-CQI algorithm, Round Robin (RR) algorithm was designed based on queues. It allocates the equal packet transmission time to each user to meet the fairness. As a consequence, the whole system throughput degrades because this algorithm does not consider channel conditions. Therefore, B-CQI algorithm is good choice to achieve the higher throughput but low fairness and RR is good to provide good fairness but lower throughput [3].
To balance out the constraints stated above, Proportional Fair (PF) algorithm was proposed. It was originally developed to support non-real time traffic in Code Division Multiple Access High Data Rate (CDMA-HDR) systems. Assuming 𝑟𝑖(𝑡) as achievable throughput for user 𝑖, the PF algorithm chooses a user with highest priority metric 𝑘 which is defined in Equation (3-1).
𝑘𝑖 = arg𝑚𝑎𝑥
𝑟𝑖(𝑡)𝑅𝑖(𝑡)
𝑎𝑡 𝑎𝑛𝑦 𝑡𝑖𝑚𝑒 𝑠𝑙𝑜𝑡 𝑡 Equation (3-1)
where
𝑅𝑖(𝑡) = �1 −1𝑡c� ∗ 𝑅𝑖(t − 1) +
1𝑡c∗ 𝑟𝑖(𝑡 − 1) Equation (3-2)

13
𝑅𝑖(𝑡) is average throughput of user 𝑖 over a time window 𝑡c . The 𝑡c is the time average window used to determine average throughputs within a certain duration of time.
The scheduling strategies which are based on PF algorithm focus on tradeoff between maximum average throughput and fairness. All of the above stated algorithms (B-CQI, RR and PF) were developed for non-real time traffic but they do not consider delay and packet loss requirements of real time services.
In [3], the Maximum-Largest Weighted Delay First (M-LWDF) algorithm is discussed which is designed to support real time traffic in CDMA-HDR. In this algorithm, the user is selected by considering PF property along with head of line (HOL) packet delay3
In [11], the time and frequency domain scheduling is proposed which is implemented in two layers. In first layer, the scheduling is implemented in time domain to keep the fairness of radio resources among the users while another opportunistic scheduling algorithm is implemented in frequency domain to improve the throughput. The Proportional Fair algorithm is implemented in time domain which keeps the fairness among users and improves throughput while multi-user frequency diversity gain is optimized with scheduling in frequency domain by considering the limitation of time domain scheduling of selected users. This algorithm mainly focuses to gain maximum throughput while keeping the same fairness among the users but it does not consider the delay constraints of multimedia traffic. In LTE, GBR is one of the key attributes that determines QoS but this scheme does not consider GBR requirements of users.
. This algorithm considers the packet delays in scheduling decision which achieves good throughput and fairness performance along with low packet loss rate. This algorithm is designed to handle the real time traffic but it does not have the capability to implement with power saving mechanism.
In [12], admission control and resource allocation packet scheduling scheme is presented. It combines the time domain scheduling and frequency domain scheduling which maximizes the throughput while making sure a user delay never crosses the threshold value and a user gets at least minimum throughput to fulfill the QoS requirement. The QoS requirements are fulfilled by assigning more resources to those users which have critical delay and throughput (means larger delay or minimum throughput). This proposed algorithm fulfills the QoS requirements of real time and non-real time traffic by considering the throughput and delay of each user but it does not consider the channel condition when assigning the resources to users.
Most of scheduling algorithms guarantying QoS, focus on queues and traffic at Medium Access Control (MAC) layer. In fast fading environment, when adequate bandwidth is allocated to one user on the basis of its MAC layer status then its lower SNR of channel resulted as a weak signal and wastes the system bandwidth. For efficient utilization of bandwidth the channel condition at physical layer should be considered. There are also some packet scheduling algorithms which consider the infinite buffer size at the UE and they consider that no packet dropping will happen due to the buffer overflow which is non-realistic in communication system. In [10], proposed channel-adapted and buffer-aware (CABA) packet scheduling algorithm, makes decision on following features 1) CQI feedback on uplink, 2) it assumes that every user equipment has limited buffer length and buffer status is also sent on the uplink that contributes in making the scheduling decisions, 3) treats real time and non-real time users traffic separately. This algorithm exploits very important factor for guarantying QoS while it does not take in to account packet delay as a result packet loss ratio 3 Time difference between the arrival time and current time of a packet.

14
may increase. It also does not take into account power saving mechanism which is an important entity of LTE networks.
The Figure 3-1 shows that eNodeB has queues for each user depicted as Queue1, Queue2…QueueM. Each user stores received data in its buffer of varied lengths. User sends reports in uplink which includes CQI and User Buffer Status (BSR) to its serving eNodeB. Scheduler at eNodeB chooses users and adapts modulation scheme (AMC) by considering CQI and BSR.
Figure 3-1: CABA packet scheduler in downlink LTE [10].
In [14], a scheduling scheme is proposed for channel-adaptive wireless networks which offer the absolute delay guarantees for real-time traffic flows. This scheduling scheme is very difficult to adapt for LTE radio interface due to its high computational complexity.
A cross-layer resource allocation scheduling technique for cellular networks is presented in [15]. The proposed scheme consists of two parts: the scheduler and resource allocator. The first part “scheduler” chooses the traffic flows and identifies how much bandwidth to allocate for each traffic flow. The second part “resource allocator” decides which sub-channel can be assigned to each traffic flow. In spite of designing the resource allocation entity in the proposed algorithm but still there is no refined scheduling algorithm presented to efficiently handle the real-time traffic flows.
3.2 Power Saving The DRX is an important mechanism that increases UE battery life by observing UE activity. When there is no data transmission, the DRX saves UE’s power by turning off the wireless transceiver. The DRX technique in LTE is different as compared to 2nd and 3rd generation mobile communication systems because LTE allows the UE to enter into sleep mode even when there is data available in eNodeB buffer. In DRX mechanism, packet delays increase significantly as a user switches to sleep mode for a period. In [13], the DRX-aware scheduling is proposed which includes DRX status as scheduling decision parameter to reduce packet delay caused by packet DRX sleep duration. The scheduling priority 𝑘𝑖 for each user 𝑖 is calculated by Equation (3-3).
𝑘𝑖 = arg𝑚𝑎𝑥𝑊𝑖(𝑡)
𝑟𝑖(𝑡)𝑅𝑖(𝑡)
∗ 𝑓(𝑡𝑖) 𝑎𝑡 𝑎𝑛𝑦 𝑡𝑖𝑚𝑒 𝑠𝑙𝑜𝑡 𝑡 Equation (3-3)

15
where 𝑟𝑖(𝑡) and 𝑅𝑖(𝑡) are accordant to Equation (3-1), 𝑊𝑖(𝑡) is weight which is directly proportional to delay of a head of line packet, 𝑡𝑖 is the remaining active time before a UE enters into sleep mode. The 𝑓(𝑡𝑖) is a decreasing function to give higher priority to user which has shorter remaining active time.
In LTE, change of DRX state is dependent on scheduler because scheduler prolongs the active state of user equipment by restarting the In-active timer (I-Timer). When DRX mechanism used with traditional schedulers, performance degrades as these schedulers do not consider whether a UE is in sleep or active mode. As comparison to traditional techniques, the method proposed in [13] improves power consumption by achieving the higher energy-utilization with same packet loss rate (PLR) or conversely, it uses same power consumption with lower PLR.
In [16] semi-persistent 4
scheduling scheme for VoIP is developed using DRX. First it organizes the users into scheduling candidate set (SCS) based on user buffer information at eNodeB, DRX status and persistent resource allocation pattern. It calculate the priority metric for the users in SCS by favoring the users who require retransmissions then the users whose packet delay of unsent packet at eNodeB buffer is close to delay threshold. Both schemes presented in [13] and [16] use DRX mechanism to optimize power usage. They also offer solutions to the problems caused by sleep interval of increased packet delay and packet loss. In [13] active remaining timer is used to prioritize users while [16] considers delay bounds as primary consideration to schedule users and improve QoS, but both scheduler do not GBR requirement of users.
4 Semi-persistent scheduling reduces the control channel overheads by persisting the control channel signaling until it is changed.

16
Chapter 4 - Methodology and Implementation
4.1 Implementation The simulation plays a vital role to implement and test algorithms and procedures, which are specified when LTE technology is developed and standardized. Generally, the performance of procedures and algorithms are evaluated at the link level and system level. The link level simulations focus on link related problems such as MIMO gain, AMC feedback, channel coding and decoding modeling and physical layer modeling required for system level. On the other hand, the system-level simulations investigate issues such as mobility handling, interference management and scheduling. The work is implemented and tested in LTE System level simulator which is developed in MATLAB and its source code is available publicly [17]. This simulator investigates the network performance by considering the physical layer results obtained from the link level. The simulator is implemented with object-oriented programming which provides greater flexibility to modify, test and implement new functionalities in the current simulator.
4.1.1 Simulator Overview Link-level simulation is considered good for developing the structure of receiver scenarios, feedback techniques and coding methods but it is not possible for simulations to consider the problems related to cell planning, scheduling and interference. Also it is impractical to perform a system level simulation that completely take care the radio links between eNodeB and UEs because these simulations require a large amount of computational power. In system-level simulator, the physical layer is implemented as simple models which inherits its important properties with high level of accuracy but with low complexity.
Figure 4-1 shows the block diagram of LTE system level simulator. Like other system level simulators, this simulator consists of two important models i.e. link measurement model and link performance model. The link measurement model measures information for link quality and these measurements are used for link adaptation and resource allocation strategy while on the other hand the link performance model uses the link adaptation strategy to find out the Block Error Ratio (BLER) with reduced complexity. The results of link performance model are stored in trace files. These trace files contain throughput and error rates which are easily used to calculate their distributions.

17
Link-performance Model
Interference structure
Traffic model
Link-measurement Model Micro-scale fading
Precoding
Resource scheduling strategy
Power allocation strategy
Network layout
Mobility management
Macro-scale fading Antenna Gain Shadow fading
Throughput Error rates Error Distribution
Link adaptation strategy
Figure 4-1: Schematic Block Diagram of LTE System Level Simulator
The simulator flow can be represented as pseudo-code which is given in Table 4-1. A Region Of Interest (ROI) is defined as an area in the simulation where eNodeBs and UEs are located and length of simulation is defined in term of number of TTI. In ROI the transmission of the Downlink Shared Channel (DLSCH) and UE movement are simulated.
1 : for each simulated TTI do 2 : move UEs 3 : if UE outisde ROI then 4 : reallocate UE randomly in ROI 5 : end if 6 : for each eNodeB do 7 : receive UE feedback after a given feedback delay 8 : schedule users 9 : store eNodeB traces
10 : end for 11 : for each UE do 12 : 1- channel state → link quality model → SINR 13 : 2- SINR, MCS → link performance model → BLER 14 : 3- send UE feedback 15 : 4- store UE traces 16 : end for 17 : end for
Table 4-1: Simulator pseudo-code

18
In Table 4-1 the data flow in and out of the simulator is represented with arrow symbol,”→”. The pseudo-code is implemented in MATLAB and its separated structure are maintained in simulator that providing the flexibility of adding new functionalities and algorithms. The important entities of system level simulator are described below;
4.1.1.1 Link Measurement Model
The Signal to Interference and Noise Ratio (SINR) is key parameter of any wireless communication system to measure its link quality. The link measurement model measures the link quality for link adaptation and resource allocation which are stored in traces. These measurements are used to reduce the simulator run-time computational complexity by using the pre-generated parameters based on results stored in trace files and these trace files can be reused in simulations. In wireless cellular system, the channel has time varying characteristic and to handle these effects the link quality model is split into three important parts which are used to calculate the SINR. These three main parts are discussed below; Macroscopic Pathloss: To model the propagation pathloss between an eNodeB sector and UE, the macroscopic pathloss is used by taking into account the distance and antenna gain. The macroscopic pathloss is considered as a pathloss map which is calculated at one time and can be reused as long as the network layout is same. Shadow Fading: Shadow fading occurs due to the obstacles in the propagation path between UE and eNodeB. These obstacles can be result of the irregularities of the terrain geographical properties. Shadow fading considers these obstacles with respect to average pathloss which is obtained from the macroscopic pathloss model. Small Scale Fading: The macroscopic pathloss and shadow fading cause some losses but these losses are time-invariant and position dependent while small scale fading model are time-dependent process.
4.1.1.2 Link Performance Model
In link performance model the BLER is computed at the UE on basis of resource allocation and Modulation and Coding Scheme (MCS). There are 15 different MCSs defined for LTE which provide 15 CQI values. These CQI values use different coding rates between 1/13 and 1 according to different modulation schemes. The link level performance curves are employed for a set of Additive White Gaussian Noise (AWGN) to evaluate the BLER of the received Transport Blocks (TBs). The SINR to BLER mapping is performed by using SINR of sub-carriers assigned to the UE’s TB to equivalent AWGN SINR as shown in Figure 4-2.

19
Figure 4-2: BLER for CQIs 1 to 15
In the link performance model, UE sends the CQI feedback report to eNodeB which contains information about channel condition experienced by the UE. The CQI feedback strategy is implemented through the SINR to CQI mapping by taking the 10% points of the BLER curves as shown in the given below Figure 4-3. The resultant CQI values are floored in order to get the integer CQI values which are sent to the corresponding eNodeB.
Figure 4-3: SNR to CQI mapping Model
4.2 Proposed Methodology The purpose of this thesis work is to improve QoS in downlink LTE network and efficiently use power at user equipment’s transceiver. Generally, there is tradeoff between the QoS and power saving. To balance between QoS and power consumption, a new scheduling technique is proposed to ensure QoS of RT and NRT traffic services while efficiently utilize power. Most of scheduling algorithms discussed in Chapter 3, achieve multiuser diversity that uses

20
opportunistic approach to assign time slots to users by considering channel conditions. The high system throughputs can be achieved by assigning resources only to those users who have good channel condition but this technique fails to fulfill fairness5
and users QoS requirements. To deal with these problems, other parameters are required to be considered to balance between spectral efficiency and user requirements.
4.2.1 Scheduling Dependencies The proposed scheduler uses opportunistic scheduling approach that calculates the priorities of users and assigns resources based on following entities:
1. Channel condition: In OFDMA system, downlink frequency is divided into sub-bands. Frequency-selective scheduling is possible by distributing these sub-bands among the users. Every sub-band experiences different channel and fading condition, scheduler estimates data rates and modulation scheme for each user on every sub-band. Estimation is based on CQI reports sent by users in uplink which include information about downlink SINR experienced by users.
2. Average throughput: It is the averaged data rate experienced by each user for a time window. To fulfill throughput requirements of users, it is necessary for the scheduler to keep track of user throughput history. In this way, the users who were lacking in the past would get more resources to fulfill their needs and as a result fairness among the users would also increase.
3. UE buffer status: Every UE has a finite length buffer to store received packets. Packet losses can occur due to insufficient spare space in this buffer. Most of the scheduling techniques discussed in Chapter 3, considers infinite buffer length and assumes that packet loss will not occur due to buffer overflow. This assumption is not realistic for real communication systems. In the proposed algorithm, buffer length at UE is assumed to be limited and scheduler gives high priority to the users who have spare buffer space. Similarly the users who have less spare buffer would get low priority to minimize packet loss.
4. GBR/ non-GBR: It is required by schedulers to treat RT and NRT services separately. GBR is an important parameter for RT serviced users. GBR users require a minimum data rate and transmission delay to fulfill RT service requirement. If a user experiences data rate lower than defined GBR then scheduler must allocate more resources to that user.
5. DRX status: DRX is an effective power saving technique to prolong UE battery life. There is a tradeoff between power conservation and QoS; more power saving results in higher transmission delays and packet losses. To cater this issue, proposed algorithm considers DRX status to bind the delays within thresholds defined in Table 2-1.
5 Fair distribution of system resources.

21
4.2.2 Scheduler Architecture The main entities involved in downlink scheduling algorithm are shown in Figure 4-4. In this figure, eNodeB with lower three layers, Layer 1, Layer 2 and Layer 3 are shown at left side and UEs are shown at right side. The information flows shown in the figure with solid lines are used by the traditional and proposed scheduling algorithms while information flows shown with dash lines are used only by the proposed algorithm.
The proposed scheduler at Layer 2 acquires CQI reports from UEs to estimate channel conditions of users. UEs also send their buffer status reports to eNodeB as receiver buffer at UE are assumed to be limited. A set of buffers at eNodeB stores the packets for each UE to be scheduled; the characteristics of packets include packet ID, traffic type and packet creation time. Mostly the schedulers do not consider the status of buffer at eNodeB. The proposed scheduler prioritizes the users based on the status of these buffers and characteristics of the packets in the buffers. As mentioned earlier, DRX mechanism effectively reduces power consumption at cost of higher packet delays and losses. The proposed scheduling algorithm attempts to minimize packet losses by prioritizing the users who has oldest packet at eNodeB buffer. Each UE sends its DRX information to DRX manager at Layer 3 of eNodeB. The DRX manager sends the DRX status to packet scheduler who determines remaining active and sleep mode time for each user. By considering these status (CQI, user buffer status, eNodeB buffer status and DRX status), scheduler tries to assign resources to the users through PDCCH to keep packet within delay bounds and effectively minimize packet delays and packet loss rate.
Figure 4-4: Entities involved in downlink packet scheduler
eNodeB
Buffer Status
DRX Status
RB allocation to UE
User Buffer Status
CQI Report
DRX Manager
Buffer
Packet Scheduler
Data Packet
Scheduling decision (RBs mapping)
Layer 1
Layer 2
Layer 3
DRX Info UEs
User 1
User 2
User M

22
4.2.3 Scheduling Algorithm The proposed algorithm selects and assigns available RBs to users according to priority matrix. The priority matrix is calculated by considering the scheduling dependencies described in 4.2.1. The priority values for each RB are estimated for every user; scheduler assigns RB to a user whose priority value is highest amongst all other users for that specific RB.
To calculate the priorities, the algorithm first estimates achievable throughputs for every RB if assigned to users. According to channel conditions reported by users for each RB, scheduler estimates maximum achievable throughputs of each RB for each user. If scheduler allocates RBs only to the users who experience good channel quality then high system throughputs can be achieved at the cost of lower fairness. To balance between system throughput and fairness, users whose performance in past was not satisfactory should be prioritized. Scheduler utilizes the property of Proportional Fair to balance between system throughput and fair resource distribution.
𝑓𝑎𝑖𝑟_𝑓𝑎𝑐𝑡𝑜𝑟𝑖 =
𝑎𝑐ℎ𝑖𝑒𝑣𝑎𝑏𝑙𝑒_𝑡ℎ𝑟𝑜𝑢𝑔ℎ𝑝𝑢𝑡𝑖𝑗𝑎𝑣𝑒𝑟𝑎𝑔𝑒_𝑡ℎ𝑟𝑜𝑢𝑔ℎ𝑝𝑢𝑡𝑖
Equation (4-1)
In Equation (4-1), 𝑎𝑐ℎ𝑖𝑒𝑣𝑎𝑏𝑙𝑒_𝑡ℎ𝑟𝑜𝑢𝑔ℎ𝑝𝑢𝑡𝑖𝑗 represents theoretical achievable throughput of 𝑅𝐵𝑗 if assigned to user 𝑖 at TTI. The 𝑎𝑣𝑒𝑟𝑎𝑔𝑒_𝑡ℎ𝑟𝑜𝑢𝑔ℎ𝑝𝑢𝑡𝑖 is throughput averaged through window which is defined in Equation (3-2) for a user 𝑖 at every TTI. If value at numerator is high means channel conditions are good, the user 𝑖 would be preferred by scheduler. Likewise high value at denominator indicates enough resources in past for user which results in high fairness among users.
Buffer overflow results in packet loss causing more retransmissions. In the proposed scheduling scheme user buffer status (BSR) is considered to provide immunity to packet loss due to overflow. In [10], the buffer status reporting is achieved by sending UE buffer information on uplink. This information includes receiver buffer length 𝐿𝑏𝑢𝑓𝑓 and length of used space at buffer 𝑁𝑐𝑢𝑟𝑟 . When UE buffer is empty then 𝑁𝑐𝑢𝑟𝑟 is initialized to 0 and increments in step of 1 at arrival of each packet at UE buffer. When buffer fills up completely, 𝑁𝑐𝑢𝑟𝑟 reaches buffer length 𝐿𝑏𝑢𝑓𝑓 (𝑁𝑐𝑢𝑟𝑟 = 𝐿𝑏𝑢𝑓𝑓) then it will be flushed back to 0. The BSR factor 𝑏𝑢𝑓𝑓𝑖 for user 𝑖 at every TTI is calculated as;
𝑏𝑢𝑓𝑓𝑖 = 𝐿𝑏𝑢𝑓𝑓𝑖 − 𝑁𝑐𝑢𝑟𝑟𝑖
𝐿𝑏𝑢𝑓𝑓𝑖 Equation (4-2)
The priority function 𝑃𝑖𝑗 calculates priorities of RT and NRT services with Equation (4-3) and Equation (4-4) respectively
𝑃𝑖𝑗 = 𝛿𝑖(𝑓𝑎𝑖𝑟_𝑓𝑎𝑐𝑡𝑜𝑟𝑖 + 𝑏𝑢𝑓𝑓𝑖), 𝑖 𝑖𝑠 𝑁𝑅𝑇 𝑢𝑠𝑒𝑟 Equation (4-3)

23
𝑃𝑖𝑗 = 𝑑𝑒𝑙𝑎𝑦_𝑓𝑎𝑐𝑡𝑜𝑟𝑖 𝛿𝑖 �𝑓𝑎𝑖𝑟_𝑓𝑎𝑐𝑡𝑜𝑟𝑖 �𝐺𝐵𝑅
𝑎𝑣𝑒𝑟𝑎𝑔𝑒_𝑡ℎ𝑟𝑜𝑢𝑔ℎ𝑝𝑢𝑡𝑖�∅
+ 𝑏𝑢𝑓𝑓𝑖� , 𝑖 𝑖𝑠 𝑅𝑇 𝑢𝑠𝑒𝑟 Equation (4-4)
where ∅ is tunable exponential factor for GBR and 𝛿 is a DRX status indicator for each UE. The 𝑃𝑖𝑗 is priority matrix for each 𝑅𝐵𝑗 if assigned to user i, 𝑓𝑎𝑖𝑟_𝑓𝑎𝑐𝑡𝑜𝑟𝑖 and 𝑏𝑢𝑓𝑓𝑖 are in accordant to Equation (4-1) and Equation (4-2) respectively. GBR is the guaranteed bit rate requirement for GBR users. The tunable exponential factor ∅ can be used to adjust preference of GBR users; if a user is achieving lower average throughput than required GBR then scheduler will increase priority of that user to fulfill GBR requirement. Likewise if a user is receiving more throughput than required GBR value scheduler will reduce its priority so that resources can be utilized among other users fairly. 𝑑𝑒𝑙𝑎𝑦_𝑓𝑎𝑐𝑡𝑜𝑟𝑖 is priority multiplier that increases the priority of users whose data residing at eNodeB buffer is close to delay bounds; higher waiting time at buffer means higher priority to prevent packet loss. The maximum delay threshold for VoIP packet according to Table 2-1 is 100 ms. This approach may reduce packet delay and packet loss rate significantly. The factors of delay_factori and 𝐺𝐵𝑅 are irrelevant for NRT traffic because NRT traffic is not delay sensitive and they do not require minimum data rates to guarantee.
This scheduling algorithm is designed in conjunction with DRX mechanism to fully exploit high bandwidth efficiency of LTE. DRX manager at eNodeB shares DRX status with UEs. To efficiently utilize bandwidth resources, scheduler must differentiate users in active and sleep mode of operation. On each TTI, first scheduler must consider only the users who are in active mode of operation then allocate resources for data transmission. DRX status must be included in priority criteria when scheduler is working in DRX environment. DRX status 𝛿 defines state of UE, when a user is in-active mode 𝛿 = 1. When a user is in sleep mode 𝛿 = 0 makes that user out of the scheduling competition. Thus the scheduler helps reducing resource wastage by considering only the users who are in active state.

24
Chapter 5 - Simulation Results and Discussion
In this chapter, simulation results will be presented and discussed. First it is necessary to understand simulation scenario and network topology.
5.1 Simulation Setup In this study a single hexagon cell with only one sector is considered. The network is operating at 2 GHz operating frequency and 5 MHz system bandwidth. There are total 25 Resource Blocks (25 𝑅𝐵𝑠 = 5 𝑀𝐻𝑧 180 𝐾𝐻𝑧⁄ ) available within the sector and each RB consists of 180 KHz band. The eNodeB is considered to be static which is serving 15 VoIP traffic users who are uniformly distributed within the sector and allowed to move randomly. These users can be considered as pedestrians moving with speed of 5 km/h. Additionally, fading models are used to simulate realistic channel conditions. To save power, DRX Light Sleep mechanism is implemented on the UEs. Its effect on QoS will be presented and discussed in later section. Other important simulation parameters are defined in Table 5-1.
Figure 5-1: Simulation network topology in relation from eNodeB and UE position
Figure 5-1 shows the network topology where,
Represents location of eNodeB which is divided into three sectors. Solid lines are used to show coverage angles for each sector.
Represents location of user equipments with assigned user ID as reference For intended study, Sector1 is used as target area and users are uniformly distributed over the sector coverage.
-50 0 50 100 150 200 250
0
50
100
150
200
Sector1
1
2
3
4
56
7
8
9
10
11
12
13
14
15
Distance from eNodeB [meters]
Dis
tanc
e fr
om e
Nod
eB [
met
ers]
Sector3
Sector3
Legends
eNodeB :
UE :
25
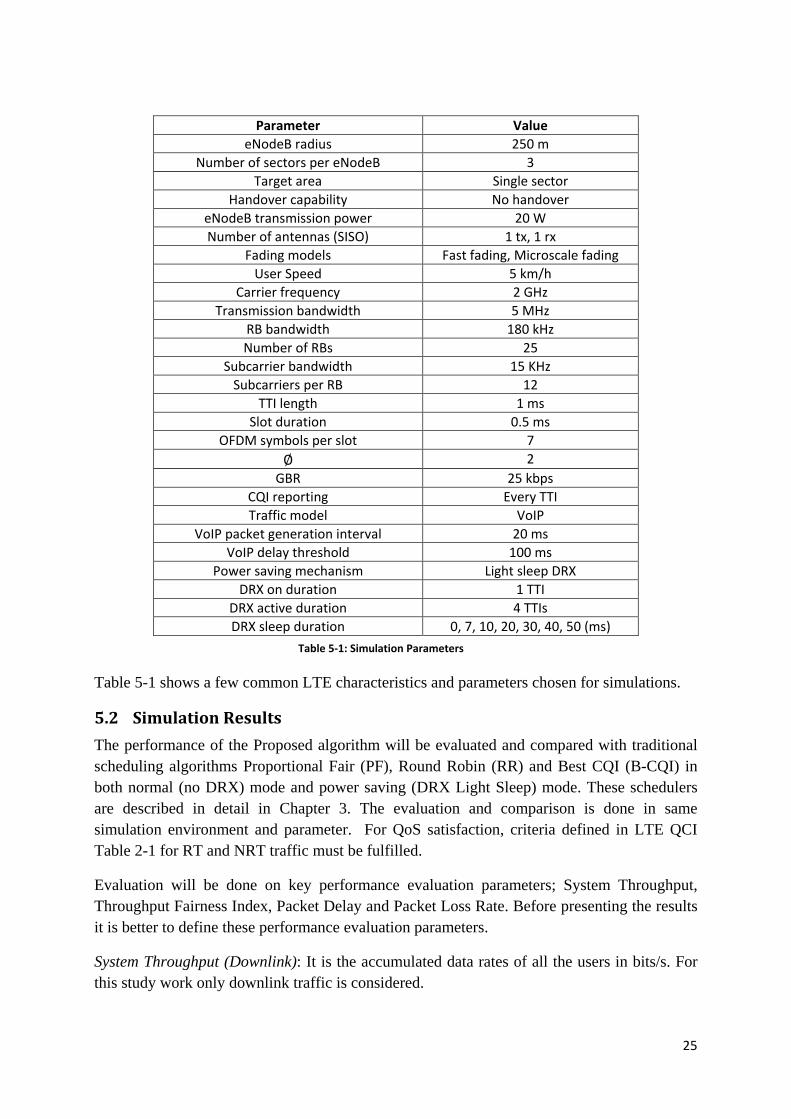
Table 5-1 shows a few common LTE characteristics and parameters chosen for simulations.
5.2 Simulation Results The performance of the Proposed algorithm will be evaluated and compared with traditional scheduling algorithms Proportional Fair (PF), Round Robin (RR) and Best CQI (B-CQI) in both normal (no DRX) mode and power saving (DRX Light Sleep) mode. These schedulers are described in detail in Chapter 3. The evaluation and comparison is done in same simulation environment and parameter. For QoS satisfaction, criteria defined in LTE QCI Table 2-1 for RT and NRT traffic must be fulfilled.
Evaluation will be done on key performance evaluation parameters; System Throughput, Throughput Fairness Index, Packet Delay and Packet Loss Rate. Before presenting the results it is better to define these performance evaluation parameters.
System Throughput (Downlink): It is the accumulated data rates of all the users in bits/s. For this study work only downlink traffic is considered.
Parameter Value eNodeB radius 250 m
Number of sectors per eNodeB 3 Target area Single sector
Handover capability No handover eNodeB transmission power 20 W Number of antennas (SISO) 1 tx, 1 rx
Fading models Fast fading, Microscale fading User Speed 5 km/h
Carrier frequency 2 GHz Transmission bandwidth 5 MHz
RB bandwidth 180 kHz Number of RBs 25
Subcarrier bandwidth 15 KHz Subcarriers per RB 12
TTI length 1 ms Slot duration 0.5 ms
OFDM symbols per slot 7 ∅ 2
GBR 25 kbps CQI reporting Every TTI Traffic model VoIP
VoIP packet generation interval 20 ms VoIP delay threshold 100 ms
Power saving mechanism Light sleep DRX DRX on duration 1 TTI
DRX active duration 4 TTIs DRX sleep duration 0, 7, 10, 20, 30, 40, 50 (ms)
Table 5-1: Simulation Parameters

26
Throughput Fairness Index: Fairness can be defined in terms of resource allocation or throughput. One of the requirements for schedulers is to provide similar throughputs to all the users irrespective to their location and channel conditions. Jain’s equation is used to obtain throughput fairness index. It is defined as,
𝐽(𝑥1, 𝑥2, … . , 𝑥𝑛) = �∑ 𝑥𝑖𝑛𝑖=1 �2
𝑛 ∑ 𝑥𝑖2𝑛
𝑖=1 Equation (5-1)
Equation (5-1) gives the fairness index 𝐽 when there are 𝑛 users and 𝑥𝑖 is the throughput for the 𝑖𝑡ℎ user. The Best case can give a maximum value of 1 which means all the users achieved exactly same throughput. When difference between users throughput increases then value of Jain’s equation decreases. In short, it is desired to achieve the value closer to 1 [18].
Packet Delay: It is difference in time when a packet is created and when user acknowledges that packet.
𝑃𝑎𝑐𝑘𝑒𝑡 𝐷𝑒𝑙𝑎𝑦 = 𝑡𝑖𝑚𝑒 𝑤ℎ𝑒𝑛 𝑝𝑎𝑐𝑘𝑒𝑡 𝑐𝑟𝑒𝑎𝑡𝑒𝑑 − 𝑡𝑖𝑚𝑒 𝑤ℎ𝑒𝑛 𝑎𝑐𝑘𝑛𝑜𝑤𝑙𝑒𝑑𝑔𝑒𝑑 Equation (5-2)
Packet Loss Rate (PLR): It is the ratio of number of packets lost to the number of packets sent. A packet is considered lost if user does not acknowledge it within delay threshold. Delay threshold for VoIP is 100 ms and packet loss rate of 10-2 according to QCI Table 2-1.
𝑃𝐿𝑅 = 𝑁𝑢𝑚𝑏𝑒𝑟 𝑜𝑓 𝑝𝑎𝑐𝑘𝑒𝑡𝑠 𝑙𝑜𝑠𝑡𝑁𝑢𝑚𝑏𝑒𝑟 𝑜𝑓 𝑝𝑎𝑐𝑘𝑒𝑡𝑠 𝑠𝑒𝑛𝑡
Equation (5-3)
In section 5.2.1 normal operational mode without DRX mechanism is considered for simulation results while in section 5.2.2 results are presented with power saving mechanism in DRX Light Sleep mode.
5.2.1 Normal operational mode All the schedulers are used in the same simulation setup as presented in section 5.1. Receivers of all UE are switched-on all the time that means no power is being saved by users. The schedulers that are being compared with Proposed scheduler were designed to work in non-DRX environment. But the Proposed solution specially considers active and sleep modes of users. Therefore, other schedulers may overwhelm the Proposed scheduler in one or more performance evaluation parameters.

27
0 0.5 1 1.5 2 2.5 3 3.5 4 4.5 50
2
4
6
8
10
12
14
16
18
Time [s]
Sys
tem
Thr
ough
put [
Mbp
s]
Figure 5-2: Downlink System Throughput with no DRX Light Sleep
Figure 5-2 shows systems throughput performance when simulation is run for 5000 TTI (5 sec). System throughput is aggregation of data rate of all the users in downlink. The results show that B-CQI scheduler performed the best in terms of system throughput. This is due to the fact that B-CQI chooses the users who have the best channel conditions in the uplink through CQI feedbacks. It completely neglects other users regardless to their requirements. As a consequences system throughput goes higher at cost of fairness among users. PF scheduler performed second best in this regard, it tries to balance system throughput with fairness. Proposed Scheme performed worse than B-CQI and PF scheduler because it is not designed to maximize system throughput rather it designed to provide good QoS. Three markers points to the time when the Proposed Scheme’s system throughput performance degraded significantly. One possible reason behind it could be that the throughput of some users had started to go below GBR limit due to bad channel condition and scheduler tried to compensate it by assigning more resources. Scheduler tries to achieve greater fairness at cost of system throughout. These significant throughput drops are following PF scheduler’s graph pattern, therefore it is expected by Proposed Scheme to perform better in terms of fairness. RR scheduler performed not so well but its throughput is more stable than any other scheduler because it treats all the users equally regardless to their channel conditions or requirements. Therefore it achieves constant but lower systems throughput.

28
Figure 5-3: Downlink Throughput Fairness Index with no DRX Light Sleep
Figure 5-3 shows throughput fairness indexes calculated though Jain’s Equation (5-1). This index defines how system throughput is divided among users at any instant. As expected, Proposed Scheme achieved significantly higher and stable fairness during simulation. PF scheduler does not take into account GBR and delays constraints. Therefore PF scheduler is following Proposed Scheme curve with lower fairness index. RR scheduler performed third in this regard, it assigns resources more fairly among users but fair resource assignment does not guarantee fair throughput distribution. Different users experience different channel and fading conditions thus a scheduler should be intelligent enough while assigning resources. B-CQI scheduler came last in terms of throughput fairness. From the curves it is clear that some users have achieved very high throughputs and some have achieved very low throughput.
Table 5-2 summarizes the results expressed in Figure 5-2 and Figure 5-3 with average values of system throughput and throughput fairness index. Average value of packet delays show that RR scheduler achieved least delay value followed by Proposed Scheme which has performed better than PF and B-CQI scheduler. B-CQI scheduler performed worst in this regard due to the fact that it ignores users with bad channel conditions. It had a packet loss rate of 0.1427 that means 14.27% of its packets were lost because packet delay had reached more than delay threshold
Scheduler Average System Throughput (Mbps)
Throughput Fairness Index (0-1)
Average Packet Delay (ms)
Packet Loss Rate
Proposed Scheduler 7.92 0.9216 1.46 0 Proportional Fair 9.74 0.8223 1.93 0 Round Robin 5.44 0.7642 0.83 0 Best CQI 15.62 0.2382 18.89 0.1427
Table 5-2: Performance Evaluation of Proposed scheduler and conventional schedulers in normal mode
0 .5 1 1.5 2 2.5 3 3.5 4 4.5 50
0.1
0.2
0.3
0.4
0.5
0.6
0.7
0.8
0.9
1
Time [s]
Thro
ughp
ut F
airn
ess
Inde
x

29
5.2.2 DRX Light Sleep/ Power Saving Mode To evaluate the performance of schedulers when considered power saving environment, DRX is implemented on the UE with DRX on-duration set to 1 TTI, active duration to 4 TTI and sleep duration to 7 TTI.
Figure 5-4: LTE Downlink System Throughput with DRX Light Sleep.
Figure 5-4 shows throughput simulation results of 5000 TTI (5 sec). Throughput of Proposed scheduler is significantly higher than all other three scheduler. The Proposed scheduler uses the DRX information for each user. The users who are either in On-duration or active duration are considered in scheduling decision (see δ in Equation (4-3) and Equation (4-4)). The other schedulers are not designed in this way; they consider all connected users during scheduling. B-CQI has highest dropped in system throughput as compare to all other schemes. In this simulation, throughput of PF and B-CQI has dropped significantly as compared to the case of without DRX mode. From the above result, it is also observed that system throughput of PF and B-CQI is nearest to each other because both schedulers do not consider the delay factor.
0 0.5 1 1.5 2 2.5 3 3.5 4 4.5 50
0.5
1
1.5
2
2.5
3
3.5
4
4.5
5
Time [s]
Sys
tem
Thr
ough
put [
Mbp
s]

30
Figure 5-5: Downlink Throughput Fairness Index with DRX Light Sleep
Figure 5-5 shows the graph of Throughput Fairness Index according to Jain’s equation. In this simulation, the throughput fairness index value is lower than previous case of without DRX and value is wavering that signifies throughput distribution among users is not constant. The reason for this erratic behavior is that users are continuously turning on and off themselves. The Proposed scheduler manages to achieve higher fairness because it considers channel conditions and user’s GBR requirements. It always tries that every user should achieve throughput higher than defined GBR value. The PF scheduler takes second position and its average fairness index is very close to Proposed scheduler because this scheduler tries to achieve balance between highest achievable throughput and fairness. The RR scheduler is at third position; this scheduler divided the resources equally among the users. Theoretically this should achieve maximum throughput fairness but it does not consider channel conditions therefore is staying behind Proposed scheduler. Finally, the value of B-CQI scheduler is lowest and is close to worst case scenario. B-CQI chooses a specific number of users with best channel conditions and allocates resources which results in resource starvation and poor fairness among users.
Scheduler Average System Throughput (Mbps)
Throughput Fairness Index (0-1)
Average Packet Delay (ms)
Packet Loss Rate
Proposed Scheduler 4.15 0.8337 5.48 0 Proportional Fair 1.82 0.8033 6.33 0 Round Robin 0.67 0.7596 3.92 0 Best CQI 1.94 0.2418 21.83 0.3268
Table 5-3: Performance Evaluation of Proposed scheduler and conventional schedulers with light sleep mode
The Table 5-3 summarizes the performance characteristics of all the schedulers. System Throughput and Throughput Fairness Index is discussed in detail previously. The Proposed
0 .5 1 1.5 2 2.5 3 3.5 4 4.5 50
0.1
0.2
0.3
0.4
0.5
0.6
0.7
0.8
0.9
1
Time [s]
Thro
ughp
ut F
airn
ess
Inde
x

31
scheduler, performed worse than RR scheduler in terms of packet delay. RR scheduler achieved poorest throughput and lower fairness index value because it does not exploit users with good channel conditions rather it treats them equally. There is no packet lost occurred during the simulation in first three schedulers as shown in Table 5-3. B-CQI lost 32% of its generated packets as it disregards poor channel quality users.
5.3 Power saving and QoS In this section the effect of power saving mechanism on QoS in LTE networks will be evaluated with shorter simulation duration of 1000 TTI. Simulation setup is same for all the schedulers like previous simulations. All schedulers will be subjected to different lengths of DRX cycles; the On-duration and active durations are same as previous simulation, only sleep durations are being changed. In previous two simulations DRX sleep duration was set to zero for normal mode while DRX sleep duration was set to 7 for power saving mode. The DRX Light Sleep duration will be further increased; longer sleep duration implies more power being saved. Theoretically, QoS should degrade as users remain less time in active state. The results of last two simulations show this difference clearly. Now QoS of these schedulers will be evaluated in intense power saving environment to see which scheduler crosses the QoS thresholds first and which one remains within acceptable limits while more power being saved.
Figure 5-6: System Throughput vs. Power Saving
Figure 5-6 depicts throughput curves for Proposed Scheme and traditional schedulers. The average system throughput is taken from 1000 TTI simulation for each scheduler. Results are taken by changing lengths of DRX Light Sleep duration. Proposed scheduler did not perform better when no DRX (sleep duration = 0) used. This is due to the fact that Proposed scheduler is designed to provide better fairness among the users by fulfilling GBR users’ requirements at the cost of lower system throughput. Here it is clear that Proposed Scheme is least affected
0 5 10 15 20 25 30 35 40 45 500
2
4
6
8
10
12
14
16
DRX Sleep Duration (ms)
Ave
rage
Thr
ough
tput
(Mbp
s)
Proposed SchemeProportional FairRound RobinBest CQI

32
by increase in sleep durations because it considers DRX state of users. B-CQI and PF scheduler perform better than Proposed Scheme in normal mode of operation but their performance degraded significantly when system is working in power saving mode. The above result clearly shows that Proposed Scheme is still performing better than other schemes if duration of DRX sleep is increased.
Figure 5-7: Throughput Fairness Index vs. Power Saving
Throughput fairness index signifies equality among users. If users are experiencing same user throughput, then throughput fairness index will be high or closer to 1, otherwise it will result in lower values. From start of curves in Figure 5-7; the Proposed Scheme performs significantly well but its fairness index reduces and goes below RR after 20 ms sleep duration. In Proposed Scheme, packet delay plays a major role in priority calculation. When sleep duration increases, packet delays increase and scheduler tries to compensate this by giving more resources to the user whose packet is getting closer to delay threshold. As a result, some users experience higher throughput and some experience lower throughput. In case of continuously increasing the DRX sleep duration the Figure 5-7 clearly shows that RR has highest performance index as compare to Proposed Scheme but RR had experienced poor system throughput which is shown in Figure 5-6.
The RR scheduling technique is maintaining better equality (data rates are equal) between users but did not provide sufficient data rates for users to satisfy its QoS requirements. PF performance started to degrade after 10 ms sleep duration. B-CQI performed worst in this case; it has lowest value among all the schedulers that means some users managed to get good share of resources and therefore achieved good throughput and some users did not get any resources to receive any data. The graphs of RR and B-CQI scheduler remained constant
0 5 10 15 20 25 30 35 40 45 500
0.1
0.2
0.3
0.4
0.5
0.6
0.7
0.8
0.9
1
DRX Sleep Duration (ms)
Thro
ughp
ut F
airn
ess
Inde
x
Proposed SchemeProportional FairRound RobinBest CQI

33
because RR treats all users in same way irrespective to their channel conditions and requirements. B-CQI served only a few users and change in sleep duration did not make any difference in user selection and resource allocation.
Figure 5-8: Average Packet Delay vs. Power Saving
Figure 5-8 shows effect of power saving on packet delays for all four schedulers. Packets delays are one of the major concerns for multimedia traffic as this parameter directly affects QoS. For successful VoIP communication it is required that after creation of packet, it must be reached to UE within 100 ms otherwise packet will be discarded. When DRX sleep duration increases, the most of the time UE switched off, which result packets start to get delayed. Thus packet delay is directly proportional to power being saved through light sleep DRX duration. The above simulation result shows that RR performed best and Proposed Schemes performed second best. Both of these curves followed a linear pattern while PF started well in start but performance degraded significantly after 20 ms sleep duration. Similar behavior can be observed in Figure 5-7 when throughput Fairness index decreased rapidly after 20 ms sleep duration. B-CQI performed worst in terms of packet delays because it is designed to achieve maximum systems throughput thus it disregards fairness and delay constraints.
0 5 10 15 20 25 30 35 40 45 500
5
10
15
20
25
30
35
40
45
50
DRX Sleep Duration (ms)
Ave
rage
Pac
ket D
elay
(ms)
Proposed SchemeProportional FairRound RobinBest CQI

34
Figure 5-9: Packet Loss Rate vs. Power Saving
Figure 5-9 depicts the performance of scheduler in terms of packet loss rate which is defined as the ratio of packets lost to total packets transmitted. If a packets delay exceeds delay threshold (100 ms for VoIP) then it is considered to be lost packet. This delay can be caused by either scheduler or retransmission due to NACKs. But for this simulation delays were only dependent upon scheduler. As packet loss rate is directly proportional to packet delays therefore packet loss rate graphs are similar to packet delay graphs Figure 5-8. RR scheduler achieved zero packet loss until 30 ms sleep duration after that it had started to lose a few packets. Proposed Scheme performed second best but it performed very close to RR scheduler. Proposed Scheme is designed to reduce packet delays and losses while achieving good throughput and fairness (see 𝑑𝑒𝑙𝑎𝑦_𝑓𝑎𝑐𝑡𝑜𝑟 in Equation (4-4)). For Example, if a packet for a user stays for longer period of time in eNodeB’s buffer then scheduler increases its priority to send this packet to destination as soon as possible. PF scheduler performed well in low power saving conditions but its packet loss rate started to increase rapidly after 20 ms sleep duration. From packet delay graph PF was expected to behave poorly in terms of packet loss rate. B-CQI performed worst in terms of packet loss rate because it serves only few users which have good channel condition while packets of others users get lost due to insufficient resources.
0 5 10 15 20 25 30 35 40 45 50
0
0.1
0.2
0.3
0.4
0.5
0.6
DRX Sleep Duration (ms)
Pac
ket L
oss
Rat
io
Proposed SchemeProportional FairRound RobinBest CQI

35
Chapter 6 - Conclusion and Future Work
In this research work we proposed a new downlink scheduling algorithm for delay sensitive traffic (VoIP). The addition of multimedia services in wireless systems has made power saving of UE a challenging issue because these services require more power than normal operation. The Proposed scheduler endeavors to provide better QoS by decreasing packet losses and improve fairness among the user. It has capability to assure QoS in both power saving and non-power saving environment. We have compared the Proposed Scheme with traditional schemes according to different QoS attributes through simulations. The Proposed Scheme is evaluated in normal operation mode and power saving mode and the impact of power saving on QoS is also examined
In normal operation mode, the results are summarized in Table 5-2. It is observable that B-CQI has higher system throughput in as compared to all other schedulers with cost of fairness among users, because it only serves those users which have good channel quality. PF scheduler performs second best in this regard, it tries to balance system throughput with fairness. In system throughput, the Proposed scheduler has third position after B-CQI and PF but in case of throughput fairness index it performs better than all other schedulers. The RR scheduler performs worst in system throughput but it has third rank in fairness.
According to QCI Table 2-1, conversational voice (VoIP) traffic is allowed to have packet loss rate of 10-2 which means 1 packet is allowed to lose if 100 packets have been sent. The RR scheduler performs well in packet delay and packet loss rate factors because it has more stable pattern of system throughput as it treats all users equally as compared to other schedulers. RR scheduler achieves least delay value and zero packet loss rate followed by Proposed Scheme which has performed better than PF and B-CQI schedulers. The PF has third position in packet delay with no packet loss. The B-CQI scheduler has worst performance in packet delay and packet loss rate because it does not take into account those users which have bad channel conditions. It has highest packet delay and packet loss rate because packet delay crosses delay threshold limit.
In power saving mode with DRX Light Sleep, the results are summarized in Table 5-3. It is noticeable that the Proposed scheduler has highest system throughput and fairness as compared to all other traditional schedulers. The performance of traditional schedulers reduces significantly as they do not consider DRX status of each user during scheduling decision. The B-CQI has second place in system throughput after Proposed scheduler but B-CQI has highest drop in system throughput as compared to no power saving environment. It also has worst performance in terms of fairness among users. The system throughput of PF and B-CQI are nearest to each other because both schedulers do not consider the DRX status of users and delay factor induced by DRX mechanism. The PF scheduler has third rank in system throughput but it has second position in fairness. The RR scheduler again performs worst in system throughput but it has third rank in fairness.
The RR scheduler again performs well in packet delay and packet loss rate. It has lowest packet delay value in comparison to other schedulers with zero packet loss rate. The Proposed
36
scheduler performs better than PF and B-CQI as it has second place in packet delay and it also has zero packet loss rate. The PF has third place in packet delay and like Proposed and RR schedulers it has zero packet loss rate. B-CQI scheduler has worst performance in packet delay and packet loss rate as it considers only those users which have good channel conditions. It has highest packet delay and packet loss rate because packet delay has crossed delay threshold.
The effects of power saving environments on QoS in LTE networks have been evaluated. The results in Figure 5-6 illustrate a significant drop in system throughput of all traditional schedulers when DRX sleep duration is increased. The Proposed scheduler is less affected because it considers DRX state of users. The Proposed scheduler initially performs well in throughput fairness index in Figure 5-7 compared to traditional schedulers but with the increase of DRX Light Sleep cycle length it starts to degrade as packet delay also increases and after 20 ms sleep duration it goes below to RR scheduler. The performance of Proposed scheduler degrades because it tries to compensate packet delay by giving more resources to the user whose packet is getting closer to delay threshold. The performance of PF scheduler is most affected by DRX sleep duration in term of fairness. The RR scheduler is consistent in fairness but it does not provide sufficient data rate to users to fulfill their QoS requirement. The result depicts that B-CQI has poorest performance when compared to all other scheduler because it allocates resource to those users which have good channel condition and does not serve those users which have bad channel conditions.
The DRX sleep duration causes an increases in packet delays because UEs are switched off most of the time. In Figure 5-8, RR scheduler performs well in packet delay while Proposed scheduler has second place and both these schedulers have linear packet delay behavior with the increase in DRX sleep durations. The performance of PF degrades drastically by increasing the DRX sleep duration while B-CQI has poor performance because it is designed to achieve maximum systems throughput thus it disregards fairness and delay constraints.
The packet loss rate is directly proportional to packet delays because if a packet delay exceeds delay threshold then it is considered as a lost packet. In Figure 5-9, RR scheduler has good performance as compared to all other schedulers and Proposed scheduler performs second best but its performance is very close to RR scheduler. The Proposed scheduler is designed in such a way that it achieves good throughput and fairness while reducing the packet delays and losses. The PF scheduler initially performs well but by increasing the DRX sleep duration its starts packet losses as it does not consider the delay induced by DRX mechanism. The B-CQI scheduler has worst performance in term of packet loss rate because it does not consider delay.
In future work, a larger simulation environment will be used with several eNodeBs. The effects of mobility on QoS will be evaluated by considering the handover procedures. The whole research work is done on VoIP traffic model while in future the other traffic models will also be implemented like http, ftp, gaming, video or mixed traffic. The impact of dense user environment on QoS will also be evaluated. The performance of Proposed scheduler algorithm can be examined with different antenna transmission configuration such as MIMO.

37
The performance of Proposed scheduler can also be examined with DRX Deep Sleep mode of operation and its comparison with DRX Light Sleep.
38
References [1] Bilal, S.; Ritesh, M.; and Ashwin, S.; “Downlink Scheduling for Multiclass Traffic in LTE,” EURASIP Journal on Wireless Communications and Networking, 2009.
[2] Piro, G.; Grieco, L.A.; Boggia, G.; Camarda, P.; "A two-level scheduling algorithm for QoS support in the downlink of LTE cellular networks," IEEE Wireless Conference (EW), 2010 European , April 2010.
[3] Ramli, H.A.M.; Basukala, R.; Sandrasegaran, K.; Patachaianand, R.; , "Performance of well known packet scheduling algorithms in the downlink 3GPP LTE system," IEEE 9th Malaysia International Conference on Communications (MICC), Dec. 2009.
[4] Pedersen, K.I.; Kolding, T.E.; Frederiksen, F.; Kovacs, I.Z.; Laselva, D.; Mogensen, P.E.; , "An overview of downlink radio resource management for UTRAN long-term evolution," IEEE Communications Magazine, July 2009.
[5] David, M.S.; Jose F.M.; Jorge, C.P.; Daniel, C.; Salvador, G.; and Narcís C.; “On the Way towards Fourth-Generation Mobile: 3GPP LTE and LTE-Advanced,” EURASIP Journal on Wireless Communications and Networking, 2009.
[6] J.Zyren, “Overview of 3GPP Long Term Evolution Physical Layer” freescale semiconductor 2007.
[Online] http://www.freescale.com/files/wireless_comm/doc/white_paper/3GPPEVOLUTIONWP.pdf access on August, 2011
[7] 3GPP, Evolved Universal Terrestrial Radio Access (E-UTRA) and Evolved Universal Terrestrial Access Network (E-UTRAN), 3GPP TS 36.300 V9.7.0, (2011-03).
[8] Donthi, S.N.; Mehta, N.B.; , "Performance analysis of subband-level channel quality indicator feedback scheme of LTE," IEEE National Conference on Communications (NCC), 2010 , Jan. 2010.
[9] 3GPP, Technical Specification Group Radio Access Network; Evolved Universal Terrestrial Radio Access (E-UTRA); Physical layer procedures, 3GPP TS 36.213 V9.3.0 (2010-09) [10] Yan, L.; Guangxin, Y.; "Channel-Adapted and Buffer-Aware Packet Scheduling in LTE Wireless Communication System," IEEE 4th International Conference on Wireless Communications, Networking and Mobile Computing, (WiCOM), Oct. 2008. [11] Kian, C. B.; Armour, S.; Doufexi, A.; "Joint Time-Frequency Domain Proportional Fair Scheduler with HARQ for 3GPP LTE Systems,"IEEE 68th Vehicular Technology Conference, 2008. (VTC 2008-Fall), Sept. 2008. [12] Delgado, O.; Jaumard, B.; , "Joint admission control and resource allocation with GoS and QoS in LTE uplink," IEEE GLOBECOM Workshops (GC Wkshps), 6-10 Dec. 2010. [13] Huang; B.; Tian, H.; Chen L.; Zhu, J.; "DRX-Aware Scheduling Method for Delay-Sensitive Traffic," IEEE Communications Letters, December 2010.

39
[14] Xin, W.; Giannakis, G.B.; Marques, A.G.; "A Unified Approach to QoS-Guaranteed Scheduling for Channel-Adaptive Wireless Networks," IEEE Proceeding , Dec. 2007. [15] Leonardo, B.; Andrea, B.; Alfredo, T.; Simone, M.; Silvano, P.; Andrea, Z.; Michele, Z.; , "On the impact of physical layer awareness on scheduling and resource allocation in broadband multicellular IEEE 802.16 systems [Radio Resource Management and Protocol Engineering for IEEE 802.16]," IEEE Wireless Communications, Feb. 2007. [16] Yong, F.; Lunden, P.; Kuusela, M.; Valkama, M.; , "Efficient Semi-Persistent Scheduling for VoIP on EUTRA Downlink," IEEE 68th Vehicular Technology Conference, (VTC 2008-Fall), Sept. 2008. [17] Ikuno, J.C.; Wrulich, M.; Rupp, M.; , "System Level Simulation of LTE Networks," IEEE 71st Vehicular Technology Conference (VTC 2010-Spring), May 2010. [18] Jain, R.; “The art of computer systems performance analysis: techniques for experimental design, measurement, simulation and modeling”. New York, John Wiley & Sons (1991). [19]3GPP, LTE physical layer framework for performance verification, 3GPP TSG-RAN1#48, R1-070674, [online] http://www.3gpp.org/ftp/tsg_ran/wg1_rl1/TSGR1_48/Docs/, access on August, 2011.