Embed Size (px)
Citation preview

QC the IssuesCurtis A. Parvin, Ph.D.Manager of Advanced Statistical ResearchQuality Systems Division

Components of a QC Policy
• Components of a QC policy to considerComponents of a QC policy to consider– Setting of quality standards– Selection of materialsSelection of materials– Selection of concentrations– Setting (and re-setting) of QC targets– Setting (and re-setting) of QC targets– Setting (and re-setting) of QC limits
Selection of rules– Selection of rules– Frequency of running QC
Response to out of range results– Response to out of range results– Other QC activities (eg AoN)

Principles of Quality Control Guideline
• CLSI C24 A4: Statistical Quality Control for• CLSI C24-A4: Statistical Quality Control for Quantitative Measurement Procedures: Principles and Definitions: Approved GuidelinePrinciples and Definitions: Approved Guideline –Fourth Edition
First meeting in June 2013– First meeting in June 2013– Agreed on a draft outline for the revision

CLSI C24-A4 Draft Outline
7.1 Define the quality requirementsq y q7.2.1 Select control materials7.2.2 Concentrations of analytes in control materials8.1.1 Determining QC targets8.1.2 Determining QC decision limits7.2 Select a QC strategy that meets performance goals8.2.2 QC schedule (frequency)8 2 4 R i f t f t l diti8.2.4 Recovering from an out-of-control condition9. Other applications

Assessing QC Performance
• QC performance is assessed by predicting the• QC performance is assessed by predicting the risk that patient results fail to meet their quality requirement when an out of control conditionrequirement when an out-of-control condition occurs.A i QC f id• Assessing QC performance provides some (most?) of the “evidence” for evidence based QC
dprocedures

Assessing QC Performance
• Two main approaches• Two main approaches– Predict the probability of a QC rule rejection when a
“critical” out-of-control condition occurscritical out-of-control condition occurs– Predict the expected number of unreliable patient
results produced due to an out-of-control conditionresults produced due to an out of control condition.

Probability of Detecting Out-of-Control ConditionsCo d t o s
• Choose number of QCs tested and QC rules to• Choose number of QCs tested and QC rules to assure a high probability of detecting a “critical” out of control conditionsout-of-control conditions.

Probability of Detecting Out-of-Control ConditionsCo d t o s
1SEc
0.8
1
Mean/Range Rule, NQ=213s Rule, NQ=4
0.6
13s Rule, NQ=2
0.4
Ped
0.2
0 3 6 9 12 150
SE (%)

Number of Unreliable Patient Results
• Choose number of QCs tested QC rules and• Choose number of QCs tested, QC rules, and frequency of QC testing to assure the expected number of unreliable patient results produced is notnumber of unreliable patient results produced is not too high.

Number of Unreliable Patient Results
E(Nu)
• An instrument producing results over time.• Vertical lines denote patient results being examined• Vertical lines denote patient results being examined.• Diamonds denote QC rule evaluations.• At a point in time an out of control condition occurs• At a point in time an out-of-control condition occurs.• Red asterisks denote unreliable patient results.• When a QC rule rejection occurs the out of control• When a QC rule rejection occurs, the out-of-control
condition is fixed and the process resumes in an in-control state.control state.

Number of Unreliable Patient ResultsE(Nu)
E(Nu)Expected # Affected
• The number of unreliable patient results during an out-of-control condition depends onof control condition depends on
• the number of patient results affected by the out-of-control condition
• the fraction of affected results that fail the quality requirement (red asterisks)
• E(Nu) = Expected number of unreliable patient results ( u)produced during an out-of-control condition

Number of Unreliable Patient ResultsE(Nu)
E(Nu)
E(N ) E(N )E(Nuf) E(Nuc)
• The patient results during an out-of-control condition can be divided into– Results prior to the last accepted QC event (Pre)– Results since the last accepted QC event (Post)
• E(Nuf) = Expected number of unreliable final results• E(Nuc) = Expected number of unreliable correctable results

Expected Number of Unreliable Patient Resultsat e t esu ts
• Given• Given– The quality specification
Test method performance (Bias CV)– Test method performance (Bias, CV)– The QC rule
Th f f QC t ti– The frequency of QC testing• Then the expected number of unreliable patient
lt d d th i f th t f t lresults depends on the size of the out-of-control condition

Expected Number of Unreliable Patient Resultsat e t esu ts
E(Nuf) E(Nuc)

Choosing a QC Strategy
• Choose number of QCs tested and QC rules with a high predicted probability of detecting critical out-of-control conditions.
• Choose number of QCs tested, QC rules, and frequency of QC testing with a low predictedfrequency of QC testing with a low predicted number of unreliable patient results produced.
• Both approaches can help a laboratory design• Both approaches can help a laboratory design good QC strategies.H b th h i d d• However, both approaches require advanced mathematical computations that can only be d ith t ftdone with computer software.

Some Recommended QC Practices
• They are widely applicabley y pp• Implementing them is straightforward• They don’t require advanced math to understand• They don t require advanced math to understand
or to implement, but they come from the same advanced theoriesadvanced theories.
• They won’t provide an optimal QC strategy, but th h ld l b i th i ht di tithey should move a lab in the right direction.

QC Practice #1
Always end patient testingAlways end patient testing with a QC evaluation.Q

QC Practice #1Batch Testing
Continuous Testing
???????? ? ….
….
….

QC Practice #2
Make the time between QC evaluations shorter than the
time needed to correct results.

QC Practice #2
• Both CLIA and ISO 15189 state that when QC• Both CLIA and ISO 15189 state that when QC detects an out-of-control condition laboratories should inspect and correct adversely affectedshould inspect and correct adversely affected patient results already released.
??????? ?
….….….
|correct before acted on||correct before acted on|

QC Practice #3
Know the number of patientKnow the number of patient results between QC evaluations.

QC Practice #3
• From the laboratory’s perspective• From the laboratory s perspective– risk is related to the number of patient results
examined between QC evaluationsexamined between QC evaluations– not the length of time between QC evaluations.

QC Practice #4
Estimate the magnitude of an out-of-control condition before
ti itcorrecting it.

QC Practice #4
• When QC detects an out-of-control condition– First estimate the magnitude of the failure
• The QC results that triggered the QC rejection provide little i f ti di th it d f th f ilinformation regarding the magnitude of the failure
– Then identify the cause and correct the failureTh f th f il– Then recover from the failure
• estimated magnitude of the failure guides the recovery effort

QC Practice #5
If you’re using a 1:2s QC rule and you get a rule failure,
t it b t j t !repeat it - but just once!

QC Practice #5
• Repeat 1:2s QC Rule with 2 levels of QC– Measure the 2 QCs– If both are within ±2s then accept– If both are outside ±2s then reject– Otherwise repeat both QCsp– If both repeated values are within ±2s then accept– Otherwise rejectj
• This is NOT “repeat, repeat, repeat, got lucky”!– It’s a QC rule with the possibility of running a secondIt s a QC rule with the possibility of running a second
set of QCs depending on the results obtained from the first set.

QC Practice #5

QC Practice #6
Divide analytes into High andDivide analytes into High and Low sigma metric groups.g g p

QC Practice #6
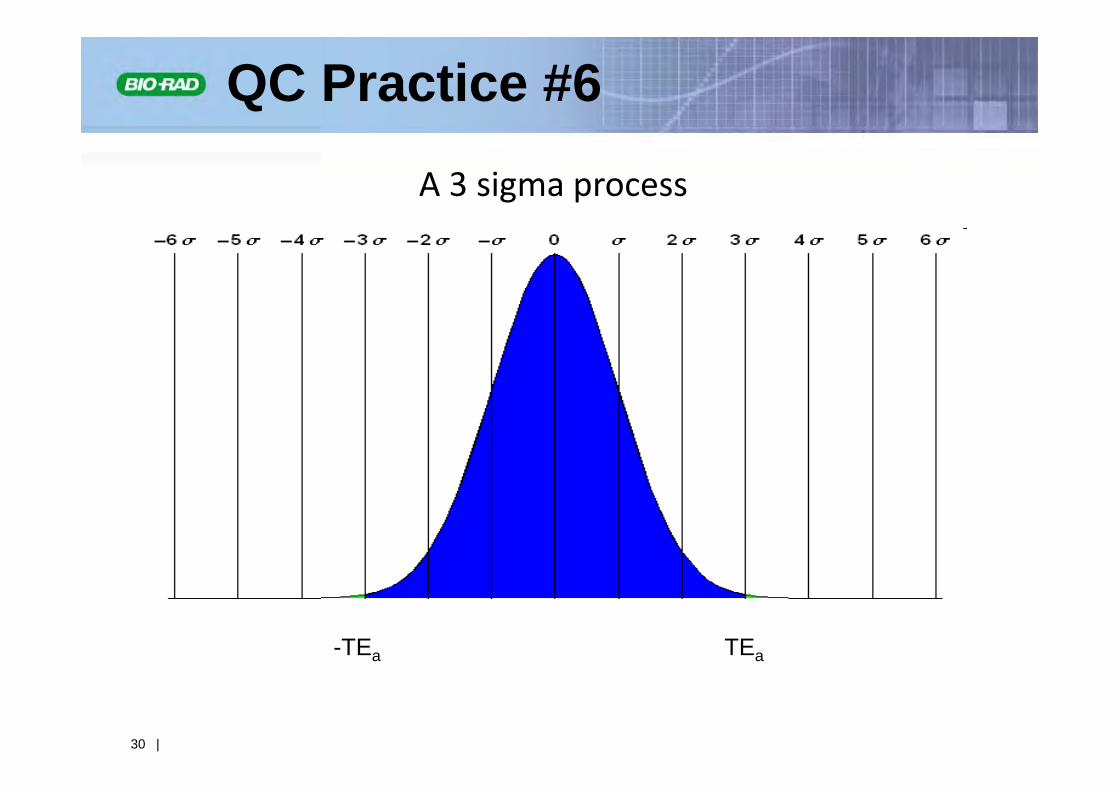
• Sigma Metric = (TEa – Bias) / SD• The sigma metric is the number of process SD’s
that fit within the process tolerance pspecifications.
QC Practice #6
A 3 sigma process
TEa-TEa
30 |

QC Practice #6
A 6 sigma process
TEa-TEa
31 |

QC Practice #6
• High sigma metric processes are easy to QC.• Low sigma metric processes are hard to QC.• For high sigma metric processesFor high sigma metric processes
– Reduce your false rejection rate.Strengthen your quality claim (use a smaller TE )– Strengthen your quality claim (use a smaller TEa).
• For low sigma metric processesS k t d bi d i i i– Seek ways to reduce bias and imprecision.
– Use more powerful QC rules and increase QC frequencyfrequency.

Summary
• Advanced tools exist to help laboratories choose good QC strategies that mitigate patient risk.
• The best QC design tools require advanced g qcomputer algorithms.
• 6 QC practices are described that don’t require6 QC practices are described that don t require advanced computer software, are generally applicable and are straightforward toapplicable, and are straightforward to implement.