Embed Size (px)
Citation preview

QbD
and Applied Biopharmaceutics for Patient Benefit
Arzu Selen, Ph.D.Associate Director, Biopharmaceutics
Office of New Drug Quality Assessment/CDER/FDA
The 32nd
Annual Midwest Biopharmaceutical Statistics Workshop
May 18-20, 2009, Ball State University, Muncie, Indiana

2
Expectations from this meeting
Dialogue on: •
Integration of QbD
and
biopharmaceutics for patient benefit•
Challenges/opportunities–
Advancing dissolution/drug release testing as a product quality tool •
Predictive methods
•
Modeling and simulations

3
Outline of My Talk
• Integrating QbD
and Biopharmaceutics
(Linking Product and Patient Benefit)•
Exploring Opportunities for the patient benefit: Considerations and tools
• Summary and What’s Ahead?

4
Integrating QbD
and Biopharmaceutics
Define desired product performance
upfront;identify product CQAs
Design formulation and process to reproducibly
and robustly meet product CQAs
Understand impact of material attributes and process parameters on
product CQAs
Identify and control sources of variability
in material and process
Continually monitor and update
process to assure consistent quality
Risk assessment and risk control
Product/process design and development
QbD system
Supported by Biopharmaceutic
studies And related tools

5
QbD is Product and Process:•
Product Knowledge
–
understanding of how variability
impacts product–
Material variability -
PSD, surface area, moisture
content, etc. –
Process variability -
granulation, tableting conditions,
etc.•
Product Specification–
to provide continued assurance
of clinical performance•
Product Performance–
ensuring product quality as dissolution links/relates product attributes to clinical performance
Moheb Nasr, Ph.D., A.C.P.S., October, 2005

6
The Three Considerations Critical for Quality (Patient Benefit):
Product:–
Designed to meet intended use–
Consistently delivers the desired/intended dose Manufacturing Process:
–
Designed to consistently meet product critical quality attributes
–
Suitable for continuous monitoring and updates and allows for consistent quality over time (life cycle)
Understanding the Main Sources of Variability:–
Due to starting materials and process –
Due to Methodology and assumptions –
Due to product-patient interface and the patient

7
–
Determine/estimate key product characteristics (target product profile)
–
Develop and verify in vitro methods
such as drug release/dissolution method and characteristics against target product profile and
in vivo
data
–
Identify the relationship between product attributes and in vivo performance
–
Determine the sources of variability
and factors that need to be modified to optimize the product
–
Build on knowledge
gained to optimize the product (iterative process)
A Path to Integrating QbD
and Biopharmaceutics:

8
•
What in vitro characteristics will achieve in vivo target?
•
What is the clinical relevance of in vitro methods?–
Is in vitro data (model) predictive of in vivo performance?
•
What is a significant
change in in vitro dissolution/release?
•
How can in vitro dissolution/release be altered to achieve in vivo target?
Building Blocks: In vitro studiesConsiderations and Tools
9
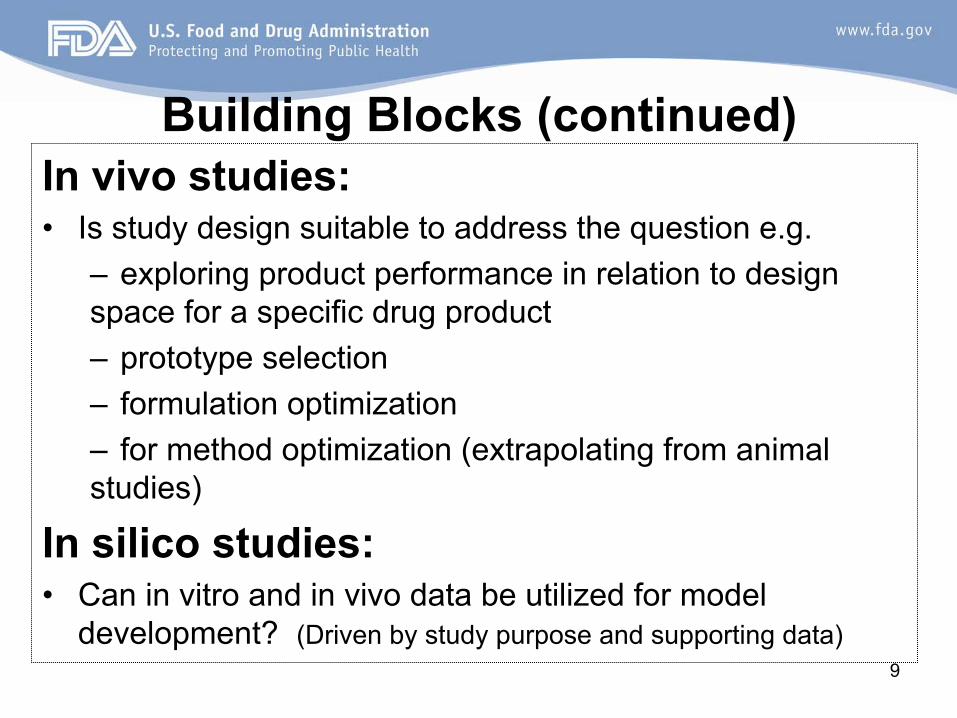
In vivo studies: •
Is study design suitable to address the question e.g.–
exploring product performance in relation to design
space for a specific drug product–
prototype selection
–
formulation optimization–
for method optimization (extrapolating from animal
studies)
In silico
studies:•
Can in vitro and in vivo data be utilized for model development? (Driven by study purpose and supporting data)
Building Blocks (continued)

10
A common denominator for understanding product, manufacturing process and the product-patient interface
May be a good indicator of product quality (stability, release testing)
May serve as asubstitute for in vivo BE studies
May predict in vivoperformance
In vitro Dissolution/Release Testing: A Product Quality Tool

11
IVIVC or IVIVR: Quality Tool and More•
Based on established IVIVC–
in vitro dissolution data serve as a surrogate for human BE studies
–
in vitro dissolution specification has in vivo relevance
–
guides product development by predicting in vivo performance
•
Optimized/Advanced IVIVC/IVIVR
testing may bridge routine testing results (such as those at product release) to in vivo product performance.

12
Other Considerations/Opportunities:
–
disintegration or some other quality attribute may be a substitute for in vitro dissolution
As long as quality performance of drug products may be assured throughout their intended shelf-life.

13
A Corner Stone and 3 Examples

14
J.P. Skelly, M.K. Yau, J.S. Elkins, L.A. Yamamoto, V.P. Shah and W.H. Barr.
In vitro topographical characterization as a predictor of in vivo controlled release quinidine
gluconate
bioavailability. Drug Dev. Indust. Pharm. 12(8&(), 1177-1201, 1986
One of the Early Corner Stones: Similar dissolution at pH 1
Product 3
Product 4

15
Example 1: Response Surface Approach (Developing A Story for Drug X)
Objective:Preparing a drug delivery system for Drug X Methods:
–
Nine prototypes were developed –
Full 32
factorial design was applied to optimize drug release profile and for determining the composition of key excipients
–
Selection criteria: highest in similarity to the theoretical/desired dissolution profile using t50% (time 50% dissolved) and t80% (time 80% dissolved)
Brijesh
S. Dave, Avani
F. Amin, and Madhabhai
M. Patel, Shree S. K. Patel,AAPS PharmSciTech 5 (2) Article 34, 2004;
(http://www.aapspharmscitech.org).

16
Results:

17
Batches of Drug Product X and Time for 80% dissolved (seconds)
Batch F2
Batch F5
Batch F9
Batch
F7
Batch F6

18
Assumptions to Build a Story:•
AUC(0-6h) values predict clinical outcome
•
T80% response surface maps directly to AUC(0-6h)
•
For clinical efficacy: AUC(0-6h) ≥
150 ng.h/mL•
AUC values follow normal distribution
•
Variances are additive •
CV% of 5% in T80% is representative of all product related variability in our example
•
Based on a literature publication for Drug X: mean(CV%) for AUC(0-6h) is 180 ng.h/mL
(30%)

19
What percent of patients will have a favorable clinical outcome if they take these batches of Drug X?
Continuing with the Story:Batches of Drug Product X and time for 80% dissolved

20
Simulation: n=1000 based on “typical”
(literature) data, approximately 75% of the patients will have target AUC(0-6h) values

21
Batch F2: Approximately 70% of patients will have AUC(0-6h) values ≥
150 ng.h/mL
Batch F7: Approx. 7% of patients will have AUC (0-6h) values ≥
150 ng.h/mL
22
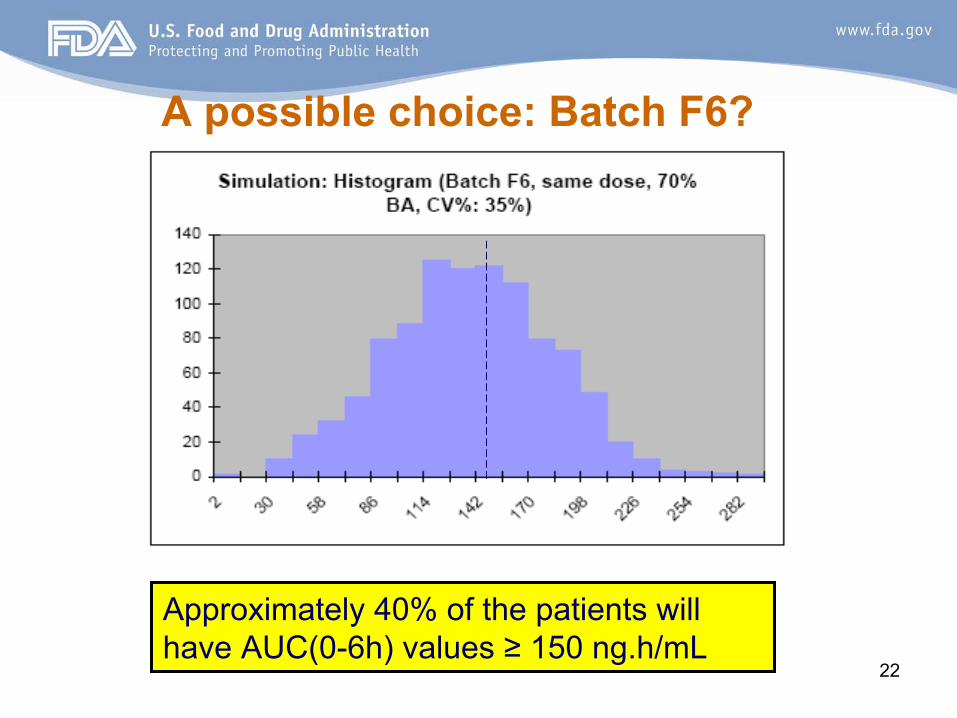
Approximately 40% of the patients will have AUC(0-6h) values ≥
150 ng.h/mL
A possible choice: Batch F6?

23
Summary of simulation results:

24
Moving Forward with Drug X?Things we know/estimated:•
Effect of varying excipient
content on in vitro dissolution
•
Relationship between dissolution and estimate of clinical outcome (target AUC(0-6h) values)
•
Possible/potential in vivo outcomes, based on simulations, for the prototypes
Need to explore•
Verify “stable”
regions on the response surface
•
Identify parameters which may be
optimized
to achieve desired clinical outcome in a greater percentage of patients.
•
Identify sources of variability and evaluate their potential effect on “promising”
candidate(s)
Evaluate and further refine the prototype(s) likely to be ofclinical benefit in a “suitable”
PK study.

25
Example 2: Incorporating “variability”
to optimize
IVIVC modeling
Objective:
Develop an IVIVC model that provides predictions with probabilities
Approach:
Uncertainty related to model and data were incorporated by Bayesian approach, enabling prediction of plasma concentrations with probability distributions.
H. Kortejärvi, J. Malkki, M. Marvola, A. Urtti, M. Yliperttula, P. Pajunen, J. Pharm. Sci. 95, #7, pages 1595-1605, 2006

26
Observed mean ±SEM
Predicted 95%posterior probability interval
Solid line representing concentrations derived from parameters with highest probability (MAP)
Results

27
Parameter distributions predicted with dissolution data and posterior distribution of
model PK parameters

28
Parameter distributions predicted with dissolution data and posterior distribution of
model PK parameters
29
Highlights of Example 2
•
Incorporates variability
and predicts concentration-time profiles and PK parameters as probability distributions
•
Builds uncertainty into the IVIVC model•
Provides an information rich IVIVC
assessment with a likely range of in vivo data/parameters

30
Example 3: in silico
Modeling And Simulation
Goal: To determine optimal in vivo delivery rate for efficacyApproach: –
Used receptor occupancy (RO) data from PET studies, EC50 estimates from in vitro binding studies
–
Feedback control to identify the optimal in vivo delivery rate (from same class compounds)
–
Explored inter-individual variability ranging from 10% to 30% on absorption, disposition and potency
R. Gomeni, C. D’Angeli, and A. Bye. “In Silico Prediction of Optimal in Vivo Delivery Properties Using Convolution-Based Model and Clinical Trial Simulation”
Pharm. Res. Vol. 19 (1), 99 -103, 2002.

31
Simulation of in vivo delivery: Based on Weibull
model and adaptive feedback control algorithm as a function of the targeted therapeutic window.
Where td: time for delivery of 63.2% of dose, and β: shape factor
RO 50–100%, td 3.75, β
0.53 (∆); RO 50–100%, td 8.08, β
0.56 (○); RO 70–100%, td 14.6, β
0.76 (□) and RO 80%-100%, td 20.3, β
1.08 (►).

32
RO estimated with the adjusted in vivo delivery parameters and a therapeutic window (based on RO) ranging from 70% to 100%.
Prediction:Time–course of the individual (n=100) RO values after administration of 30-mg oral dose, once a day for a week

33
•
Utilized predictive mathematical modeling to assess the relationship between the in vitro dissolution/release and in vivo response time course
•
Explored the relationship between “desired” clinical outcome, and in vitro dissolution/release
characteristics in the presence of uncertainty from multiple sources.
Highlights of Example 3
34
Summary and What’s Ahead?
•
Effective integration of QbD
and biopharmaceutics is leading to innovative approaches linking the product/process knowledge and understanding to patient benefit.
•
We are poised for advances in application of IVIVC/R for patient benefit using current/advanced/borrowed tools and need to continue exploring possibilities.
•
Collaboration and innovation will define our path for moving forward to science and risk-based balanced approaches for ensuring patient health benefit.
35
Acknowledgements
•
Moheb Nasr, Ph.D.•
Office of New Drug Quality Assessment


![18 Journal of Applied Biopharmaceutics and ... by the HURIP Independent ethics Committee, Kolkata, India [9, 10]. 20 Journal of Applied Biopharmaceutics and Pharmacokinetics, 2015,](https://img.dokumen.tips/doc/110x75/5cd6ddac88c993dc268b8780/18-journal-of-applied-biopharmaceutics-and-by-the-hurip-independent-ethics-committee.jpg)


![BIOPHARMACEUTICS lecture 2[1]](https://img.dokumen.tips/doc/110x75/551c4bf74979590c568b462e/biopharmaceutics-lecture-21.jpg)