Embed Size (px)
Citation preview

WSJC
VVTSVTBB
WBKK
WABB
ZISA
VYTFVVVV
500
500
500
450
H540
500
500
500
500
450
H540

Contents
Qantas Annual Report 2016
Our Performance in 2015/16 02
Our Financial Framework 03
Chairman’s Report 04
CEO’s Report 06
Board of Directors 08
Review of Operations 12
Corporate Governance Statement 24
Directors’ Report 26
Financial Report 51
Shareholder Information 103
Financial Calendar and Additional Information 104
The Qantas Transformation program has reshaped the Qantas
Group, delivered record results and unlocked shareholder value. From
this position of strength, and with our people more engaged than ever, we’re
looking ahead to a new phase of innovation and growth.
With world demand for air travel set to double over the next 20 years,
Qantas and Jetstar have the ability to lead the aviation industry at a time of
unprecedented global change.
01
Q A N T A S A N N U A L R E P O R T 2 0 1 6
Qantas Domestic
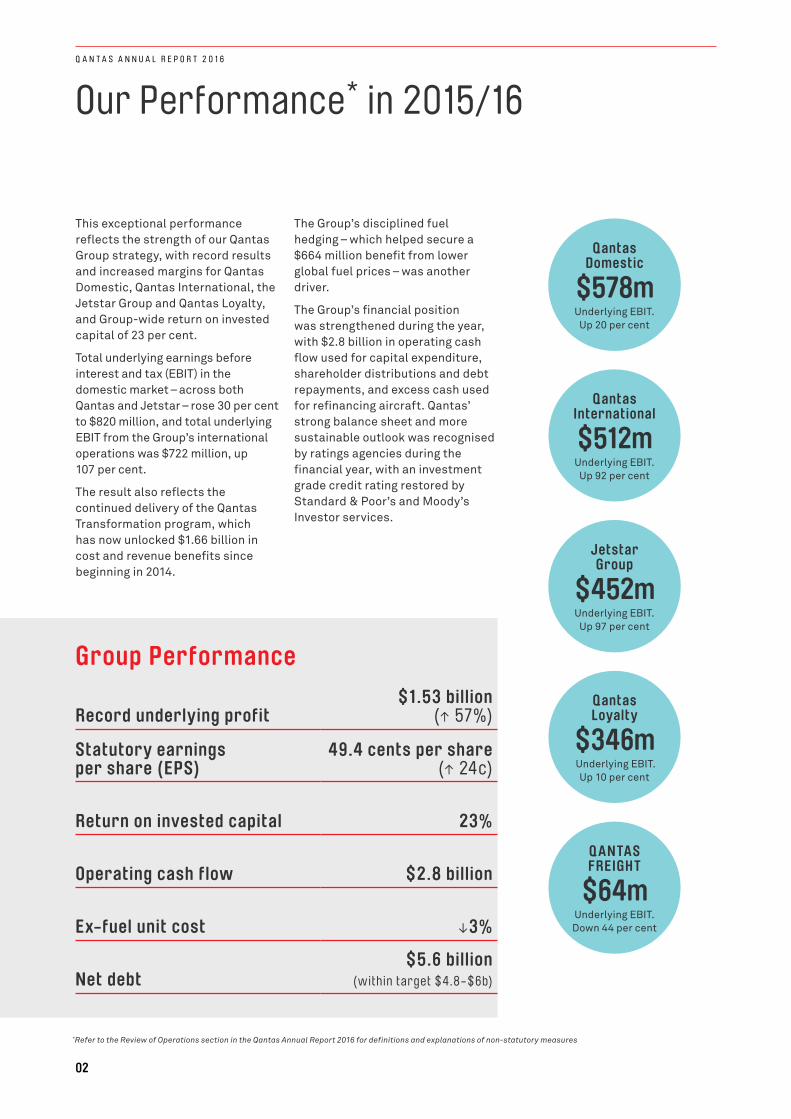
$578mUnderlying EBIT.
Up 20 per cent
Qantas International
$512mUnderlying EBIT.
Up 92 per cent
Qantas Loyalty
$346m Underlying EBIT.
Up 10 per cent
Jetstar Group
$452mUnderlying EBIT.
Up 97 per cent
Q ANTAS FREIGHT
$64mUnderlying EBIT. Down 44 per cent
Record underlying profit$1.53 billion
(� 57%)
Statutory earnings per share (EPS)
49.4 cents per share (� 24c)
Return on invested capital 23%
Operating cash flow $2.8 billion
Ex-fuel unit cost �3%
Net debt$5.6 billion
(within target $4.8-$6b)
Our Performance* in 2015/16
This exceptional performance reflects the strength of our Qantas Group strategy, with record results and increased margins for Qantas Domestic, Qantas International, the Jetstar Group and Qantas Loyalty, and Group-wide return on invested capital of 23 per cent.
Total underlying earnings before interest and tax (EBIT) in the domestic market – across both Qantas and Jetstar – rose 30 per cent to $820 million, and total underlying EBIT from the Group’s international operations was $722 million, up 107 per cent.
The result also reflects the continued delivery of the Qantas Transformation program, which has now unlocked $1.66 billion in cost and revenue benefits since beginning in 2014.
The Group’s disciplined fuel hedging – which helped secure a $664 million benefit from lower global fuel prices – was another driver.
The Group’s financial position was strengthened during the year, with $2.8 billion in operating cash flow used for capital expenditure, shareholder distributions and debt repayments, and excess cash used for refinancing aircraft. Qantas’ strong balance sheet and more sustainable outlook was recognised by ratings agencies during the financial year, with an investment grade credit rating restored by Standard & Poor’s and Moody’s Investor services.
Group Performance
*Refer to the Review of Operations section in the Qantas Annual Report 2016 for definitions and explanations of non-statutory measures
02
Q A N T A S A N N U A L R E P O R T 2 0 1 6
Our Financial Framework*
Qantas’ Financial Framework guides how we create value for our shareholders. Our overarching goal is to achieve maintainable earnings-per-share growth through the cycle, and in turn deliver total shareholder returns in the top quartile of global airlines and the ASX100.
The three core pillars of the framework are consistent:
> Maintaining an optimal capital structure that minimises the Group’s cost of capital;
> Achieving return on invested capital (ROIC) above 10 per cent through the cycle; and
> Growing invested capital with disciplined investment; returning any surplus to shareholders.
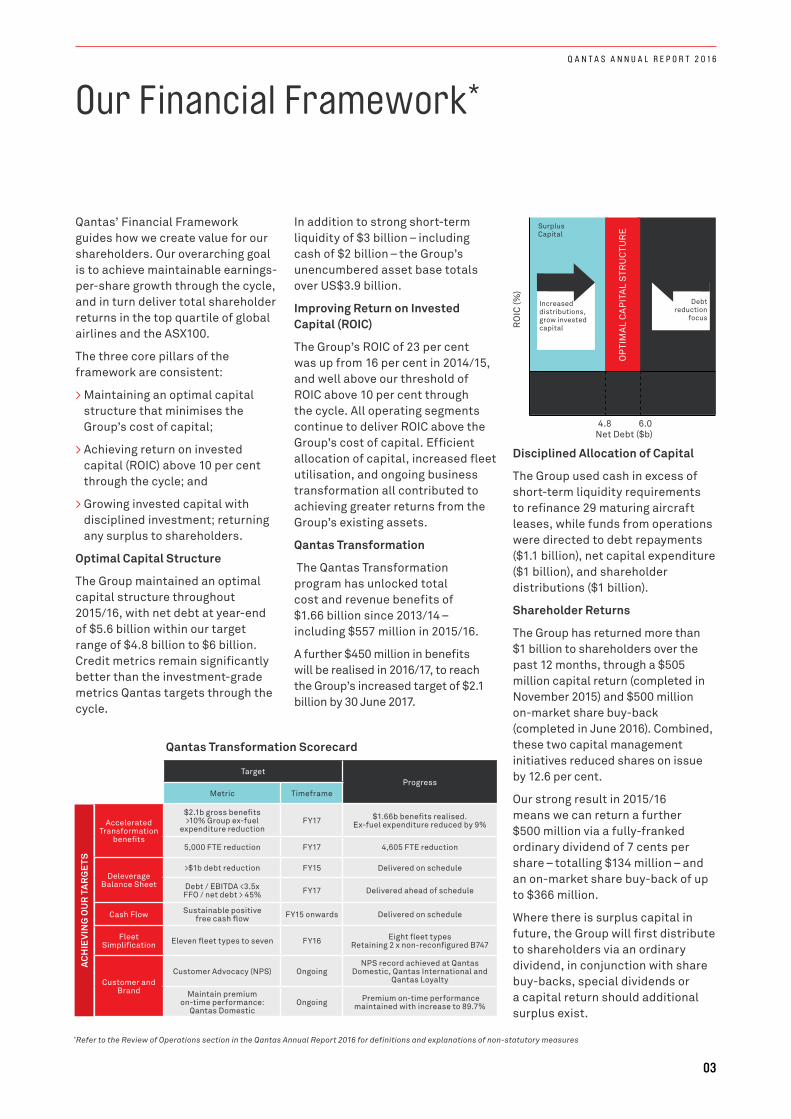
Optimal Capital Structure
The Group maintained an optimal capital structure throughout 2015/16, with net debt at year-end of $5.6 billion within our target range of $4.8 billion to $6 billion. Credit metrics remain significantly better than the investment-grade metrics Qantas targets through the cycle.
In addition to strong short-term liquidity of $3 billion – including cash of $2 billion – the Group’s unencumbered asset base totals over US$3.9 billion.
Improving Return on Invested Capital (ROIC)
The Group’s ROIC of 23 per cent was up from 16 per cent in 2014/15, and well above our threshold of ROIC above 10 per cent through the cycle. All operating segments continue to deliver ROIC above the Group’s cost of capital. Efficient allocation of capital, increased fleet utilisation, and ongoing business transformation all contributed to achieving greater returns from the Group’s existing assets.
Qantas Transformation
The Qantas Transformation program has unlocked total cost and revenue benefits of $1.66 billion since 2013/14 – including $557 million in 2015/16.
A further $450 million in benefits will be realised in 2016/17, to reach the Group’s increased target of $2.1 billion by 30 June 2017.
Disciplined Allocation of Capital
The Group used cash in excess of short-term liquidity requirements to refinance 29 maturing aircraft leases, while funds from operations were directed to debt repayments ($1.1 billion), net capital expenditure ($1 billion), and shareholder distributions ($1 billion).
Shareholder Returns
The Group has returned more than $1 billion to shareholders over the past 12 months, through a $505 million capital return (completed in November 2015) and $500 million on-market share buy-back (completed in June 2016). Combined, these two capital management initiatives reduced shares on issue by 12.6 per cent.
Our strong result in 2015/16 means we can return a further $500 million via a fully-franked ordinary dividend of 7 cents per share – totalling $134 million – and an on-market share buy-back of up to $366 million.
Where there is surplus capital in future, the Group will first distribute to shareholders via an ordinary dividend, in conjunction with share buy-backs, special dividends or a capital return should additional surplus exist.
TargetProgress
Metric Timeframe
Accelerated Transformation
benefits
$2.1b gross benefits>10% Group ex-fuel
expenditure reduction FY17 $1.66b benefits realised.
Ex-fuel expenditure reduced by 9%
5,000 FTE reduction FY17 4,605 FTE reduction
Deleverage Balance Sheet
>$1b debt reduction FY15 Delivered on schedule
Debt / EBITDA <3.5x FFO / net debt > 45% FY17 Delivered ahead of schedule
Cash Flow Sustainable positive free cash flow FY15 onwards Delivered on schedule
Fleet Simplification Eleven fleet types to seven FY16 Eight fleet types
Retaining 2 x non-reconfigured B747
Customer and Brand
Customer Advocacy (NPS) OngoingNPS record achieved at Qantas
Domestic, Qantas International and Qantas Loyalty
Maintain premium on-time performance:
Qantas DomesticOngoing Premium on-time performance
maintained with increase to 89.7%
Qantas Transformation Scorecard
AC
HIE
VIN
G O
UR
TA
RG
ETS
*Refer to the Review of Operations section in the Qantas Annual Report 2016 for definitions and explanations of non-statutory measures
OP
TIM
AL
CA
PIT
AL
STR
UC
TUR
E
Surplus Capital
No Surplus Capital
Increased distributions, grow invested capital
Debt reduction
focus
4.8 6.0
10% ROIC
RO
IC (%
)
Net Debt ($b)
03
Q A N T A S A N N U A L R E P O R T 2 0 1 6
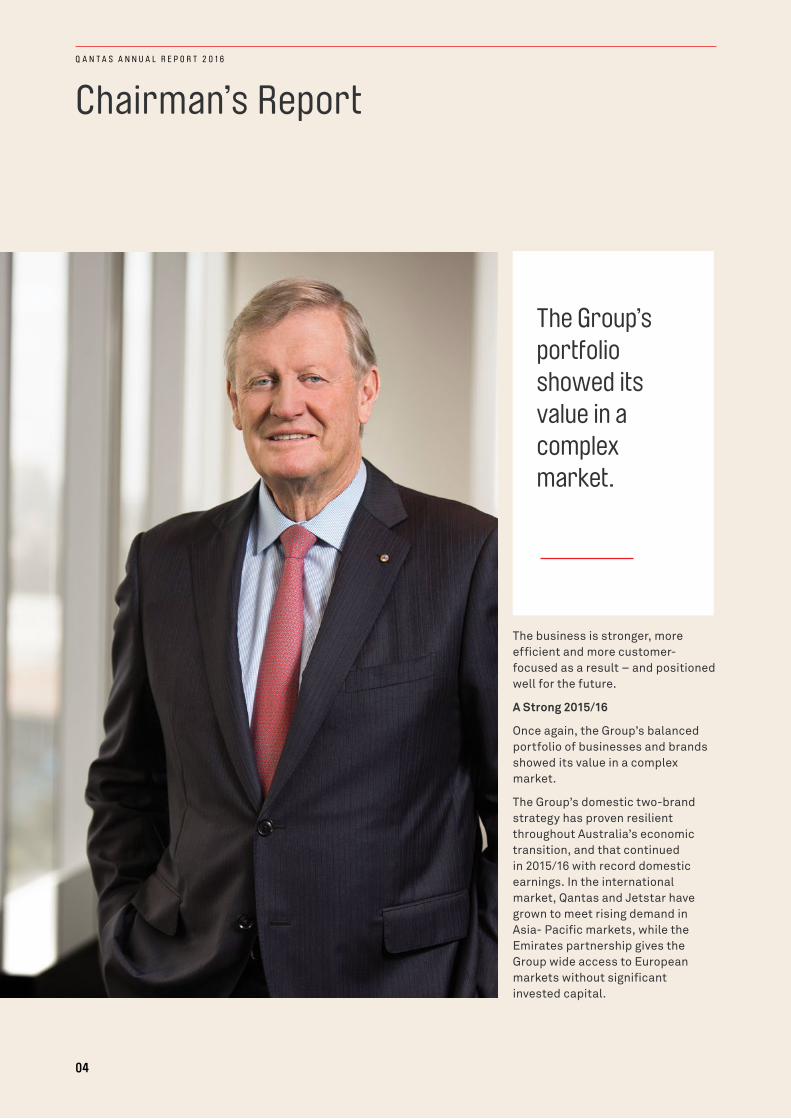
Chairman’s Report
The business is stronger, more efficient and more customer-focused as a result – and positioned well for the future.
A Strong 2015/16
Once again, the Group’s balanced portfolio of businesses and brands showed its value in a complex market.
The Group’s domestic two-brand strategy has proven resilient throughout Australia’s economic transition, and that continued in 2015/16 with record domestic earnings. In the international market, Qantas and Jetstar have grown to meet rising demand in Asia- Pacific markets, while the Emirates partnership gives the Group wide access to European markets without significant invested capital.
The Group’s portfolio showed its value in a complex market.
04
Q A N T A S A N N U A L R E P O R T 2 0 1 6
Disciplined investment in product and service continues to secure record levels of satisfaction from customers, and the Qantas Loyalty business is increasingly a source of new ventures and diversified revenue streams.
Productivity and financial discipline underpin everything the Group does. This was recognised by Moody’s Investor Services, as well as Standard and Poor’s, when they restored our investment grade credit rating.
Shareholder Value
The Group has increased net free cash flow, grown return on invested capital and further strengthened its balance sheet, remaining in an optimal capital position throughout 2015/16.
I’m especially pleased that we have been able to return more than $1 billion in cash to shareholders over the past 12 months. Over the same period, earnings per share have almost doubled to reach 49 cents.
Shareholder returns will continue in 2016/17 with Qantas’ first ordinary dividend since 2009, and a further on-market share buy-back. Ordinary dividends will be our first choice for future capital management initiatives, in conjunction with other options including buy-backs, special dividends and capital returns, as appropriate.
Economic Conditions
Consumer confidence and travel demand softened in the domestic market through the middle of 2016.
However, Australia’s economic fundamentals are strong and demand in non-mining sectors is solid; the resurgence of inbound tourism with the lower Australian dollar has been particularly welcome.
Internationally, growth in our key Asia-Pacific trading partners is healthy, and Asia will be an engine room of air travel demand and Qantas Group growth for decades to come.
The UK Brexit decision had little direct impact on the Group, but did create short-term volatility in global markets, as other geopolitical events have done over recent years. This underlines the importance of the Group’s focus on cost control and diversifying revenue.
Global Forces
Looking to the long term, it’s clear that global businesses are dealing with accelerating change in technology, geopolitics and demographics.
The Board believes Qantas’ ability to deliver sustainable growth over the long term rests on its ability to understand and navigate these global forces, incorporating them into strategic planning.
At the same time, the Board is focused on measuring progress against non-financial value drivers across environmental, social and governance issues.
The Qantas Annual Review sets out the Group’s approach to sustainability, its view of the global forces most relevant to the business, and its strategic priorities in responding to both the challenges and opportunities they present.
Board Update
I was pleased to welcome Michael L’Estrange AO to the Board as a Non-Executive Director in April this year. Michael was a senior public servant and diplomat with the Australian Government for more than 27 years, as well as holding academic posts and directorships. His experience in global affairs will be invaluable to the Board given the wide range of geopolitical issues influencing the Group.
Looking forward
The Group’s efforts in 2016/17 will be focused on continuing to advance its strategy and grow shareholder value. In doing so, Qantas will continue to drive trade and tourism, serve communities, support small business and champion Australia on the world stage – as only the national carrier can do.
As it moves towards 100 years of serving Australia, Qantas is in a position of strength. Again, I congratulate employees on a year of achievement and success.
Leigh Clifford AO
05
Q A N T A S A N N U A L R E P O R T 2 0 1 6
CEO’S REPORTCEO’s Report
Qantas’ record financial performance this past year is the continuation of a remarkable turnaround, built on the safety standards, operational excellence and customer satisfaction delivered by our people. That gives us the strongest possible foundations for the future.
It’s a performance that enabled us to announce a cash Record Result Bonus for non-executive employees, in recognition of their outstanding contribution, as well as rewards for our shareholders and the next phase of investment for our customers.
Group Performance
Every part of the Group contributed to our record result in 2015/16. Qantas Domestic, Qantas International, the Jetstar Group and Qantas Loyalty all reported record underlying EBIT and increased their operating margins.
Two-thirds of our earnings now come from our domestic and loyalty businesses, and one-third from our international operations, underlining the diversification and reduced volatility the portfolio strategy gives us through economic cycles.
The Group continues to meet both the short-term and long-term goals of our Financial Framework, which shapes the way we think about creating value for shareholders.
Role of Transformation
The biggest single driver of our performance is the $1.66 billion in cost and revenue benefits that we’ve unlocked through the Qantas Transformation program. With the program now entering its final year, we expect that to increase to $2.1 billion by June 2017.
Transformation is making Qantas’ cost base competitive. Just as importantly, it’s changed the way we work. We’re a far more agile company. We’ve accelerated our adoption of new technology, digital platforms and data analytics. And we’ve fostered a culture that encourages diversity, inclusion and innovation.
Qantas is a very different company from just a few years ago. Together with our well-balanced Group strategy, transformation means we’re resilient enough to perform in all market conditions and outperform many of our peers.
But of course, our environment isn’t going to stop evolving. We need to keep controlling our costs and being open to new ways of doing business.
Long-Term Sustainable Future
The ultimate goal of our transformation is to secure the sustainability of the Group.
We’re well on the way to doing that. But it’s not just about the actions we take in the short-term. We also need to think about the long-term – something that Qantas has done a great deal of over almost a century.
When we scan our environment, we see four global forces that are relevant to the success of the Group today and will have an even bigger impact in years ahead:
> New centres of customer demand and geopolitical influence, especially Asia;
> Rapid digitalisation and the rise of big data;
> Shifting customer and workforce preferences; and
> The implications of resource constraints and climate change.
All these trends come with challenges, but they also bring new opportunities for our business.
Clear Strategic Priorities
Preparing to take advantage of the big, global trends shaping aviation means continuing to deliver against our clear strategic priorities:
> Putting safety and security first at all times;
> Maximising the competitive advantages of the Group by aiming to be the best in every market we serve;
> Continuing to invest for our customers and strengthening our brands, including renewing our fleet, lounges, infrastructure and technology;
> Focusing on our people, culture and leadership, because our skilled, engaged workforce is the key to our success in everything we do; and
> Acting responsibly on energy, emissions and our supply chain, so that we reduce the costs and emissions of the fuel we burn, and play a positive role in the communities that support us.
We’re committed to advancing these priorities in 2016/17.
06
Q A N T A S A N N U A L R E P O R T 2 0 1 6
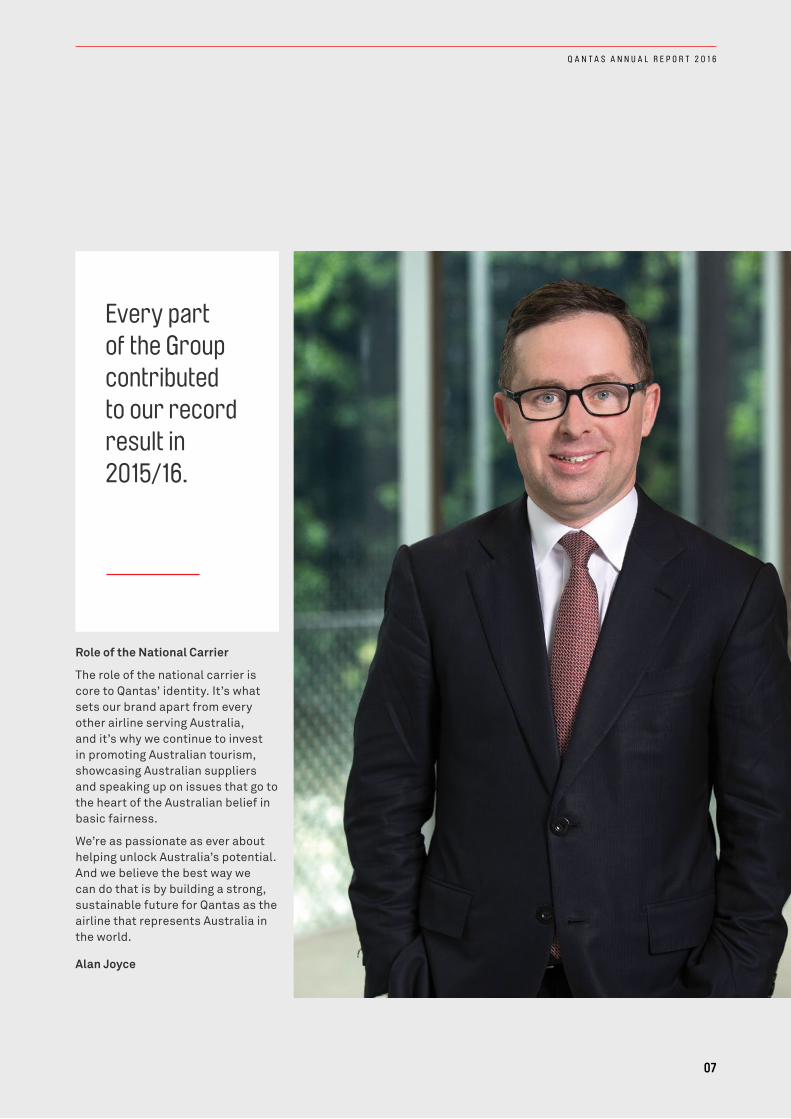
Every part of the Group contributed to our record result in 2015/16.
Role of the National Carrier
The role of the national carrier is core to Qantas’ identity. It’s what sets our brand apart from every other airline serving Australia, and it’s why we continue to invest in promoting Australian tourism, showcasing Australian suppliers and speaking up on issues that go to the heart of the Australian belief in basic fairness.
We’re as passionate as ever about helping unlock Australia’s potential. And we believe the best way we can do that is by building a strong, sustainable future for Qantas as the airline that represents Australia in the world.
Alan Joyce
07
Q A N T A S A N N U A L R E P O R T 2 0 1 6
Board of DirectorsFor the year ended 30 June 2016
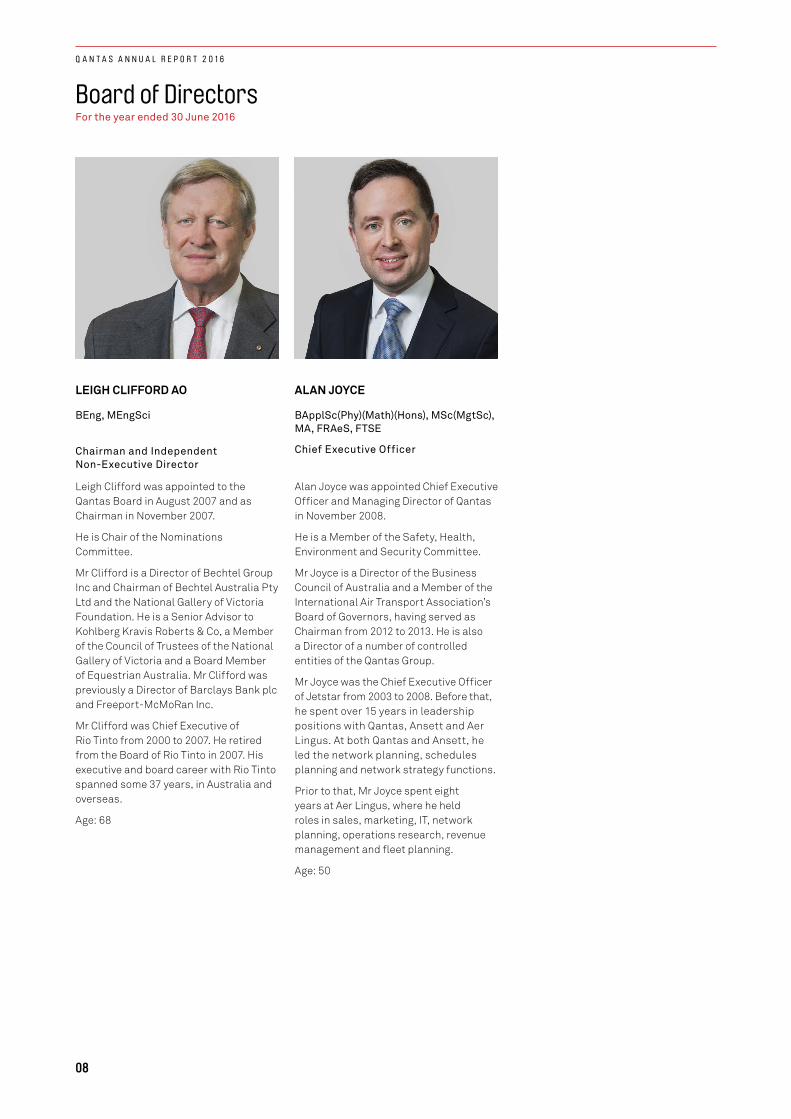
LEIGH CLIFFORD AO
BEng, MEngSci
Chairman and Independent Non-Executive Director
Leigh Clifford was appointed to the Qantas Board in August 2007 and as Chairman in November 2007.
He is Chair of the Nominations Committee.
Mr Clifford is a Director of Bechtel Group Inc and Chairman of Bechtel Australia Pty Ltd and the National Gallery of Victoria Foundation. He is a Senior Advisor to Kohlberg Kravis Roberts & Co, a Member of the Council of Trustees of the National Gallery of Victoria and a Board Member of Equestrian Australia. Mr Clifford was previously a Director of Barclays Bank plc and Freeport-McMoRan Inc.
Mr Clifford was Chief Executive of Rio Tinto from 2000 to 2007. He retired from the Board of Rio Tinto in 2007. His executive and board career with Rio Tinto spanned some 37 years, in Australia and overseas.
Age: 68
ALAN JOYCE
BApplSc(Phy)(Math)(Hons), MSc(MgtSc), MA, FRAeS, FTSE
Chief Executive Officer
Alan Joyce was appointed Chief Executive Officer and Managing Director of Qantas in November 2008.
He is a Member of the Safety, Health, Environment and Security Committee.
Mr Joyce is a Director of the Business Council of Australia and a Member of the International Air Transport Association’s Board of Governors, having served as Chairman from 2012 to 2013. He is also a Director of a number of controlled entities of the Qantas Group.
Mr Joyce was the Chief Executive Officer of Jetstar from 2003 to 2008. Before that, he spent over 15 years in leadership positions with Qantas, Ansett and Aer Lingus. At both Qantas and Ansett, he led the network planning, schedules planning and network strategy functions.
Prior to that, Mr Joyce spent eight years at Aer Lingus, where he held roles in sales, marketing, IT, network planning, operations research, revenue management and fleet planning.
Age: 50
08
Q A N T A S A N N U A L R E P O R T 2 0 1 6
MAXINE BRENNER
BA, LLB
Independent Non-Executive Director
Maxine Brenner was appointed to the Qantas Board in August 2013.
She is a Member of the Remuneration Committee and the Audit Committee.
Ms Brenner is a Director of Origin Energy Limited, Orica Limited and Growthpoint Properties Australia Limited. She is a Member of the Council of the University of New South Wales.
Ms Brenner was formerly a Managing Director of Investment Banking at Investec Bank (Australia) Limited. She has extensive experience in corporate advisory work, particularly in relation to mergers and acquisitions, corporate restructures and general corporate activity. She also practised as a lawyer with Freehill Hollingdale & Page (now Herbert Smith Freehills) where she specialised in corporate work, and spent several years as a lecturer in the Faculty of Law at both the University of NSW and the University of Sydney.
Ms Brenner was the Deputy Chairman of the Federal Airports Corporation and a Director of Neverfail Springwater Limited, Bulmer Australia Limited and Treasury Corporation of NSW. She also served as a Member of the Australian Government’s Takeovers Panel.
Age: 54
RICHARD GOODMANSON
BCom, BEc, MBA, MCE
Independent Non-Executive Director
Richard Goodmanson was appointed to the Qantas Board in June 2008.
He is Chair of the Safety, Health, Environment and Security Committee and a Member of the Nominations Committee.
Mr Goodmanson was a Director of Rio Tinto plc and Rio Tinto Limited from 2004 to 2016.
From 1999 to 2009 he was Executive Vice President and Chief Operating Officer of E.I. du Pont de Nemours and Company. Previous to this role, he was President and Chief Executive Officer of America West Airlines. Mr Goodmanson was also Chief Operations Officer for Frito-Lay Inc, a subsidiary of PepsiCo and a Principal at McKinsey & Company Inc. He spent 10 years in heavy civil engineering project management, principally in South East Asia. Additionally, Mr Goodmanson was an Economic Adviser to the Governor of Guangdong Province, China from 2003 until 2009.
Mr Goodmanson was born in Australia and is a citizen of both Australia and the United States.
Age: 69
JACQUELINE HEY
BCom, Grad Cert (Mgmt), GAICD
Independent Non-Executive Director
Jacqueline Hey was appointed to the Qantas Board in August 2013.
She is a Member of the Audit Committee.
Ms Hey is a Director of Bendigo and Adelaide Bank Limited and is Chair of its Change & Technology Committee and is a Member of both its Credit and Governance and HR Committees. She is also a Director of AGL Energy Limited, the Australian Foundation Investment Company Limited, Melbourne Business School and Cricket Australia, and a Member of the ASIC Director Advisory Panel.
Ms Hey was also formerly a Director of the Special Broadcasting Service from 2011 to 2016.
Between 2004 and 2010, Ms Hey was Managing Director of various Ericsson entities in Australia and New Zealand, the United Kingdom and Ireland, and the Middle East. Her executive career with Ericsson spanned more than 20 years in which she held finance, marketing, sales and leadership roles.
Age: 50
Board of Directors continuedFor the year ended 30 June 2016
09
Q A N T A S A N N U A L R E P O R T 2 0 1 6

MICHAEL L’ESTRANGE AO
BA, MA (Oxon)
Independent Non-Executive Director
Michael L’Estrange was appointed to the Qantas Board in April 2016.
He is a Member of the Safety, Health, Environment and Security Committee.
Mr L’Estrange was Head of the National Security College at the Australian National University from 2009 to 2015. Prior to this, he was the Secretary of the Department of Foreign Affairs and Trade for almost five years and the Australian High Commissioner to the UK between 2000 and 2005. He served as Secretary to Cabinet and Head of the Cabinet Policy Unit from 1996 for more than four years and, prior to that, as Executive Director of the Menzies Research Centre.
He has been a Non-Executive Director of Rio Tinto plc and Rio Tinto Limited and a Director of the University of Notre Dame, Australia since 2014.
Mr L’Estrange studied at Sydney University and later as a Rhodes Scholar at Oxford University where he graduated as a Master of Arts with First Class Honours.
Age: 63
WILLIAM MEANEY
BSc, MEng, MSIA
Independent Non-Executive Director
William Meaney was appointed to the Qantas Board in February 2012.
He is a Member of the Safety, Health, Environment and Security Committee and the Remuneration Committee.
Mr Meaney is the President and Chief Executive Officer of Iron Mountain Inc. He is a Member of the Asia Business Council and also serves as Trustee of Carnegie Mellon University and Rensselaer Polytechnic Institute.
Mr Meaney was formerly the Chief Executive Officer of The Zuellig Group and a Director of moksha8 Pharmaceuticals Inc. He was also the Managing Director and Chief Commercial Officer of Swiss International Airlines and Executive Vice President of South African Airways responsible for sales, alliances and network management.
Prior to these roles, Mr Meaney spent 11 years providing strategic advisory services at Genhro Management Consultancy as the Founder and Managing Director, and as a Principal with Strategic Planning Associates. Mr Meaney holds United States, Swiss and Irish citizenships.
Age: 56
PAUL RAYNER
BEc, MAdmin, FAICD
Independent Non-Executive Director
Paul Rayner was appointed to the Qantas Board in July 2008.
He is Chair of the Remuneration Committee and a Member of the Nominations Committee.
Mr Rayner is Chairman of Treasury Wine Estates Limited, a Director of Boral Limited and Chairman of its Audit Committee, and a Director of the Murdoch Childrens Research Institute.
Mr Rayner was formerly a Director of Centrica plc from 2004 to 2014 and Chairman of its Audit Committee from 2004 to 2013. From 2002 to 2008, Mr Rayner was Finance Director of British American Tobacco plc based in London. Mr Rayner joined Rothmans Holdings Limited in 1991 as its Chief Financial Officer and held other senior executive positions within the Group, including Chief Operating Officer of British American Tobacco Australasia Limited from 1999 to 2001.
Previously, Mr Rayner worked for 17 years in various finance and project roles with General Electric, Rank Industries and the Elders IXL Group.
Age: 62
Board of Directors continuedFor the year ended 30 June 2016
10
Q A N T A S A N N U A L R E P O R T 2 0 1 6
TODD SAMPSON
MBA, BA(Hons)
Independent Non-Executive Director
Todd Sampson was appointed to the Qantas Board in February 2015.
He is a Member of the Remuneration Committee.
He has been the Executive Chairman of the Leo Burnett Group since September 2015, having been National Chief Executive Officer from 2008 to 2015 and also sits on the Board of Fairfax Media Limited.
Mr Sampson has close to 20 years’ experience across marketing, communication, new media and digital transformation. He has held senior leadership and strategy roles for a number of leading communication companies in Australia and overseas, including as Managing Partner for D’Arcy, Strategy Director for The Campaign Palace and Head of Strategy for DDB Needham Worldwide.
Age: 46
BARBARA WARD AM
BEc, MPolEc
Independent Non-Executive Director
Barbara Ward was appointed to the Qantas Board in June 2008.
She is Chair of the Audit Committee, a Member of the Safety, Health, Environment and Security Committee and a Member of the Nominations Committee.
Ms Ward is a Director of Caltex Australia Limited, a number of Brookfield Multiplex Group companies, and the Sydney Children’s Hospital Foundation.
She was formerly a Director of the Commonwealth Bank of Australia, Lion Nathan Limited, Brookfield Multiplex Limited, Data Advantage Limited, O’Connell Street Associates Pty Ltd, Allco Finance Group Limited, Rail Infrastructure Corporation, Delta Electricity, Ausgrid, Endeavour Energy and Essential Energy. She was also Chair of Country Energy and NorthPower and HWW Limited, a Board Member of Allens Arthur Robinson and the Sydney Opera House Trust and on the Advisory Board of LEK Consulting.
Ms Ward was Chief Executive Officer of Ansett Worldwide Aviation Services from 1993 to 1998. Before that, Ms Ward held various positions at TNT Limited, including General Manager Finance, and also served as a Senior Ministerial Advisor to The Hon PJ Keating.
Age: 62
Board of Directors continuedFor the year ended 30 June 2016
11
Q A N T A S A N N U A L R E P O R T 2 0 1 6
Review of OperationsFor the year ended 30 June 2016
RESULT HIGHLIGHTS
Underlying Profit Before Tax
1,532
$M
Statutory Profit After Tax
1,029
$M
FY16
FY15
FY14
FY13
FY12
FY16
FY15
FY14
FY13
FY12
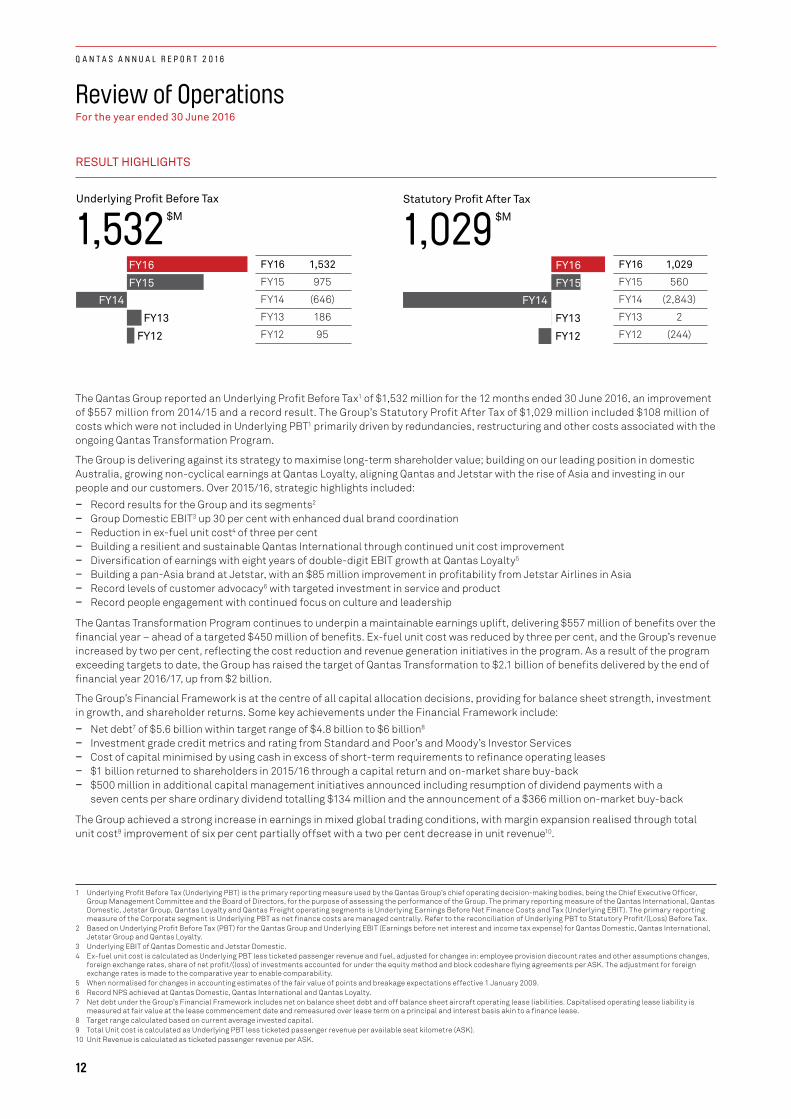
FY16 1,532
FY15 975
FY14 (646)
FY13 186
FY12 95
Underlying Profit Before Tax
1,532
$M
Statutory Profit After Tax
1,029
$M
FY16
FY15
FY14
FY13
FY12
FY16
FY15
FY14
FY13
FY12
FY16 1,029
FY15 560
FY14 (2,843)
FY13 2
FY12 (244)
The Qantas Group reported an Underlying Profit Before Tax1 of $1,532 million for the 12 months ended 30 June 2016, an improvement of $557 million from 2014/15 and a record result. The Group’s Statutory Profit After Tax of $1,029 million included $108 million of costs which were not included in Underlying PBT1 primarily driven by redundancies, restructuring and other costs associated with the ongoing Qantas Transformation Program.
The Group is delivering against its strategy to maximise long-term shareholder value; building on our leading position in domestic Australia, growing non-cyclical earnings at Qantas Loyalty, aligning Qantas and Jetstar with the rise of Asia and investing in our people and our customers. Over 2015/16, strategic highlights included:
– Record results for the Group and its segments2 – Group Domestic EBIT3 up 30 per cent with enhanced dual brand coordination – Reduction in ex-fuel unit cost4 of three per cent – Building a resilient and sustainable Qantas International through continued unit cost improvement – Diversification of earnings with eight years of double-digit EBIT growth at Qantas Loyalty5 – Building a pan-Asia brand at Jetstar, with an $85 million improvement in profitability from Jetstar Airlines in Asia – Record levels of customer advocacy6 with targeted investment in service and product – Record people engagement with continued focus on culture and leadership
The Qantas Transformation Program continues to underpin a maintainable earnings uplift, delivering $557 million of benefits over the financial year – ahead of a targeted $450 million of benefits. Ex-fuel unit cost was reduced by three per cent, and the Group’s revenue increased by two per cent, reflecting the cost reduction and revenue generation initiatives in the program. As a result of the program exceeding targets to date, the Group has raised the target of Qantas Transformation to $2.1 billion of benefits delivered by the end of financial year 2016/17, up from $2 billion.
The Group’s Financial Framework is at the centre of all capital allocation decisions, providing for balance sheet strength, investment in growth, and shareholder returns. Some key achievements under the Financial Framework include:
– Net debt7 of $5.6 billion within target range of $4.8 billion to $6 billion8 – Investment grade credit metrics and rating from Standard and Poor’s and Moody’s Investor Services – Cost of capital minimised by using cash in excess of short-term requirements to refinance operating leases – $1 billion returned to shareholders in 2015/16 through a capital return and on-market share buy-back – $500 million in additional capital management initiatives announced including resumption of dividend payments with a
seven cents per share ordinary dividend totalling $134 million and the announcement of a $366 million on-market buy-back
The Group achieved a strong increase in earnings in mixed global trading conditions, with margin expansion realised through total unit cost9 improvement of six per cent partially offset with a two per cent decrease in unit revenue10.
1 Underlying Profit Before Tax (Underlying PBT) is the primary reporting measure used by the Qantas Group’s chief operating decision-making bodies, being the Chief Executive Officer, Group Management Committee and the Board of Directors, for the purpose of assessing the performance of the Group. The primary reporting measure of the Qantas International, Qantas Domestic, Jetstar Group, Qantas Loyalty and Qantas Freight operating segments is Underlying Earnings Before Net Finance Costs and Tax (Underlying EBIT). The primary reporting measure of the Corporate segment is Underlying PBT as net finance costs are managed centrally. Refer to the reconciliation of Underlying PBT to Statutory Profit/(Loss) Before Tax.
2 Based on Underlying Profit Before Tax (PBT) for the Qantas Group and Underlying EBIT (Earnings before net interest and income tax expense) for Qantas Domestic, Qantas International, Jetstar Group and Qantas Loyalty.
3 Underlying EBIT of Qantas Domestic and Jetstar Domestic.4 Ex-fuel unit cost is calculated as Underlying PBT less ticketed passenger revenue and fuel, adjusted for changes in: employee provision discount rates and other assumptions changes,
foreign exchange rates, share of net profit/(loss) of investments accounted for under the equity method and block codeshare flying agreements per ASK. The adjustment for foreign exchange rates is made to the comparative year to enable comparability.
5 When normalised for changes in accounting estimates of the fair value of points and breakage expectations effective 1 January 2009.6 Record NPS achieved at Qantas Domestic, Qantas International and Qantas Loyalty.7 Net debt under the Group’s Financial Framework includes net on balance sheet debt and off balance sheet aircraft operating lease liabilities. Capitalised operating lease liability is
measured at fair value at the lease commencement date and remeasured over lease term on a principal and interest basis akin to a finance lease.8 Target range calculated based on current average invested capital.9 Total Unit cost is calculated as Underlying PBT less ticketed passenger revenue per available seat kilometre (ASK).10 Unit Revenue is calculated as ticketed passenger revenue per ASK.
12
Q A N T A S A N N U A L R E P O R T 2 0 1 6
Domestic Australia experienced a stable operating environment in non-resources sectors: – Lower AUD and increased inbound visitor arrivals supporting domestic traffic growth – Resource related traffic and revenue down compared to 2014/15 – Fourth quarter 2015/16 general demand weakness
The Group’s international operating environment was more competitive, with competitor capacity growth and sharper pricing activity seen on key routes:
– Increased industry capacity growth on the back of higher operating margins – Industry-wide pricing activity passing on a portion of fuel benefit – Geopolitical uncertainty impacting northern hemisphere travel – Qantas and Jetstar capacity growth focused on higher demand markets in Asia
FINANCIAL FRAMEWORK ALIGNED WITH SHAREHOLDER OBJECTIVES
Qantas’ Financial Framework aligns our objectives with those of our shareholders. With the aim of generating maintainable Earnings per share growth over the cycle, which in turn should translate into Total Shareholder Returns (TSR) in the top quartile of the ASX100 and a basket of global airlines11, the Financial Framework has three clear priorities and associated long-term targets:
MAINTAINABLE EPS13 GROWTH OVER THE CYCLE
TOTAL SHAREHOLDER RETURNS IN THE TOP QUARTILE
1. Maintaining an Optimal Capital Structure
2. ROIC > WACC12 Through the Cycle 3. Disciplined Allocation of Capital
Minimise cost of capital by targeting a net debt range of $4.8 billion to $6 billion
Deliver ROIC > 10 per cent through the cycle
Grow Invested Capital with disciplined investment, return surplus capital
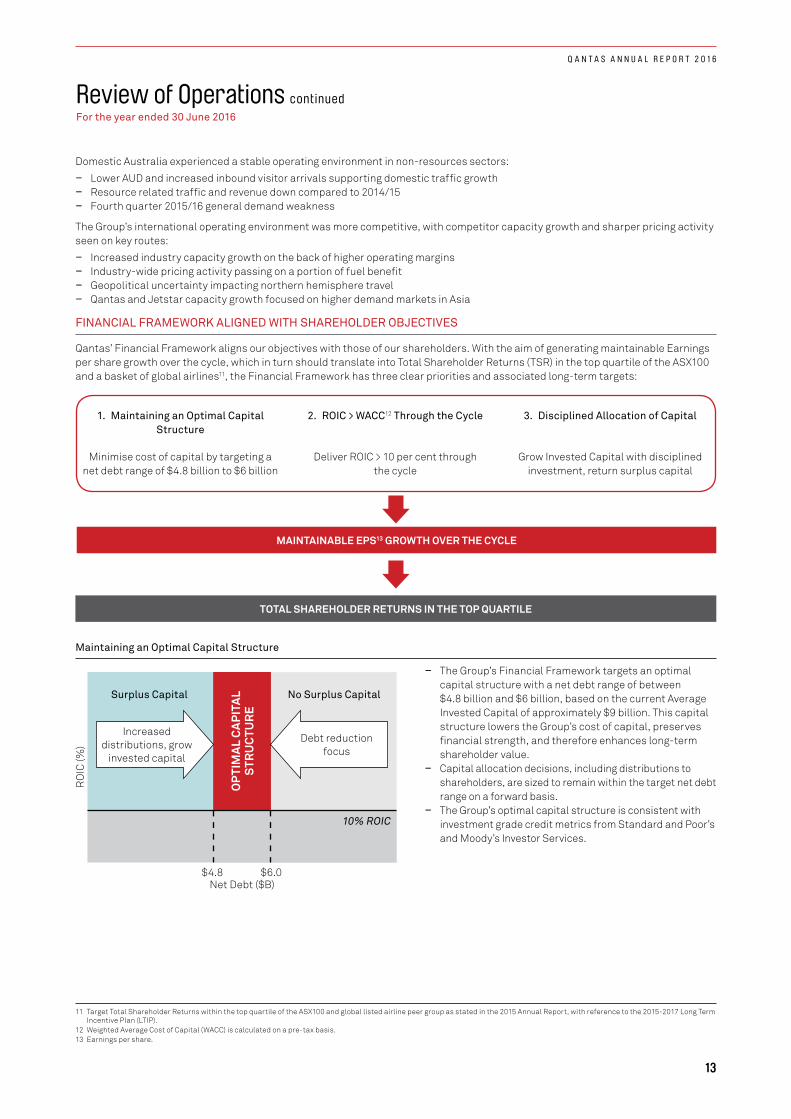
Maintaining an Optimal Capital Structure
Surplus Capital No Surplus Capital
OP
TIM
AL
CAPI
TAL
STR
UC
TUR
E
Debt reduction focus
Increased distributions, grow
invested capital
10% ROIC
Net Debt ($B)$4.8 $6.0
RO
IC (%
)
– The Group’s Financial Framework targets an optimal capital structure with a net debt range of between $4.8 billion and $6 billion, based on the current Average Invested Capital of approximately $9 billion. This capital structure lowers the Group’s cost of capital, preserves financial strength, and therefore enhances long-term shareholder value.
– Capital allocation decisions, including distributions to shareholders, are sized to remain within the target net debt range on a forward basis.
– The Group’s optimal capital structure is consistent with investment grade credit metrics from Standard and Poor’s and Moody’s Investor Services.
11 Target Total Shareholder Returns within the top quartile of the ASX100 and global listed airline peer group as stated in the 2015 Annual Report, with reference to the 2015-2017 Long Term Incentive Plan (LTIP).
12 Weighted Average Cost of Capital (WACC) is calculated on a pre-tax basis.13 Earnings per share.
Review of Operations continuedFor the year ended 30 June 2016
13
Q A N T A S A N N U A L R E P O R T 2 0 1 6
Review of Operations continuedFor the year ended 30 June 2016
ROIC > WACC Through the Cycle
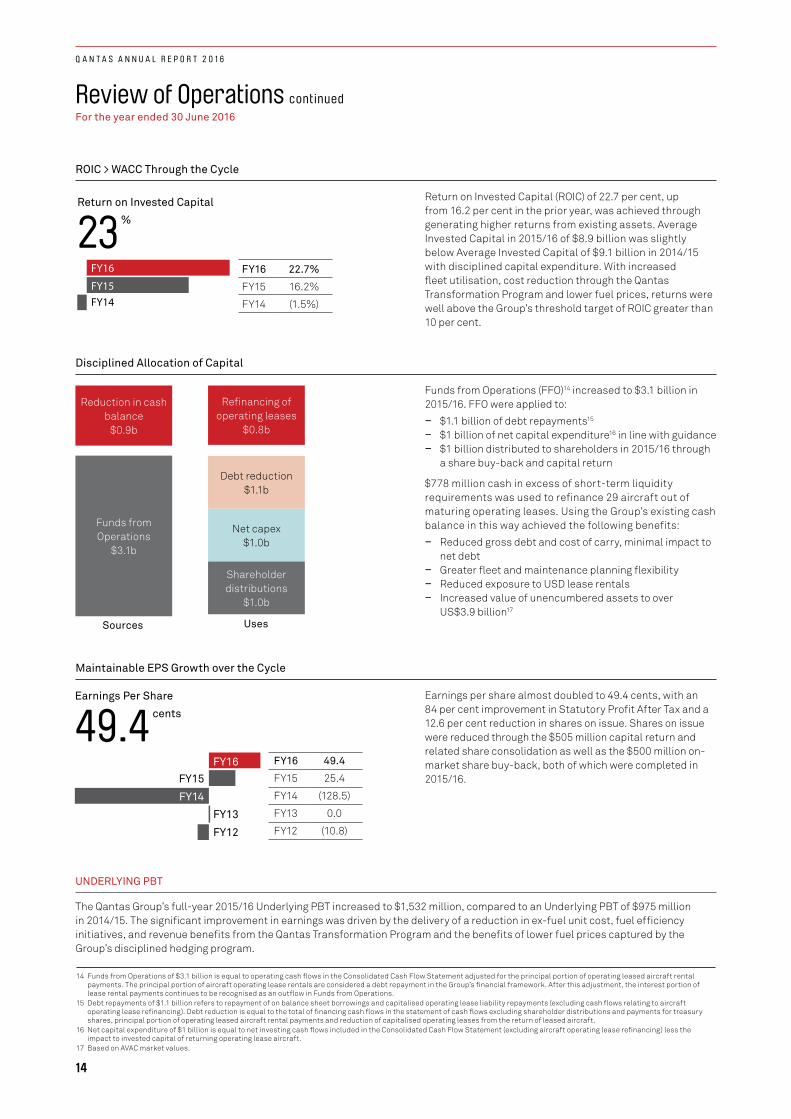
Return on Invested Capital (ROIC) of 22.7 per cent, up from 16.2 per cent in the prior year, was achieved through generating higher returns from existing assets. Average Invested Capital in 2015/16 of $8.9 billion was slightly below Average Invested Capital of $9.1 billion in 2014/15 with disciplined capital expenditure. With increased fleet utilisation, cost reduction through the Qantas Transformation Program and lower fuel prices, returns were well above the Group’s threshold target of ROIC greater than 10 per cent.
Disciplined Allocation of Capital
Funds from Operations
$3.1b
Debt reduction$1.1b
Net capex$1.0b
Shareholder distributions
$1.0b
Reduction in cash balance
$0.9b
Refinancing of operating leases
$0.8b
Sources Uses
Funds from Operations (FFO)14 increased to $3.1 billion in 2015/16. FFO were applied to:
– $1.1 billion of debt repayments15
– $1 billion of net capital expenditure16 in line with guidance – $1 billion distributed to shareholders in 2015/16 through
a share buy-back and capital return
$778 million cash in excess of short-term liquidity requirements was used to refinance 29 aircraft out of maturing operating leases. Using the Group’s existing cash balance in this way achieved the following benefits:
– Reduced gross debt and cost of carry, minimal impact to net debt
– Greater fleet and maintenance planning flexibility – Reduced exposure to USD lease rentals – Increased value of unencumbered assets to over
US$3.9 billion17
Maintainable EPS Growth over the Cycle
Earnings per share almost doubled to 49.4 cents, with an 84 per cent improvement in Statutory Profit After Tax and a 12.6 per cent reduction in shares on issue. Shares on issue were reduced through the $505 million capital return and related share consolidation as well as the $500 million on-market share buy-back, both of which were completed in 2015/16.
UNDERLYING PBT
The Qantas Group’s full-year 2015/16 Underlying PBT increased to $1,532 million, compared to an Underlying PBT of $975 million in 2014/15. The significant improvement in earnings was driven by the delivery of a reduction in ex-fuel unit cost, fuel efficiency initiatives, and revenue benefits from the Qantas Transformation Program and the benefits of lower fuel prices captured by the Group’s disciplined hedging program.
FY16
FY15FY14
Return on Invested Capital
23
%
FY16 22.7%
FY15 16.2%
FY14 (1.5%)
FY16FY15
FY14
FY13
FY12
Earnings Per Share
49.4
cents
FY16 49.4
FY15 25.4
FY14 (128.5)
FY13 0.0
FY12 (10.8)
14 Funds from Operations of $3.1 billion is equal to operating cash flows in the Consolidated Cash Flow Statement adjusted for the principal portion of operating leased aircraft rental payments. The principal portion of aircraft operating lease rentals are considered a debt repayment in the Group’s financial framework. After this adjustment, the interest portion of lease rental payments continues to be recognised as an outflow in Funds from Operations.
15 Debt repayments of $1.1 billion refers to repayment of on balance sheet borrowings and capitalised operating lease liability repayments (excluding cash flows relating to aircraft operating lease refinancing). Debt reduction is equal to the total of financing cash flows in the statement of cash flows excluding shareholder distributions and payments for treasury shares, principal portion of operating leased aircraft rental payments and reduction of capitalised operating leases from the return of leased aircraft.
16 Net capital expenditure of $1 billion is equal to net investing cash flows included in the Consolidated Cash Flow Statement (excluding aircraft operating lease refinancing) less the impact to invested capital of returning operating lease aircraft.
17 Based on AVAC market values.
14
Q A N T A S A N N U A L R E P O R T 2 0 1 6
Review of Operations continuedFor the year ended 30 June 2016
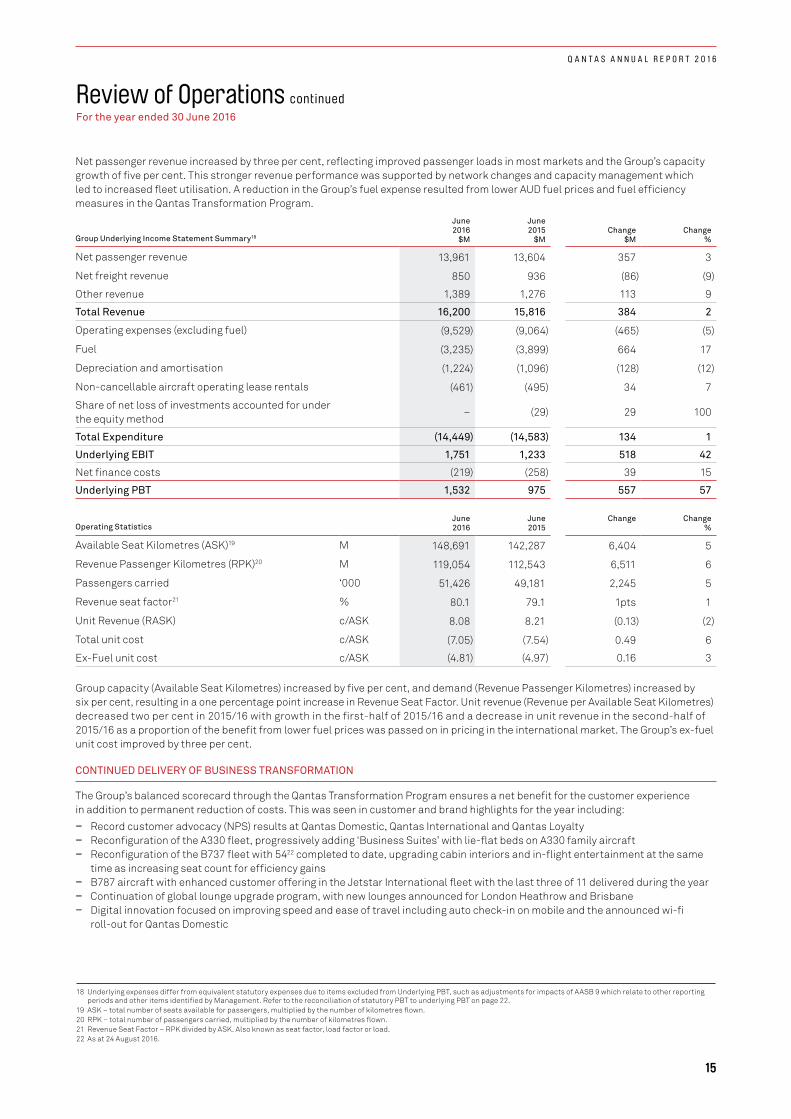
Net passenger revenue increased by three per cent, reflecting improved passenger loads in most markets and the Group’s capacity growth of five per cent. This stronger revenue performance was supported by network changes and capacity management which led to increased fleet utilisation. A reduction in the Group’s fuel expense resulted from lower AUD fuel prices and fuel efficiency measures in the Qantas Transformation Program.
Group Underlying Income Statement Summary18
June 2016
$M
June 2015
$MChange
$MChange
%
Net passenger revenue 13,961 13,604 357 3
Net freight revenue 850 936 (86) (9)
Other revenue 1,389 1,276 113 9
Total Revenue 16,200 15,816 384 2
Operating expenses (excluding fuel) (9,529) (9,064) (465) (5)
Fuel (3,235) (3,899) 664 17
Depreciation and amortisation (1,224) (1,096) (128) (12)
Non-cancellable aircraft operating lease rentals (461) (495) 34 7
Share of net loss of investments accounted for under the equity method
– (29) 29 100
Total Expenditure (14,449) (14,583) 134 1
Underlying EBIT 1,751 1,233 518 42
Net finance costs (219) (258) 39 15
Underlying PBT 1,532 975 557 57
Operating StatisticsJune 2016
June 2015
Change Change %
Available Seat Kilometres (ASK)19 M 148,691 142,287 6,404 5
Revenue Passenger Kilometres (RPK)20 M 119,054 112,543 6,511 6
Passengers carried ‘000 51,426 49,181 2,245 5
Revenue seat factor21 % 80.1 79.1 1pts 1
Unit Revenue (RASK) c/ASK 8.08 8.21 (0.13) (2)
Total unit cost c/ASK (7.05) (7.54) 0.49 6
Ex-Fuel unit cost c/ASK (4.81) (4.97) 0.16 3
Group capacity (Available Seat Kilometres) increased by five per cent, and demand (Revenue Passenger Kilometres) increased by six per cent, resulting in a one percentage point increase in Revenue Seat Factor. Unit revenue (Revenue per Available Seat Kilometres) decreased two per cent in 2015/16 with growth in the first-half of 2015/16 and a decrease in unit revenue in the second-half of 2015/16 as a proportion of the benefit from lower fuel prices was passed on in pricing in the international market. The Group’s ex-fuel unit cost improved by three per cent.
CONTINUED DELIVERY OF BUSINESS TRANSFORMATION
The Group’s balanced scorecard through the Qantas Transformation Program ensures a net benefit for the customer experience in addition to permanent reduction of costs. This was seen in customer and brand highlights for the year including:
– Record customer advocacy (NPS) results at Qantas Domestic, Qantas International and Qantas Loyalty – Reconfiguration of the A330 fleet, progressively adding ‘Business Suites’ with lie-flat beds on A330 family aircraft – Reconfiguration of the B737 fleet with 5422 completed to date, upgrading cabin interiors and in-flight entertainment at the same
time as increasing seat count for efficiency gains – B787 aircraft with enhanced customer offering in the Jetstar International fleet with the last three of 11 delivered during the year – Continuation of global lounge upgrade program, with new lounges announced for London Heathrow and Brisbane – Digital innovation focused on improving speed and ease of travel including auto check-in on mobile and the announced wi-fi
roll-out for Qantas Domestic
18 Underlying expenses differ from equivalent statutory expenses due to items excluded from Underlying PBT, such as adjustments for impacts of AASB 9 which relate to other reporting periods and other items identified by Management. Refer to the reconciliation of statutory PBT to underlying PBT on page 22.
19 ASK – total number of seats available for passengers, multiplied by the number of kilometres flown.20 RPK – total number of passengers carried, multiplied by the number of kilometres flown.21 Revenue Seat Factor – RPK divided by ASK. Also known as seat factor, load factor or load.22 As at 24 August 2016.
15
Q A N T A S A N N U A L R E P O R T 2 0 1 6
Review of Operations continuedFor the year ended 30 June 2016
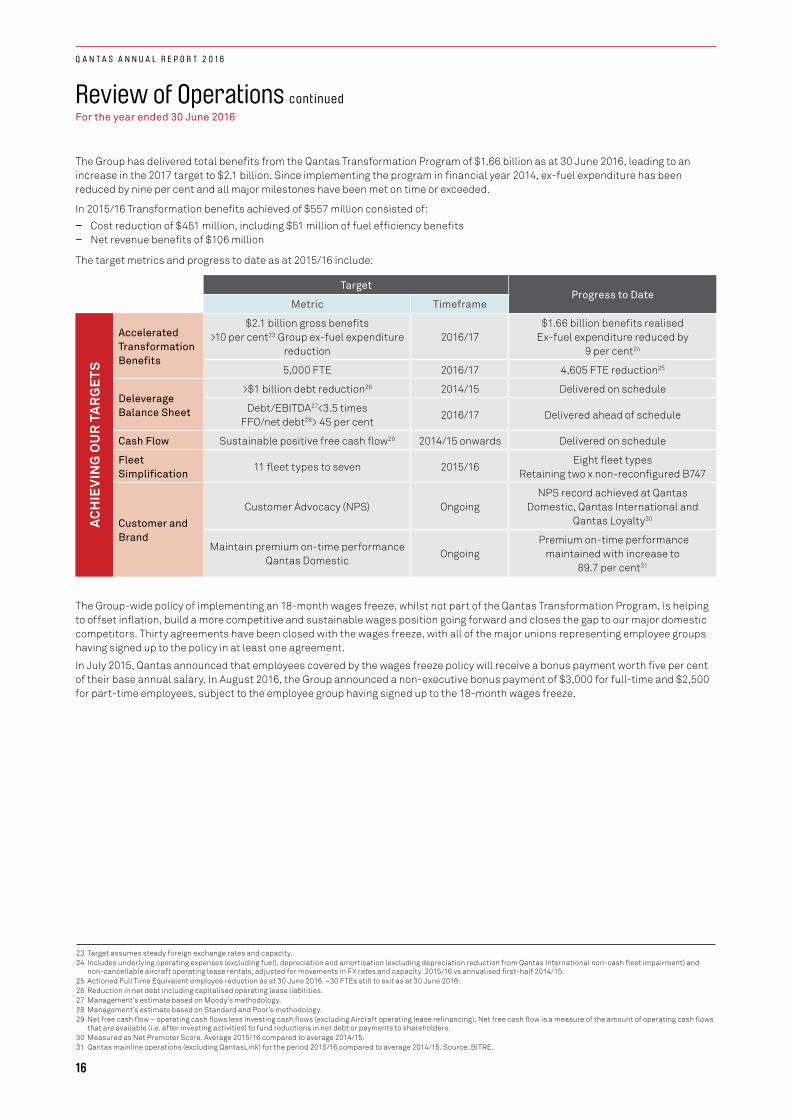
The Group has delivered total benefits from the Qantas Transformation Program of $1.66 billion as at 30 June 2016, leading to an increase in the 2017 target to $2.1 billion. Since implementing the program in financial year 2014, ex-fuel expenditure has been reduced by nine per cent and all major milestones have been met on time or exceeded.
In 2015/16 Transformation benefits achieved of $557 million consisted of: – Cost reduction of $451 million, including $51 million of fuel efficiency benefits – Net revenue benefits of $106 million
The target metrics and progress to date as at 2015/16 include:
TargetProgress to Date
Metric Timeframe
AC
HIE
VIN
G O
UR
TA
RG
ETS
Accelerated Transformation Benefits
$2.1 billion gross benefits >10 per cent23 Group ex-fuel expenditure
reduction2016/17
$1.66 billion benefits realised Ex-fuel expenditure reduced by
9 per cent24
5,000 FTE 2016/17 4,605 FTE reduction25
Deleverage Balance Sheet
>$1 billion debt reduction26 2014/15 Delivered on schedule
Debt/EBITDA27<3.5 times FFO/net debt28> 45 per cent
2016/17 Delivered ahead of schedule
Cash Flow Sustainable positive free cash flow29 2014/15 onwards Delivered on schedule
Fleet Simplification
11 fleet types to seven 2015/16Eight fleet types
Retaining two x non-reconfigured B747
Customer and Brand
Customer Advocacy (NPS) OngoingNPS record achieved at Qantas
Domestic, Qantas International and Qantas Loyalty30
Maintain premium on-time performance Qantas Domestic
Ongoing Premium on-time performance
maintained with increase to 89.7 per cent31
The Group-wide policy of implementing an 18-month wages freeze, whilst not part of the Qantas Transformation Program, is helping to offset inflation, build a more competitive and sustainable wages position going forward and closes the gap to our major domestic competitors. Thirty agreements have been closed with the wages freeze, with all of the major unions representing employee groups having signed up to the policy in at least one agreement.
In July 2015, Qantas announced that employees covered by the wages freeze policy will receive a bonus payment worth five per cent of their base annual salary. In August 2016, the Group announced a non-executive bonus payment of $3,000 for full-time and $2,500 for part-time employees, subject to the employee group having signed up to the 18-month wages freeze.
23 Target assumes steady foreign exchange rates and capacity.24 Includes underlying operating expenses (excluding fuel), depreciation and amortisation (excluding depreciation reduction from Qantas International non-cash fleet impairment) and
non-cancellable aircraft operating lease rentals, adjusted for movements in FX rates and capacity. 2015/16 vs annualised first-half 2014/15.25 Actioned Full Time Equivalent employee reduction as at 30 June 2016. ~30 FTEs still to exit as at 30 June 2016.26 Reduction in net debt including capitalised operating lease liabilities.27 Management’s estimate based on Moody’s methodology. 28 Management’s estimate based on Standard and Poor’s methodology. 29 Net free cash flow – operating cash flows less investing cash flows (excluding Aircraft operating lease refinancing). Net free cash flow is a measure of the amount of operating cash flows
that are available (i.e. after investing activities) to fund reductions in net debt or payments to shareholders.30 Measured as Net Promoter Score. Average 2015/16 compared to average 2014/15.31 Qantas mainline operations (excluding QantasLink) for the period 2015/16 compared to average 2014/15. Source: BITRE.
16
Q A N T A S A N N U A L R E P O R T 2 0 1 6

Review of Operations continuedFor the year ended 30 June 2016
BUILDING ON THE GROUP’S LONG-TERM COMPETITIVE ADVANTAGES
The Qantas Group’s integrated portfolio strategy is designed to diversify earnings and mitigate risk, with the dual brands of Qantas and Jetstar and their presence in attractive markets across the Asia Pacific providing long-term growth opportunities. The starting point for the Group’s strategy is understanding the global forces that will impact Qantas over the long-term – the megatrends that present both risk and opportunity – and ensuring the Group is well positioned to respond.
Qantas has engaged with stakeholders including shareholders, sustainability thought leaders, industry partners and suppliers to identify and prioritise the global forces of most relevance to the Group. With this long-term context in mind, the Group’s strategic priorities allow us to navigate the right path, building on our long-term competitive advantages while recognising and responding to the risks and opportunities arising from emerging global forces.
New Centres of Customer Demand &
Geopolitical Influence
Rapid Digitisation & the Rise of Big
Data
Shifting Customer
& Workforce Preferences
Resource Constraints &
Climate Change
CLEAR STRATEGIC PRIORITIES
Maximising Leading Domestic Position through
Dual Brand Strategy
Investing in Customer, Brand,
Data & Digital
Focus on People, Culture &
Leadership
Building a Resilient &
Sustainable Qantas
International, Growing Efficiently with Partnerships
Aligning Qantas & Jetstar with Asia’s Growth
Diversification & Growth at Qantas
Loyalty
Embedding Sustainability Across Qantas Group
RAPIDLY IMPROVED CASH GENERATION
Cash Flow Summary
June 2016
$M
June 2015
$MChange
$MChange
%
Operating cash flows 2,819 2,048 771 38
Investing cash flows (excluding aircraft operating lease refinancing) (1,145) (944) (201) 21
Net free cash flow 1,674 1,104 570 52
Aircraft operating lease refinancing (778) – (778) >100
Financing cash flows (1,825) (1,218) (607) 50
Cash at beginning of year 2,908 3,001 (93) (3)
Effect of foreign exchange on cash 1 21 (20) (95)
Cash at end of year 1,980 2,908 (928) (32)
Debt Analysis
June 2016
$M
June 2015
$MChange Change
%
Net on balance sheet debt32 2,880 2,594 286 11
Capitalised operating lease liabilities33 2,766 3,806 (1,040) (27)
Net debt34 5,646 6,400 (754) (12)
FFO/net debt % 52 45 7pts
Debt/EBITDA times 2.5 3.0 (0.5) times
32 Net on balance sheet debt includes interest-bearing liabilities and the fair value of hedges related to debt reduced by cash and cash equivalents.33 Capitalised operating lease liabilities are measured at fair value at the lease commencement date and remeasured over the lease term on a principal and interest basis akin to a finance
lease. Residual value of capitalised aircraft operating lease liability denominated in foreign currency is translated at the long-term exchange rate.34 Net debt includes on balance sheet debt and capitalised aircraft operating lease liabilities under the Group’s Financial Framework.
17
Q A N T A S A N N U A L R E P O R T 2 0 1 6
Review of Operations continuedFor the year ended 30 June 2016
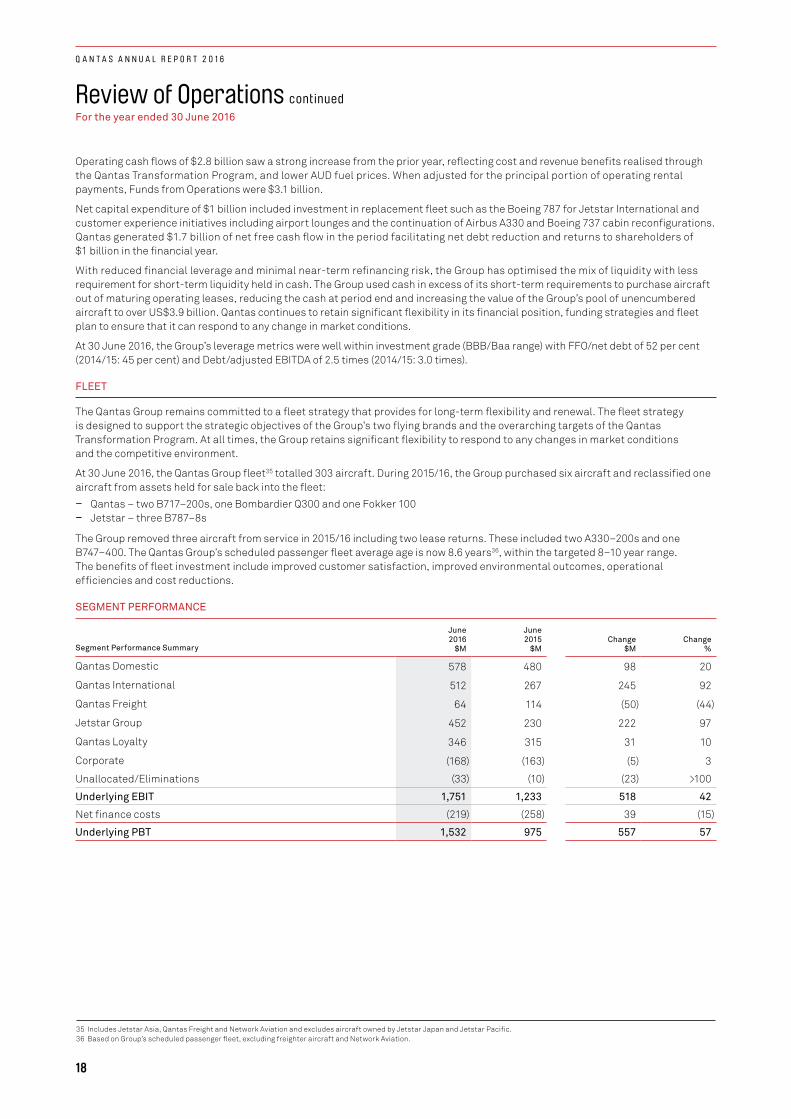
Operating cash flows of $2.8 billion saw a strong increase from the prior year, reflecting cost and revenue benefits realised through the Qantas Transformation Program, and lower AUD fuel prices. When adjusted for the principal portion of operating rental payments, Funds from Operations were $3.1 billion.
Net capital expenditure of $1 billion included investment in replacement fleet such as the Boeing 787 for Jetstar International and customer experience initiatives including airport lounges and the continuation of Airbus A330 and Boeing 737 cabin reconfigurations. Qantas generated $1.7 billion of net free cash flow in the period facilitating net debt reduction and returns to shareholders of $1 billion in the financial year.
With reduced financial leverage and minimal near-term refinancing risk, the Group has optimised the mix of liquidity with less requirement for short-term liquidity held in cash. The Group used cash in excess of its short-term requirements to purchase aircraft out of maturing operating leases, reducing the cash at period end and increasing the value of the Group’s pool of unencumbered aircraft to over US$3.9 billion. Qantas continues to retain significant flexibility in its financial position, funding strategies and fleet plan to ensure that it can respond to any change in market conditions.
At 30 June 2016, the Group’s leverage metrics were well within investment grade (BBB/Baa range) with FFO/net debt of 52 per cent (2014/15: 45 per cent) and Debt/adjusted EBITDA of 2.5 times (2014/15: 3.0 times).
FLEET
The Qantas Group remains committed to a fleet strategy that provides for long-term flexibility and renewal. The fleet strategy is designed to support the strategic objectives of the Group’s two flying brands and the overarching targets of the Qantas Transformation Program. At all times, the Group retains significant flexibility to respond to any changes in market conditions and the competitive environment.
At 30 June 2016, the Qantas Group fleet35 totalled 303 aircraft. During 2015/16, the Group purchased six aircraft and reclassified one aircraft from assets held for sale back into the fleet:
– Qantas – two B717–200s, one Bombardier Q300 and one Fokker 100 – Jetstar – three B787–8s
The Group removed three aircraft from service in 2015/16 including two lease returns. These included two A330–200s and one B747–400. The Qantas Group’s scheduled passenger fleet average age is now 8.6 years36, within the targeted 8–10 year range. The benefits of fleet investment include improved customer satisfaction, improved environmental outcomes, operational efficiencies and cost reductions.
SEGMENT PERFORMANCE
Segment Performance Summary
June 2016
$M
June 2015
$MChange
$MChange
%
Qantas Domestic 578 480 98 20
Qantas International 512 267 245 92
Qantas Freight 64 114 (50) (44)
Jetstar Group 452 230 222 97
Qantas Loyalty 346 315 31 10
Corporate (168) (163) (5) 3
Unallocated/Eliminations (33) (10) (23) >100
Underlying EBIT 1,751 1,233 518 42
Net finance costs (219) (258) 39 (15)
Underlying PBT 1,532 975 557 57
35 Includes Jetstar Asia, Qantas Freight and Network Aviation and excludes aircraft owned by Jetstar Japan and Jetstar Pacific.36 Based on Group’s scheduled passenger fleet, excluding freighter aircraft and Network Aviation.
18
Q A N T A S A N N U A L R E P O R T 2 0 1 6
Review of Operations continuedFor the year ended 30 June 2016
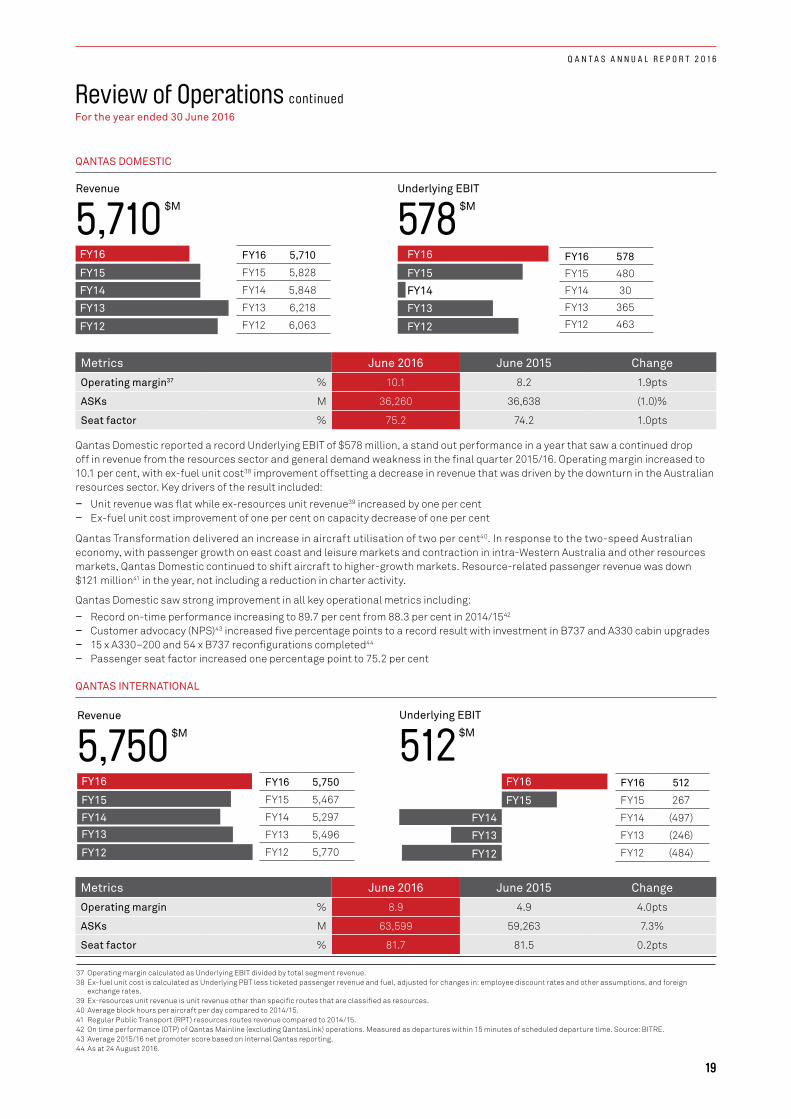
QANTAS DOMESTIC
Metrics June 2016 June 2015 Change
Operating margin37 % 10.1 8.2 1.9pts
ASKs M 36,260 36,638 (1.0)%
Seat factor % 75.2 74.2 1.0pts
Qantas Domestic reported a record Underlying EBIT of $578 million, a stand out performance in a year that saw a continued drop off in revenue from the resources sector and general demand weakness in the final quarter 2015/16. Operating margin increased to 10.1 per cent, with ex-fuel unit cost38 improvement offsetting a decrease in revenue that was driven by the downturn in the Australian resources sector. Key drivers of the result included:
– Unit revenue was flat while ex-resources unit revenue39 increased by one per cent – Ex-fuel unit cost improvement of one per cent on capacity decrease of one per cent
Qantas Transformation delivered an increase in aircraft utilisation of two per cent40. In response to the two-speed Australian economy, with passenger growth on east coast and leisure markets and contraction in intra-Western Australia and other resources markets, Qantas Domestic continued to shift aircraft to higher-growth markets. Resource-related passenger revenue was down $121 million41 in the year, not including a reduction in charter activity.
Qantas Domestic saw strong improvement in all key operational metrics including: – Record on-time performance increasing to 89.7 per cent from 88.3 per cent in 2014/1542
– Customer advocacy (NPS)43 increased five percentage points to a record result with investment in B737 and A330 cabin upgrades – 15 x A330–200 and 54 x B737 reconfigurations completed44
– Passenger seat factor increased one percentage point to 75.2 per cent
QANTAS INTERNATIONAL
Metrics June 2016 June 2015 Change
Operating margin % 8.9 4.9 4.0pts
ASKs M 63,599 59,263 7.3%
Seat factor % 81.7 81.5 0.2pts
FY16
FY15
FY14
FY13
FY12
Underlying EBIT
512
$M
FY16 512
FY15 267
FY14 (497)
FY13 (246)
FY12 (484)
FY16
FY15
FY14FY13
FY12
Revenue
5,750
$M
FY16 5,750
FY15 5,467
FY14 5,297
FY13 5,496
FY12 5,770
FY16
FY15
FY14
FY13
FY12
Underlying EBIT
578
$M
FY16 578
FY15 480
FY14 30
FY13 365
FY12 463
FY16
FY15
FY14
FY13
FY12
Revenue
5,710
$M
FY16 5,710
FY15 5,828
FY14 5,848
FY13 6,218
FY12 6,063
37 Operating margin calculated as Underlying EBIT divided by total segment revenue.38 Ex-fuel unit cost is calculated as Underlying PBT less ticketed passenger revenue and fuel, adjusted for changes in: employee discount rates and other assumptions, and foreign
exchange rates. 39 Ex-resources unit revenue is unit revenue other than specific routes that are classified as resources.40 Average block hours per aircraft per day compared to 2014/15.41 Regular Public Transport (RPT) resources routes revenue compared to 2014/15.42 On time performance (OTP) of Qantas Mainline (excluding QantasLink) operations. Measured as departures within 15 minutes of scheduled departure time. Source: BITRE.43 Average 2015/16 net promoter score based on internal Qantas reporting.44 As at 24 August 2016.
19
Q A N T A S A N N U A L R E P O R T 2 0 1 6
Review of Operations continuedFor the year ended 30 June 2016
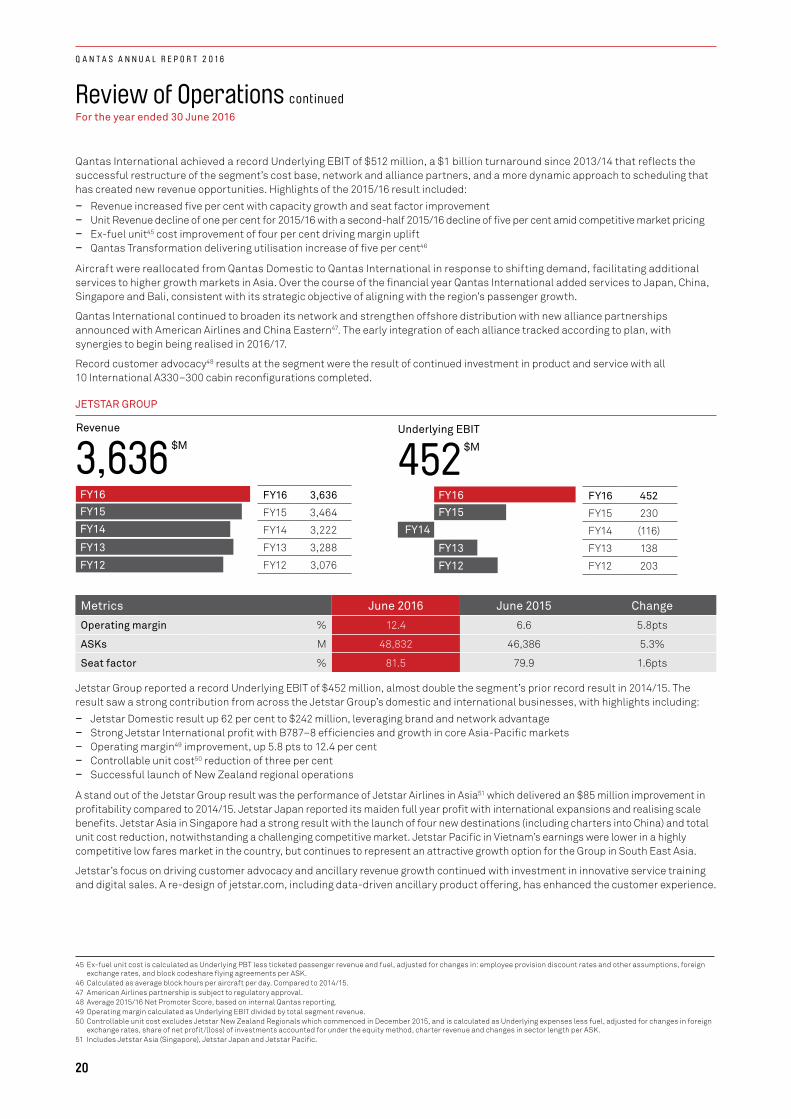
Qantas International achieved a record Underlying EBIT of $512 million, a $1 billion turnaround since 2013/14 that reflects the successful restructure of the segment’s cost base, network and alliance partners, and a more dynamic approach to scheduling that has created new revenue opportunities. Highlights of the 2015/16 result included:
– Revenue increased five per cent with capacity growth and seat factor improvement – Unit Revenue decline of one per cent for 2015/16 with a second-half 2015/16 decline of five per cent amid competitive market pricing – Ex-fuel unit45 cost improvement of four per cent driving margin uplift – Qantas Transformation delivering utilisation increase of five per cent46
Aircraft were reallocated from Qantas Domestic to Qantas International in response to shifting demand, facilitating additional services to higher growth markets in Asia. Over the course of the financial year Qantas International added services to Japan, China, Singapore and Bali, consistent with its strategic objective of aligning with the region’s passenger growth.
Qantas International continued to broaden its network and strengthen offshore distribution with new alliance partnerships announced with American Airlines and China Eastern47. The early integration of each alliance tracked according to plan, with synergies to begin being realised in 2016/17.
Record customer advocacy48 results at the segment were the result of continued investment in product and service with all 10 International A330–300 cabin reconfigurations completed.
JETSTAR GROUP
Metrics June 2016 June 2015 Change
Operating margin % 12.4 6.6 5.8pts
ASKs M 48,832 46,386 5.3%
Seat factor % 81.5 79.9 1.6pts
Jetstar Group reported a record Underlying EBIT of $452 million, almost double the segment’s prior record result in 2014/15. The result saw a strong contribution from across the Jetstar Group’s domestic and international businesses, with highlights including:
– Jetstar Domestic result up 62 per cent to $242 million, leveraging brand and network advantage – Strong Jetstar International profit with B787–8 efficiencies and growth in core Asia-Pacific markets – Operating margin49 improvement, up 5.8 pts to 12.4 per cent – Controllable unit cost50 reduction of three per cent – Successful launch of New Zealand regional operations
A stand out of the Jetstar Group result was the performance of Jetstar Airlines in Asia51 which delivered an $85 million improvement in profitability compared to 2014/15. Jetstar Japan reported its maiden full year profit with international expansions and realising scale benefits. Jetstar Asia in Singapore had a strong result with the launch of four new destinations (including charters into China) and total unit cost reduction, notwithstanding a challenging competitive market. Jetstar Pacific in Vietnam’s earnings were lower in a highly competitive low fares market in the country, but continues to represent an attractive growth option for the Group in South East Asia.
Jetstar’s focus on driving customer advocacy and ancillary revenue growth continued with investment in innovative service training and digital sales. A re-design of jetstar.com, including data-driven ancillary product offering, has enhanced the customer experience.
FY16
FY15
FY14
FY13
FY12
Revenue
3,636
$M
FY16 3,636
FY15 3,464
FY14 3,222
FY13 3,288
FY12 3,076
FY16
FY15
FY14
FY13
FY12
Underlying EBIT
452
$M
FY16 452
FY15 230
FY14 (116)
FY13 138
FY12 203
45 Ex-fuel unit cost is calculated as Underlying PBT less ticketed passenger revenue and fuel, adjusted for changes in: employee provision discount rates and other assumptions, foreign exchange rates, and block codeshare flying agreements per ASK.
46 Calculated as average block hours per aircraft per day. Compared to 2014/15.47 American Airlines partnership is subject to regulatory approval.48 Average 2015/16 Net Promoter Score, based on internal Qantas reporting.49 Operating margin calculated as Underlying EBIT divided by total segment revenue.50 Controllable unit cost excludes Jetstar New Zealand Regionals which commenced in December 2015, and is calculated as Underlying expenses less fuel, adjusted for changes in foreign
exchange rates, share of net profit/(loss) of investments accounted for under the equity method, charter revenue and changes in sector length per ASK.51 Includes Jetstar Asia (Singapore), Jetstar Japan and Jetstar Pacific.
20
Q A N T A S A N N U A L R E P O R T 2 0 1 6
Review of Operations continuedFor the year ended 30 June 2016
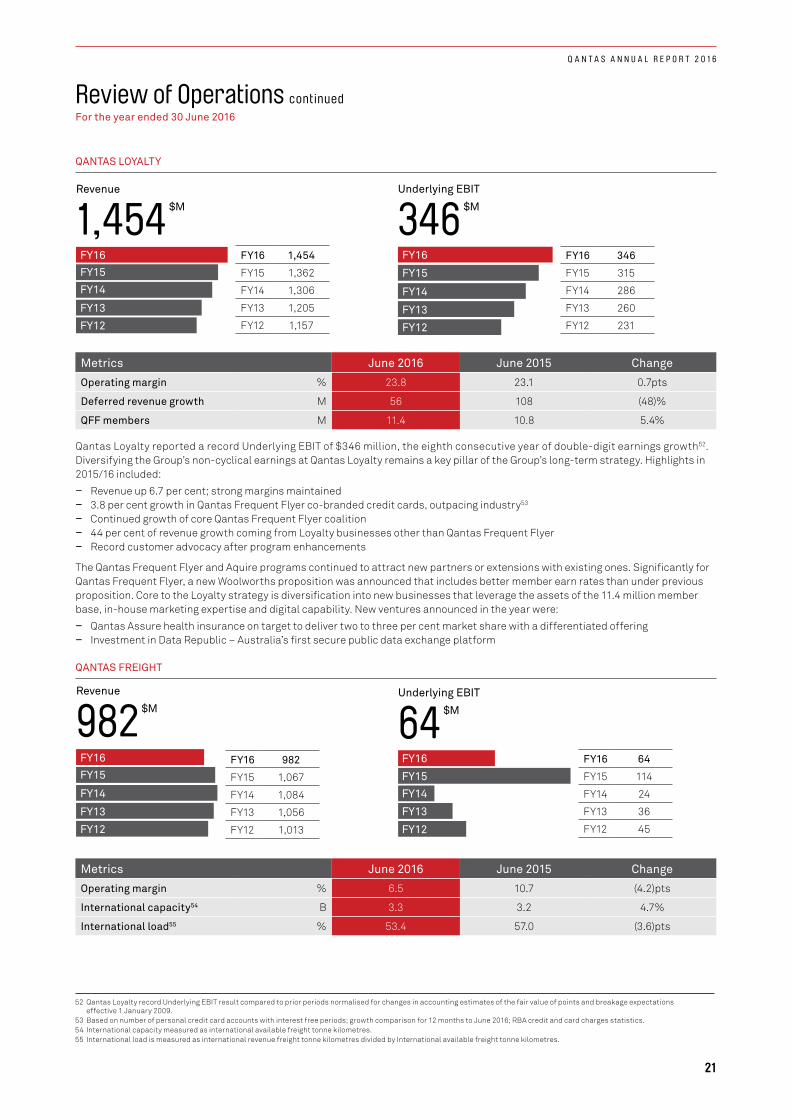
QANTAS LOYALTY
Metrics June 2016 June 2015 Change
Operating margin % 23.8 23.1 0.7pts
Deferred revenue growth M 56 108 (48)%
QFF members M 11.4 10.8 5.4%
Qantas Loyalty reported a record Underlying EBIT of $346 million, the eighth consecutive year of double-digit earnings growth52. Diversifying the Group’s non-cyclical earnings at Qantas Loyalty remains a key pillar of the Group’s long-term strategy. Highlights in 2015/16 included:
– Revenue up 6.7 per cent; strong margins maintained – 3.8 per cent growth in Qantas Frequent Flyer co-branded credit cards, outpacing industry53
– Continued growth of core Qantas Frequent Flyer coalition – 44 per cent of revenue growth coming from Loyalty businesses other than Qantas Frequent Flyer – Record customer advocacy after program enhancements
The Qantas Frequent Flyer and Aquire programs continued to attract new partners or extensions with existing ones. Significantly for Qantas Frequent Flyer, a new Woolworths proposition was announced that includes better member earn rates than under previous proposition. Core to the Loyalty strategy is diversification into new businesses that leverage the assets of the 11.4 million member base, in-house marketing expertise and digital capability. New ventures announced in the year were:
– Qantas Assure health insurance on target to deliver two to three per cent market share with a differentiated offering – Investment in Data Republic – Australia’s first secure public data exchange platform
QANTAS FREIGHT
Metrics June 2016 June 2015 Change
Operating margin % 6.5 10.7 (4.2)pts
International capacity54 B 3.3 3.2 4.7%
International load55 % 53.4 57.0 (3.6)pts
FY16
FY15
FY14
FY13
FY12
Revenue
982
$M
FY16 982
FY15 1,067
FY14 1,084
FY13 1,056
FY12 1,013
FY16
FY15
FY14
FY13
FY12
Underlying EBIT
64
$M
FY16 64
FY15 114
FY14 24
FY13 36
FY12 45
FY16
FY15
FY14
FY13
FY12
Revenue
1,454
$M
FY16 1,454
FY15 1,362
FY14 1,306
FY13 1,205
FY12 1,157
FY16
FY15
FY14
FY13
FY12
Underlying EBIT
346
$M
FY16 346
FY15 315
FY14 286
FY13 260
FY12 231
52 Qantas Loyalty record Underlying EBIT result compared to prior periods normalised for changes in accounting estimates of the fair value of points and breakage expectations effective 1 January 2009.
53 Based on number of personal credit card accounts with interest free periods; growth comparison for 12 months to June 2016; RBA credit and card charges statistics.54 International capacity measured as international available freight tonne kilometres.55 International load is measured as international revenue freight tonne kilometres divided by International available freight tonne kilometres.
21
Q A N T A S A N N U A L R E P O R T 2 0 1 6
Review of Operations continuedFor the year ended 30 June 2016
Qantas Freight reported an Underlying EBIT of $64 million, a $50 million decrease from the prior year in line with guidance provided at the Group’s full year 2014/15 results. The performance reflected challenging global cargo markets, and more in keeping with historical performance. Key drivers of the result included:
– Revenue performance reflecting flat demand against a six per cent global capacity increase – Conclusion of favourable Australian air Express legacy agreements in 2014/15 – Continued cost reduction through Qantas Transformation
Qantas Freight retains a leading position in the Australian cargo market with Australia Post and Toll Group, Australia’s largest air freight customers, under contract. With yields likely remaining under pressure, the segment is focused on delivering on strategic objectives to ensure sustainable performance in the future:
– Integrated ground to air operations – Continued cost reduction through Qantas Transformation – Developing growth opportunities into China through tactical freight deployment to Zhengzhou and Chongqing – Agile scheduling to adapt to changing markets – for example new freighter stop-off into Dallas
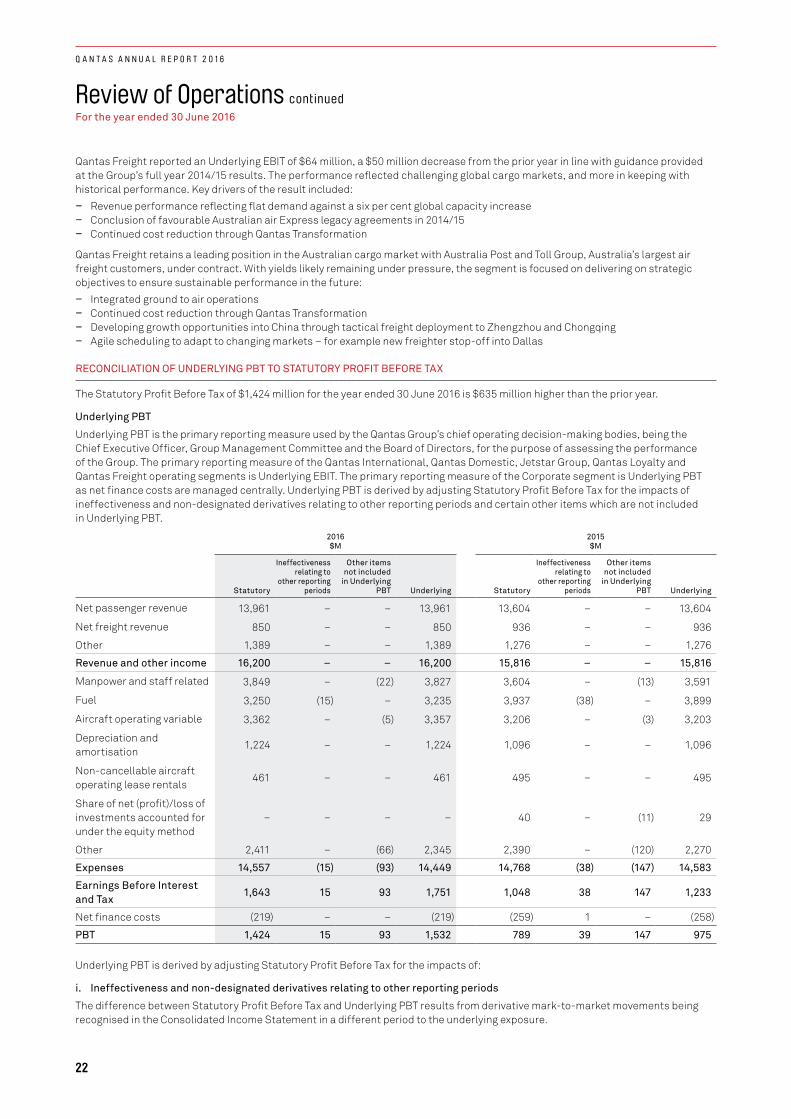
RECONCILIATION OF UNDERLYING PBT TO STATUTORY PROFIT BEFORE TAX
The Statutory Profit Before Tax of $1,424 million for the year ended 30 June 2016 is $635 million higher than the prior year.
Underlying PBT
Underlying PBT is the primary reporting measure used by the Qantas Group’s chief operating decision-making bodies, being the Chief Executive Officer, Group Management Committee and the Board of Directors, for the purpose of assessing the performance of the Group. The primary reporting measure of the Qantas International, Qantas Domestic, Jetstar Group, Qantas Loyalty and Qantas Freight operating segments is Underlying EBIT. The primary reporting measure of the Corporate segment is Underlying PBT as net finance costs are managed centrally. Underlying PBT is derived by adjusting Statutory Profit Before Tax for the impacts of ineffectiveness and non-designated derivatives relating to other reporting periods and certain other items which are not included in Underlying PBT.
2016 $M
2015 $M
Statutory
Ineffectiveness relating to
other reporting periods
Other items not included
in Underlying PBT Underlying Statutory
Ineffectiveness relating to
other reporting periods
Other items not included
in Underlying PBT Underlying
Net passenger revenue 13,961 – – 13,961 13,604 – – 13,604
Net freight revenue 850 – – 850 936 – – 936
Other 1,389 – – 1,389 1,276 – – 1,276
Revenue and other income 16,200 – – 16,200 15,816 – – 15,816
Manpower and staff related 3,849 – (22) 3,827 3,604 – (13) 3,591
Fuel 3,250 (15) – 3,235 3,937 (38) – 3,899
Aircraft operating variable 3,362 – (5) 3,357 3,206 – (3) 3,203
Depreciation and amortisation
1,224 – – 1,224 1,096 – – 1,096
Non-cancellable aircraft operating lease rentals
461 – – 461 495 – – 495
Share of net (profit)/loss of investments accounted for under the equity method
– – – – 40 – (11) 29
Other 2,411 – (66) 2,345 2,390 – (120) 2,270
Expenses 14,557 (15) (93) 14,449 14,768 (38) (147) 14,583
Earnings Before Interest and Tax
1,643 15 93 1,751 1,048 38 147 1,233
Net finance costs (219) – – (219) (259) 1 – (258)
PBT 1,424 15 93 1,532 789 39 147 975
Underlying PBT is derived by adjusting Statutory Profit Before Tax for the impacts of:
i. Ineffectiveness and non-designated derivatives relating to other reporting periods
The difference between Statutory Profit Before Tax and Underlying PBT results from derivative mark-to-market movements being recognised in the Consolidated Income Statement in a different period to the underlying exposure.
22
Q A N T A S A N N U A L R E P O R T 2 0 1 6

Review of Operations continuedFor the year ended 30 June 2016
ii. Other items not included in Underlying PBT
Items which are identified by Management and reported to the chief operating decision-making bodies as not representing the underlying performance of the business are not included in Underlying PBT. The determination of these items is made after consideration of their nature and materiality and is applied consistently from period to period.
Items not included in Underlying PBT primarily result from revenues or expenses relating to business activities in other reporting periods, major transformational/restructuring initiatives, transactions involving investments, impairments of assets and other transactions outside the ordinary course of business. Other items not included in Underlying PBT of $93 million includes transformation costs relating to the Qantas Transformation Program of $183 million, the wage freeze employee bonus of $91 million relating to the Enterprise Bargaining Agreements (EBAs) announced on 3 July 2015 and other costs of $20 million offset by the net gain on disposal of property, plant and equipment of $201 million relating to the disposal of Sydney Airport Terminal Three and related assets to Sydney Airport Corporation Limited announced on 18 August 2015.
MATERIAL BUSINESS RISKS
The aviation industry is subject to a number of inherent risks. These include, but are not limited to, exposure to changes in economic conditions, changes in government regulations, fuel and foreign exchange volatility and other exogenous events such as aviation incidents, natural disasters, war or an epidemic.
Qantas is subject to a number of specific business risks which may impact the achievement of the Group’s strategy and financial prospects. The nature of these risks has not changed with the focus remaining on improving the controls in place to manage or mitigate these risks.
– Competitive intensity: Market capacity growth ahead of underlying demand impacts industry profitability.
• Australia’s liberal aviation policy settings coupled with the strength of the Australian economy relative to global economic weakness in recent years has attracted more offshore competitors to the Australian international aviation market, predominantly state-sponsored airlines. Qantas is responding by building key strategic airline partnerships with strong global partners and optimising its network. Qantas brings domestic strength and the unrivalled customer offering of Qantas Loyalty. Qantas International has embarked on a major restructure of its legacy cost base through the Qantas Transformation Program with the objective of achieving a cost base comparable to direct competitors.
• The Australian domestic aviation market is a highly competitive environment. The Qantas Group’s market-leading domestic position and dual-brand strategy allow Qantas to effectively mitigate the impact of any market changes. This strategy leverages Qantas Domestic (including QantasLink) to serve business and premium leisure customers and Jetstar to serve price-sensitive customers. Qantas Domestic is focused on removing the cost base disadvantage to its competitor through Qantas Transformation initiatives while maintaining a revenue premium. Jetstar is working to maintain its lowest seat cost and yield advantage. These priorities deliver Qantas Domestic and Jetstar Domestic the highest operating margins in their respective markets enabling the Group to retain market share of Underlying EBIT in excess of capacity share.
– Fuel and foreign exchange volatility: The Qantas Group is subject to fuel and foreign exchange risks. These risks are an inherent part of the operations of an airline. The Qantas Group manages these risks through a comprehensive hedging program. For 2016/17 the Group’s hedging profile is positioned such that the worst case total fuel cost is $3.256 billion with 87 per cent participation rate in lower fuel prices (at current forward market price total fuel cost for 2016/17 is $3.157 billion)58. Complementing the hedging program, increased focus on forecasting and operational agility of our aviation operations supports the Group to manage the residual uncertainty.
– Industrial relations: The associated risks of transformation including industrial action relating to Qantas’ collective agreements with its employees. The risk is being mitigated through continuous employee engagement initiatives and ongoing, constructive dialogue with all union groups and other relevant stakeholders. In 2015/16 the Group’s engagement score was at a record 79 per cent up four percentage points since 2014/15. The Group has successfully closed 30 Enterprise Bargaining Agreements (EBAs) subsequent to the commencement of the Qantas Transformation Program inclusive of an 18 month wage freeze. To support the implementation of the 18 month wage freeze a bonus payment of five per cent was announced in July 2015 to be made to all employees covered by an 18 month wage freeze. In addition, in August 2016 in recognition of the contribution towards a record result, the Group announced a further $3,000 bonus to all full-time employees and $2,500 to all part-time employees covered by an 18 month wage freeze.
– Integrity of data and continuity of critical systems: The Group’s operations depend on the continuity of a number of information technology and communication services and the integrity and protection of the privacy of data. The Group’s ongoing investment in cybersecurity, together with its extensive Control and Risk Framework59 work to reduce the likelihood of outages, ensure early detection and the mitigation of impact.
– Key business partners and alliances: The Qantas Group has relationships with a number of key business partners. Any potential exposures as a result of these partnerships are mitigated through the Group Risk Management Framework.
56 The worst case total fuel cost is based on a two standard deviation correlated move in the Brent forward market prices to US$56/bbl with the AUD/USD rate at 0.78 for the remainder of 2016/17.
57 The current forward market price total fuel cost is based on a Brent forward market price of A$67/bbl for the remainder of 2016/17.58 As at 23 August 2016.59 An overview of the Group Risk Management Framework is available through the Qantas Group Business Practices Document on www.qantas.com.au.
23
Q A N T A S A N N U A L R E P O R T 2 0 1 6
Corporate Governance StatementFor the year ended 30 June 2016
OVERVIEW
Corporate governance is core to ensuring the creation, protection and enhancement of shareholder value. The Board maintains, and requires that Qantas Management maintains, the highest level of corporate ethics.
The Board comprises a majority of Independent Non-Executive Directors who, together with the Executive Director, have an appropriate balance of skills, knowledge, experience, independence and diversity to enable the Board as a collective to effectively discharge its responsibilities.
The Board endorses the ASX Corporate Governance Principles and Recommendations, 3rd Edition (ASX Principles).
Accordingly, Qantas has taken the opportunity to disclose its 2016 Corporate Governance Statement in the Corporate Governance section on the Qantas website (http://www.qantas.com/travel/airlines/governance-structure/global/en). As required, Qantas has also lodged the Corporate Governance Statement with the ASX.
Following is a summary of the key aspects of the Corporate Governance Statement.
THE BOARD LAYS SOLID FOUNDATIONS FOR MANAGEMENT AND OVERSIGHT
The Board has adopted a formal Charter which is available in the Corporate Governance section on the Qantas website (http://www.qantas.com.au/infodetail/about/corporateGovernance/BoardCharter.pdf).
The Board is responsible for setting and reviewing the strategic direction of Qantas and monitoring the implementation of that strategy by Management.
The CEO is responsible for the day-to-day management of the Qantas Group with all powers, discretions and delegations authorised, from time to time, by the Board.
The Company Secretary is accountable directly to the Board, through the Chairman, on all matters to do with the proper functioning of the Board.
THE BOARD IS STRUCTURED TO ADD VALUE
The Qantas Board currently has 10 Directors. Eight Directors are Independent Non-Executive Directors elected by shareholders and one has been appointed by the Board to fill a casual vacancy. The Qantas CEO, who is an Executive Director, is not regarded as independent.
Details of the current Directors, their qualifications, skills, experience and tenure are set out on pages 8 to 11 of the Qantas Annual Report 2016.
The Board has four Committees: – Audit Committee – Nominations Committee – Remuneration Committee – Safety, Health, Environment and Security Committee
Each of these committees assists the Board with specified responsibilities that are set out in Committee Charters, as delegated and approved by the Board.
Membership of and attendance at 2015/2016 Board and Committee Meetings is detailed on page 26 of the 2016 Annual Report.
THE BOARD PROMOTES ETHICAL AND RESPONSIBLE DECISION-MAKING
The Board has established a corporate governance framework, comprising Non-Negotiable Business Principles (Principles) and Group Policies, which forms the foundation for the way in which the Qantas Group undertakes business. The Principles and Group Policies, including the Qantas Group Code of Conduct and Ethics, are detailed in the Qantas Group Business Practices document. This framework is supported by a rigorous whistleblower program, which provides a protected disclosure process for employees.
The Qantas Group Employee Share Trading Policy sets out guidelines designed to protect the Qantas Group Directors and its employees from intentionally or unintentionally breaching the law. The Qantas Group Employee Share Trading Policy prohibits employees from dealing in the securities of any Qantas Group listed entity while in possession of material non-public information.
In addition, certain nominated Qantas employees are also prohibited from entering into any hedging or margin lending arrangement or otherwise granting a charge over the securities of any Qantas Group listed entity, where control of any sale process relating to those securities may be lost.
24
Q A N T A S A N N U A L R E P O R T 2 0 1 6
Corporate Governance Statement continuedFor the year ended 30 June 2016
THE BOARD SAFEGUARDS THE INTEGRITY OF CORPORATE FINANCIAL REPORTING
The Board and Audit Committee closely monitor the independence of the external auditor. Regular reviews occur of the independence safeguards put in place by the external auditor. Qantas rotates the lead external audit partner every five years and imposes restrictions on the employment of personnel previously employed by the external auditor.
Policies are in place to restrict the type of non-audit services which can be provided by the external auditor and a detailed review of non-audit fees paid to the external auditor is undertaken on a half-yearly basis.
At each meeting, the Audit Committee meets privately with Executive Management without the external auditor, and with the internal and external auditors with Executive Management.
THE BOARD MAKES TIMELY AND BALANCED DISCLOSURE
Qantas is committed to ensuring that trading in its shares takes place in an orderly and informed market, with transparent and consistent communication with all shareholders. Qantas has an established process to ensure that it complies with its continuous disclosure obligations at all times, including a bi-annual confirmation by all Executive Management that the areas for which they are responsible have complied with the Group’s Continuous Disclosure Policy.
Qantas proactively communicates with its shareholders via the ASX and its web-based Newsroom, with all materials released by the Group made available to all shareholders at the same time. Additionally, Qantas actively conveys its publicly-disclosed information and seeks the views of its shareholders, large and small, in a number of forums, including at the Annual General Meeting (AGM), the Qantas Investor Day and, as is common practice among its major listed peers, through periodic meetings with current and potential institutional shareholders.
THE BOARD RESPECTS THE RIGHTS OF SHAREHOLDERS
Qantas has a Shareholder Communications Policy which promotes effective two-way communication with shareholders and the wider investment community, and encourages participation at general meetings.
Shareholders also have the option to receive communications from, and send communications to, Qantas and its Share Registry electronically, including email notification of significant market announcements.
The external auditor attends the AGM and is available to answer shareholder questions that are relevant to the audit.
THE BOARD RECOGNISES AND MANAGES RISK
Qantas is committed to embedding risk management practices to support the achievement of business objectives and fulfil corporate governance obligations. The Board is responsible for reviewing and overseeing the risk management strategy for the Qantas Group and for ensuring the Qantas Group has an appropriate corporate governance structure. Within that overall strategy, Management has designed and implemented a risk management and internal control system to manage Qantas’ material business risks.
During 2015/2016, the two Board committees responsible for oversight of risk-related matters, the Audit Committee and the Safety, Health, Environment and Security Committee, undertook their annual review of the effectiveness of Qantas’ implementation of its risk management system and internal control framework.
The internal audit function is carried out by Group Audit and Risk and is independent of the external auditor. Group Audit and Risk provides independent, objective assurance and consulting services on Qantas’ system of risk management, internal control and governance.
The Audit Committee approves the Group Audit and Risk Internal Audit Charter, which provides Group Audit and Risk with full access to Qantas Group functions, records, property and personnel, and establishes independence requirements. The Audit Committee also approves the appointment, replacement and remuneration of the internal auditor. The internal auditor has a direct reporting line to the Audit Committee and also provides reporting to the Safety, Health, Environment and Security Committee.
THE BOARD REMUNERATES FAIRLY AND RESPONSIBLY
The Qantas executive remuneration objectives and approach are set out in full below.
Information about remuneration of Executive Management is disclosed to the extent required, together with the process for evaluating performance, in the Remuneration Report from page 30 of the 2016 Annual Report.
Qantas Non-Executive Directors are entitled to statutory superannuation and certain travel entitlements (accrued during service) that are reasonable and standard practice in the aviation industry. Non-Executive Directors do not receive any performance-based remuneration (see pages 47 to 48 of the Qantas Annual Report 2016).
25
Q A N T A S A N N U A L R E P O R T 2 0 1 6
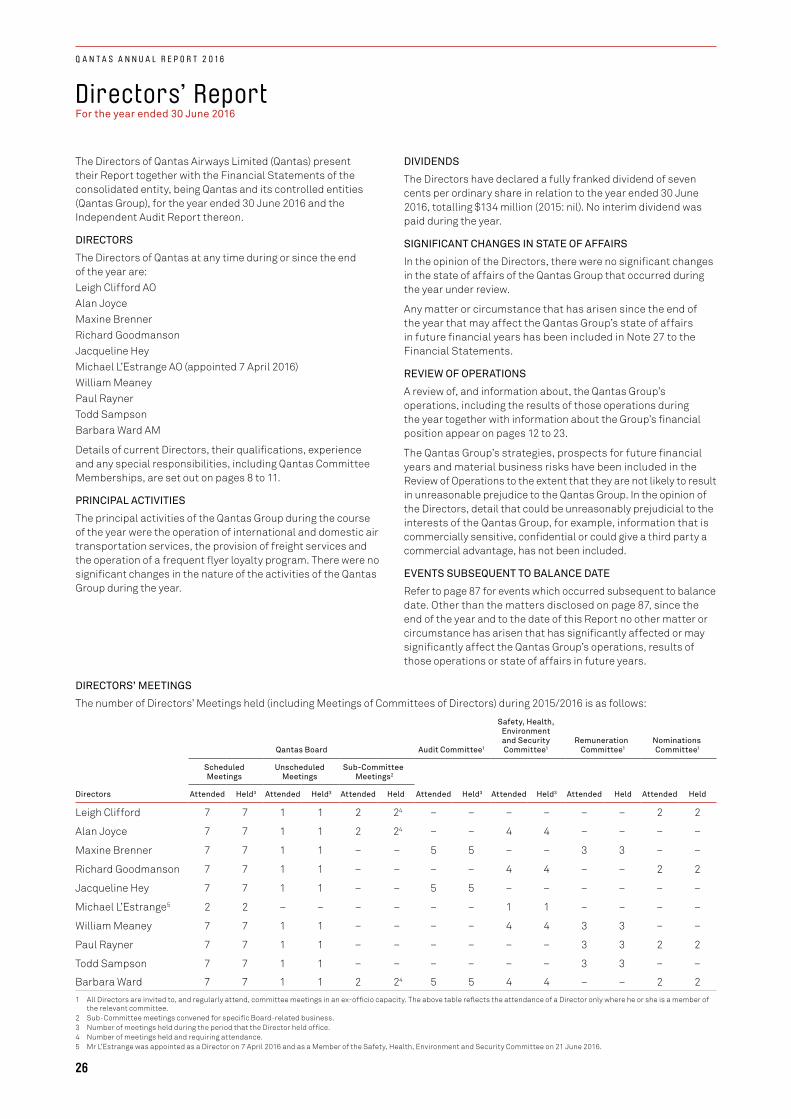
Directors’ ReportFor the year ended 30 June 2016
The Directors of Qantas Airways Limited (Qantas) present their Report together with the Financial Statements of the consolidated entity, being Qantas and its controlled entities (Qantas Group), for the year ended 30 June 2016 and the Independent Audit Report thereon.
DIRECTORS
The Directors of Qantas at any time during or since the end of the year are:Leigh Clifford AO Alan JoyceMaxine BrennerRichard GoodmansonJacqueline Hey Michael L’Estrange AO (appointed 7 April 2016)William Meaney Paul RaynerTodd Sampson Barbara Ward AM
Details of current Directors, their qualifications, experience and any special responsibilities, including Qantas Committee Memberships, are set out on pages 8 to 11.
PRINCIPAL ACTIVITIES
The principal activities of the Qantas Group during the course of the year were the operation of international and domestic air transportation services, the provision of freight services and the operation of a frequent flyer loyalty program. There were no significant changes in the nature of the activities of the Qantas Group during the year.
DIVIDENDS
The Directors have declared a fully franked dividend of seven cents per ordinary share in relation to the year ended 30 June 2016, totalling $134 million (2015: nil). No interim dividend was paid during the year.
SIGNIFICANT CHANGES IN STATE OF AFFAIRS
In the opinion of the Directors, there were no significant changes in the state of affairs of the Qantas Group that occurred during the year under review.
Any matter or circumstance that has arisen since the end of the year that may affect the Qantas Group’s state of affairs in future financial years has been included in Note 27 to the Financial Statements.
REVIEW OF OPERATIONS
A review of, and information about, the Qantas Group’s operations, including the results of those operations during the year together with information about the Group’s financial position appear on pages 12 to 23.
The Qantas Group’s strategies, prospects for future financial years and material business risks have been included in the Review of Operations to the extent that they are not likely to result in unreasonable prejudice to the Qantas Group. In the opinion of the Directors, detail that could be unreasonably prejudicial to the interests of the Qantas Group, for example, information that is commercially sensitive, confidential or could give a third party a commercial advantage, has not been included.
EVENTS SUBSEQUENT TO BALANCE DATE
Refer to page 87 for events which occurred subsequent to balance date. Other than the matters disclosed on page 87, since the end of the year and to the date of this Report no other matter or circumstance has arisen that has significantly affected or may significantly affect the Qantas Group’s operations, results of those operations or state of affairs in future years.
DIRECTORS’ MEETINGS
The number of Directors’ Meetings held (including Meetings of Committees of Directors) during 2015/2016 is as follows:
Qantas Board Audit Committee1
Safety, Health, Environment and Security Committee1
Remuneration Committee1
Nominations Committee1
Scheduled Meetings
Unscheduled Meetings
Sub-Committee Meetings2
Directors Attended Held3 Attended Held3 Attended Held Attended Held3 Attended Held3 Attended Held Attended Held
Leigh Clifford 7 7 1 1 2 24 – – – – – – 2 2
Alan Joyce 7 7 1 1 2 24 – – 4 4 – – – –
Maxine Brenner 7 7 1 1 – – 5 5 – – 3 3 – –
Richard Goodmanson 7 7 1 1 – – – – 4 4 – – 2 2
Jacqueline Hey 7 7 1 1 – – 5 5 – – – – – –
Michael L’Estrange5 2 2 – – – – – – 1 1 – – – –
William Meaney 7 7 1 1 – – – – 4 4 3 3 – –
Paul Rayner 7 7 1 1 – – – – – – 3 3 2 2
Todd Sampson 7 7 1 1 – – – – – – 3 3 – –
Barbara Ward 7 7 1 1 2 24 5 5 4 4 – – 2 2
1 All Directors are invited to, and regularly attend, committee meetings in an ex-officio capacity. The above table reflects the attendance of a Director only where he or she is a member of the relevant committee.
2 Sub-Committee meetings convened for specific Board-related business.3 Number of meetings held during the period that the Director held office. 4 Number of meetings held and requiring attendance.5 Mr L’Estrange was appointed as a Director on 7 April 2016 and as a Member of the Safety, Health, Environment and Security Committee on 21 June 2016.
26
Q A N T A S A N N U A L R E P O R T 2 0 1 6
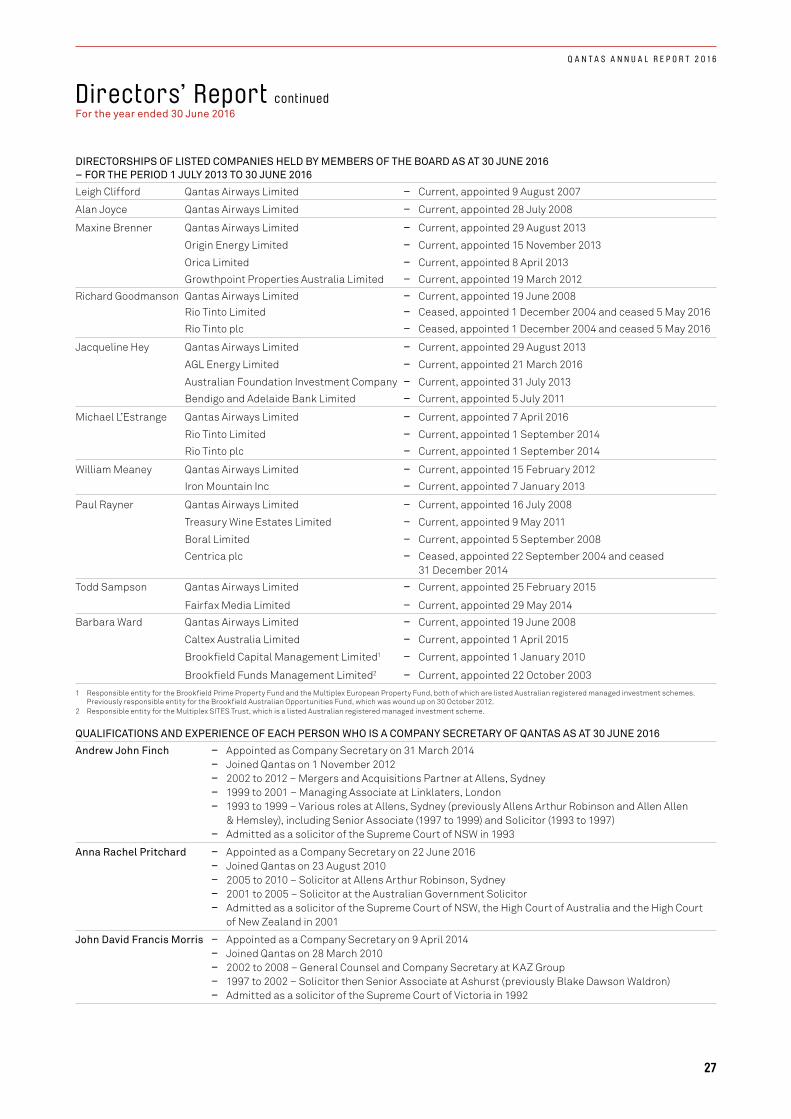
Directors’ Report continuedFor the year ended 30 June 2016
DIRECTORSHIPS OF LISTED COMPANIES HELD BY MEMBERS OF THE BOARD AS AT 30 JUNE 2016 – FOR THE PERIOD 1 JULY 2013 TO 30 JUNE 2016
Leigh Clifford Qantas Airways Limited – Current, appointed 9 August 2007
Alan Joyce Qantas Airways Limited – Current, appointed 28 July 2008
Maxine Brenner Qantas Airways Limited – Current, appointed 29 August 2013
Origin Energy Limited – Current, appointed 15 November 2013
Orica Limited – Current, appointed 8 April 2013
Growthpoint Properties Australia Limited – Current, appointed 19 March 2012
Richard Goodmanson Qantas Airways Limited – Current, appointed 19 June 2008Rio Tinto Limited – Ceased, appointed 1 December 2004 and ceased 5 May 2016
Rio Tinto plc – Ceased, appointed 1 December 2004 and ceased 5 May 2016
Jacqueline Hey Qantas Airways Limited – Current, appointed 29 August 2013
AGL Energy Limited – Current, appointed 21 March 2016
Australian Foundation Investment Company – Current, appointed 31 July 2013
Bendigo and Adelaide Bank Limited – Current, appointed 5 July 2011
Michael L’Estrange Qantas Airways Limited – Current, appointed 7 April 2016
Rio Tinto Limited – Current, appointed 1 September 2014
Rio Tinto plc – Current, appointed 1 September 2014
William Meaney Qantas Airways Limited – Current, appointed 15 February 2012
Iron Mountain Inc – Current, appointed 7 January 2013
Paul Rayner Qantas Airways Limited – Current, appointed 16 July 2008
Treasury Wine Estates Limited – Current, appointed 9 May 2011
Boral Limited – Current, appointed 5 September 2008
Centrica plc – Ceased, appointed 22 September 2004 and ceased 31 December 2014
Todd Sampson Qantas Airways Limited – Current, appointed 25 February 2015
Fairfax Media Limited – Current, appointed 29 May 2014
Barbara Ward Qantas Airways Limited – Current, appointed 19 June 2008
Caltex Australia Limited – Current, appointed 1 April 2015
Brookfield Capital Management Limited1 – Current, appointed 1 January 2010
Brookfield Funds Management Limited2 – Current, appointed 22 October 2003
1 Responsible entity for the Brookfield Prime Property Fund and the Multiplex European Property Fund, both of which are listed Australian registered managed investment schemes. Previously responsible entity for the Brookfield Australian Opportunities Fund, which was wound up on 30 October 2012.
2 Responsible entity for the Multiplex SITES Trust, which is a listed Australian registered managed investment scheme.
QUALIFICATIONS AND EXPERIENCE OF EACH PERSON WHO IS A COMPANY SECRETARY OF QANTAS AS AT 30 JUNE 2016
Andrew John Finch – Appointed as Company Secretary on 31 March 2014 – Joined Qantas on 1 November 2012 – 2002 to 2012 – Mergers and Acquisitions Partner at Allens, Sydney – 1999 to 2001 – Managing Associate at Linklaters, London – 1993 to 1999 – Various roles at Allens, Sydney (previously Allens Arthur Robinson and Allen Allen
& Hemsley), including Senior Associate (1997 to 1999) and Solicitor (1993 to 1997) – Admitted as a solicitor of the Supreme Court of NSW in 1993
Anna Rachel Pritchard – Appointed as a Company Secretary on 22 June 2016 – Joined Qantas on 23 August 2010 – 2005 to 2010 – Solicitor at Allens Arthur Robinson, Sydney – 2001 to 2005 – Solicitor at the Australian Government Solicitor – Admitted as a solicitor of the Supreme Court of NSW, the High Court of Australia and the High Court
of New Zealand in 2001
John David Francis Morris – Appointed as a Company Secretary on 9 April 2014 – Joined Qantas on 28 March 2010 – 2002 to 2008 – General Counsel and Company Secretary at KAZ Group – 1997 to 2002 – Solicitor then Senior Associate at Ashurst (previously Blake Dawson Waldron) – Admitted as a solicitor of the Supreme Court of Victoria in 1992
27
Q A N T A S A N N U A L R E P O R T 2 0 1 6

Directors’ Report continuedFor the year ended 30 June 2016
DIRECTORS’ INTERESTS AND BENEFITS
Particulars of Directors’ interests in the issued capital of Qantas at the date of this Report are as follows:
Number of Shares
Directors 2016 2015
Leigh Clifford 362,613 291,622
Alan Joyce 2,728,924 5,379,721
Maxine Brenner 30,065 21,900
Richard Goodmanson 18,780 20,000
Jacqueline Hey 38,170 30,000
Michael L’Estrange – n/a
William Meaney – –
Paul Rayner 220,324 201,622
Todd Sampson 4,695 5,000
Barbara Ward 44,694 47,597
In addition to the interests shown, indirect interests in Qantas shares held in trust on behalf of Mr Joyce are as follows:
Deferred shares held in trust under:
2014/15 Short Term Incentive Plan 258,0621 274,826
2015/16 Short Term Incentive Plan 490,7382 –
1 The number of deferred shares awarded under the 2014/15 Short Term Incentive Plan were impacted by the share consolidation completed on 6 November 2015 through the conversion of each share into 0.939 shares.
2 The deferred shares under the 2015/16 Short Term Incentive Plan are awarded to Mr Joyce on 2 September 2016.
Number of Rights
2016 2015
Rights granted under:
2014–2016 Long Term Incentive Plan –1 2,151,000
2015–2017 Long Term Incentive Plan 3,248,0002 3,248,000
2016–2018 Long Term Incentive Plan 947,0003 –
Total rights 4,195,000 5,399,000
1 100 per cent of the 2014–2016 Long Term Incentive Plan Rights awarded to Mr Joyce on 18 October 2013 vested and converted to 2,151,000 shares following the performance hurdle testing conducted as at 30 June 2016.
2 Shareholders approved the award of these Rights on 24 October 2014. Performance hurdles will be tested as at 30 June 2017 to determine whether any Rights vest to Mr Joyce. 3 Shareholders approved the award of these Rights on 23 October 2015. Performance hurdles will be tested as at 30 June 2018 to determine whether any Rights vest to Mr Joyce.
RIGHTS
Performance Rights are awarded to select Qantas Group Executives under the Qantas Deferred Share Plan (DSP) and the Qantas Employee Share Plan (ESP). Refer to pages 38 to 40 for further details.
The following table outlines the movements in Rights during the year:
Number of Rights
Performance Rights Reconciliation 2016 2015
Rights outstanding as at 1 July 80,309,588 33,579,432
Rights granted 6,086,500 64,317,000
Rights forfeited (3,995,000) (1,914,000)
Rights lapsed (1,719,450) (15,614,000)
Rights exercised (9,790,023) (58,844)
Rights outstanding as at 30 June 70,891,6151 80,309,588
1 The movement of Rights outstanding as at 30 June 2016 to the date of this Report is explained in the footnotes on page 29.
28
Q A N T A S A N N U A L R E P O R T 2 0 1 6
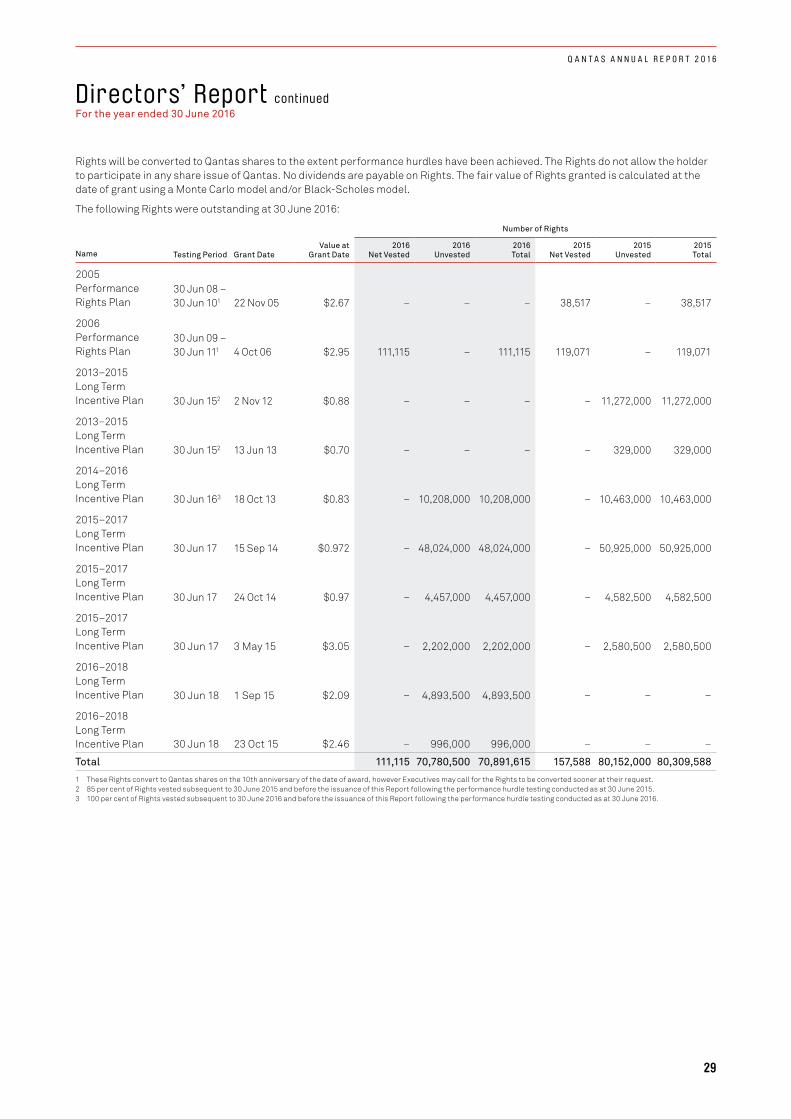
Directors’ Report continuedFor the year ended 30 June 2016
Rights will be converted to Qantas shares to the extent performance hurdles have been achieved. The Rights do not allow the holder to participate in any share issue of Qantas. No dividends are payable on Rights. The fair value of Rights granted is calculated at the date of grant using a Monte Carlo model and/or Black-Scholes model.
The following Rights were outstanding at 30 June 2016:
Number of Rights
Name Testing Period Grant DateValue at
Grant Date2016
Net Vested2016
Unvested2016
Total2015
Net Vested2015
Unvested2015
Total
2005 Performance Rights Plan
30 Jun 08 –30 Jun 101 22 Nov 05 $2.67 – – – 38,517 – 38,517
2006 Performance Rights Plan
30 Jun 09 –30 Jun 111 4 Oct 06 $2.95 111,115 – 111,115 119,071 – 119,071
2013–2015 Long Term Incentive Plan 30 Jun 152 2 Nov 12 $0.88 – – – – 11,272,000 11,272,000
2013–2015 Long Term Incentive Plan 30 Jun 152 13 Jun 13 $0.70 – – – – 329,000 329,000
2014–2016 Long Term Incentive Plan 30 Jun 163 18 Oct 13 $0.83 – 10,208,000 10,208,000 – 10,463,000 10,463,000
2015–2017 Long Term Incentive Plan 30 Jun 17 15 Sep 14 $0.972 – 48,024,000 48,024,000 – 50,925,000 50,925,000
2015–2017 Long Term Incentive Plan 30 Jun 17 24 Oct 14 $0.97 – 4,457,000 4,457,000 – 4,582,500 4,582,500
2015–2017 Long Term Incentive Plan 30 Jun 17 3 May 15 $3.05 – 2,202,000 2,202,000 – 2,580,500 2,580,500
2016–2018 Long Term Incentive Plan 30 Jun 18 1 Sep 15 $2.09 – 4,893,500 4,893,500 – – –
2016–2018 Long Term Incentive Plan 30 Jun 18 23 Oct 15 $2.46 – 996,000 996,000 – – –
Total 111,115 70,780,500 70,891,615 157,588 80,152,000 80,309,588
1 These Rights convert to Qantas shares on the 10th anniversary of the date of award, however Executives may call for the Rights to be converted sooner at their request.2 85 per cent of Rights vested subsequent to 30 June 2015 and before the issuance of this Report following the performance hurdle testing conducted as at 30 June 2015.3 100 per cent of Rights vested subsequent to 30 June 2016 and before the issuance of this Report following the performance hurdle testing conducted as at 30 June 2016.
29
Q A N T A S A N N U A L R E P O R T 2 0 1 6

Directors’ Report continuedFor the year ended 30 June 2016
COVER LETTER TO THE REMUNERATION REPORT
Dear Shareholder,
The Remuneration Report sets out remuneration information for the Chief Executive Officer (CEO), direct reports to the CEO (Executive Management) and Non-Executive Directors.
In addition to the detailed Remuneration Report, we have provided an introduction to the Report which contains a summary of: – The Remuneration Framework and how it was applied for the 2015/2016 financial year – The remuneration outcomes for the CEO
Qantas’ Remuneration Policy
Qantas is committed to having remuneration outcomes that are aligned with performance and the creation of shareholder value. The commitment and practice is demonstrated in 2015/2016 and also in the five years prior where:
– Annual incentives were not paid to the CEO in two years (2011/2012 and 2013/2014), partial awards were paid in two years (2010/2011 and 2012/2013), and above ‘At Target’ was paid once (2014/2015)
– Long Term Incentive Plan (LTIP) awards partially vested once (2014/2015) and did not vest at all in the four previous years
The Remuneration Report includes further details of the history of incentive plan outcomes on page 33.
Qantas’ Performance in 2015/2016
2015/2016 was an outstanding year for Qantas. Over the financial year, Qantas continued to improve the customer experience, exceeded its commitments under the Qantas Transformation program, and has delivered a record financial result and returned over $1 billion to shareholders.
All employees can be very proud of their contribution to these results.
Remuneration Outcomes in 2015/2016
Fixed Remuneration – During 2015/2016 our restrained approach to fixed remuneration increases continued.
Variable Remuneration – The 2015/2016 remuneration outcomes for the CEO and Executive Management align with Qantas’ performance and the creation of shareholder value.
Annual Incentive Outcomes:
Annual incentives were paid to the CEO and Executive Management based on their contribution to the achievement of the 2015/16 Short Term Incentive Plan’s (STIP) ‘scorecard’ of financial and non-financial performance targets. The Board reviewed the performance of the CEO and Executive Management, and concluded that their actions were instrumental in the achievement of these targets.
Management achieved $357 million growth of passenger revenue largely driven by increased utilisation of existing Group aircraft, continued growth of non-cyclical earnings through delivery of Qantas Loyalty’s diversification strategy, and delivered a strong improvement from Jetstar Group Airlines in Asia (Singapore, Japan and Vietnam) which reported a healthy combined profit.
Management also achieved the objectives of the Group’s Financial Framework: – Achieving optimal capital structure with investment grade level credit ratings restored by Moody’s Investor Services and
Standard and Poor’s – Achieving Return on Invested Capital (ROIC) of 23 per cent – Being disciplined in the allocation of capital and were able to return $1 billion to shareholders through both a share buy-back
and a return of capital
The Board assessed performance against the ‘scorecard’ at 160 per cent of target. The Remuneration Report includes further detail of the Board’s assessment of the CEO and Executive Management’s contribution to these results.
Long Term Incentive Outcomes:
Under the 2014–2016 LTIP, a fixed number of Rights were awarded to the CEO and Executive Management in 2013. Based on Qantas’ Total Shareholder Return (of +109 per cent) over the three year performance period, the Rights all converted to Qantas shares.
The value of this fixed number of shares increases or decreases depending on the share price at the time of vesting. Over the three year performance period of the 2014–2016 LTIP, Qantas’ share price increased from $1.35 to $2.82. In the remuneration outcomes table, we have disclosed the value of these shares at the start of the performance period and have also disclosed the increase in the value of these shares that has been driven by share price growth over the performance period.
The Board remains committed to a Remuneration Framework that is aligned to the Qantas Group strategy, is performance-based, attracts, motivates and appropriately rewards Management, meets shareholders’ requirements and encourages decision-making that is focused on the longer-term.
Paul RaynerChair, Remuneration Committee
REMUNER ATION REPORT (AUDITED)
30
Q A N T A S A N N U A L R E P O R T 2 0 1 6
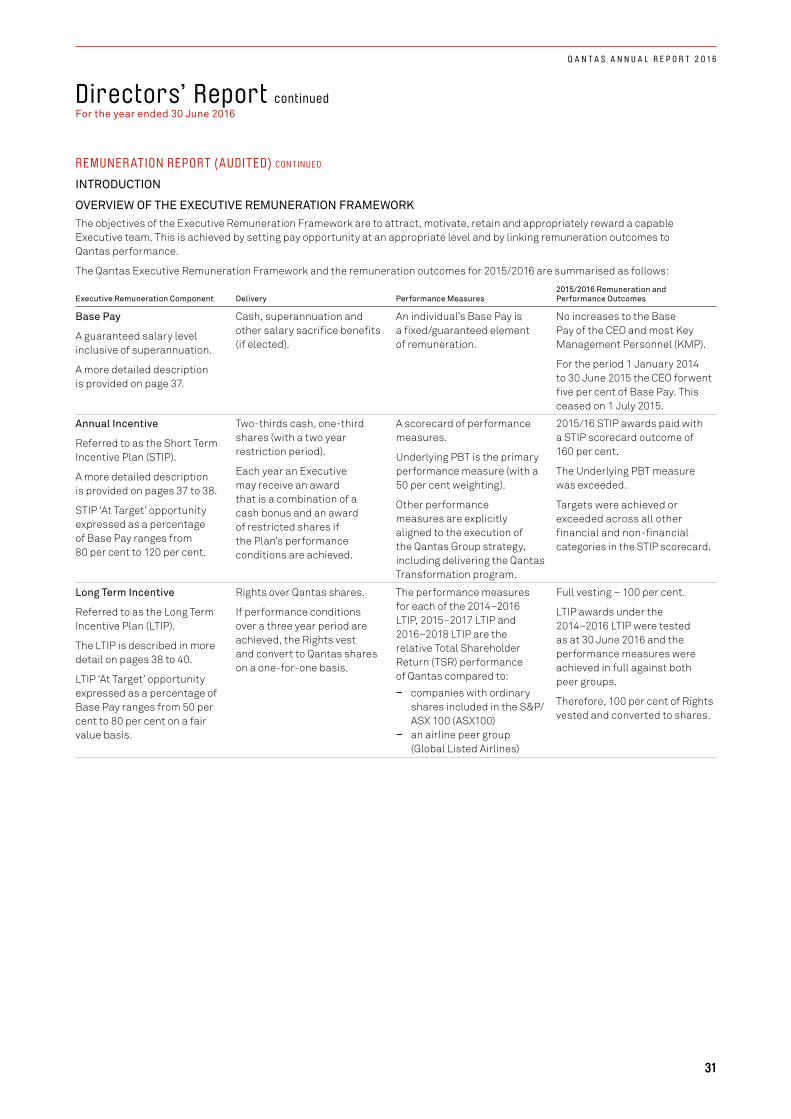
Directors’ Report continuedFor the year ended 30 June 2016
REMUNER ATION REPORT (AUDITED) C ON T INUE D
INTRODUCTION
OVERVIEW OF THE EXECUTIVE REMUNERATION FRAMEWORKThe objectives of the Executive Remuneration Framework are to attract, motivate, retain and appropriately reward a capable Executive team. This is achieved by setting pay opportunity at an appropriate level and by linking remuneration outcomes to Qantas performance.
The Qantas Executive Remuneration Framework and the remuneration outcomes for 2015/2016 are summarised as follows:
Executive Remuneration Component Delivery Performance Measures2015/2016 Remuneration and Performance Outcomes
Base Pay
A guaranteed salary level inclusive of superannuation.
A more detailed description is provided on page 37.
Cash, superannuation and other salary sacrifice benefits (if elected).
An individual’s Base Pay is a fixed/guaranteed element of remuneration.
No increases to the Base Pay of the CEO and most Key Management Personnel (KMP).
For the period 1 January 2014 to 30 June 2015 the CEO forwent five per cent of Base Pay. This ceased on 1 July 2015.
Annual Incentive
Referred to as the Short Term Incentive Plan (STIP).
A more detailed description is provided on pages 37 to 38.
STIP ‘At Target’ opportunity expressed as a percentage of Base Pay ranges from 80 per cent to 120 per cent.
Two-thirds cash, one-third shares (with a two year restriction period).
Each year an Executive may receive an award that is a combination of a cash bonus and an award of restricted shares if the Plan’s performance conditions are achieved.
A scorecard of performance measures.
Underlying PBT is the primary performance measure (with a 50 per cent weighting).
Other performance measures are explicitly aligned to the execution of the Qantas Group strategy, including delivering the Qantas Transformation program.
2015/16 STIP awards paid with a STIP scorecard outcome of 160 per cent.
The Underlying PBT measure was exceeded.
Targets were achieved or exceeded across all other financial and non-financial categories in the STIP scorecard.
Long Term Incentive
Referred to as the Long Term Incentive Plan (LTIP).
The LTIP is described in more detail on pages 38 to 40.
LTIP ‘At Target’ opportunity expressed as a percentage of Base Pay ranges from 50 per cent to 80 per cent on a fair value basis.
Rights over Qantas shares.
If performance conditions over a three year period are achieved, the Rights vest and convert to Qantas shares on a one-for-one basis.
The performance measures for each of the 2014–2016 LTIP, 2015–2017 LTIP and 2016–2018 LTIP are the relative Total Shareholder Return (TSR) performance of Qantas compared to:
– companies with ordinary shares included in the S&P/ASX 100 (ASX100)
– an airline peer group (Global Listed Airlines)
Full vesting – 100 per cent.
LTIP awards under the 2014–2016 LTIP were tested as at 30 June 2016 and the performance measures were achieved in full against both peer groups.
Therefore, 100 per cent of Rights vested and converted to shares.
31
Q A N T A S A N N U A L R E P O R T 2 0 1 6
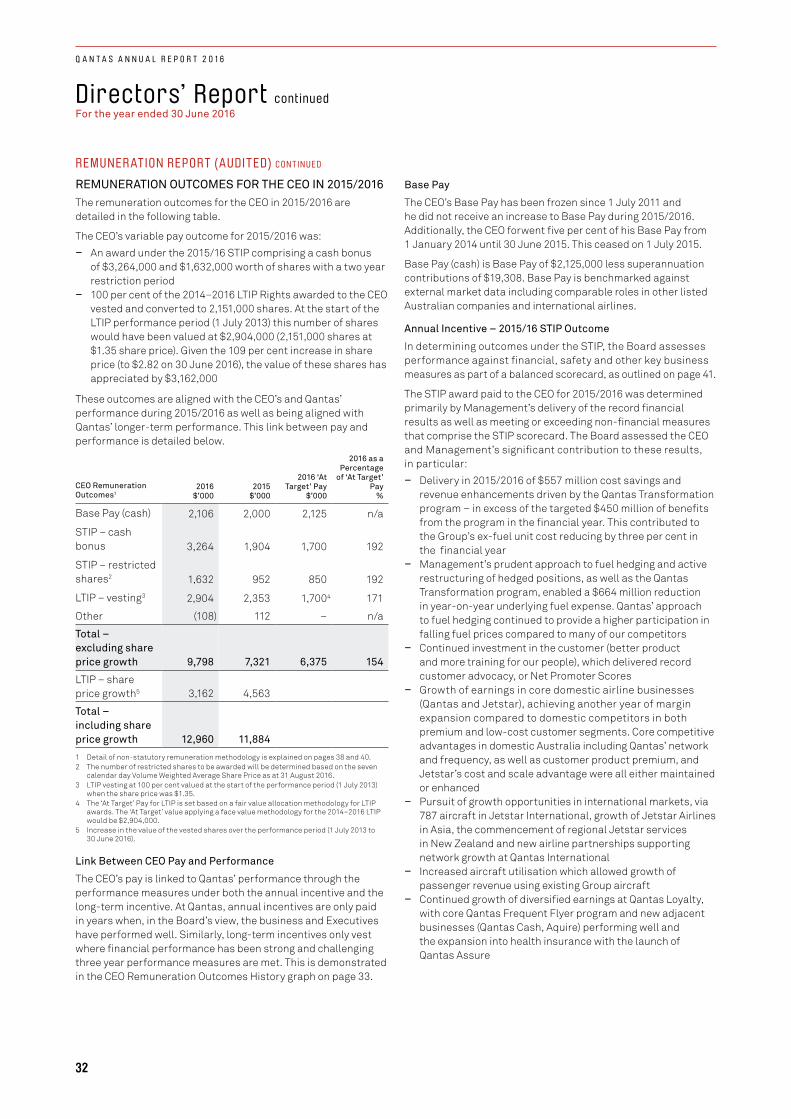
Directors’ Report continuedFor the year ended 30 June 2016
REMUNER ATION REPORT (AUDITED) C ON T INUE D
REMUNERATION OUTCOMES FOR THE CEO IN 2015/2016The remuneration outcomes for the CEO in 2015/2016 are detailed in the following table.
The CEO’s variable pay outcome for 2015/2016 was: – An award under the 2015/16 STIP comprising a cash bonus
of $3,264,000 and $1,632,000 worth of shares with a two year restriction period
– 100 per cent of the 2014–2016 LTIP Rights awarded to the CEO vested and converted to 2,151,000 shares. At the start of the LTIP performance period (1 July 2013) this number of shares would have been valued at $2,904,000 (2,151,000 shares at $1.35 share price). Given the 109 per cent increase in share price (to $2.82 on 30 June 2016), the value of these shares has appreciated by $3,162,000
These outcomes are aligned with the CEO’s and Qantas’ performance during 2015/2016 as well as being aligned with Qantas’ longer-term performance. This link between pay and performance is detailed below.
CEO Remuneration Outcomes1
2016 $’000
2015 $’000
2016 ‘At Target’ Pay
$’000
2016 as a Percentage
of ‘At Target’ Pay
%
Base Pay (cash) 2,106 2,000 2,125 n/a
STIP – cash bonus 3,264 1,904 1,700 192
STIP – restricted shares2 1,632 952 850 192
LTIP – vesting3 2,904 2,353 1,7004 171
Other (108) 112 – n/a
Total – excluding share price growth 9,798 7,321 6,375 154
LTIP – share price growth5 3,162 4,563
Total – including share price growth 12,960 11,884
1 Detail of non-statutory remuneration methodology is explained on pages 38 and 40.2 The number of restricted shares to be awarded will be determined based on the seven
calendar day Volume Weighted Average Share Price as at 31 August 2016.3 LTIP vesting at 100 per cent valued at the start of the performance period (1 July 2013)
when the share price was $1.35.4 The ‘At Target’ Pay for LTIP is set based on a fair value allocation methodology for LTIP
awards. The ‘At Target’ value applying a face value methodology for the 2014–2016 LTIP would be $2,904,000.
5 Increase in the value of the vested shares over the performance period (1 July 2013 to 30 June 2016).
Link Between CEO Pay and Performance
The CEO’s pay is linked to Qantas’ performance through the performance measures under both the annual incentive and the long-term incentive. At Qantas, annual incentives are only paid in years when, in the Board’s view, the business and Executives have performed well. Similarly, long-term incentives only vest where financial performance has been strong and challenging three year performance measures are met. This is demonstrated in the CEO Remuneration Outcomes History graph on page 33.
Base Pay
The CEO’s Base Pay has been frozen since 1 July 2011 and he did not receive an increase to Base Pay during 2015/2016. Additionally, the CEO forwent five per cent of his Base Pay from 1 January 2014 until 30 June 2015. This ceased on 1 July 2015.
Base Pay (cash) is Base Pay of $2,125,000 less superannuation contributions of $19,308. Base Pay is benchmarked against external market data including comparable roles in other listed Australian companies and international airlines.
Annual Incentive – 2015/16 STIP Outcome
In determining outcomes under the STIP, the Board assesses performance against financial, safety and other key business measures as part of a balanced scorecard, as outlined on page 41.
The STIP award paid to the CEO for 2015/2016 was determined primarily by Management’s delivery of the record financial results as well as meeting or exceeding non-financial measures that comprise the STIP scorecard. The Board assessed the CEO and Management’s significant contribution to these results, in particular:
– Delivery in 2015/2016 of $557 million cost savings and revenue enhancements driven by the Qantas Transformation program – in excess of the targeted $450 million of benefits from the program in the financial year. This contributed to the Group’s ex-fuel unit cost reducing by three per cent in the financial year
– Management’s prudent approach to fuel hedging and active restructuring of hedged positions, as well as the Qantas Transformation program, enabled a $664 million reduction in year-on-year underlying fuel expense. Qantas’ approach to fuel hedging continued to provide a higher participation in falling fuel prices compared to many of our competitors
– Continued investment in the customer (better product and more training for our people), which delivered record customer advocacy, or Net Promoter Scores
– Growth of earnings in core domestic airline businesses (Qantas and Jetstar), achieving another year of margin expansion compared to domestic competitors in both premium and low-cost customer segments. Core competitive advantages in domestic Australia including Qantas’ network and frequency, as well as customer product premium, and Jetstar’s cost and scale advantage were all either maintained or enhanced
– Pursuit of growth opportunities in international markets, via 787 aircraft in Jetstar International, growth of Jetstar Airlines in Asia, the commencement of regional Jetstar services in New Zealand and new airline partnerships supporting network growth at Qantas International
– Increased aircraft utilisation which allowed growth of passenger revenue using existing Group aircraft
– Continued growth of diversified earnings at Qantas Loyalty, with core Qantas Frequent Flyer program and new adjacent businesses (Qantas Cash, Aquire) performing well and the expansion into health insurance with the launch of Qantas Assure
32
Q A N T A S A N N U A L R E P O R T 2 0 1 6
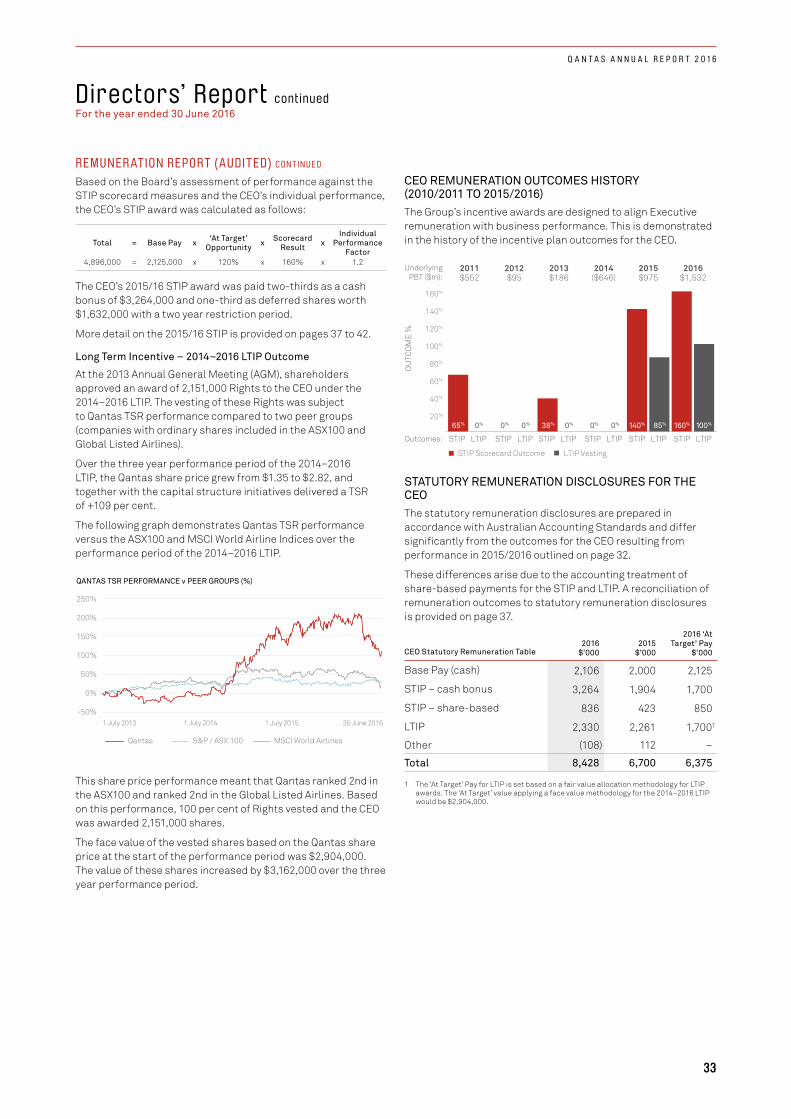
Directors’ Report continuedFor the year ended 30 June 2016
REMUNER ATION REPORT (AUDITED) C ON T INUE D
Based on the Board’s assessment of performance against the STIP scorecard measures and the CEO’s individual performance, the CEO’s STIP award was calculated as follows:
Total = Base Pay x ‘At Target’ Opportunity x Scorecard
Result xIndividual
Performance Factor
4,896,000 = 2,125,000 x 120% x 160% x 1.2
The CEO’s 2015/16 STIP award was paid two-thirds as a cash bonus of $3,264,000 and one-third as deferred shares worth $1,632,000 with a two year restriction period.
More detail on the 2015/16 STIP is provided on pages 37 to 42.
Long Term Incentive – 2014–2016 LTIP Outcome
At the 2013 Annual General Meeting (AGM), shareholders approved an award of 2,151,000 Rights to the CEO under the 2014–2016 LTIP. The vesting of these Rights was subject to Qantas TSR performance compared to two peer groups (companies with ordinary shares included in the ASX100 and Global Listed Airlines).
Over the three year performance period of the 2014–2016 LTIP, the Qantas share price grew from $1.35 to $2.82, and together with the capital structure initiatives delivered a TSR of +109 per cent.
The following graph demonstrates Qantas TSR performance versus the ASX100 and MSCI World Airline Indices over the performance period of the 2014–2016 LTIP.
-50%
0%
50%
100%
150%
200%
250%
QANTAS TSR PERFORMANCE v PEER GROUPS (%)
Qantas S&P / ASX 100 MSCI World Airlines
1 July 2013 1 July 2014 1 July 2015 30 June 2016
This share price performance meant that Qantas ranked 2nd in the ASX100 and ranked 2nd in the Global Listed Airlines. Based on this performance, 100 per cent of Rights vested and the CEO was awarded 2,151,000 shares.
The face value of the vested shares based on the Qantas share price at the start of the performance period was $2,904,000. The value of these shares increased by $3,162,000 over the three year performance period.
CEO REMUNERATION OUTCOMES HISTORY (2010/2011 TO 2015/2016)The Group’s incentive awards are designed to align Executive remuneration with business performance. This is demonstrated in the history of the incentive plan outcomes for the CEO.
20%
40%
60%
80%
100%
120%
140%
160%
2011$552
2012$95
2013$186
2014($646)
2015$975
2016$1,532
65%
0% 0% 0% 0% 0% 0%
STIP LTIP STIP LTIP STIP LTIP STIP LTIP STIP LTIP STIP LTIP
OU
TCO
ME
%
LTIP VestingSTIP Scorecard Outcome
Outcomes:
UnderlyingPBT ($m):
100%160%85%140%38%65%
STATUTORY REMUNERATION DISCLOSURES FOR THE CEOThe statutory remuneration disclosures are prepared in accordance with Australian Accounting Standards and differ significantly from the outcomes for the CEO resulting from performance in 2015/2016 outlined on page 32.
These differences arise due to the accounting treatment of share-based payments for the STIP and LTIP. A reconciliation of remuneration outcomes to statutory remuneration disclosures is provided on page 37.
CEO Statutory Remuneration Table2016
$’0002015
$’000
2016 ‘At Target’ Pay
$’000
Base Pay (cash) 2,106 2,000 2,125
STIP – cash bonus 3,264 1,904 1,700
STIP – share-based 836 423 850
LTIP 2,330 2,261 1,7001
Other (108) 112 –
Total 8,428 6,700 6,375
1 The ‘At Target’ Pay for LTIP is set based on a fair value allocation methodology for LTIP awards. The ‘At Target’ value applying a face value methodology for the 2014–2016 LTIP would be $2,904,000.
33
Q A N T A S A N N U A L R E P O R T 2 0 1 6
Directors’ Report continuedFor the year ended 30 June 2016
REMUNER ATION REPORT (AUDITED) C ON T INUE D
REMUNERATION REPORT FOR THE YEAR ENDED 30 JUNE 2016The Remuneration Report sets out remuneration information for the CEO, Executive Management and Non-Executive Directors.
Section 300A of the Corporations Act 2001 requires disclosure of remuneration information for KMP, with KMP defined in Australian Accounting Standard AASB 124 Related Party Disclosures as those persons having authority and responsibility for planning, directing and controlling the activities of the entity, directly or indirectly, including any Director (whether executive or otherwise) of that entity.
1) EXECUTIVE REMUNERATION OBJECTIVES AND APPROACHIn determining Executive remuneration, the Board aims to do the following:
– Attract, retain and appropriately reward a capable Executive team – Motivate the Executive team to meet the unique challenges the company faces as a major international airline based in Australia – Link remuneration to performance of the business and the performance of the Executives
To achieve this, Executive remuneration is set with regard to the size and nature of the role (with reference to market benchmarks) and the performance of the individual in the role. Remuneration includes ‘at risk’ or performance-related elements for which the objectives are to:
– Link Executive reward with Qantas’ business objectives, financial performance and the performance of the Executives – Align the interests of Executives with shareholders – Support a culture of Executive share ownership – Support the retention of Executives
2) ROLE OF THE REMUNERATION COMMITTEEThe Remuneration Committee (a Committee of the Board, whose members are detailed on pages 8 to 11 has the role of reviewing and making recommendations to the Board on specific Executive remuneration matters at Qantas and ensuring remuneration decisions are appropriate from the perspectives of business performance, Executive performance, governance, disclosure, reward levels and market conditions.
In fulfilling its role, the Remuneration Committee is specifically concerned with ensuring that its approach will: – Motivate the CEO, Executive Management and the broader Executive team to pursue the long-term growth and success of Qantas – Demonstrate a clear relationship between pay and performance – Ensure an appropriate balance between ‘fixed’ and ‘variable’ remuneration, reflecting both the short-term and long-term
performance objectives of Qantas – Differentiate between higher and lower performers through the use of a performance management framework
During 2015/2016, the Remuneration Committee re-appointed Ernst & Young (EY) as its remuneration consultant. The Remuneration Committee has established protocols in relation to the appointment and use of remuneration consultants to support compliance with the Corporations Act 2001, which are incorporated into the terms of engagement with EY.
The Remuneration Committee did not request any remuneration consultants to provide a remuneration recommendation during 2015/2016.
3) EXECUTIVE REMUNERATION FRAMEWORKThe Executive Remuneration Framework as it applies to the CEO and Executive Management contains three elements:
– Base Pay – a guaranteed salary level inclusive of superannuation – Annual Incentive – referred to as the Short Term Incentive Plan (STIP) – Long Term Incentive – referred to as the Long Term Incentive Plan (LTIP)
4) REVIEW OF REMUNERATION FRAMEWORKDuring 2015/2016, the Remuneration Committee reviewed the Remuneration Framework to ensure it continued to be aligned with Qantas’ business strategy. The review focused on LTIP, in particular:
– LTIP Performance Measures: the Remuneration Committee considered a number of alternate LTIP performance measures, such as Return on Invested Capital (ROIC). The Committee concluded that the current LTIP performance measures, of relative TSR of Qantas compared to companies in the ASX100 and Global Listed Airlines, remain the most appropriate measures as they are explicitly aligned to the objectives of Qantas’ Financial Framework.
– LTIP Allocation Methodology (fair value versus face value): the Remuneration Committee reviewed the allocation methodology used to determine the number of Rights granted under the LTIP. The Committee determined that any change in allocation methodology from a ‘fair value’ to a ‘face value’ would not result in a change to the number of Rights awarded to Executives. Therefore, the Committee decided to retain the current ‘fair value’ allocation methodology, but to disclose equivalent ‘face value’ information to improve transparency to shareholders.
34
Q A N T A S A N N U A L R E P O R T 2 0 1 6
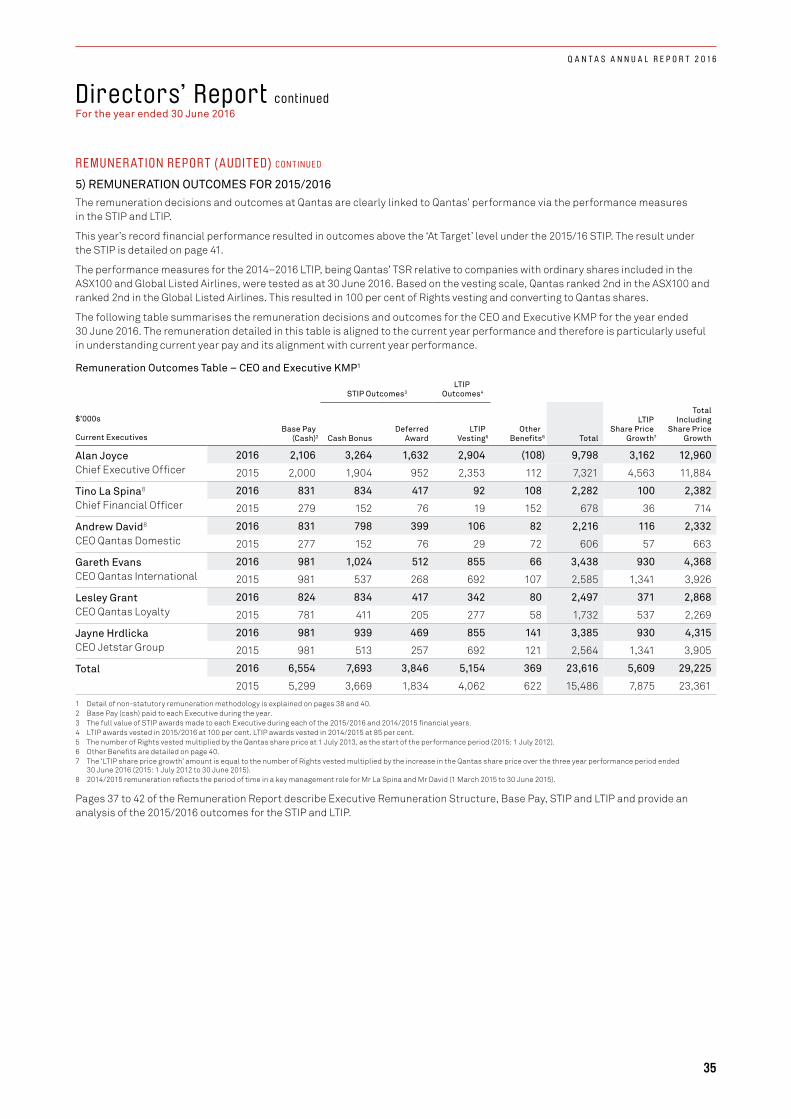
Directors’ Report continuedFor the year ended 30 June 2016
REMUNER ATION REPORT (AUDITED) C ON T INUE D
5) REMUNERATION OUTCOMES FOR 2015/2016The remuneration decisions and outcomes at Qantas are clearly linked to Qantas’ performance via the performance measures in the STIP and LTIP.
This year’s record financial performance resulted in outcomes above the ‘At Target’ level under the 2015/16 STIP. The result under the STIP is detailed on page 41.
The performance measures for the 2014–2016 LTIP, being Qantas’ TSR relative to companies with ordinary shares included in the ASX100 and Global Listed Airlines, were tested as at 30 June 2016. Based on the vesting scale, Qantas ranked 2nd in the ASX100 and ranked 2nd in the Global Listed Airlines. This resulted in 100 per cent of Rights vesting and converting to Qantas shares.
The following table summarises the remuneration decisions and outcomes for the CEO and Executive KMP for the year ended 30 June 2016. The remuneration detailed in this table is aligned to the current year performance and therefore is particularly useful in understanding current year pay and its alignment with current year performance.
Remuneration Outcomes Table – CEO and Executive KMP1
STIP Outcomes3LTIP
Outcomes4
$’000s
Current Executives Base Pay (Cash)2 Cash Bonus
Deferred Award
LTIPVesting5
Other Benefits6 Total
LTIP Share Price
Growth7
Total Including
Share Price Growth
Alan Joyce Chief Executive Officer
2016 2,106 3,264 1,632 2,904 (108) 9,798 3,162 12,960
2015 2,000 1,904 952 2,353 112 7,321 4,563 11,884
Tino La Spina8
Chief Financial Officer2016 831 834 417 92 108 2,282 100 2,382
2015 279 152 76 19 152 678 36 714
Andrew David8
CEO Qantas Domestic2016 831 798 399 106 82 2,216 116 2,332
2015 277 152 76 29 72 606 57 663
Gareth Evans CEO Qantas International
2016 981 1,024 512 855 66 3,438 930 4,368
2015 981 537 268 692 107 2,585 1,341 3,926
Lesley Grant CEO Qantas Loyalty
2016 824 834 417 342 80 2,497 371 2,868
2015 781 411 205 277 58 1,732 537 2,269
Jayne Hrdlicka CEO Jetstar Group
2016 981 939 469 855 141 3,385 930 4,315
2015 981 513 257 692 121 2,564 1,341 3,905
Total
2016 6,554 7,693 3,846 5,154 369 23,616 5,609 29,225
2015 5,299 3,669 1,834 4,062 622 15,486 7,875 23,361
1 Detail of non-statutory remuneration methodology is explained on pages 38 and 40.2 Base Pay (cash) paid to each Executive during the year.3 The full value of STIP awards made to each Executive during each of the 2015/2016 and 2014/2015 financial years.4 LTIP awards vested in 2015/2016 at 100 per cent. LTIP awards vested in 2014/2015 at 85 per cent.5 The number of Rights vested multiplied by the Qantas share price at 1 July 2013, as the start of the performance period (2015: 1 July 2012).6 Other Benefits are detailed on page 40.7 The ‘LTIP share price growth’ amount is equal to the number of Rights vested multiplied by the increase in the Qantas share price over the three year performance period ended
30 June 2016 (2015: 1 July 2012 to 30 June 2015). 8 2014/2015 remuneration reflects the period of time in a key management role for Mr La Spina and Mr David (1 March 2015 to 30 June 2015).
Pages 37 to 42 of the Remuneration Report describe Executive Remuneration Structure, Base Pay, STIP and LTIP and provide an analysis of the 2015/2016 outcomes for the STIP and LTIP.
35
Q A N T A S A N N U A L R E P O R T 2 0 1 6

Directors’ Report continuedFor the year ended 30 June 2016
REMUNER ATION REPORT (AUDITED) C ON T INUE D
6) STATUTORY REMUNERATION DISCLOSURES FOR 2015/2016The statutory remuneration disclosures for the year ended 30 June 2016 are detailed below and are prepared in accordance with Australian Accounting Standards and differ from the 2015/2016 remuneration outcomes outlined above. These differences arise due to the accounting treatment of share-based payments for the STIP and LTIP.
Statutory Remuneration Table – CEO and Executive KMP
Incentive Plan – Accounting Accrual Other Benefits
$’000sEquity-settled
Share-based Payments
Current Executives
Base Pay (Cash)1
STIP Cash Bonus1
Deferred Shares Rights Sub-total
Non-cash Benefits1,3
Post- employment Benefits4
Other Long-term Benefits5 Sub-total Total
Alan Joyce2
Chief Executive Officer
2016 2,106 3,264 836 2,330 8,536 30 63 (201) (108) 8,428
2015 2,000 1,904 423 2,261 6,588 63 70 (21) 112 6,700
Tino La Spina6
Chief Financial Officer
2016 831 834 178 323 2,166 43 41 24 108 2,274
2015 279 152 17 76 524 24 32 96 152 676
Andrew David6
CEO Qantas Domestic
2016 831 798 505 348 2,482 38 41 3 82 2,564
2015 277 152 128 86 643 20 32 20 72 715
Gareth Evans CEO Qantas International
2016 981 1,024 252 694 2,951 19 41 6 66 3,017
2015 981 537 126 760 2,404 39 44 24 107 2,511
Lesley Grant CEO Qantas Loyalty
2016 824 834 201 408 2,267 35 48 (3) 80 2,347
2015 781 411 96 351 1,639 20 44 (6) 58 1,697
Jayne Hrdlicka CEO Jetstar Group
2016 981 939 234 694 2,848 70 41 30 141 2,989
2015 981 513 119 760 2,373 76 44 1 121 2,494
Total
2016 6,554 7,693 2,206 4,797 21,250 235 275 (141) 369 21,619
2015 5,299 3,669 909 4,294 14,171 242 266 114 622 14,793
1 Short-term employee benefits include Base Pay (cash), STIP cash bonus and non-cash benefits.2 Base Pay (cash) for Mr Joyce is Base Pay of $2,125,000 less superannuation contributions of $19,308. For 2015 Base Pay was $2,125,000 less Base Pay forgone of $106,250 less
superannuation contributions of $18,783.3 Non-cash Benefits include the value of travel benefits whilst employed and other minor benefits.4 Post-employment Benefits include superannuation and an accrual for post-employment travel of $44,000 for Mr Joyce and $22,000 for each other Executive (2015: $51,000 for Mr Joyce
and $25,000 for each other Executive).5 Other Long-term Benefits include movement in annual leave and long service leave balances. The accounting value of other long-term benefits may be negative, for example where an
Executive’s annual leave balance decreases as a result of taking more than the 20 days annual leave they accrue during the year.6 2014/2015 remuneration reflects the period of time in a key management role for Mr La Spina and Mr David (1 March 2015 to 30 June 2015).
36
Q A N T A S A N N U A L R E P O R T 2 0 1 6
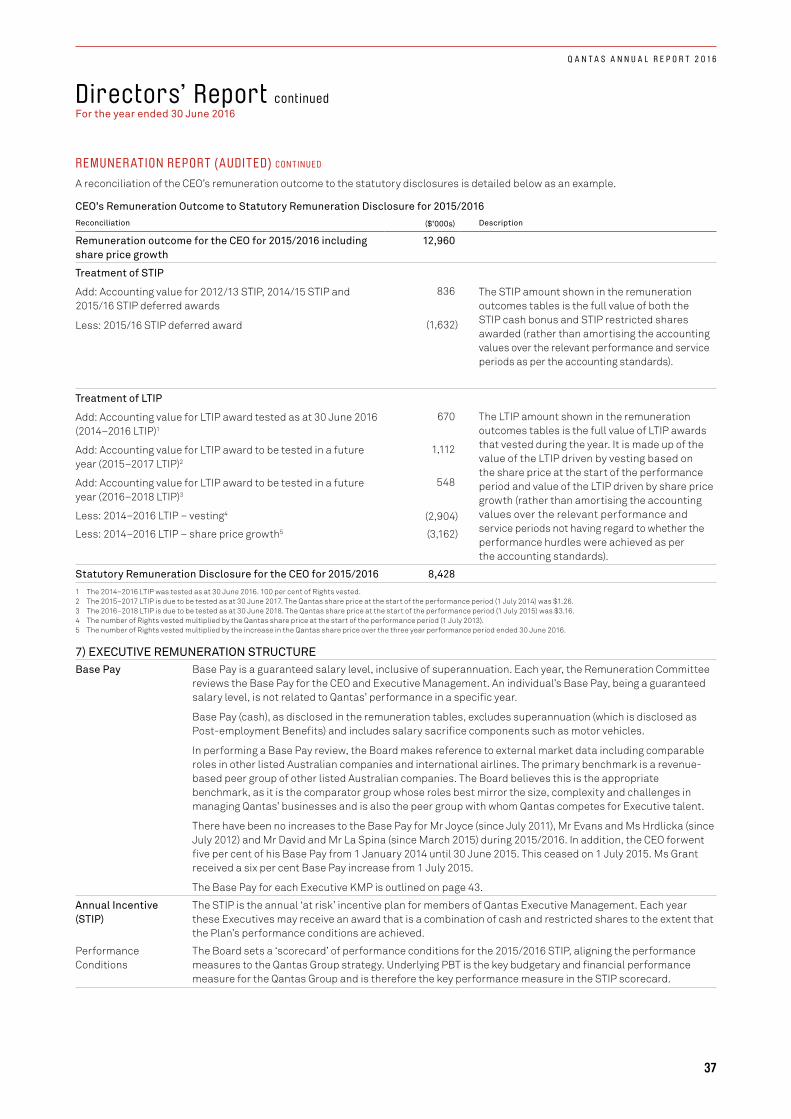
Directors’ Report continuedFor the year ended 30 June 2016
REMUNER ATION REPORT (AUDITED) C ON T INUE D
A reconciliation of the CEO’s remuneration outcome to the statutory disclosures is detailed below as an example.
CEO’s Remuneration Outcome to Statutory Remuneration Disclosure for 2015/2016Reconciliation ($’000s) Description
Remuneration outcome for the CEO for 2015/2016 including share price growth
12,960
Treatment of STIP
Add: Accounting value for 2012/13 STIP, 2014/15 STIP and 2015/16 STIP deferred awards
Less: 2015/16 STIP deferred award
836
(1,632)
The STIP amount shown in the remuneration outcomes tables is the full value of both the STIP cash bonus and STIP restricted shares awarded (rather than amortising the accounting values over the relevant performance and service periods as per the accounting standards).
Treatment of LTIP
Add: Accounting value for LTIP award tested as at 30 June 2016 (2014–2016 LTIP)1
670 The LTIP amount shown in the remuneration outcomes tables is the full value of LTIP awards that vested during the year. It is made up of the value of the LTIP driven by vesting based on the share price at the start of the performance period and value of the LTIP driven by share price growth (rather than amortising the accounting values over the relevant performance and service periods not having regard to whether the performance hurdles were achieved as per the accounting standards).
Add: Accounting value for LTIP award to be tested in a future year (2015–2017 LTIP)2
1,112
Add: Accounting value for LTIP award to be tested in a future year (2016–2018 LTIP)3
548
Less: 2014–2016 LTIP – vesting4 (2,904)
Less: 2014–2016 LTIP – share price growth5 (3,162)
Statutory Remuneration Disclosure for the CEO for 2015/2016 8,428
1 The 2014–2016 LTIP was tested as at 30 June 2016. 100 per cent of Rights vested.2 The 2015–2017 LTIP is due to be tested as at 30 June 2017. The Qantas share price at the start of the performance period (1 July 2014) was $1.26.3 The 2016–2018 LTIP is due to be tested as at 30 June 2018. The Qantas share price at the start of the performance period (1 July 2015) was $3.16.4 The number of Rights vested multiplied by the Qantas share price at the start of the performance period (1 July 2013).5 The number of Rights vested multiplied by the increase in the Qantas share price over the three year performance period ended 30 June 2016.
7) EXECUTIVE REMUNERATION STRUCTUREBase Pay Base Pay is a guaranteed salary level, inclusive of superannuation. Each year, the Remuneration Committee
reviews the Base Pay for the CEO and Executive Management. An individual’s Base Pay, being a guaranteed salary level, is not related to Qantas’ performance in a specific year.
Base Pay (cash), as disclosed in the remuneration tables, excludes superannuation (which is disclosed as Post-employment Benefits) and includes salary sacrifice components such as motor vehicles.
In performing a Base Pay review, the Board makes reference to external market data including comparable roles in other listed Australian companies and international airlines. The primary benchmark is a revenue-based peer group of other listed Australian companies. The Board believes this is the appropriate benchmark, as it is the comparator group whose roles best mirror the size, complexity and challenges in managing Qantas’ businesses and is also the peer group with whom Qantas competes for Executive talent.
There have been no increases to the Base Pay for Mr Joyce (since July 2011), Mr Evans and Ms Hrdlicka (since July 2012) and Mr David and Mr La Spina (since March 2015) during 2015/2016. In addition, the CEO forwent five per cent of his Base Pay from 1 January 2014 until 30 June 2015. This ceased on 1 July 2015. Ms Grant received a six per cent Base Pay increase from 1 July 2015.
The Base Pay for each Executive KMP is outlined on page 43.
Annual Incentive (STIP)
The STIP is the annual ‘at risk’ incentive plan for members of Qantas Executive Management. Each year these Executives may receive an award that is a combination of cash and restricted shares to the extent that the Plan’s performance conditions are achieved.
Performance Conditions
The Board sets a ‘scorecard’ of performance conditions for the 2015/2016 STIP, aligning the performance measures to the Qantas Group strategy. Underlying PBT is the key budgetary and financial performance measure for the Qantas Group and is therefore the key performance measure in the STIP scorecard.
37
Q A N T A S A N N U A L R E P O R T 2 0 1 6

Directors’ Report continuedFor the year ended 30 June 2016
The Board sets targets for each scorecard measure, and at the end of the financial year the Board assesses performance against each scorecard measure and determines the overall STIP scorecard outcome.
A detailed description of the STIP scorecard is provided on pages 41 to 43.
An individual’s performance is recognised via an Individual Performance Factor (IPF). IPFs are generally in the range of 0.8 to 1.2, however in case of under-performance the IPF may be zero and in exceptional circumstances the IPF may be as high as 1.5.
Board Discretion The Board retains discretion over any awards made under the STIP. For example, the Board may decide to adjust the STIP scorecard outcome where it determines that it does not reflect the performance achieved during the year. Circumstances may occur where scorecard measures have been achieved or exceeded, but in the view of the Board it is inappropriate to make a cash award under the STIP.
The Board may determine that either no award will be made (as it did for the CEO in 2011/2012 and 2013/2014), only a partial award be made (as it did in 2010/2011 and 2012/2013), or that any award will be entirely deferred and/or delivered in Qantas shares (as it did in 2010/2011).
On the other hand, there may be circumstances where performance is below an agreed target, however, the Board determines that it is appropriate to pay some STIP award. While the Board sees this balanced scorecard approach as an important design element of the STIP, it also recognises that the overall STIP outcome must be considered in the context of the Group’s financial performance.
Calculation of STIP Awards
STIP awards are calculated as follows:
Value of STIP Award
= Base Pay X‘At Target’
OpportunityX
Scorecard Result
XIndividual
Performance Factor (IPF)
Payment of Awards In a year where STIP awards are made, two-thirds of the STIP award would be paid as a cash bonus, with the remaining one-third deferred into Qantas shares with a two year restriction period.
The Board retains discretion as to how STIP awards are delivered.
Maximum Outcome The STIP scorecard has a hypothetical maximum outcome of 175 per cent of ‘At Target’, which could only be achieved if the maximum overdrive level of performance is achieved on every STIP performance measure.
The scorecard result is then applied to an individual’s ‘At Target’ opportunity and their IPF. As IPFs are generally between 0.8 and 1.2, a hypothetical maximum has been modelled using an IPF at the top of this range of 1.2. In the past and in extraordinary circumstances, participants have been allocated an IPF of up to 1.5, however this has never been given to date where there has been a maximum scorecard outcome.
Hypothetically, a STIP award to the CEO equal to 252 per cent of Base Pay could result (i.e. the ‘At Target’ opportunity for 2015/2016 of 120 per cent of Base Pay multiplied by a hypothetical Scorecard Result of 175 per cent and multiplied by an example IPF of 1.2).
The minimum outcome is nil, which would occur if the threshold level of performance is missed on each STIP measure or when the Board determines that no award be made.
Disclosure The full value of the STIP awarded for the corresponding year is disclosed in the Remuneration Outcomes Table on page 35.
Disclosure of STIP awards in the Statutory Remuneration Table on page 36 is based on the requirements of the Corporations Act 2001 and applicable Australian Accounting Standards. The STIP awards are disclosed as either:
– A cash incentive for any cash bonus paid or – A share-based payment for any component awarded in deferred shares
Where share-based STIP awards involve deferral over multiple reporting periods, they are reported against each period in accordance with accounting standards.
Long Term Incentive Plan (LTIP)
The LTIP involves the granting of Rights over Qantas shares. If performance and service conditions are satisfied, the Rights vest and convert to Qantas shares on a one-for-one basis. If performance conditions are not met, the Rights lapse.
Review of Performance Conditions
During 2015/2016, the Remuneration Committee reviewed the LTIP performance measures and considered a number of other LTIP performance measures, such as ROIC. The Committee concluded that the current LTIP performance measures, of relative TSR of Qantas compared to companies in the ASX100 and Global Listed Airlines, remains the most appropriate measure. The current LTIP performance measures are aligned to the Qantas Group’s Financial Framework which also targets total shareholder returns in the top quartile of the ASX100 and Global Listed Airlines.
REMUNER ATION REPORT (AUDITED) C ON T INUE D
38
Q A N T A S A N N U A L R E P O R T 2 0 1 6
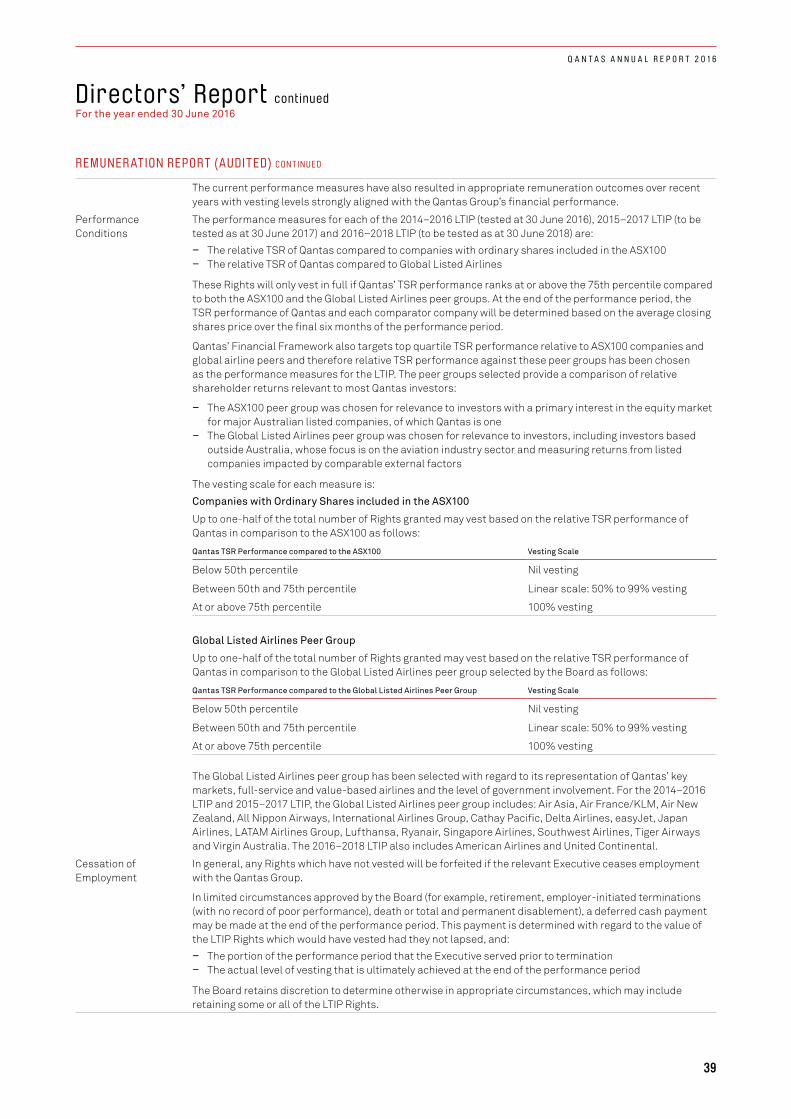
Directors’ Report continuedFor the year ended 30 June 2016
The current performance measures have also resulted in appropriate remuneration outcomes over recent years with vesting levels strongly aligned with the Qantas Group’s financial performance.
Performance Conditions
The performance measures for each of the 2014–2016 LTIP (tested at 30 June 2016), 2015–2017 LTIP (to be tested as at 30 June 2017) and 2016–2018 LTIP (to be tested as at 30 June 2018) are:
– The relative TSR of Qantas compared to companies with ordinary shares included in the ASX100 – The relative TSR of Qantas compared to Global Listed Airlines
These Rights will only vest in full if Qantas’ TSR performance ranks at or above the 75th percentile compared to both the ASX100 and the Global Listed Airlines peer groups. At the end of the performance period, the TSR performance of Qantas and each comparator company will be determined based on the average closing shares price over the final six months of the performance period.
Qantas’ Financial Framework also targets top quartile TSR performance relative to ASX100 companies and global airline peers and therefore relative TSR performance against these peer groups has been chosen as the performance measures for the LTIP. The peer groups selected provide a comparison of relative shareholder returns relevant to most Qantas investors:
– The ASX100 peer group was chosen for relevance to investors with a primary interest in the equity market for major Australian listed companies, of which Qantas is one
– The Global Listed Airlines peer group was chosen for relevance to investors, including investors based outside Australia, whose focus is on the aviation industry sector and measuring returns from listed companies impacted by comparable external factors
The vesting scale for each measure is:
Companies with Ordinary Shares included in the ASX100
Up to one-half of the total number of Rights granted may vest based on the relative TSR performance of Qantas in comparison to the ASX100 as follows:
Qantas TSR Performance compared to the ASX100 Vesting Scale
Below 50th percentile Nil vesting
Between 50th and 75th percentile Linear scale: 50% to 99% vesting
At or above 75th percentile 100% vesting
Global Listed Airlines Peer Group
Up to one-half of the total number of Rights granted may vest based on the relative TSR performance of Qantas in comparison to the Global Listed Airlines peer group selected by the Board as follows:
Qantas TSR Performance compared to the Global Listed Airlines Peer Group Vesting Scale
Below 50th percentile Nil vesting
Between 50th and 75th percentile Linear scale: 50% to 99% vesting
At or above 75th percentile 100% vesting
The Global Listed Airlines peer group has been selected with regard to its representation of Qantas’ key markets, full-service and value-based airlines and the level of government involvement. For the 2014–2016 LTIP and 2015–2017 LTIP, the Global Listed Airlines peer group includes: Air Asia, Air France/KLM, Air New Zealand, All Nippon Airways, International Airlines Group, Cathay Pacific, Delta Airlines, easyJet, Japan Airlines, LATAM Airlines Group, Lufthansa, Ryanair, Singapore Airlines, Southwest Airlines, Tiger Airways and Virgin Australia. The 2016–2018 LTIP also includes American Airlines and United Continental.
Cessation of Employment
In general, any Rights which have not vested will be forfeited if the relevant Executive ceases employment with the Qantas Group.
In limited circumstances approved by the Board (for example, retirement, employer-initiated terminations (with no record of poor performance), death or total and permanent disablement), a deferred cash payment may be made at the end of the performance period. This payment is determined with regard to the value of the LTIP Rights which would have vested had they not lapsed, and:
– The portion of the performance period that the Executive served prior to termination – The actual level of vesting that is ultimately achieved at the end of the performance period
The Board retains discretion to determine otherwise in appropriate circumstances, which may include retaining some or all of the LTIP Rights.
REMUNER ATION REPORT (AUDITED) C ON T INUE D
39
Q A N T A S A N N U A L R E P O R T 2 0 1 6
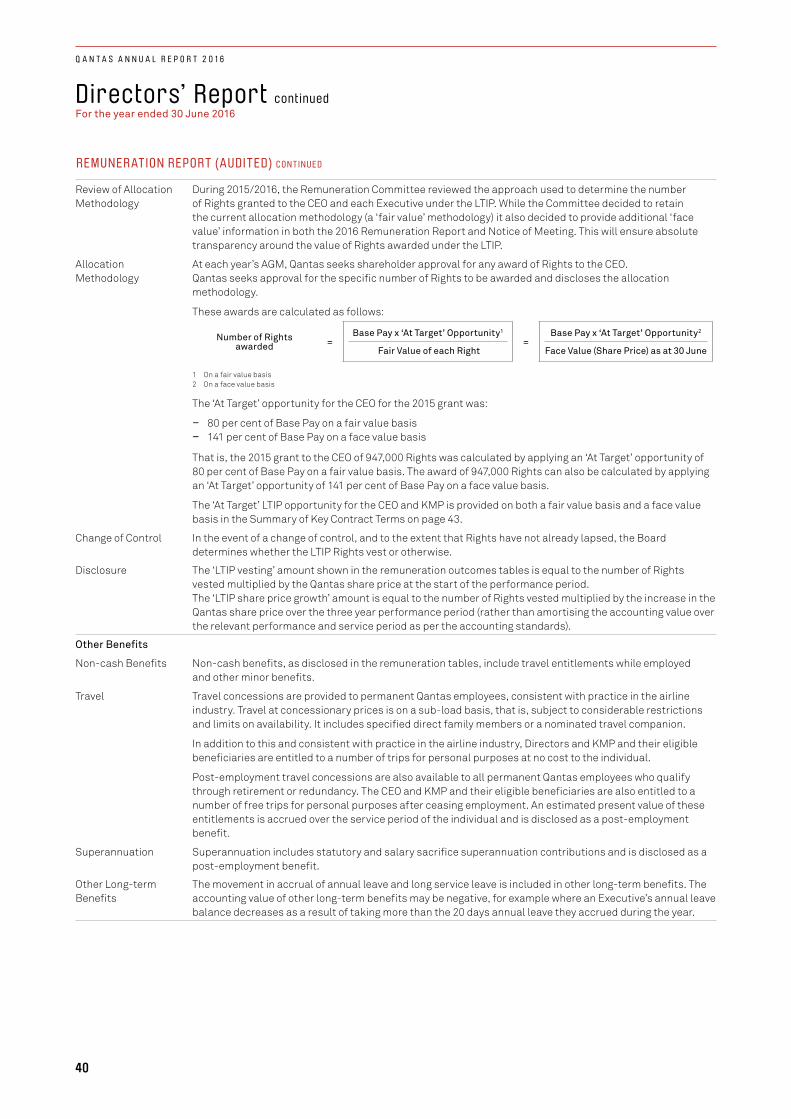
Directors’ Report continuedFor the year ended 30 June 2016
Review of Allocation Methodology
During 2015/2016, the Remuneration Committee reviewed the approach used to determine the number of Rights granted to the CEO and each Executive under the LTIP. While the Committee decided to retain the current allocation methodology (a ‘fair value’ methodology) it also decided to provide additional ‘face value’ information in both the 2016 Remuneration Report and Notice of Meeting. This will ensure absolute transparency around the value of Rights awarded under the LTIP.
Allocation Methodology
At each year’s AGM, Qantas seeks shareholder approval for any award of Rights to the CEO. Qantas seeks approval for the specific number of Rights to be awarded and discloses the allocation methodology.
These awards are calculated as follows:
Number of Rights awarded =
Base Pay x ‘At Target’ Opportunity1
=Base Pay x ‘At Target’ Opportunity2
Fair Value of each Right Face Value (Share Price) as at 30 June
1 On a fair value basis2 On a face value basis
The ‘At Target’ opportunity for the CEO for the 2015 grant was:
– 80 per cent of Base Pay on a fair value basis – 141 per cent of Base Pay on a face value basis
That is, the 2015 grant to the CEO of 947,000 Rights was calculated by applying an ‘At Target’ opportunity of 80 per cent of Base Pay on a fair value basis. The award of 947,000 Rights can also be calculated by applying an ‘At Target’ opportunity of 141 per cent of Base Pay on a face value basis.
The ‘At Target’ LTIP opportunity for the CEO and KMP is provided on both a fair value basis and a face value basis in the Summary of Key Contract Terms on page 43.
Change of Control In the event of a change of control, and to the extent that Rights have not already lapsed, the Board determines whether the LTIP Rights vest or otherwise.
Disclosure The ‘LTIP vesting’ amount shown in the remuneration outcomes tables is equal to the number of Rights vested multiplied by the Qantas share price at the start of the performance period. The ‘LTIP share price growth’ amount is equal to the number of Rights vested multiplied by the increase in the Qantas share price over the three year performance period (rather than amortising the accounting value over the relevant performance and service period as per the accounting standards).
Other Benefits
Non-cash Benefits Non-cash benefits, as disclosed in the remuneration tables, include travel entitlements while employed and other minor benefits.
Travel Travel concessions are provided to permanent Qantas employees, consistent with practice in the airline industry. Travel at concessionary prices is on a sub-load basis, that is, subject to considerable restrictions and limits on availability. It includes specified direct family members or a nominated travel companion.
In addition to this and consistent with practice in the airline industry, Directors and KMP and their eligible beneficiaries are entitled to a number of trips for personal purposes at no cost to the individual.
Post-employment travel concessions are also available to all permanent Qantas employees who qualify through retirement or redundancy. The CEO and KMP and their eligible beneficiaries are also entitled to a number of free trips for personal purposes after ceasing employment. An estimated present value of these entitlements is accrued over the service period of the individual and is disclosed as a post-employment benefit.
Superannuation Superannuation includes statutory and salary sacrifice superannuation contributions and is disclosed as a post-employment benefit.
Other Long-term Benefits
The movement in accrual of annual leave and long service leave is included in other long-term benefits. The accounting value of other long-term benefits may be negative, for example where an Executive’s annual leave balance decreases as a result of taking more than the 20 days annual leave they accrued during the year.
REMUNER ATION REPORT (AUDITED) C ON T INUE D
40
Q A N T A S A N N U A L R E P O R T 2 0 1 6

Directors’ Report continuedFor the year ended 30 June 2016
REMUNER ATION REPORT (AUDITED) C ON T INUE D
2015/2016 Balanced Scorecard Outcomes
For 2015/2016, the Board considered the following key measures of financial and operational performance and the associated targets to be critical indicators of performance and drivers of shareholder value. The performance outcomes for these measures are reflected in the CEO and Executive Management’s remuneration outcomes. The table below summarises performance versus target against each scorecard category under the 2015/16 STIP.
Scorecard Category/ Strategic Objective Measures
Scorecard Weighting ‘At Target’ (Range of Outcomes)
Actual Outcome Comment
Group Profitability
Underlying Profit Before Tax (PBT)
50% (0–100%)
The Underlying PBT result of $1,532 million for 2015/2016 exceeded the ‘overdrive’ target set by the Board.
Therefore, this measure contributed a maximum overdrive outcome of 100 per cent (out of 50 per cent) to the STIP scorecard.
Qantas Transformation and the Cost Agenda
Deliver transformation benefits Unit cost
20% (0–30%)
Management’s commitment and focus on the Qantas Transformation program to date has delivered $1,655 million of benefits. During 2015/2016 the Group realised $557 million in cost and revenue benefits through transformation initiatives, exceeding the full year target of $450 million announced to the market in February 2016.
Qantas International, Qantas Domestic and Jetstar Group exceeded the unit cost target set.
People and Operational Safety
People Safety measures Board’s assessment of Operational Safety
10% (0–15%)
Management’s continued focus on Operational and People safety resulted in targeted improvements in People Safety metrics being achieved and good Operational Safety for the year. Therefore, there was an at target contribution under the People Safety and the Operational Safety measures.
Customer Net Promoter Score (NPS)
Punctuality Domestic network attractiveness
10% (0–15%)
The Board recognised that Management’s continued investment in the customer has resulted in NPS targets for Qantas International, Qantas Domestic and Qantas Frequent Flyer being exceeded. NPS targets were not achieved by Jetstar Domestic, however, above threshold or above target NPS results were achieved by other Jetstar Group Airlines.
Qantas Domestic exceeded its on-time performance target for 2015/2016, with 89.7 per cent of flights on-time.
Qantas Domestic and Jetstar also maintained the Group’s network advantage in the Australian domestic market.
Growth and Strategic Initiatives
Qantas Loyalty: EBIT growth
Investments in Jetstar Airlines in Asia:Underlying EBIT
10% (0–15%)
Management continued to grow diversified earnings and pursue growth opportunities. Qantas Loyalty achieved its Earnings Before Interest and Tax (EBIT) growth target for 2015/2016.
Earnings targets for the two key Jetstar Airlines in Asia, Jetstar Asia and Jetstar Japan were exceeded.
Qantas Revenue Management System key project milestones and review benefits were achieved.
Revenue Management System Milestones and project benefits
2015/16 STIP Scorecard Outcome 100% (0–175%)
160%
Key:
Above target achievement against targets
Full achievement against targets
Partial achievement against targets
No achievements against targets
41
Q A N T A S A N N U A L R E P O R T 2 0 1 6
Directors’ Report continuedFor the year ended 30 June 2016
Additional Descriptions of STIP Scorecard Measures
Group Profitability Underlying PBT is the primary financial performance measure for the Qantas Group and therefore, is selected as the primary performance measure under the STIP. The objective of measuring and reporting Underlying PBT is to provide a meaningful and consistent representation of the underlying performance of the Group. The Underlying PBT target is based on the annual financial budget. For reasons of commercial sensitivity, the annual Underlying PBT target is not disclosed.
Underlying PBT is derived by adjusting Statutory PBT for the impacts of AASB 9 Financial Instruments which relate to other reporting periods and items which are identified by Management and reported to the chief operating decision-making bodies, as not representing the underlying performance of the business. The determination of these items is made after consideration of their nature and materiality and is applied consistently from period to period.
Items not included in Underlying PBT primarily result from major transformational/restructuring initiatives, transactions involving investments and impairment of assets outside the ordinary course of business.
Qantas Transformation and the Cost Agenda
The Qantas Transformation program is now targeting $2.1 billion of benefits by 2016/2017. Realisation of benefits under the Qantas Transformation program has been selected as a performance measure under the STIP as the transformation initiatives are driving sustainable change in the business and have been fundamental in returning the Qantas Group to profitability and the delivery of a record profit in 2015/2016.
Cost control remains an area of focus across the business and, as a result, the STIP scorecard includes unit cost targets for Qantas International and Qantas Domestic combined and the Jetstar Group.
For Qantas International and Qantas Domestic, unit cost performance is calculated as net underlying expenditure (excluding fuel) divided by each business’ Available Seat Kilometres (ASK). Net underlying expenditure is derived from passenger revenue less Underlying EBIT.
For Jetstar Group, unit cost performance is measured as controllable unit cost, which is calculated as total expenses (excluding fuel and costs associated with minority investments in Jetstar Airlines in Asia) per ASK adjusted for sector length and foreign exchange.
To ensure that these measures focus on the underlying operating activities and efficiencies, they exclude the impact of fuel price changes and foreign exchange movements, as well as items not included in Underlying PBT as described above.
People and Operational Safety
As safety is always our first priority, the STIP scorecard includes an assessment of both operational and people safety. In addition, the Board retains an overriding discretion to scale down the STIP (or reduce it to zero) in the event of a material aviation safety incident. This is in addition to the Board’s overall discretion over STIP awards. Any such decision would be made in light of the specific circumstances and following the recommendation of the Safety, Health, Environment and Security Committee.
The Safety, Health, Environment and Security Committee performs a combined assessment of people safety performance and operational safety performance.
The objective of the people safety targets is to reduce employee injuries and therefore, targets were set across:
− Total Recordable Injury Frequency Rate − Lost Work Case Frequency Rate − Duration Rate
Operational safety performance is assessed against outcome-based measures (including operational occurrences that pose a significant threat to the safety of employees and customers) and risk-based lead indicators commonly associated with aviation industry accidents.
Customer Customer service is measured against NPS targets.
This is a survey-based measure of how strongly our customers promote the services of our businesses in preference to our direct competitors. Individual NPS targets are set for Qantas Domestic, Qantas International, Qantas Frequent Flyer, Jetstar Australia Domestic, Jetstar Australia Long Haul, Jetstar Asia, Jetstar Japan and Jetstar Pacific.On-time departures for Qantas Domestic continues to be a particular area of focus. Therefore, a target measuring Qantas Domestic on-time departures is included as a STIP measure. As agreed with and reported to the Bureau of Infrastructure, Transport and Regional Economics (BITRE), punctuality is measured as the number of flights operating on-time (on an on-time departure basis) as a percentage of the total number of flights operated.
REMUNER ATION REPORT (AUDITED) C ON T INUE D
42
Q A N T A S A N N U A L R E P O R T 2 0 1 6
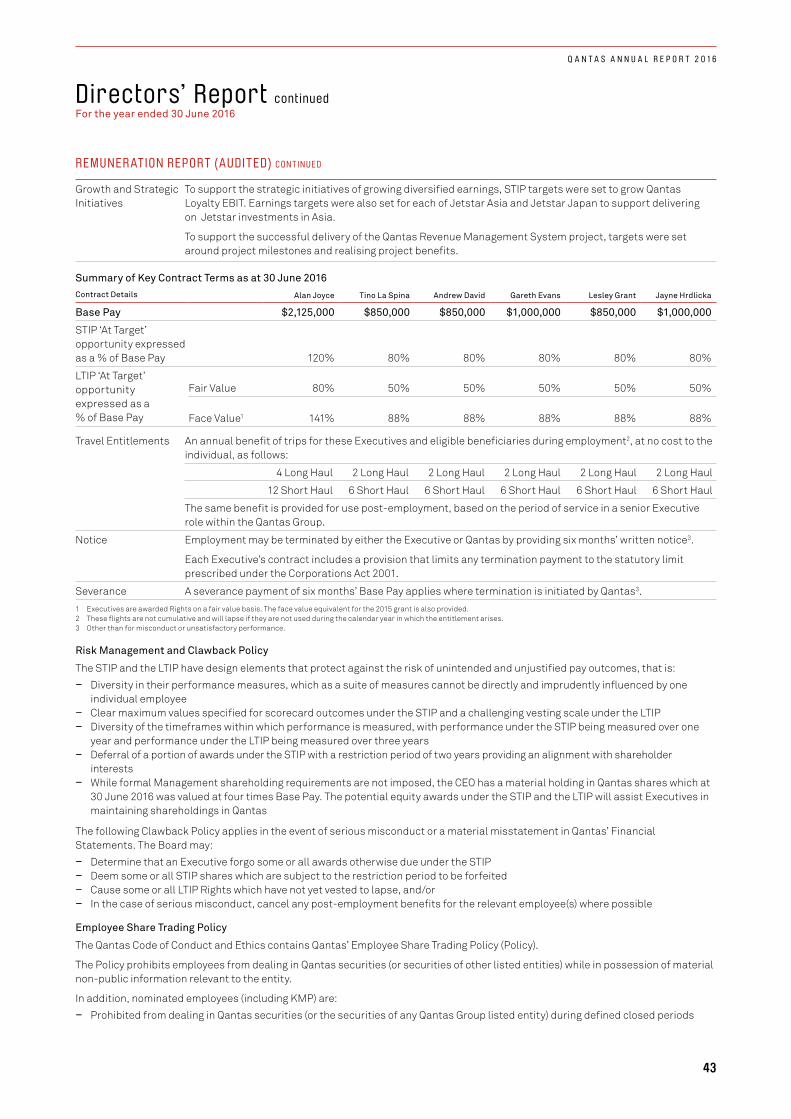
Directors’ Report continuedFor the year ended 30 June 2016
Additional Descriptions of STIP Scorecard Measures
Growth and Strategic Initiatives
To support the strategic initiatives of growing diversified earnings, STIP targets were set to grow Qantas Loyalty EBIT. Earnings targets were also set for each of Jetstar Asia and Jetstar Japan to support delivering on Jetstar investments in Asia.
To support the successful delivery of the Qantas Revenue Management System project, targets were set around project milestones and realising project benefits.
Summary of Key Contract Terms as at 30 June 2016Contract Details Alan Joyce Tino La Spina Andrew David Gareth Evans Lesley Grant Jayne Hrdlicka
Base Pay $2,125,000 $850,000 $850,000 $1,000,000 $850,000 $1,000,000
STIP ‘At Target’ opportunity expressed as a % of Base Pay 120% 80% 80% 80% 80% 80%
LTIP ‘At Target’ opportunity expressed as a % of Base Pay
Fair Value 80% 50% 50% 50% 50% 50%
Face Value1 141% 88% 88% 88% 88% 88%
Travel Entitlements An annual benefit of trips for these Executives and eligible beneficiaries during employment2, at no cost to the individual, as follows:
4 Long Haul 2 Long Haul 2 Long Haul 2 Long Haul 2 Long Haul 2 Long Haul
12 Short Haul 6 Short Haul 6 Short Haul 6 Short Haul 6 Short Haul 6 Short Haul
The same benefit is provided for use post-employment, based on the period of service in a senior Executive role within the Qantas Group.
Notice Employment may be terminated by either the Executive or Qantas by providing six months’ written notice3.
Each Executive’s contract includes a provision that limits any termination payment to the statutory limit prescribed under the Corporations Act 2001.
Severance A severance payment of six months’ Base Pay applies where termination is initiated by Qantas3.
1 Executives are awarded Rights on a fair value basis. The face value equivalent for the 2015 grant is also provided. 2 These flights are not cumulative and will lapse if they are not used during the calendar year in which the entitlement arises.3 Other than for misconduct or unsatisfactory performance.
Risk Management and Clawback Policy
The STIP and the LTIP have design elements that protect against the risk of unintended and unjustified pay outcomes, that is: – Diversity in their performance measures, which as a suite of measures cannot be directly and imprudently influenced by one
individual employee – Clear maximum values specified for scorecard outcomes under the STIP and a challenging vesting scale under the LTIP – Diversity of the timeframes within which performance is measured, with performance under the STIP being measured over one
year and performance under the LTIP being measured over three years – Deferral of a portion of awards under the STIP with a restriction period of two years providing an alignment with shareholder
interests – While formal Management shareholding requirements are not imposed, the CEO has a material holding in Qantas shares which at
30 June 2016 was valued at four times Base Pay. The potential equity awards under the STIP and the LTIP will assist Executives in maintaining shareholdings in Qantas
The following Clawback Policy applies in the event of serious misconduct or a material misstatement in Qantas’ Financial Statements. The Board may:
– Determine that an Executive forgo some or all awards otherwise due under the STIP – Deem some or all STIP shares which are subject to the restriction period to be forfeited – Cause some or all LTIP Rights which have not yet vested to lapse, and/or – In the case of serious misconduct, cancel any post-employment benefits for the relevant employee(s) where possible
Employee Share Trading Policy
The Qantas Code of Conduct and Ethics contains Qantas’ Employee Share Trading Policy (Policy).
The Policy prohibits employees from dealing in Qantas securities (or securities of other listed entities) while in possession of material non-public information relevant to the entity.
In addition, nominated employees (including KMP) are: – Prohibited from dealing in Qantas securities (or the securities of any Qantas Group listed entity) during defined closed periods
REMUNER ATION REPORT (AUDITED) C ON T INUE D
43
Q A N T A S A N N U A L R E P O R T 2 0 1 6
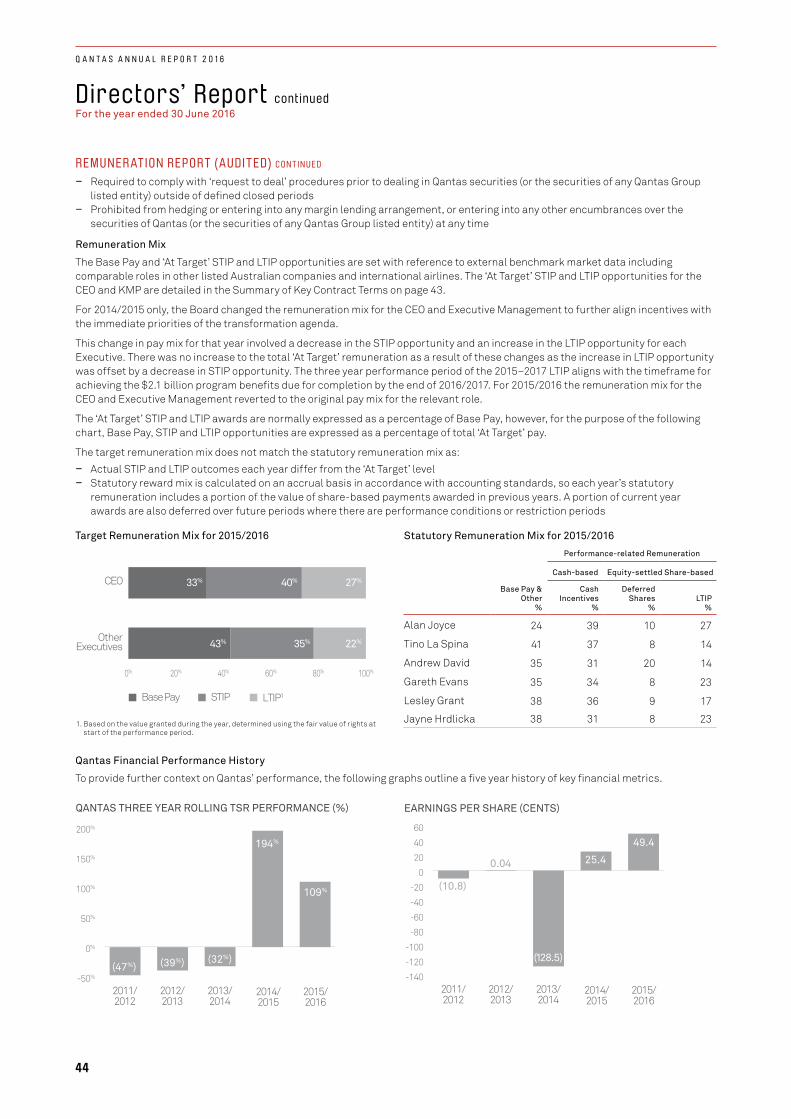
Directors’ Report continuedFor the year ended 30 June 2016
REMUNER ATION REPORT (AUDITED) C ON T INUE D
– Required to comply with ‘request to deal’ procedures prior to dealing in Qantas securities (or the securities of any Qantas Group listed entity) outside of defined closed periods
– Prohibited from hedging or entering into any margin lending arrangement, or entering into any other encumbrances over the securities of Qantas (or the securities of any Qantas Group listed entity) at any time
Remuneration Mix
The Base Pay and ‘At Target’ STIP and LTIP opportunities are set with reference to external benchmark market data including comparable roles in other listed Australian companies and international airlines. The ‘At Target’ STIP and LTIP opportunities for the CEO and KMP are detailed in the Summary of Key Contract Terms on page 43.
For 2014/2015 only, the Board changed the remuneration mix for the CEO and Executive Management to further align incentives with the immediate priorities of the transformation agenda.
This change in pay mix for that year involved a decrease in the STIP opportunity and an increase in the LTIP opportunity for each Executive. There was no increase to the total ‘At Target’ remuneration as a result of these changes as the increase in LTIP opportunity was offset by a decrease in STIP opportunity. The three year performance period of the 2015–2017 LTIP aligns with the timeframe for achieving the $2.1 billion program benefits due for completion by the end of 2016/2017. For 2015/2016 the remuneration mix for the CEO and Executive Management reverted to the original pay mix for the relevant role.
The ‘At Target’ STIP and LTIP awards are normally expressed as a percentage of Base Pay, however, for the purpose of the following chart, Base Pay, STIP and LTIP opportunities are expressed as a percentage of total ‘At Target’ pay.
The target remuneration mix does not match the statutory remuneration mix as: – Actual STIP and LTIP outcomes each year differ from the ‘At Target’ level – Statutory reward mix is calculated on an accrual basis in accordance with accounting standards, so each year’s statutory
remuneration includes a portion of the value of share-based payments awarded in previous years. A portion of current year awards are also deferred over future periods where there are performance conditions or restriction periods
Target Remuneration Mix for 2015/2016
0% 20% 40% 60% 80% 100%
CEO
Base Pay
OtherExecutives
33%
43% 35% 22%
40% 27%
STIP LTIP1
1. Based on the value granted during the year, determined using the fair value of rights at start of the performance period.
Statutory Remuneration Mix for 2015/2016
Performance-related Remuneration
Cash-based Equity-settled Share-based
Base Pay & Other
%
Cash Incentives
%
Deferred Shares
%LTIP
%
Alan Joyce 24 39 10 27
Tino La Spina 41 37 8 14
Andrew David 35 31 20 14
Gareth Evans 35 34 8 23
Lesley Grant 38 36 9 17
Jayne Hrdlicka 38 31 8 23
Qantas Financial Performance History
To provide further context on Qantas’ performance, the following graphs outline a five year history of key financial metrics.
QANTAS THREE YEAR ROLLING TSR PERFORMANCE (%)
-50%
0%
50%
100%
150%
200%
2011/2012
2012/2013
2013/2014
2014/2015
2015/2016
(47%) (39%) (32%)
194%
109%
EARNINGS PER SHARE (CENTS)
-140
-120
-100
-80
-60
-40
-20
0
20
40
60
2011/2012
2012/2013
2013/2014
2014/2015
2015/2016
(10.8)
0.04
(128.5)
25.4
49.4
44
Q A N T A S A N N U A L R E P O R T 2 0 1 6

Directors’ Report continuedFor the year ended 30 June 2016
REMUNER ATION REPORT (AUDITED) C ON T INUE D
UNDERLYING PROFIT BEFORE TAX1 ($M)
-1,000
-500
0
500
1,000
1,500
2,000
2011/2012
2012/2013
2013/2014
2014/2015
2015/2016
95 186
(646)
975
1,532
OPERATING CASH FLOW ($M)
1,000
1,250
1,500
1,750
2,000
2,250
2,500
2,750
3,000
2011/2012
2012/2013
2013/2014
2014/2015
2015/2016
1,810
1,4171,069
2,048
2,819
1 Underlying Profit Before Tax (PBT) is the primary reporting measure used by the Qantas Group’s chief operating decision-making bodies, being the Chief Executive Officer, Group Management Committee and the Board of Directors, for the purpose of assessing the performance of the Group. Statutory Profit After Tax for 2015/2016 was $1,029 million (2015: $560 million, 2014: ($2.8) billion, 2013: $2 million and 2012: ($244) million).
8) PERFORMANCE-RELATED REMUNERATIONPerformance Remuneration Affecting Future PeriodsThe fair value of share-based payments granted is amortised over the service period and therefore remuneration in respect of these awards may be reported in future years. The following table summarises the maximum value of these awards that will be reported in the statutory remuneration tables in future years, assuming all performance conditions are met. The minimum value of these awards is nil, should performance conditions not be satisfied.
Future Expense by Plan Future Expense by Financial Year
Deferred Shares LTIP Awards
Executives2014/2015
$’0002015/2016
$’0002015–2017
$’0002016–2018
$’000Total
$’0002017
$’0002018
$’0002019
$’000Total
$’000
Alan Joyce 351 1,116 1,297 1,781 4,545 2,749 1,573 223 4,545
Tino La Spina 55 285 138 339 817 453 316 48 817
Andrew David 224 273 160 339 996 636 314 46 996
Gareth Evans 99 350 365 398 1,212 743 412 57 1,212
Lesley Grant 76 285 201 339 901 526 328 47 901
Jayne Hrdlicka 95 321 365 398 1,179 727 398 54 1,179
Equity Instruments Held by Key Management Personnel
Set out in the following tables are the holdings of equity instruments granted as remuneration to the KMP by Qantas. Non-Executive Directors do not receive any remuneration in the form of share-based payments.
(i) Short Term Incentive Plan (STIP)Number of Shares
Key Management Personnel 1 July
Commenced as KMP Granted Forfeited
Vested and Transferred Other Changes1 30 June
Alan Joyce 2016 284,769 – 274,826 – (284,769) (16,764) 258,062
2015 284,769 – – – – – 284,769
Tino La Spina 2016 – – 37,603 – – (2,293) 35,310
2015 – – – – – – –
Andrew David 2016 – – 40,054 – – (2,443) 37,611
2015 – – – – – – –
Gareth Evans 2016 85,607 – 77,456 – (85,607) (4,724) 72,732
2015 148,227 – – – (62,620) – 85,607
Lesley Grant 2016 65,505 – 59,269 – (65,505) (3,615) 55,654
2015 108,431 – – – (42,926) – 65,505
Jayne Hrdlicka 2016 78,164 – 74,087 – (78,164) (4,519) 69,568
2015 128,244 – – – (50,080) – 78,164
1 Other changes include the impact of share consolidation, relating to return of capital to shareholders paid on 6 November 2015, through the conversion of each share into 0.939 shares.
45
Q A N T A S A N N U A L R E P O R T 2 0 1 6

Directors’ Report continuedFor the year ended 30 June 2016
REMUNER ATION REPORT (AUDITED) C ON T INUE D
One-third of the 2012/13 STIP awards (granted on 6 September 2013) were delivered to participants in deferred shares that are subject to a two year restriction period. The restriction period on these shares ended during 2015/2016.
One-third of the 2014/15 STIP awards (granted on 28 August 2015) were delivered to participants in deferred shares that are subject to a two year restriction period. The restriction period on these shares applied throughout 2015/2016.
(ii) Long Term Incentive Plan (LTIP) Number of Rights
Key Management Personnel 1 July
Commencedas KMP Granted
Lapsed/Forfeited
Vested and Transferred
Other Changes1 30 June2
Alan Joyce 2016 7,974,000 – 947,000 (386,250) (2,188,750) – 6,346,000
2015 6,401,000 – 3,248,000 (1,675,000) – – 7,974,000
Tino La Spina 2016 721,500 – 237,000 (27,450) (155,550) – 775,500
2015 n/a 721,500 – – – – 721,500
Andrew David 2016 823,000 – 237,000 (30,000) (170,000) – 860,000
2015 n/a 823,000 – – – – 823,000
Gareth Evans 2016 2,428,731 – 278,500 (113,550) (645,101) – 1,948,580
2015 1,865,731 – 1,019,000 (456,000) – – 2,428,731
Lesley Grant 2016 1,117,000 – 237,000 (45,450) (257,550) – 1,051,000
2015 747,000 – 561,000 (191,000) – – 1,117,000
Jayne Hrdlicka 2016 2,409,000 – 278,500 (113,550) (643,450) – 1,930,500
2015 1,581,000 – 1,019,000 (191,000) – – 2,409,000
1 The share consolidation and return of capital to shareholders paid on 6 November 2015 did not apply to Rights granted under the LTIP.2 The 30 June 2016 balance includes the Rights granted under the 2014–2016 LTIP which vested at 100 per cent and converted into shares following the performance hurdle testing
conducted as at 30 June 2016 and the Board’s approval of the 2014–2016 LTIP vesting outcome on 23 August 2016 .
Rights under the 2016–2018 LTIP were granted on 23 October 2015 to Mr Joyce (following approval by shareholders at 2015 AGM) and 1 September 2015 for other Executives, and will be tested against the performance hurdles as at 30 June 2018. The number of Rights granted were determined using the fair value of a Right on 1 July 2015 of $1.795 per Right, being the start of the performance period. The fair value of a Right on the grant date was $2.46 per Right for Mr Joyce and $2.09 per Right for other Executives.
Rights under the 2015–2017 LTIP were granted on 24 October 2014 to Mr Joyce (following approval by shareholders at 2014 AGM) and 15 September 2014 for other Executives, and will be tested against the performance hurdles as at 30 June 2017. The number of Rights granted were determined using the fair value of a Right on 1 July 2014 of $0.785 per Right, being the start of the performance period. The fair value of a Right on the grant date was $0.970 per Right for Mr Joyce and $0.972 per Right for other Executives.
100 per cent of Rights under the 2014–2016 LTIP (granted on 18 October 2013) vested following the testing of performance hurdles as at 30 June 2016 and the Board’s approval of the 2014–2016 LTIP vesting outcome on 23 August 2016.
85 per cent of Rights under the 2013–2015 LTIP (granted on 2 November 2012 for Mr Joyce and other Executives) vested during the year following testing of the performance hurdles as at 30 June 2015. This outcome was included in the 2015 Remuneration Report.
(iii) Performance Share Plan (PSP)Number of Shares
Key Management Personnel 1 July
Commenced as KMP Granted Forfeited Transferred
Other Changes1 30 June
Gareth Evans 2016 36,621 – – – – (2,233) 34,388
2015 36,621 – – – – – 36,621
Lesley Grant 2016 64,989 – – – (64,989) – –
2015 64,989 – – – – – 64,989
1 Other changes include the impact of share consolidation, relating to return of capital to shareholders paid on 6 November 2015, through the conversion of each share into 0.939 shares.
The above shares were awarded under legacy incentive plans and are vested and available to call.
(iv) Deferred Share Plan (DSP)Number of Shares
Key Management Personnel 1 July
Commenced as KMP Granted Forfeited Transferred
Other Changes1 30 June
Andrew David 2016 588,482 – – – – (35,897) 552,585
2015 n/a 588,482 – – – – 588,482
1 Other changes include the impact of share consolidation, relating to return of capital to shareholders paid on 6 November 2015, through the conversion of each share into 0.939 shares.
46
Q A N T A S A N N U A L R E P O R T 2 0 1 6
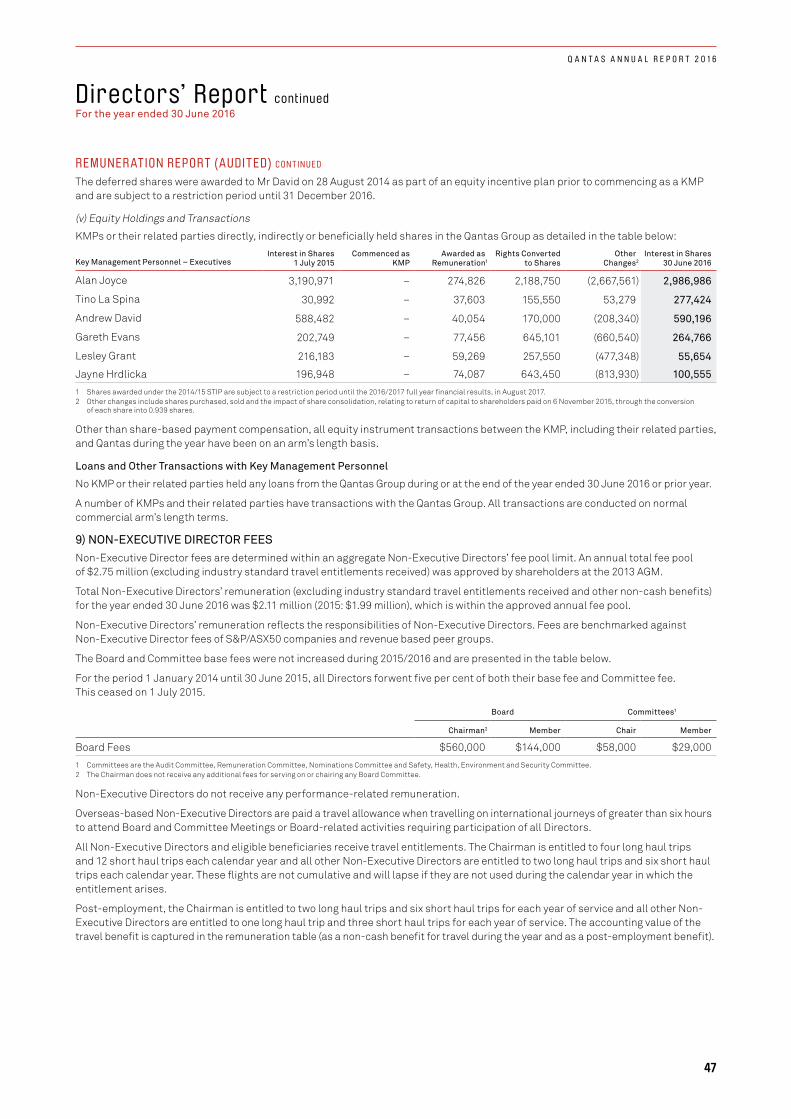
Directors’ Report continuedFor the year ended 30 June 2016
REMUNER ATION REPORT (AUDITED) C ON T INUE D
The deferred shares were awarded to Mr David on 28 August 2014 as part of an equity incentive plan prior to commencing as a KMP and are subject to a restriction period until 31 December 2016.
(v) Equity Holdings and Transactions
KMPs or their related parties directly, indirectly or beneficially held shares in the Qantas Group as detailed in the table below:
Key Management Personnel – ExecutivesInterest in Shares
1 July 2015Commenced as
KMP Awarded as Remuneration1
Rights Converted to Shares
Other Changes2
Interest in Shares 30 June 2016
Alan Joyce 3,190,971 – 274,826 2,188,750 (2,667,561) 2,986,986
Tino La Spina 30,992 – 37,603 155,550 53,279 277,424
Andrew David 588,482 – 40,054 170,000 (208,340) 590,196
Gareth Evans 202,749 – 77,456 645,101 (660,540) 264,766
Lesley Grant 216,183 – 59,269 257,550 (477,348) 55,654
Jayne Hrdlicka 196,948 – 74,087 643,450 (813,930) 100,555
1 Shares awarded under the 2014/15 STIP are subject to a restriction period until the 2016/2017 full year financial results, in August 2017. 2 Other changes include shares purchased, sold and the impact of share consolidation, relating to return of capital to shareholders paid on 6 November 2015, through the conversion
of each share into 0.939 shares.
Other than share-based payment compensation, all equity instrument transactions between the KMP, including their related parties, and Qantas during the year have been on an arm’s length basis.
Loans and Other Transactions with Key Management Personnel
No KMP or their related parties held any loans from the Qantas Group during or at the end of the year ended 30 June 2016 or prior year.
A number of KMPs and their related parties have transactions with the Qantas Group. All transactions are conducted on normal commercial arm’s length terms.
9) NON-EXECUTIVE DIRECTOR FEESNon-Executive Director fees are determined within an aggregate Non-Executive Directors’ fee pool limit. An annual total fee pool of $2.75 million (excluding industry standard travel entitlements received) was approved by shareholders at the 2013 AGM.
Total Non-Executive Directors’ remuneration (excluding industry standard travel entitlements received and other non-cash benefits) for the year ended 30 June 2016 was $2.11 million (2015: $1.99 million), which is within the approved annual fee pool.
Non-Executive Directors’ remuneration reflects the responsibilities of Non-Executive Directors. Fees are benchmarked against Non-Executive Director fees of S&P/ASX50 companies and revenue based peer groups.
The Board and Committee base fees were not increased during 2015/2016 and are presented in the table below.
For the period 1 January 2014 until 30 June 2015, all Directors forwent five per cent of both their base fee and Committee fee. This ceased on 1 July 2015.
Board Committees1
Chairman2 Member Chair Member
Board Fees $560,000 $144,000 $58,000 $29,000
1 Committees are the Audit Committee, Remuneration Committee, Nominations Committee and Safety, Health, Environment and Security Committee.2 The Chairman does not receive any additional fees for serving on or chairing any Board Committee.
Non-Executive Directors do not receive any performance-related remuneration.
Overseas-based Non-Executive Directors are paid a travel allowance when travelling on international journeys of greater than six hours to attend Board and Committee Meetings or Board-related activities requiring participation of all Directors.
All Non-Executive Directors and eligible beneficiaries receive travel entitlements. The Chairman is entitled to four long haul trips and 12 short haul trips each calendar year and all other Non-Executive Directors are entitled to two long haul trips and six short haul trips each calendar year. These flights are not cumulative and will lapse if they are not used during the calendar year in which the entitlement arises.
Post-employment, the Chairman is entitled to two long haul trips and six short haul trips for each year of service and all other Non-Executive Directors are entitled to one long haul trip and three short haul trips for each year of service. The accounting value of the travel benefit is captured in the remuneration table (as a non-cash benefit for travel during the year and as a post-employment benefit).
47
Q A N T A S A N N U A L R E P O R T 2 0 1 6
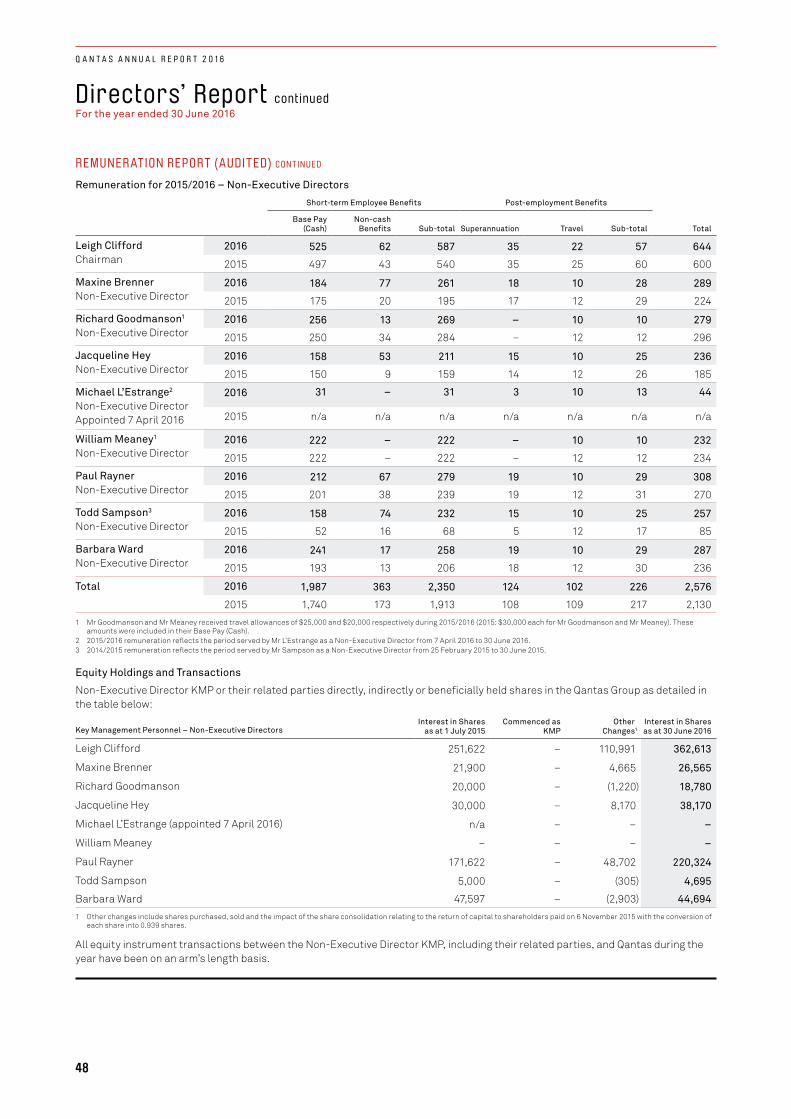
Directors’ Report continuedFor the year ended 30 June 2016
REMUNER ATION REPORT (AUDITED) C ON T INUE D
Remuneration for 2015/2016 – Non-Executive Directors
Short-term Employee Benefits Post-employment Benefits
Base Pay (Cash)
Non-cash Benefits Sub-total Superannuation Travel Sub-total Total
Leigh Clifford Chairman
2016 525 62 587 35 22 57 644
2015 497 43 540 35 25 60 600
Maxine Brenner Non-Executive Director
2016 184 77 261 18 10 28 289
2015 175 20 195 17 12 29 224
Richard Goodmanson1 Non-Executive Director
2016 256 13 269 – 10 10 279
2015 250 34 284 – 12 12 296
Jacqueline Hey Non-Executive Director
2016 158 53 211 15 10 25 236
2015 150 9 159 14 12 26 185
Michael L’Estrange2 Non-Executive DirectorAppointed 7 April 2016
2016 31 – 31 3 10 13 44
2015 n/a n/a n/a n/a n/a n/a n/a
William Meaney1 Non-Executive Director
2016 222 – 222 – 10 10 232
2015 222 – 222 – 12 12 234
Paul Rayner Non-Executive Director
2016 212 67 279 19 10 29 308
2015 201 38 239 19 12 31 270
Todd Sampson3 Non-Executive Director
2016 158 74 232 15 10 25 257
2015 52 16 68 5 12 17 85
Barbara Ward Non-Executive Director
2016 241 17 258 19 10 29 287
2015 193 13 206 18 12 30 236
Total 2016 1,987 363 2,350 124 102 226 2,576
2015 1,740 173 1,913 108 109 217 2,130
1 Mr Goodmanson and Mr Meaney received travel allowances of $25,000 and $20,000 respectively during 2015/2016 (2015: $30,000 each for Mr Goodmanson and Mr Meaney). These amounts were included in their Base Pay (Cash).
2 2015/2016 remuneration reflects the period served by Mr L’Estrange as a Non-Executive Director from 7 April 2016 to 30 June 2016.3 2014/2015 remuneration reflects the period served by Mr Sampson as a Non-Executive Director from 25 February 2015 to 30 June 2015.
Equity Holdings and Transactions
Non-Executive Director KMP or their related parties directly, indirectly or beneficially held shares in the Qantas Group as detailed in the table below:
Key Management Personnel – Non-Executive DirectorsInterest in Shares
as at 1 July 2015Commenced as
KMP Other Changes1
Interest in Shares as at 30 June 2016
Leigh Clifford 251,622 – 110,991 362,613
Maxine Brenner 21,900 – 4,665 26,565
Richard Goodmanson 20,000 – (1,220) 18,780
Jacqueline Hey 30,000 – 8,170 38,170
Michael L’Estrange (appointed 7 April 2016) n/a – – –
William Meaney – – – –
Paul Rayner 171,622 – 48,702 220,324
Todd Sampson 5,000 – (305) 4,695
Barbara Ward 47,597 – (2,903) 44,694
1 Other changes include shares purchased, sold and the impact of the share consolidation relating to the return of capital to shareholders paid on 6 November 2015 with the conversion of each share into 0.939 shares.
All equity instrument transactions between the Non-Executive Director KMP, including their related parties, and Qantas during the year have been on an arm’s length basis.
48
Q A N T A S A N N U A L R E P O R T 2 0 1 6
Directors’ Report continuedFor the year ended 30 June 2016
ENVIRONMENTAL OBLIGATIONSThe Qantas Group’s operations are subject to a range of Commonwealth, State, Territory and international environmental legislation. The Qantas Group is committed to environmental sustainability with high standards for environmental performance. The Board places particular focus on the environmental aspects of its operations through the Safety, Health, Environment and Security Committee, which is responsible for monitoring compliance with these regulations and reporting to the Board.
The Directors are satisfied that adequate systems are in place for the management of the Qantas Group’s environmental exposures and environmental performance. The Directors are also satisfied that relevant licences and permits are held and that appropriate monitoring procedures are in place to ensure compliance with those licences and permits. Any significant environmental incidents are reported to the Board.
The Directors are not aware of any breaches of any environmental legislation or of any significant environmental incidents during the year which are material in nature.
INDEMNITIES AND INSURANCEUnder the Qantas Constitution, Qantas indemnifies, to the extent permitted by law, each Director and Company Secretary of Qantas against any liability incurred by that person as an officer of Qantas.
The Directors and the Company Secretaries listed on page 27 and individuals who formerly held any of these positions have the benefit of the indemnity in the Qantas Constitution. Members of Qantas’ Executive Management team and certain former members of the Executive Management team have the benefit of an indemnity to the fullest extent permitted by law and as approved by the Board. In respect to non-audit services, KPMG, Qantas’ auditor, has the benefit of an indemnity to the extent KPMG reasonably relies on information provided by Qantas which is false, misleading or incomplete. No amount has been paid under any of these indemnities during 2015/2016 or to the date of this Report.
Qantas has insured against amounts which it may be liable to pay on behalf of Directors and officers or which it otherwise agrees to pay by way of indemnity.
During the year, Qantas paid a premium for Directors’ and Officers’ liability insurance policies, which cover all Directors and officers of the Qantas Group. Details of the nature of the liabilities covered, and the amount of the premium paid in respect of the Directors’ and Officers’ insurance policies, are not disclosed, as disclosure is prohibited under the terms of the contracts.
NON-AUDIT SERVICESDuring the year, Qantas’ auditor, KPMG, has performed certain other services in addition to its statutory duties. The Directors are satisfied that:
a. The non-audit services provided during 2015/2016 by KPMG as the external auditor were compatible with the general standard of independence for auditors imposed by the Corporations Act 2001
b. Any non-audit services provided during 2015/2016 by KPMG as the external auditor did not compromise the auditor independence requirements of the Corporations Act 2001 for the following reasons:
– KPMG services have not involved partners or staff acting in a managerial or decision-making capacity within the Qantas Group or being involved in the processing or originating of transactions
– KPMG non-audit services have only been provided where Qantas is satisfied that the related function or process will not have a material bearing on the audit procedures
– KPMG partners and staff involved in the provision of non-audit services have not participated in associated approval or authorisation processes
– A description of all non-audit services undertaken by KPMG and the related fees has been reported to the Board to ensure complete transparency in relation to the services provided
– The declaration required by section 307C of the Corporations Act 2001 confirming independence has been received from KPMG
A copy of the lead auditor’s independence declaration as required under section 307C of the Corporations Act 2001 is included on page 50.
Details of the amounts paid to KPMG for audit and non-audit services provided during the year are set out in Note 7 to the Financial Statements.
49
Q A N T A S A N N U A L R E P O R T 2 0 1 6
Directors’ Report continuedFor the year ended 30 June 2016
LEAD AUDITOR’S INDEPENDENCE DECLARATION UNDER SECTION 307C OF THE CORPORATIONS ACT 2001To: The Directors of Qantas Airways Limited
I declare that, to the best of my knowledge and belief, in relation to the audit for the financial year ended 30 June 2016, there have been:
i. No contraventions of the auditor independence requirements as set out in the Corporations Act 2001 in relation to the audit; and
ii. No contraventions of any applicable code of professional conduct in relation to the audit.
KPMG Duncan McLennan Sydney Partner
2 September 2016
Rounding
Qantas is a company of a kind referred to in Australian Securities and Investments Commission (ASIC) Corporations (Rounding in Financial/Directors’ Reports) Instrument 2016/191. In accordance with that Instrument, amounts in this Directors’ Report and the Financial Report have been rounded to the nearest million dollars unless otherwise stated.
Signed pursuant to a Resolution of the Directors:
Leigh Clifford Alan JoyceChairman Chief Executive Officer
2 September 2016 2 September 2016
KPMG, an Australian partnership and a member firm of the KPMG network of independent member firms affiliated with KPMG International Cooperative (“KPMG International”), a Swiss entity.
Limited liability by a scheme approved underProfessional Standards Legislation
50
Q A N T A S A N N U A L R E P O R T 2 0 1 6

Financial ReportFor the year ended 30 June 2016
FINANCIAL STATEMENTSConsolidated Income Statement 52
Consolidated Statement of Comprehensive Income 53
Consolidated Balance Sheet 54
Consolidated Statement of Changes in Equity 55
Consolidated Cash Flow Statement 57
NOTES TO THE FINANCIAL STATEMENTS1 Underlying Profit Before Tax, Operating Segments and Return on Invested Capital 58
2 Revenue and Other Income 62
3 Other Expenditure 62
4 Net Finance Costs 63
5 Income Tax 63
6 Dividends and Other Shareholder Distributions 65
7 Auditor’s Remuneration 66
8 Cash and Cash Equivalents 66
9 Receivables 66
10 Assets Classified as Held for Sale 67
11 Property, Plant and Equipment 67
12 Intangible Assets 68
13 Deferred Tax Assets 69
14 Revenue Received in Advance 70
15 Interest-bearing Liabilities 71
16 Provisions 71
17 Capital 72
18 Impairment Testing of Cash Generating Units 73
19 Share-based Payments 73
20 Financial Risk Management 74
21 Notes to the Cash Flow Statement 80
22 Commitments 81
23 Contingent Liabilities 82
24 Superannuation 83
25 Deed of Cross Guarantee 85
26 Related Parties 87
27 Post Balance Date Events 87
28 Parent Entity Disclosures – Qantas Airways Limited 87
29 Summary of Significant Accounting Policies 90
Directors’ Declaration 101
Independent Auditor’s Report 102
51
Q A N T A S A N N U A L R E P O R T 2 0 1 6
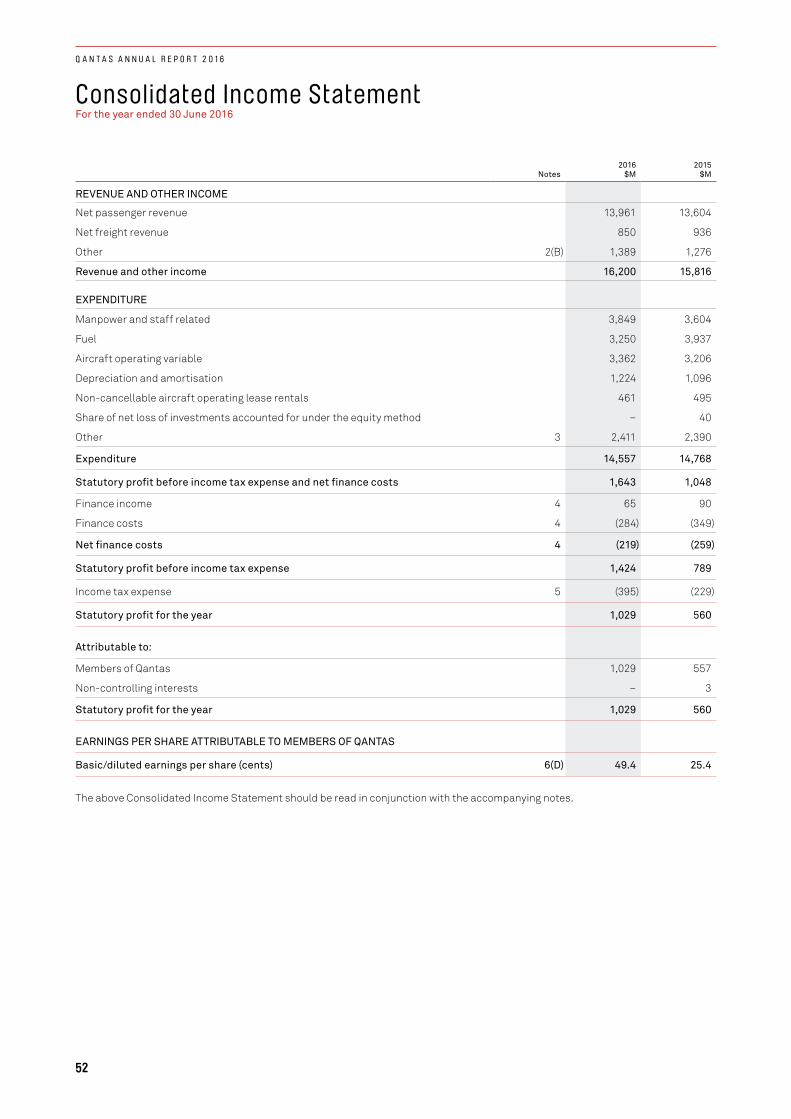
Consolidated Income StatementFor the year ended 30 June 2016
Notes2016
$M2015
$M
REVENUE AND OTHER INCOME
Net passenger revenue 13,961 13,604
Net freight revenue 850 936
Other 2(B) 1,389 1,276
Revenue and other income 16,200 15,816
EXPENDITURE
Manpower and staff related 3,849 3,604
Fuel 3,250 3,937
Aircraft operating variable 3,362 3,206
Depreciation and amortisation 1,224 1,096
Non-cancellable aircraft operating lease rentals 461 495
Share of net loss of investments accounted for under the equity method – 40
Other 3 2,411 2,390
Expenditure 14,557 14,768
Statutory profit before income tax expense and net finance costs 1,643 1,048
Finance income 4 65 90
Finance costs 4 (284) (349)
Net finance costs 4 (219) (259)
Statutory profit before income tax expense 1,424 789
Income tax expense 5 (395) (229)
Statutory profit for the year 1,029 560
Attributable to:
Members of Qantas 1,029 557
Non-controlling interests – 3
Statutory profit for the year 1,029 560
EARNINGS PER SHARE ATTRIBUTABLE TO MEMBERS OF QANTAS
Basic/diluted earnings per share (cents) 6(D) 49.4 25.4
The above Consolidated Income Statement should be read in conjunction with the accompanying notes.
52
Q A N T A S A N N U A L R E P O R T 2 0 1 6

Consolidated Statement of Comprehensive IncomeFor the year ended 30 June 2016
2016$M
2015$M
Statutory profit for the year 1,029 560
Items that are or may be subsequently reclassified to profit or loss
Effective portion of changes in fair value of cash flow hedges, net of tax (187) (44)
Transfer of hedge reserve to the Consolidated Income Statement, net of tax1 198 91
Recognition of effective cash flow hedges on capitalised assets, net of tax (40) (2)
Net changes in hedge reserve for time value of options, net of tax 35 (95)
Foreign currency translation of controlled entities 2 5
Foreign currency translation of investments accounted for under the equity method 24 5
Share of other comprehensive income of investments accounted for under the equity method (2) –
Items that will not subsequently be reclassified to profit or loss
Defined benefit actuarial (losses)/gains, net of tax (209) 38
Other comprehensive loss for the year (179) (2)
Total comprehensive income for the year 850 558
Total comprehensive income attributable to:
Members of Qantas 850 554
Non-controlling interests – 4
Total comprehensive income for the year 850 558
1 These amounts were allocated to revenue of $(7) million (2015: $(40) million), fuel expenditure of $289 million (2015: $170 million), and income tax expense of $(84) million (2015: $(39) million) in the Consolidated Income Statement.
The above Consolidated Statement of Comprehensive Income should be read in conjunction with the accompanying notes.
53
Q A N T A S A N N U A L R E P O R T 2 0 1 6
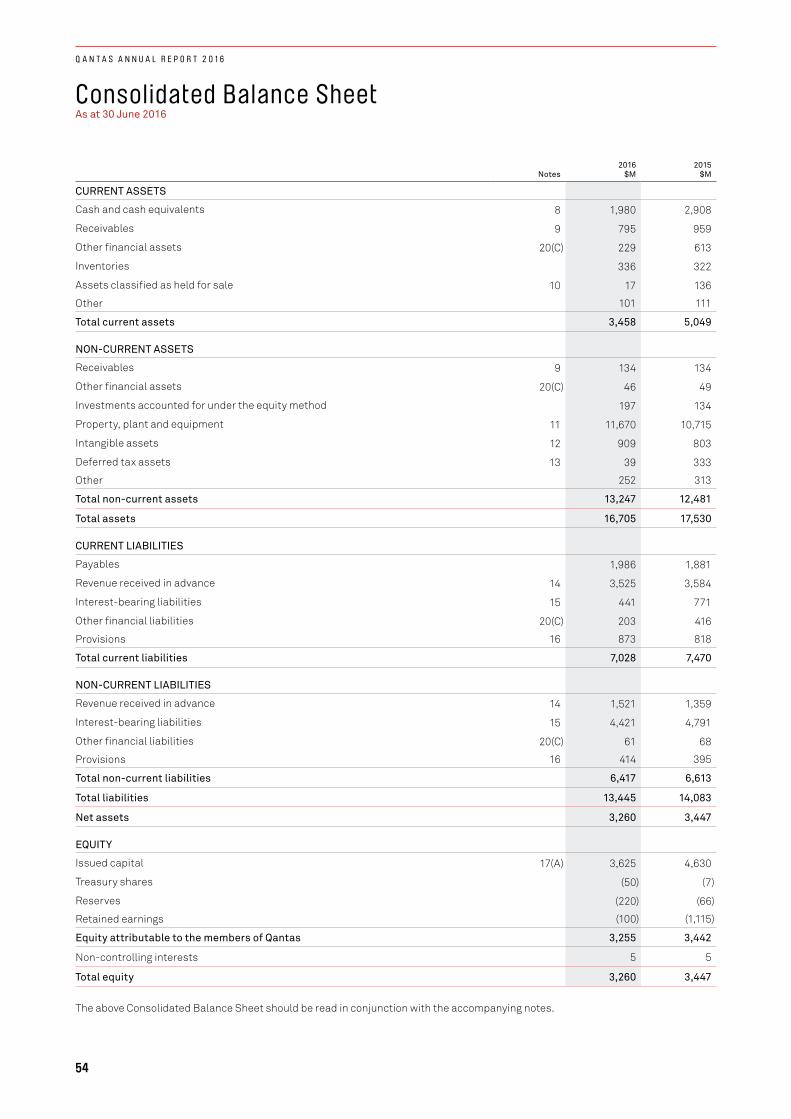
Consolidated Balance Sheet As at 30 June 2016
Notes2016
$M2015
$M
CURRENT ASSETS
Cash and cash equivalents 8 1,980 2,908
Receivables 9 795 959
Other financial assets 20(C) 229 613
Inventories 336 322
Assets classified as held for sale 10 17 136
Other 101 111
Total current assets 3,458 5,049
NON-CURRENT ASSETS
Receivables 9 134 134
Other financial assets 20(C) 46 49
Investments accounted for under the equity method 197 134
Property, plant and equipment 11 11,670 10,715
Intangible assets 12 909 803
Deferred tax assets 13 39 333
Other 252 313
Total non-current assets 13,247 12,481
Total assets 16,705 17,530
CURRENT LIABILITIES
Payables 1,986 1,881
Revenue received in advance 14 3,525 3,584
Interest-bearing liabilities 15 441 771
Other financial liabilities 20(C) 203 416
Provisions 16 873 818
Total current liabilities 7,028 7,470
NON-CURRENT LIABILITIES
Revenue received in advance 14 1,521 1,359
Interest-bearing liabilities 15 4,421 4,791
Other financial liabilities 20(C) 61 68
Provisions 16 414 395
Total non-current liabilities 6,417 6,613
Total liabilities 13,445 14,083
Net assets 3,260 3,447
EQUITY
Issued capital 17(A) 3,625 4,630
Treasury shares (50) (7)
Reserves (220) (66)
Retained earnings (100) (1,115)
Equity attributable to the members of Qantas 3,255 3,442
Non-controlling interests 5 5
Total equity 3,260 3,447
The above Consolidated Balance Sheet should be read in conjunction with the accompanying notes.
54
Q A N T A S A N N U A L R E P O R T 2 0 1 6
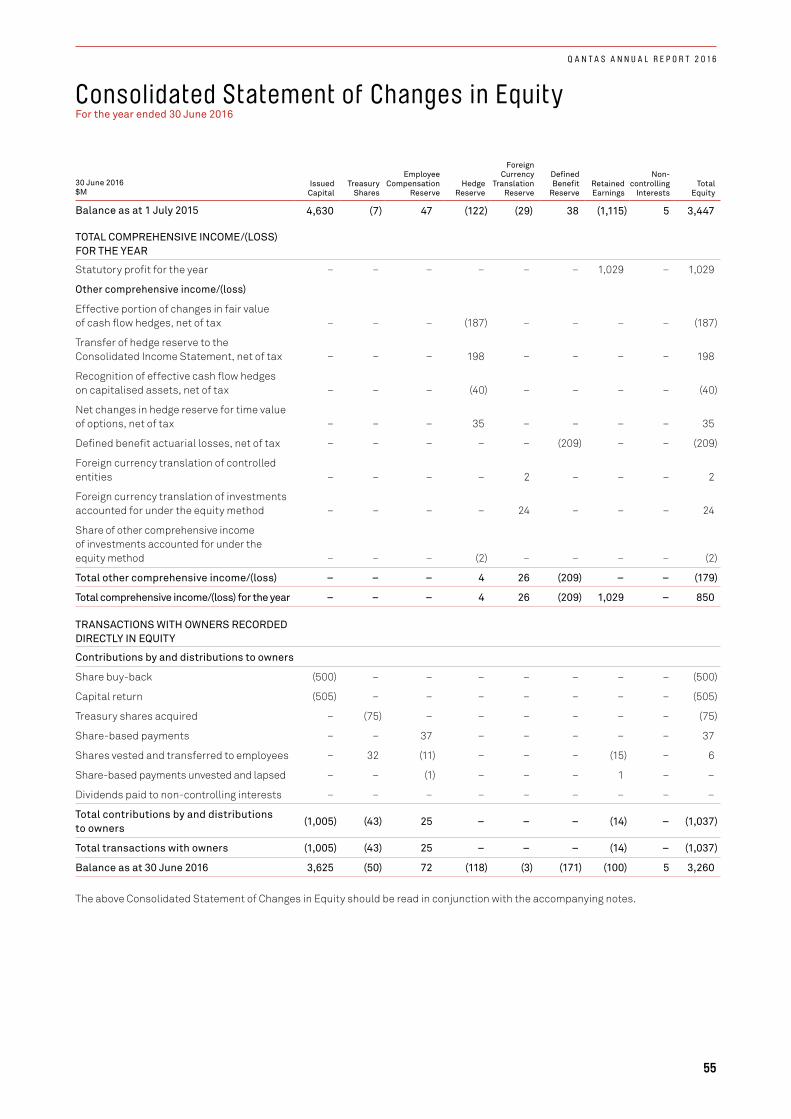
Consolidated Statement of Changes in EquityFor the year ended 30 June 2016
30 June 2016 $M
Issued Capital
Treasury Shares
Employee Compensation
ReserveHedge
Reserve
Foreign Currency
Translation Reserve
Defined Benefit
ReserveRetained Earnings
Non- controlling
InterestsTotal
Equity
Balance as at 1 July 2015 4,630 (7) 47 (122) (29) 38 (1,115) 5 3,447
TOTAL COMPREHENSIVE INCOME/(LOSS) FOR THE YEAR
Statutory profit for the year – – – – – – 1,029 – 1,029
Other comprehensive income/(loss)
Effective portion of changes in fair value of cash flow hedges, net of tax – – – (187) – – – – (187)
Transfer of hedge reserve to the Consolidated Income Statement, net of tax – – – 198 – – – – 198
Recognition of effective cash flow hedges on capitalised assets, net of tax – – – (40) – – – – (40)
Net changes in hedge reserve for time value of options, net of tax – – – 35 – – – – 35
Defined benefit actuarial losses, net of tax – – – – – (209) – – (209)
Foreign currency translation of controlled entities – – – – 2 – – – 2
Foreign currency translation of investments accounted for under the equity method – – – – 24 – – – 24
Share of other comprehensive income of investments accounted for under the equity method – – – (2) – – – – (2)
Total other comprehensive income/(loss) – – – 4 26 (209) – – (179)
Total comprehensive income/(loss) for the year – – – 4 26 (209) 1,029 – 850
TRANSACTIONS WITH OWNERS RECORDED DIRECTLY IN EQUITY
Contributions by and distributions to owners
Share buy-back (500) – – – – – – – (500)
Capital return (505) – – – – – – – (505)
Treasury shares acquired – (75) – – – – – – (75)
Share-based payments – – 37 – – – – – 37
Shares vested and transferred to employees – 32 (11) – – – (15) – 6
Share-based payments unvested and lapsed – – (1) – – – 1 – –
Dividends paid to non-controlling interests – – – – – – – – –
Total contributions by and distributions to owners
(1,005) (43) 25 – – – (14) – (1,037)
Total transactions with owners (1,005) (43) 25 – – – (14) – (1,037)
Balance as at 30 June 2016 3,625 (50) 72 (118) (3) (171) (100) 5 3,260
The above Consolidated Statement of Changes in Equity should be read in conjunction with the accompanying notes.
55
Q A N T A S A N N U A L R E P O R T 2 0 1 6

Consolidated Statement of Changes in EquityFor the year ended 30 June 2016
30 June 2015 $M
Issued Capital
Treasury Shares
Employee Compensation
ReserveHedge
Reserve
Foreign Currency
Translation Reserve
Defined Benefit
ReserveRetained Earnings
Non- controlling
InterestsTotal
Equity
Balance as at 1 July 2014 4,630 (16) 32 (72) (41) – (1,671) 4 2,866
TOTAL COMPREHENSIVE INCOME/(LOSS) FOR THE YEAR
Statutory profit for the year – – – – – – 557 3 560
Other comprehensive income/(loss)
Effective portion of changes in fair value of cash flow hedges, net of tax – – – (44) – – – – (44)
Transfer of hedge reserve to the Consolidated Income Statement, net of tax – – – 91 – – – – 91
Recognition of effective cash flow hedges on capitalised assets, net of tax – – – (2) – – – – (2)
Net changes in hedge reserve for time value of options, net of tax – – – (95) – – – – (95)
Defined benefit actuarial gains, net of tax – – – – – 38 – – 38
Foreign currency translation of controlled entities – – – – 4 – – 1 5
Foreign currency translation of investments accounted for under the equity method – – – – 5 – – – 5
Total other comprehensive income/(loss) – – – (50) 9 38 – 1 (2)
Total comprehensive income/(loss) for the year – – – (50) 9 38 557 4 558
TRANSACTIONS WITH OWNERS RECORDED DIRECTLY IN EQUITY
Contributions by and distributions to owners
Treasury shares acquired – (1) – – – – – – (1)
Share-based payments – – 29 – – – – – 29
Shares vested and transferred to employees – 10 (8) – – – (2) – –
Share-based payments unvested and lapsed – – (6) – – – 1 – (5)
Dividends paid to non-controlling interests – – – – – – – (4) (4)
Total contributions by and distributions to owners
– 9 15 – – – (1) (4) 19
Change in ownership interest in subsidiaries
Deconsolidation of controlled entity – – – – 3 – – – 3
Acquisition of non-controlling interest – – – – – – – 1 1
Total change in ownership interest – – – – 3 – – 1 4
Total transactions with owners – 9 15 – 3 – (1) (3) 23
Balance as at 30 June 2015 4,630 (7) 47 (122) (29) 38 (1,115) 5 3,447
The above Consolidated Statement of Changes in Equity should be read in conjunction with the accompanying notes.
56
Q A N T A S A N N U A L R E P O R T 2 0 1 6
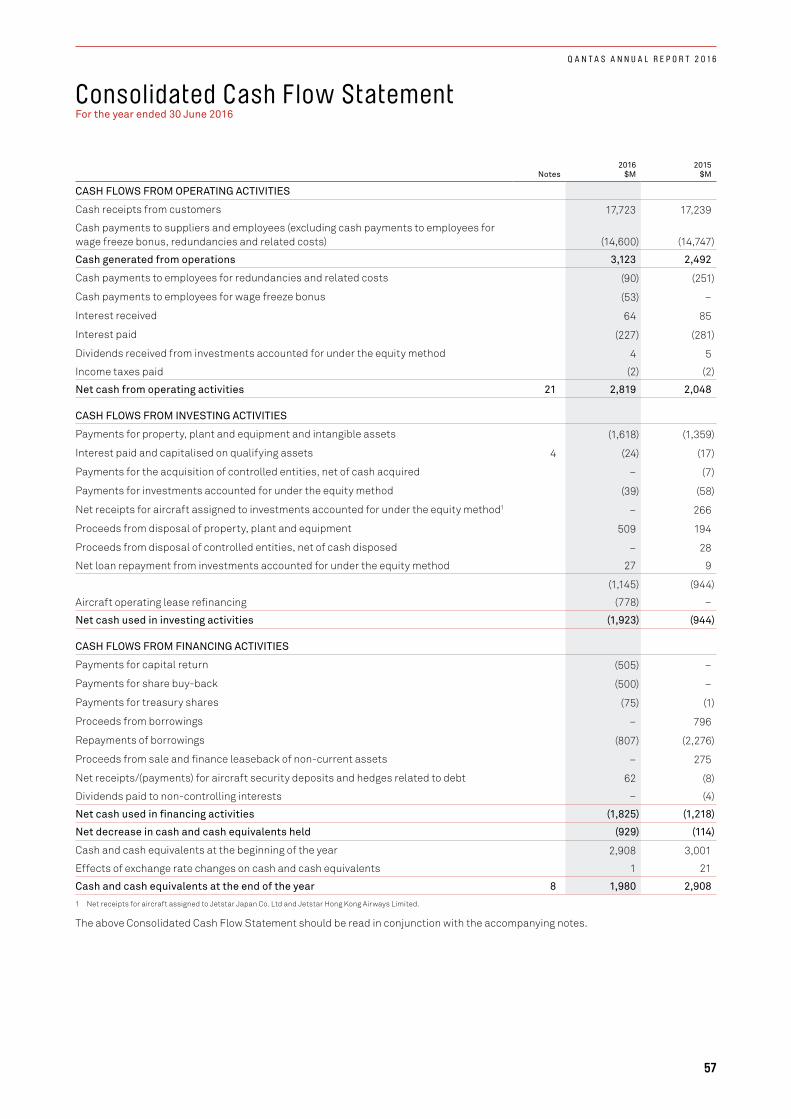
Consolidated Cash Flow StatementFor the year ended 30 June 2016
Notes2016
$M2015
$M
CASH FLOWS FROM OPERATING ACTIVITIES
Cash receipts from customers 17,723 17,239
Cash payments to suppliers and employees (excluding cash payments to employees for wage freeze bonus, redundancies and related costs) (14,600) (14,747)
Cash generated from operations 3,123 2,492
Cash payments to employees for redundancies and related costs (90) (251)
Cash payments to employees for wage freeze bonus (53) –
Interest received 64 85
Interest paid (227) (281)
Dividends received from investments accounted for under the equity method 4 5
Income taxes paid (2) (2)
Net cash from operating activities 21 2,819 2,048
CASH FLOWS FROM INVESTING ACTIVITIES
Payments for property, plant and equipment and intangible assets (1,618) (1,359)
Interest paid and capitalised on qualifying assets 4 (24) (17)
Payments for the acquisition of controlled entities, net of cash acquired – (7)
Payments for investments accounted for under the equity method (39) (58)
Net receipts for aircraft assigned to investments accounted for under the equity method1 – 266
Proceeds from disposal of property, plant and equipment 509 194
Proceeds from disposal of controlled entities, net of cash disposed – 28
Net loan repayment from investments accounted for under the equity method 27 9
(1,145) (944)
Aircraft operating lease refinancing (778) –
Net cash used in investing activities (1,923) (944)
CASH FLOWS FROM FINANCING ACTIVITIES
Payments for capital return (505) –
Payments for share buy-back (500) –
Payments for treasury shares (75) (1)
Proceeds from borrowings – 796
Repayments of borrowings (807) (2,276)
Proceeds from sale and finance leaseback of non-current assets – 275
Net receipts/(payments) for aircraft security deposits and hedges related to debt 62 (8)
Dividends paid to non-controlling interests – (4)
Net cash used in financing activities (1,825) (1,218)
Net decrease in cash and cash equivalents held (929) (114)
Cash and cash equivalents at the beginning of the year 2,908 3,001
Effects of exchange rate changes on cash and cash equivalents 1 21
Cash and cash equivalents at the end of the year 8 1,980 2,908
1 Net receipts for aircraft assigned to Jetstar Japan Co. Ltd and Jetstar Hong Kong Airways Limited.
The above Consolidated Cash Flow Statement should be read in conjunction with the accompanying notes.
57
Q A N T A S A N N U A L R E P O R T 2 0 1 6
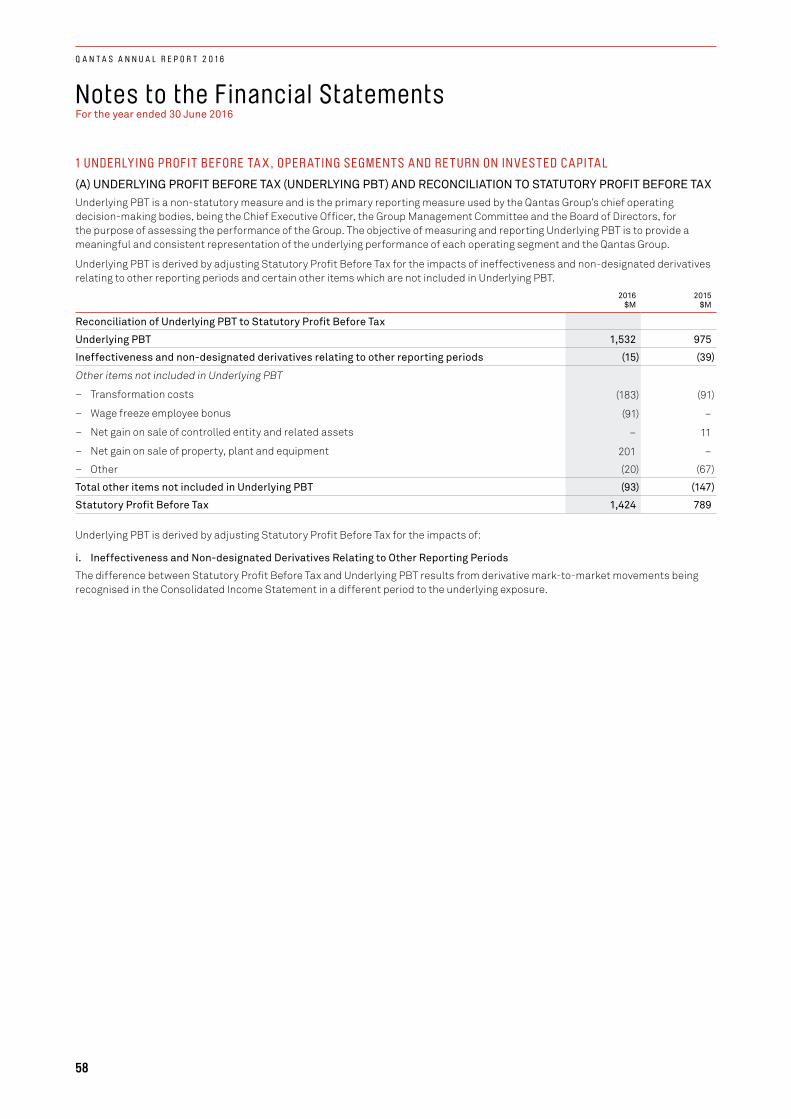
Notes to the Financial Statements For the year ended 30 June 2016
1 UNDERLYING PROFIT BEFORE TA X, OPER ATING SEGMENTS AND RE TURN ON INVESTED CAPITAL
(A) UNDERLYING PROFIT BEFORE TAX (UNDERLYING PBT) AND RECONCILIATION TO STATUTORY PROFIT BEFORE TAXUnderlying PBT is a non-statutory measure and is the primary reporting measure used by the Qantas Group’s chief operating decision-making bodies, being the Chief Executive Officer, the Group Management Committee and the Board of Directors, for the purpose of assessing the performance of the Group. The objective of measuring and reporting Underlying PBT is to provide a meaningful and consistent representation of the underlying performance of each operating segment and the Qantas Group.
Underlying PBT is derived by adjusting Statutory Profit Before Tax for the impacts of ineffectiveness and non-designated derivatives relating to other reporting periods and certain other items which are not included in Underlying PBT.
2016 $M
2015 $M
Reconciliation of Underlying PBT to Statutory Profit Before Tax
Underlying PBT 1,532 975
Ineffectiveness and non-designated derivatives relating to other reporting periods (15) (39)
Other items not included in Underlying PBT
– Transformation costs (183) (91)
– Wage freeze employee bonus (91) –
– Net gain on sale of controlled entity and related assets – 11
– Net gain on sale of property, plant and equipment 201 –
– Other (20) (67)
Total other items not included in Underlying PBT (93) (147)
Statutory Profit Before Tax 1,424 789
Underlying PBT is derived by adjusting Statutory Profit Before Tax for the impacts of:
i. Ineffectiveness and Non-designated Derivatives Relating to Other Reporting Periods
The difference between Statutory Profit Before Tax and Underlying PBT results from derivative mark-to-market movements being recognised in the Consolidated Income Statement in a different period to the underlying exposure.
58
Q A N T A S A N N U A L R E P O R T 2 0 1 6
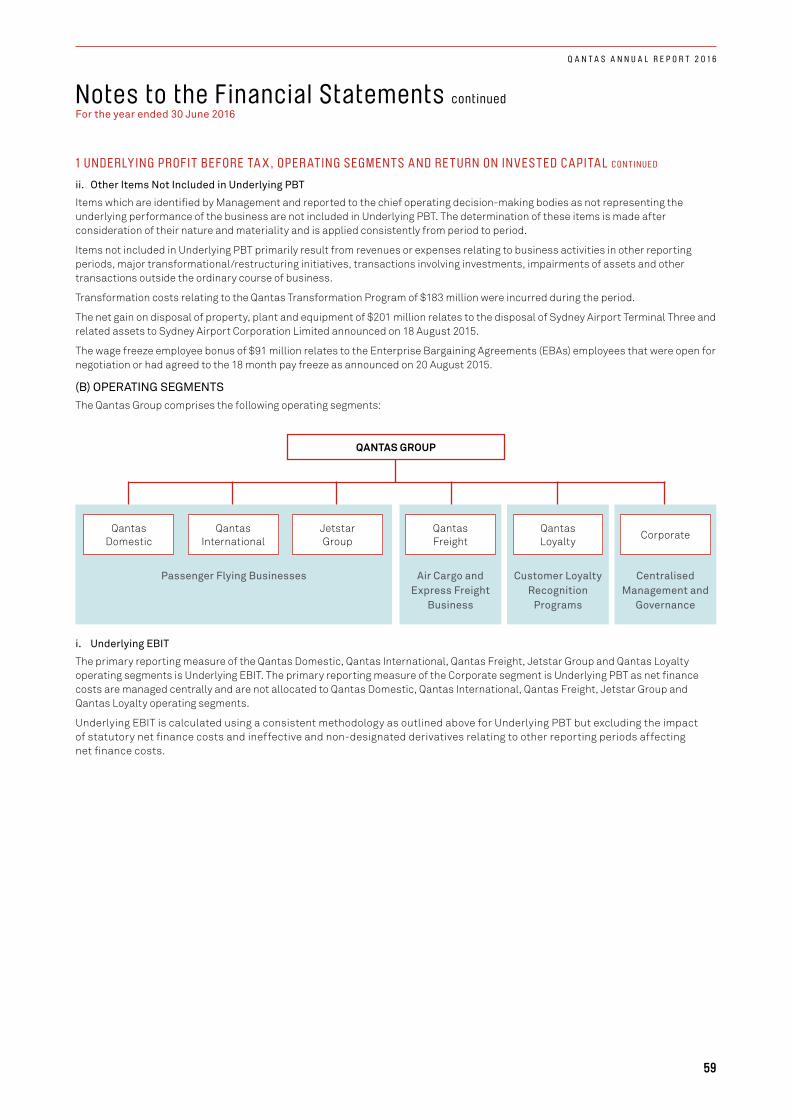
Notes to the Financial Statements continued For the year ended 30 June 2016
1 UNDERLYING PROFIT BEFORE TA X, OPER ATING SEGMENTS AND RE TURN ON INVESTED CAPITAL C ON T INUE D
ii. Other Items Not Included in Underlying PBT
Items which are identified by Management and reported to the chief operating decision-making bodies as not representing the underlying performance of the business are not included in Underlying PBT. The determination of these items is made after consideration of their nature and materiality and is applied consistently from period to period.
Items not included in Underlying PBT primarily result from revenues or expenses relating to business activities in other reporting periods, major transformational/restructuring initiatives, transactions involving investments, impairments of assets and other transactions outside the ordinary course of business.
Transformation costs relating to the Qantas Transformation Program of $183 million were incurred during the period.
The net gain on disposal of property, plant and equipment of $201 million relates to the disposal of Sydney Airport Terminal Three and related assets to Sydney Airport Corporation Limited announced on 18 August 2015.
The wage freeze employee bonus of $91 million relates to the Enterprise Bargaining Agreements (EBAs) employees that were open for negotiation or had agreed to the 18 month pay freeze as announced on 20 August 2015.
(B) OPERATING SEGMENTSThe Qantas Group comprises the following operating segments:
Passenger Flying Businesses
Jetstar Group
Qantas Domestic
Qantas International
QANTAS GROUP
Air Cargo and Express Freight
Business
Qantas Freight
Customer Loyalty Recognition
Programs
Qantas Loyalty
Centralised Management and
Governance
Corporate
i. Underlying EBIT
The primary reporting measure of the Qantas Domestic, Qantas International, Qantas Freight, Jetstar Group and Qantas Loyalty operating segments is Underlying EBIT. The primary reporting measure of the Corporate segment is Underlying PBT as net finance costs are managed centrally and are not allocated to Qantas Domestic, Qantas International, Qantas Freight, Jetstar Group and Qantas Loyalty operating segments.
Underlying EBIT is calculated using a consistent methodology as outlined above for Underlying PBT but excluding the impact of statutory net finance costs and ineffective and non-designated derivatives relating to other reporting periods affecting net finance costs.
59
Q A N T A S A N N U A L R E P O R T 2 0 1 6

Notes to the Financial Statements continuedFor the year ended 30 June 2016
1 UNDERLYING PROFIT BEFORE TA X, OPER ATING SEGMENTS AND RE TURN ON INVESTED CAPITAL C ON T INUE D
2016 $M
Qantas Domestic
Qantas International
Qantas Freight
Jetstar Group
Qantas Loyalty Corporate
Unallocated/ Eliminations2 Consolidated
REVENUE AND OTHER INCOME
External segment revenue and other income 5,226 5,173 973 3,475 1,332 13 8 16,200
Inter-segment revenue and other income 484 577 9 161 122 – (1,353) –
Total segment revenue and other income 5,710 5,750 982 3,636 1,454 13 (1,345) 16,200
Share of net profit/(loss) of investments accounted for under the equity method
3 4 – (7) – – – –
Underlying EBITDAR1 1,276 1,013 96 866 359 (157) (17) 3,436
Non-cancellable aircraft operating lease rentals (174) (69) (6) (208) – – (4) (461)
Depreciation and amortisation (524) (432) (26) (206) (13) (11) (12) (1,224)
Underlying EBIT 578 512 64 452 346 (168) (33) 1,751
Underlying net finance costs (219) (219)
Underlying PBT (387) 1,532
ROIC %3 22.7%
2015 $M
Qantas Domestic
Qantas International
Qantas Freight
Jetstar Group
Qantas Loyalty Corporate
Unallocated/ Eliminations2 Consolidated
REVENUE AND OTHER INCOME
External segment revenue and other income 5,291 4,878 1,059 3,283 1,244 7 54 15,816
Inter-segment revenue and other income 537 589 8 181 118 – (1,433) –
Total segment revenue and other income 5,828 5,467 1,067 3,464 1,362 7 (1,379) 15,816
Share of net profit/(loss) of investments accounted for under the equity method
4 4 – (37) – – – (29)
Underlying EBITDAR1 1,171 706 156 625 323 (150) (7) 2,824
Non-cancellable aircraft operating lease rentals (219) (42) (5) (229) – – – (495)
Depreciation and amortisation (472) (397) (37) (166) (8) (13) (3) (1,096)
Underlying EBIT 480 267 114 230 315 (163) (10) 1,233
Underlying net finance costs (258) (258)
Underlying PBT (421) 975
ROIC %3 16.2%
1 Underlying EBITDAR represents Underlying earnings before income tax expense, depreciation, amortisation, non-cancellable aircraft operating lease rentals and net finance costs.2 Unallocated/Eliminations represents unallocated and other businesses of the Qantas Group which are not considered to be reportable segments including consolidation elimination entries.3 ROIC % represents Return on Invested Capital (ROIC) EBIT divided by Average Invested Capital (Refer to Note 1(C)).
(C) RETURN ON INVESTED CAPITALReturn on Invested Capital (ROIC %) is a non-statutory measure and is the primary financial return measure of the Group. ROIC % is calculated as Return on Invested Capital EBIT (ROIC EBIT) divided by Average Invested Capital.
i. ROIC EBIT
ROIC EBIT is derived by adjusting Underlying EBIT to exclude non-cancellable aircraft operating lease rentals and include notional depreciation for these aircraft to account for them as if they were owned aircraft.
60
Q A N T A S A N N U A L R E P O R T 2 0 1 6
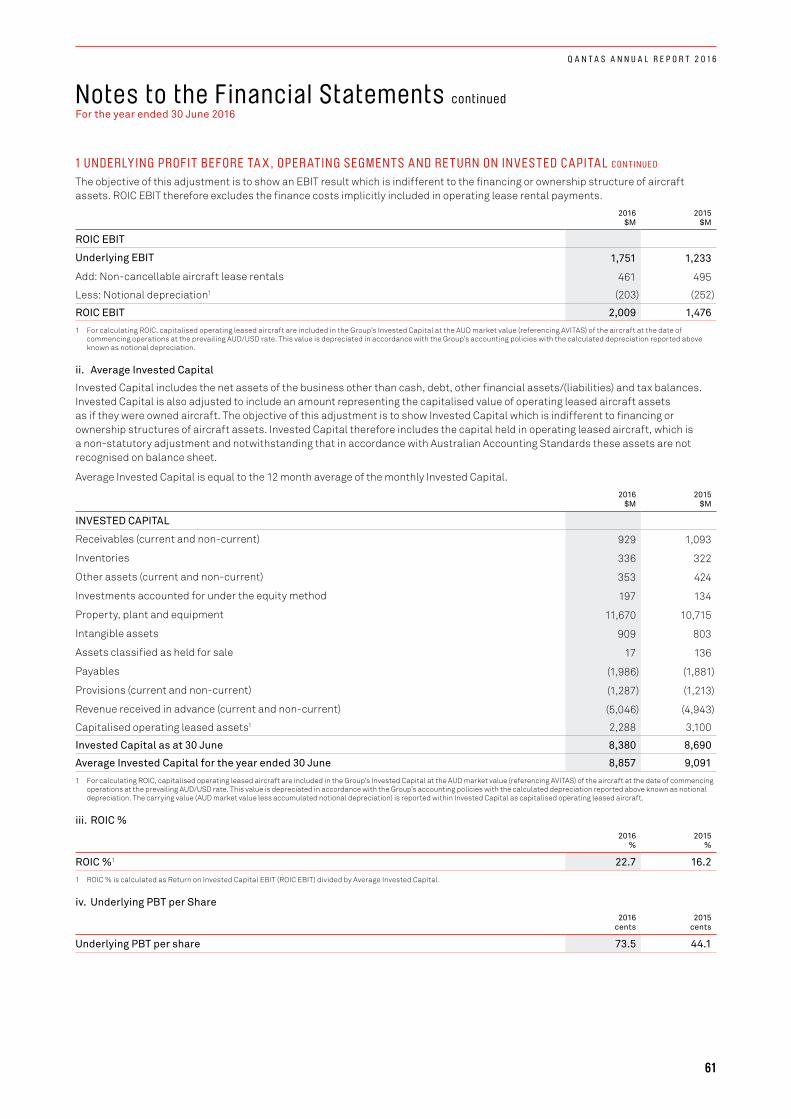
Notes to the Financial Statements continued For the year ended 30 June 2016
1 UNDERLYING PROFIT BEFORE TA X, OPER ATING SEGMENTS AND RE TURN ON INVESTED CAPITAL C ON T INUE D
The objective of this adjustment is to show an EBIT result which is indifferent to the financing or ownership structure of aircraft assets. ROIC EBIT therefore excludes the finance costs implicitly included in operating lease rental payments.
2016 $M
2015 $M
ROIC EBIT
Underlying EBIT 1,751 1,233
Add: Non-cancellable aircraft lease rentals 461 495
Less: Notional depreciation1 (203) (252)
ROIC EBIT 2,009 1,476
1 For calculating ROIC, capitalised operating leased aircraft are included in the Group’s Invested Capital at the AUD market value (referencing AVITAS) of the aircraft at the date of commencing operations at the prevailing AUD/USD rate. This value is depreciated in accordance with the Group’s accounting policies with the calculated depreciation reported above known as notional depreciation.
ii. Average Invested Capital
Invested Capital includes the net assets of the business other than cash, debt, other financial assets/(liabilities) and tax balances. Invested Capital is also adjusted to include an amount representing the capitalised value of operating leased aircraft assets as if they were owned aircraft. The objective of this adjustment is to show Invested Capital which is indifferent to financing or ownership structures of aircraft assets. Invested Capital therefore includes the capital held in operating leased aircraft, which is a non-statutory adjustment and notwithstanding that in accordance with Australian Accounting Standards these assets are not recognised on balance sheet.
Average Invested Capital is equal to the 12 month average of the monthly Invested Capital.
2016 $M
2015 $M
INVESTED CAPITAL
Receivables (current and non-current) 929 1,093
Inventories 336 322
Other assets (current and non-current) 353 424
Investments accounted for under the equity method 197 134
Property, plant and equipment 11,670 10,715
Intangible assets 909 803
Assets classified as held for sale 17 136
Payables (1,986) (1,881)
Provisions (current and non-current) (1,287) (1,213)
Revenue received in advance (current and non-current) (5,046) (4,943)
Capitalised operating leased assets1 2,288 3,100
Invested Capital as at 30 June 8,380 8,690
Average Invested Capital for the year ended 30 June 8,857 9,091
1 For calculating ROIC, capitalised operating leased aircraft are included in the Group’s Invested Capital at the AUD market value (referencing AVITAS) of the aircraft at the date of commencing operations at the prevailing AUD/USD rate. This value is depreciated in accordance with the Group’s accounting policies with the calculated depreciation reported above known as notional depreciation. The carrying value (AUD market value less accumulated notional depreciation) is reported within Invested Capital as capitalised operating leased aircraft.
iii. ROIC %2016
%2015
%
ROIC %1 22.7 16.2
1 ROIC % is calculated as Return on Invested Capital EBIT (ROIC EBIT) divided by Average Invested Capital.
iv. Underlying PBT per Share2016
cents2015
cents
Underlying PBT per share 73.5 44.1
61
Q A N T A S A N N U A L R E P O R T 2 0 1 6
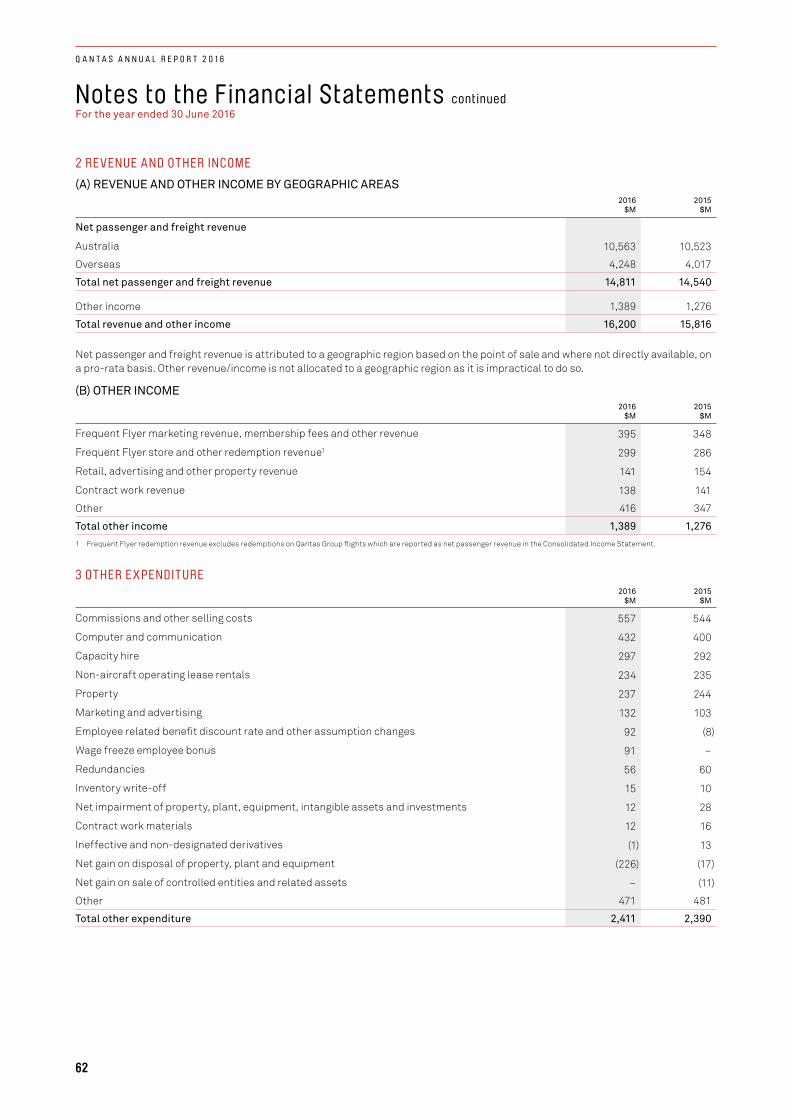
Notes to the Financial Statements continuedFor the year ended 30 June 2016
2 RE VENUE AND OTHER INCOME
(A) REVENUE AND OTHER INCOME BY GEOGRAPHIC AREAS2016
$M2015
$M
Net passenger and freight revenue
Australia 10,563 10,523
Overseas 4,248 4,017
Total net passenger and freight revenue 14,811 14,540
Other income 1,389 1,276
Total revenue and other income 16,200 15,816
Net passenger and freight revenue is attributed to a geographic region based on the point of sale and where not directly available, on a pro-rata basis. Other revenue/income is not allocated to a geographic region as it is impractical to do so.
(B) OTHER INCOME2016
$M2015
$M
Frequent Flyer marketing revenue, membership fees and other revenue 395 348
Frequent Flyer store and other redemption revenue1 299 286
Retail, advertising and other property revenue 141 154
Contract work revenue 138 141
Other 416 347
Total other income 1,389 1,276
1 Frequent Flyer redemption revenue excludes redemptions on Qantas Group flights which are reported as net passenger revenue in the Consolidated Income Statement.
3 OTHER E XPENDITURE 2016
$M2015
$M
Commissions and other selling costs 557 544
Computer and communication 432 400
Capacity hire 297 292
Non-aircraft operating lease rentals 234 235
Property 237 244
Marketing and advertising 132 103
Employee related benefit discount rate and other assumption changes 92 (8)
Wage freeze employee bonus 91 –
Redundancies 56 60
Inventory write-off 15 10
Net impairment of property, plant, equipment, intangible assets and investments 12 28
Contract work materials 12 16
Ineffective and non-designated derivatives (1) 13
Net gain on disposal of property, plant and equipment (226) (17)
Net gain on sale of controlled entities and related assets – (11)
Other 471 481
Total other expenditure 2,411 2,390
62
Q A N T A S A N N U A L R E P O R T 2 0 1 6
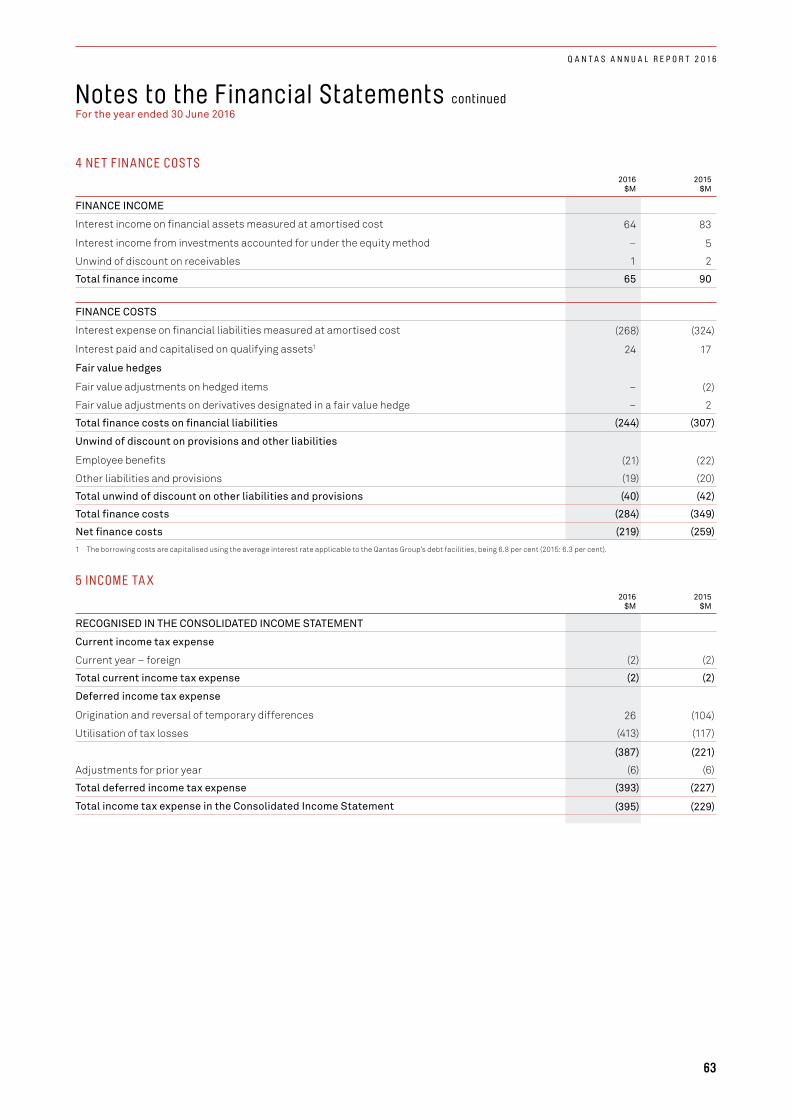
Notes to the Financial Statements continued For the year ended 30 June 2016
4 NE T FINANCE COSTS2016
$M2015
$M
FINANCE INCOME
Interest income on financial assets measured at amortised cost 64 83
Interest income from investments accounted for under the equity method – 5
Unwind of discount on receivables 1 2
Total finance income 65 90
FINANCE COSTS
Interest expense on financial liabilities measured at amortised cost (268) (324)
Interest paid and capitalised on qualifying assets1 24 17
Fair value hedges
Fair value adjustments on hedged items – (2)
Fair value adjustments on derivatives designated in a fair value hedge – 2
Total finance costs on financial liabilities (244) (307)
Unwind of discount on provisions and other liabilities
Employee benefits (21) (22)
Other liabilities and provisions (19) (20)
Total unwind of discount on other liabilities and provisions (40) (42)
Total finance costs (284) (349)
Net finance costs (219) (259)
1 The borrowing costs are capitalised using the average interest rate applicable to the Qantas Group’s debt facilities, being 6.8 per cent (2015: 6.3 per cent).
5 INCOME TA X2016
$M2015
$M
RECOGNISED IN THE CONSOLIDATED INCOME STATEMENT
Current income tax expense
Current year – foreign (2) (2)
Total current income tax expense (2) (2)
Deferred income tax expense
Origination and reversal of temporary differences 26 (104)
Utilisation of tax losses (413) (117)
(387) (221)
Adjustments for prior year (6) (6)
Total deferred income tax expense (393) (227)
Total income tax expense in the Consolidated Income Statement (395) (229)
63
Q A N T A S A N N U A L R E P O R T 2 0 1 6

Notes to the Financial Statements continuedFor the year ended 30 June 2016
2016 $M
2015 $M
RECONCILIATION BETWEEN INCOME TAX EXPENSE AND STATUTORY PROFIT BEFORE INCOME TAX
Statutory profit before income tax expense 1,424 789
Income tax expense using the domestic corporate tax rate of 30 per cent (427) (237)
Adjusted for:
Non-assessable dividends from controlled entities 1 10
Non-deductible share of net loss for investments accounted for under the equity method – (14)
Non-deductible losses for foreign branches and controlled entities (6) (7)
Utilisation of previously unrecognised foreign branch and controlled entity losses 6 5
Utilisation of previously unrecognised capital losses 8 –
Non-assessable gain on disposal of property, plant and equipment 30 –
Write-down of investments – (2)
Other net non-assessable/(non-deductible) items 7 (4)
(Under)/over provision from prior periods (14) 20
Income tax expense (395) (229)
RECOGNISED IN THE CONSOLIDATED STATEMENT OF COMPREHENSIVE INCOME
Cash flow hedges (2) 21
Defined benefit actuarial (losses)/gains 89 (15)
Income tax benefit recognised directly in the Consolidated Statement of Comprehensive Income 87 6
Income tax payable was less than 30 per cent of the Qantas Group’s Statutory Profit Before Tax due to: – Utilisation of carry forward tax losses that reduce taxable income of $413 million (2015: $117 million) – Temporary differences of ($18 million) (2015: $112 million) which result in differences between taxable income which will reverse
in future periods and Statutory Profit Before Tax, such as accelerated tax depreciation on aircraft (timing difference due to the Qantas Group making a significant investment in renewing its fleet in recent years that will reverse in future tax periods)
2016 $M
2015 $M
RECONCILIATION OF INCOME TAX EXPENSE TO INCOME TAX PAYABLE
Income tax expense (395) (229)
Adjusted for temporary differences
Inventories 1 (1)
Property, plant and equipment and intangible assets 18 247
Payables (28) 2
Revenue received in advance (64) (25)
Interest-bearing liabilities (16) (14)
Other financial assets/(liabilities) 40 (49)
Provisions (26) 41
Other items 49 (97)
Prior period differences 8 8
Temporary differences (18) 112
Tax losses utilised 413 117
Income tax payable – –
5 INCOME TA X CON T INUED
64
Q A N T A S A N N U A L R E P O R T 2 0 1 6

Notes to the Financial Statements continued For the year ended 30 June 2016
6 DIVIDENDS AND OTHER SHAREHOLDER DISTRIBUTIONS
(A) DIVIDENDS DECLARED AND PAIDThe Directors have declared a fully franked final dividend of seven cents per ordinary share for the current year, totalling $134 million (2015: nil). Dividends are paid from the retained earnings and profits of Qantas Airways Limited, as the parent of the Group (refer to note 28).
For the year ended 30 June 2016, no dividends (2015:$4 million) were declared and paid to non-controlling interest shareholders by non-wholly owned controlled entities.
(B) OTHER SHAREHOLDER DISTRIBUTIONSIn addition to the dividend totalling $134 million above, the directors have announced an on-market share buy-back of up to $366 million. Shareholder approval will be sought at the Annual General Meeting on 21 October 2016 to buy back more than 10 per cent of shares on issue within a 12 month period.
In line with the Group’s Financial Framework, the Qantas Group has returned over $1 billion in surplus capital to shareholders in 2015/16.
In November 2015, the Group undertook a capital management initiative for Qantas shareholders comprising a distribution to shareholders of 23 cents per share and a related share consolidation. This resulted in a capital return of $505 million being paid to shareholders and an equal and proportionate share consolidation through the conversion of each share into 0.939 shares resulting in 134 million less shares on issue.
On 10 June 2016, the Qantas Group completed a $500 million on-market share buy-back which was announced in February 2016. The Group purchased 143 million shares for a weighted average price of $3.4819.
The $500 million on-market share buy-back combined with the $505 million capital return and associated share consolidation has resulted in the ordinary shares on issue decreasing by 12.6 per cent between 30 June 2015 and 30 June 2016.
(C) FRANKING ACCOUNT2016
$M2015
$M
Total franking account balance at 30 per cent 84 84
The above amount represents the balance of the franking account as at 30 June, after taking into account adjustments for: – Franking credits that will arise from the payment of income tax payable for the current year – Franking credits that will arise from the receipt of dividends recognised as receivables at the year end – Franking credits that may be prevented from being distributed in subsequent years
The ability to utilise the franking credits is dependent upon there being sufficient available profits to declare dividends.
(D) EARNINGS PER SHARE2016
Cents2015
Cents
Basic/diluted earnings per share 49.4 25.4
$M $M
Statutory profit attributable to members of Qantas 1,029 557
Number M
Number M
WEIGHTED AVERAGE NUMBER OF SHARES
Issued shares as at 1 July 2,196 2,196
Share consolidation (134) –
Shares bought back and cancelled (143) –
Issued shares as at 30 June 1,919 2,196
Weighted average number of shares (basic and diluted) as at 30 June 2,083 2,196
65
Q A N T A S A N N U A L R E P O R T 2 0 1 6
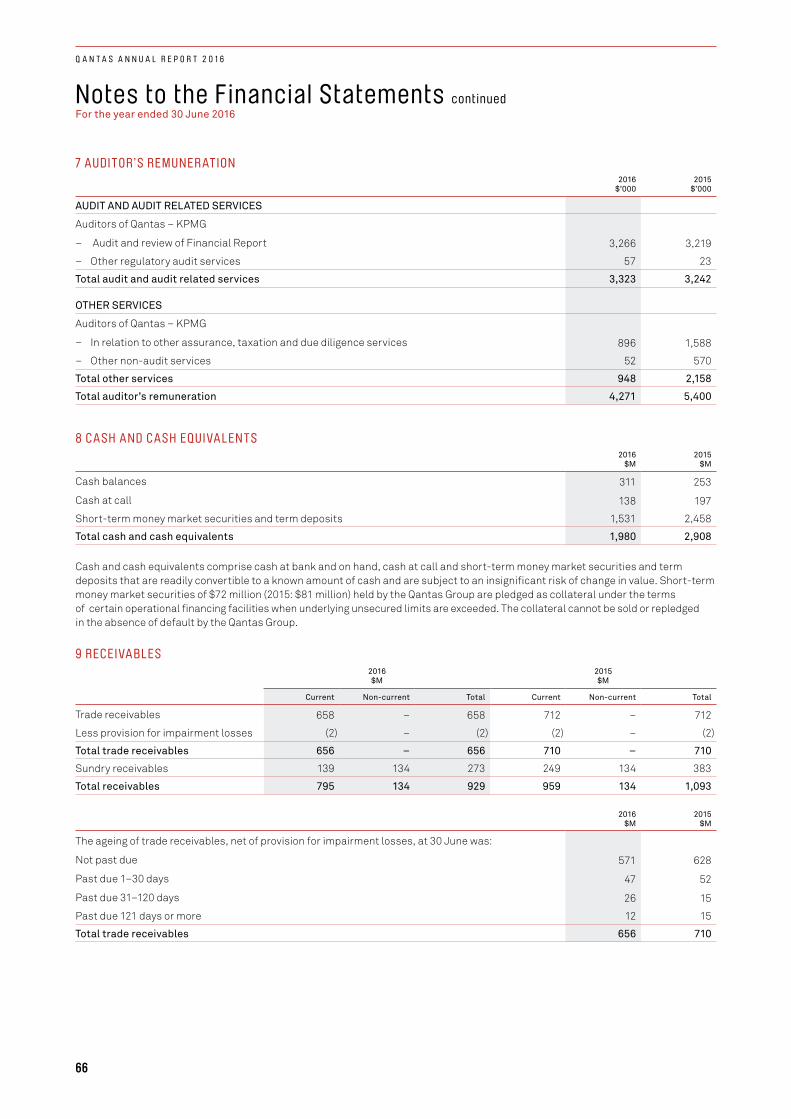
Notes to the Financial Statements continuedFor the year ended 30 June 2016
7 AUDITOR’S REMUNER ATION2016
$’0002015
$’000
AUDIT AND AUDIT RELATED SERVICES
Auditors of Qantas – KPMG
– Audit and review of Financial Report 3,266 3,219
– Other regulatory audit services 57 23
Total audit and audit related services 3,323 3,242
OTHER SERVICES
Auditors of Qantas – KPMG
– In relation to other assurance, taxation and due diligence services 896 1,588
– Other non-audit services 52 570
Total other services 948 2,158
Total auditor’s remuneration 4,271 5,400
8 CASH AND CASH EQUIVALENTS2016
$M2015
$M
Cash balances 311 253
Cash at call 138 197
Short-term money market securities and term deposits 1,531 2,458
Total cash and cash equivalents 1,980 2,908
Cash and cash equivalents comprise cash at bank and on hand, cash at call and short-term money market securities and term deposits that are readily convertible to a known amount of cash and are subject to an insignificant risk of change in value. Short-term money market securities of $72 million (2015: $81 million) held by the Qantas Group are pledged as collateral under the terms of certain operational financing facilities when underlying unsecured limits are exceeded. The collateral cannot be sold or repledged in the absence of default by the Qantas Group.
9 RECEIVABLES2016 $M
2015 $M
Current Non-current Total Current Non-current Total
Trade receivables 658 – 658 712 – 712
Less provision for impairment losses (2) – (2) (2) – (2)
Total trade receivables 656 – 656 710 – 710
Sundry receivables 139 134 273 249 134 383
Total receivables 795 134 929 959 134 1,093
2016 $M
2015 $M
The ageing of trade receivables, net of provision for impairment losses, at 30 June was:
Not past due 571 628
Past due 1–30 days 47 52
Past due 31–120 days 26 15
Past due 121 days or more 12 15
Total trade receivables 656 710
66
Q A N T A S A N N U A L R E P O R T 2 0 1 6
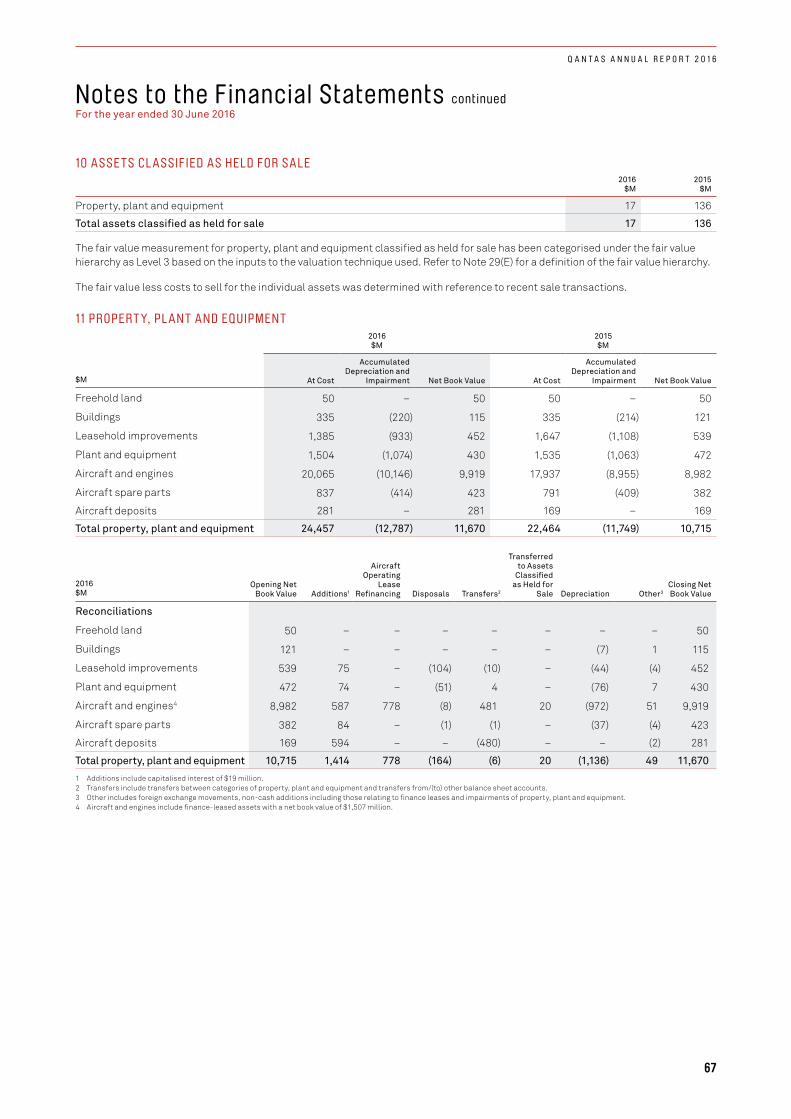
Notes to the Financial Statements continued For the year ended 30 June 2016
10 AS SE TS CL AS SIFIED AS HELD FOR SALE2016
$M2015
$M
Property, plant and equipment 17 136
Total assets classified as held for sale 17 136
The fair value measurement for property, plant and equipment classified as held for sale has been categorised under the fair value hierarchy as Level 3 based on the inputs to the valuation technique used. Refer to Note 29(E) for a definition of the fair value hierarchy.
The fair value less costs to sell for the individual assets was determined with reference to recent sale transactions.
11 PROPERT Y, PL ANT AND EQUIPMENT2016 $M
2015 $M
$M At Cost
Accumulated Depreciation and
Impairment Net Book Value At Cost
Accumulated Depreciation and
Impairment Net Book Value
Freehold land 50 – 50 50 – 50
Buildings 335 (220) 115 335 (214) 121
Leasehold improvements 1,385 (933) 452 1,647 (1,108) 539
Plant and equipment 1,504 (1,074) 430 1,535 (1,063) 472
Aircraft and engines 20,065 (10,146) 9,919 17,937 (8,955) 8,982
Aircraft spare parts 837 (414) 423 791 (409) 382
Aircraft deposits 281 – 281 169 – 169
Total property, plant and equipment 24,457 (12,787) 11,670 22,464 (11,749) 10,715
2016 $M
Opening Net Book Value Additions1
Aircraft Operating
Lease Refinancing Disposals Transfers2
Transferred to Assets
Classified as Held for
Sale Depreciation Other3Closing Net Book Value
Reconciliations
Freehold land 50 – – – – – – – 50
Buildings 121 – – – – – (7) 1 115
Leasehold improvements 539 75 – (104) (10) – (44) (4) 452
Plant and equipment 472 74 – (51) 4 – (76) 7 430
Aircraft and engines4 8,982 587 778 (8) 481 20 (972) 51 9,919
Aircraft spare parts 382 84 – (1) (1) – (37) (4) 423
Aircraft deposits 169 594 – – (480) – – (2) 281
Total property, plant and equipment 10,715 1,414 778 (164) (6) 20 (1,136) 49 11,670
1 Additions include capitalised interest of $19 million.2 Transfers include transfers between categories of property, plant and equipment and transfers from/(to) other balance sheet accounts.3 Other includes foreign exchange movements, non-cash additions including those relating to finance leases and impairments of property, plant and equipment.4 Aircraft and engines include finance-leased assets with a net book value of $1,507 million.
67
Q A N T A S A N N U A L R E P O R T 2 0 1 6

Notes to the Financial Statements continuedFor the year ended 30 June 2016
2015 $M
Opening Net Book Value Additions1
Aircraft Operating
Lease Refinancing Disposals Transfers2
Transferred to Assets
Classified as Held for
Sale Depreciation Other3Closing Net Book Value
Reconciliations
Freehold land 50 – – – – – – – 50
Buildings 102 – – – 29 – (10) – 121
Leasehold improvements 584 56 – – (65) – (43) 7 539
Plant and equipment 478 44 – (6) 36 – (81) 1 472
Aircraft and engines4 8,473 483 – (23) 829 (42) (841) 103 8,982
Aircraft spare parts 392 44 – (4) – 6 (39) (17) 382
Aircraft deposits 421 610 – (42) (819) – – (1) 169
Total property, plant and equipment 10,500 1,237 – (75) 10 (36) (1,014) 93 10,715
1 Additions include capitalised interest of $14 million.2 Transfers include transfers between categories of property, plant and equipment and transfers from/(to) other balance sheet accounts.3 Other includes foreign exchange movements, non-cash additions including those relating to finance leases and impairments of property, plant and equipment.4 Aircraft and engines include finance-leased assets with a net book value of $1,796 million.
i. Aircraft by Geographic Area
Aircraft supporting the Group’s global operations are primarily located in Australia.
ii. Secured Assets
Certain aircraft and engines act as security against related financings. Under the terms of certain financing facilities entered into by the Qantas Group, the underwriters to these agreements have a fixed charge over certain aircraft and engines to the extent that debt has been issued directly to those underwriters. The total carrying amount of assets under pledge is $4,245 million (2015: $4,822 million).
iii. Capital Expenditure Commitments
The Group’s capital expenditure commitments as at 30 June 2016 are $11,623 million (2015: $10,090 million). The Group has certain rights within its aircraft purchase contracts which can defer the above capital expenditure.
The Group’s capital expenditure commitments are predominantly denominated in US dollars. Capital expenditure commitments outlined above are translated to Australian dollar presentational currency at the 30 June 2016 closing exchange rate of $0.75 (30 June 2015: $0.77).
12 INTANGIBLE AS SE TS2016 $M
2015 $M
At Cost
Accumulated Depreciation and
Impairment Net Book Value At Cost
Accumulated Depreciation and
Impairment Net Book Value
Goodwill 208 – 208 206 – 206
Airport landing slots 35 – 35 35 – 35
Software 1,322 (720) 602 1,152 (638) 514
Brand names and trademarks 26 – 26 25 – 25
Customer contracts/relationships 27 (25) 2 27 (21) 6
Contract intangible assets 36 – 36 17 – 17
Total intangible assets 1,654 (745) 909 1,462 (659) 803
11 PROPERT Y, PL ANT AND EQUIPMENT CON T INUED
68
Q A N T A S A N N U A L R E P O R T 2 0 1 6
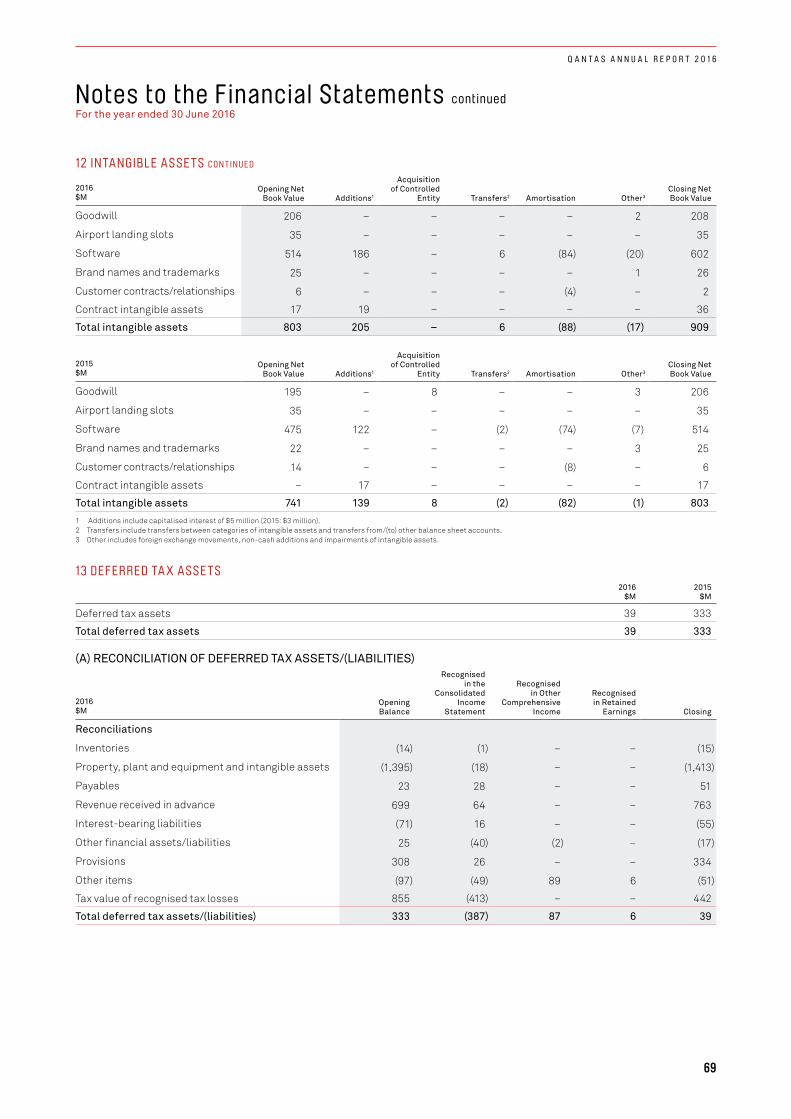
Notes to the Financial Statements continued For the year ended 30 June 2016
12 INTANGIBLE AS SE TS C ON T INUE D
2016 $M
Opening Net Book Value Additions1
Acquisition of Controlled
Entity Transfers2 Amortisation Other3Closing Net Book Value
Goodwill 206 – – – – 2 208
Airport landing slots 35 – – – – – 35
Software 514 186 – 6 (84) (20) 602
Brand names and trademarks 25 – – – – 1 26
Customer contracts/relationships 6 – – – (4) – 2
Contract intangible assets 17 19 – – – – 36
Total intangible assets 803 205 – 6 (88) (17) 909
2015 $M
Opening Net Book Value Additions1
Acquisition of Controlled
Entity Transfers2 Amortisation Other3Closing Net Book Value
Goodwill 195 – 8 – – 3 206
Airport landing slots 35 – – – – – 35
Software 475 122 – (2) (74) (7) 514
Brand names and trademarks 22 – – – – 3 25
Customer contracts/relationships 14 – – – (8) – 6
Contract intangible assets – 17 – – – – 17
Total intangible assets 741 139 8 (2) (82) (1) 803
1 Additions include capitalised interest of $5 million (2015: $3 million).2 Transfers include transfers between categories of intangible assets and transfers from/(to) other balance sheet accounts.3 Other includes foreign exchange movements, non-cash additions and impairments of intangible assets.
13 DEFERRED TA X AS SE TS2016
$M2015
$M
Deferred tax assets 39 333
Total deferred tax assets 39 333
(A) RECONCILIATION OF DEFERRED TAX ASSETS/(LIABILITIES)
2016 $M
Opening Balance
Recognised in the
Consolidated Income
Statement
Recognised in Other
Comprehensive Income
Recognised in Retained
Earnings Closing
Reconciliations
Inventories (14) (1) – – (15)
Property, plant and equipment and intangible assets (1,395) (18) – – (1,413)
Payables 23 28 – – 51
Revenue received in advance 699 64 – – 763
Interest-bearing liabilities (71) 16 – – (55)
Other financial assets/liabilities 25 (40) (2) – (17)
Provisions 308 26 – – 334
Other items (97) (49) 89 6 (51)
Tax value of recognised tax losses 855 (413) – – 442
Total deferred tax assets/(liabilities) 333 (387) 87 6 39
69
Q A N T A S A N N U A L R E P O R T 2 0 1 6
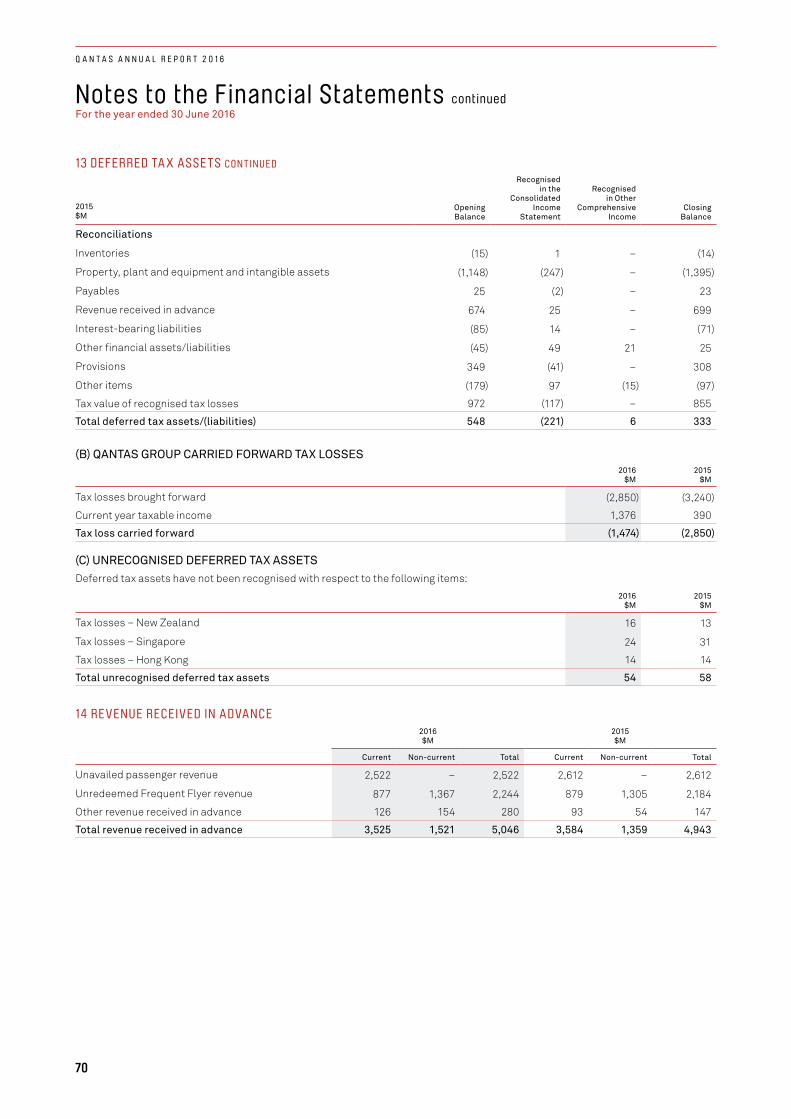
Notes to the Financial Statements continuedFor the year ended 30 June 2016
13 DEFERRED TA X AS SE TS CON T INUED
2015 $M
Opening Balance
Recognised in the
Consolidated Income
Statement
Recognised in Other
Comprehensive Income
Closing Balance
Reconciliations
Inventories (15) 1 – (14)
Property, plant and equipment and intangible assets (1,148) (247) – (1,395)
Payables 25 (2) – 23
Revenue received in advance 674 25 – 699
Interest-bearing liabilities (85) 14 – (71)
Other financial assets/liabilities (45) 49 21 25
Provisions 349 (41) – 308
Other items (179) 97 (15) (97)
Tax value of recognised tax losses 972 (117) – 855
Total deferred tax assets/(liabilities) 548 (221) 6 333
(B) QANTAS GROUP CARRIED FORWARD TAX LOSSES 2016
$M2015
$M
Tax losses brought forward (2,850) (3,240)
Current year taxable income 1,376 390
Tax loss carried forward (1,474) (2,850)
(C) UNRECOGNISED DEFERRED TAX ASSETSDeferred tax assets have not been recognised with respect to the following items:
2016 $M
2015 $M
Tax losses – New Zealand 16 13
Tax losses – Singapore 24 31
Tax losses – Hong Kong 14 14
Total unrecognised deferred tax assets 54 58
14 RE VENUE RECEIVED IN ADVANCE2016 $M
2015 $M
Current Non-current Total Current Non-current Total
Unavailed passenger revenue 2,522 – 2,522 2,612 – 2,612
Unredeemed Frequent Flyer revenue 877 1,367 2,244 879 1,305 2,184
Other revenue received in advance 126 154 280 93 54 147
Total revenue received in advance 3,525 1,521 5,046 3,584 1,359 4,943
70
Q A N T A S A N N U A L R E P O R T 2 0 1 6
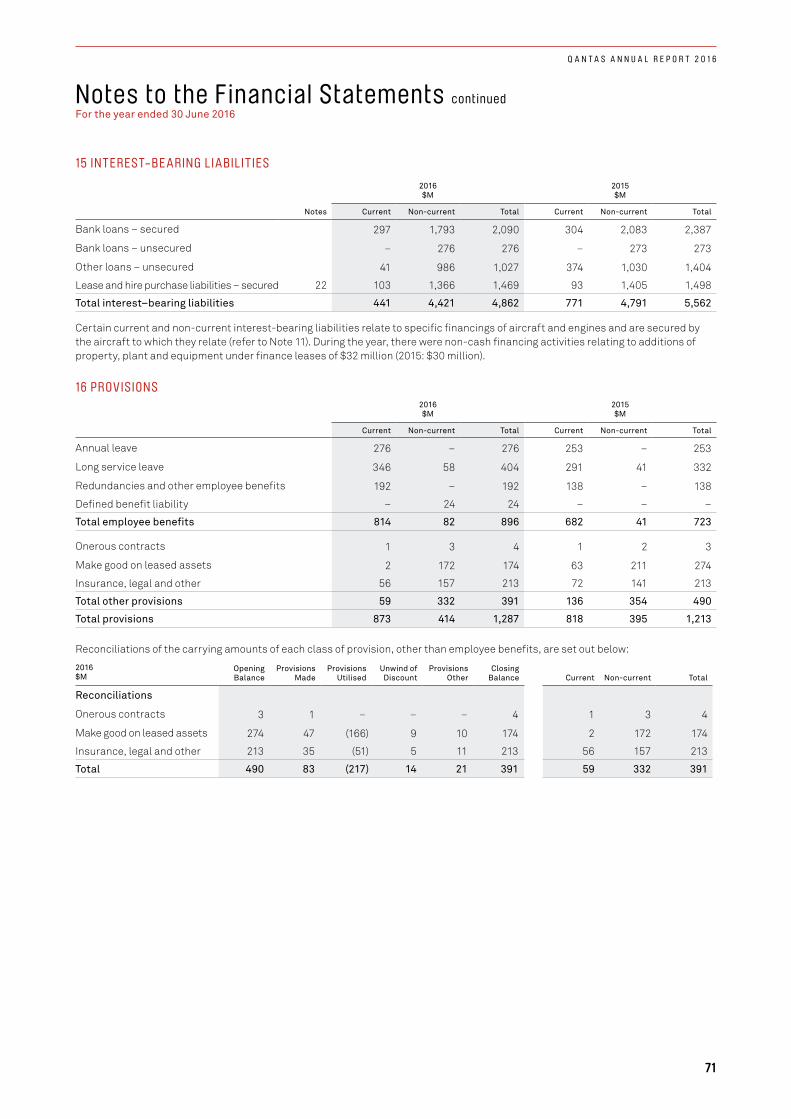
Notes to the Financial Statements continued For the year ended 30 June 2016
15 INTEREST-BE ARING LIABILITIES
2016 $M
2015 $M
Notes Current Non-current Total Current Non-current Total
Bank loans – secured 297 1,793 2,090 304 2,083 2,387
Bank loans – unsecured – 276 276 – 273 273
Other loans – unsecured 41 986 1,027 374 1,030 1,404
Lease and hire purchase liabilities – secured 22 103 1,366 1,469 93 1,405 1,498
Total interest–bearing liabilities 441 4,421 4,862 771 4,791 5,562
Certain current and non-current interest-bearing liabilities relate to specific financings of aircraft and engines and are secured by the aircraft to which they relate (refer to Note 11). During the year, there were non-cash financing activities relating to additions of property, plant and equipment under finance leases of $32 million (2015: $30 million).
16 PROVISIONS2016 $M
2015 $M
Current Non-current Total Current Non-current Total
Annual leave 276 – 276 253 – 253
Long service leave 346 58 404 291 41 332
Redundancies and other employee benefits 192 – 192 138 – 138
Defined benefit liability – 24 24 – – –
Total employee benefits 814 82 896 682 41 723
Onerous contracts 1 3 4 1 2 3
Make good on leased assets 2 172 174 63 211 274
Insurance, legal and other 56 157 213 72 141 213
Total other provisions 59 332 391 136 354 490
Total provisions 873 414 1,287 818 395 1,213
Reconciliations of the carrying amounts of each class of provision, other than employee benefits, are set out below:
2016 $M
Opening Balance
Provisions Made
Provisions Utilised
Unwind of Discount
Provisions Other
Closing Balance Current Non-current Total
Reconciliations
Onerous contracts 3 1 – – – 4 1 3 4
Make good on leased assets 274 47 (166) 9 10 174 2 172 174
Insurance, legal and other 213 35 (51) 5 11 213 56 157 213
Total 490 83 (217) 14 21 391 59 332 391
71
Q A N T A S A N N U A L R E P O R T 2 0 1 6
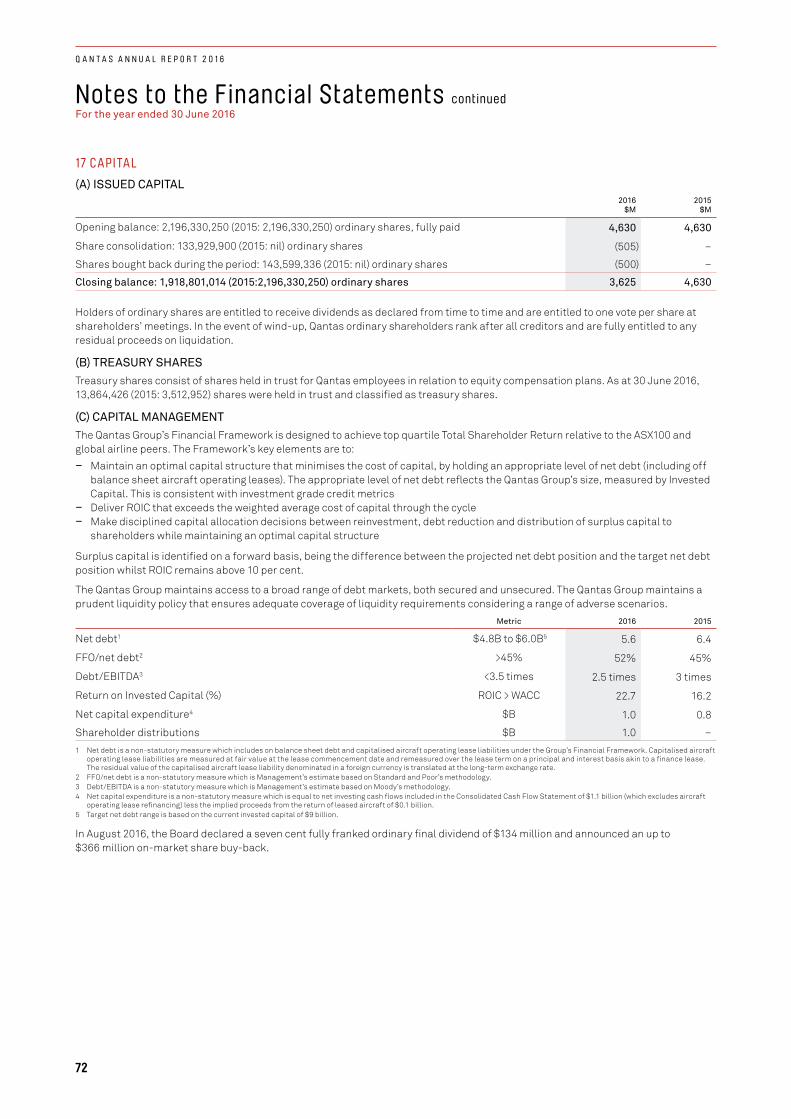
Notes to the Financial Statements continuedFor the year ended 30 June 2016
17 CAPITAL
(A) ISSUED CAPITAL2016
$M2015
$M
Opening balance: 2,196,330,250 (2015: 2,196,330,250) ordinary shares, fully paid 4,630 4,630
Share consolidation: 133,929,900 (2015: nil) ordinary shares (505) –
Shares bought back during the period: 143,599,336 (2015: nil) ordinary shares (500) –
Closing balance: 1,918,801,014 (2015:2,196,330,250) ordinary shares 3,625 4,630
Holders of ordinary shares are entitled to receive dividends as declared from time to time and are entitled to one vote per share at shareholders’ meetings. In the event of wind-up, Qantas ordinary shareholders rank after all creditors and are fully entitled to any residual proceeds on liquidation.
(B) TREASURY SHARESTreasury shares consist of shares held in trust for Qantas employees in relation to equity compensation plans. As at 30 June 2016, 13,864,426 (2015: 3,512,952) shares were held in trust and classified as treasury shares.
(C) CAPITAL MANAGEMENTThe Qantas Group’s Financial Framework is designed to achieve top quartile Total Shareholder Return relative to the ASX100 and global airline peers. The Framework’s key elements are to:
– Maintain an optimal capital structure that minimises the cost of capital, by holding an appropriate level of net debt (including off balance sheet aircraft operating leases). The appropriate level of net debt reflects the Qantas Group’s size, measured by Invested Capital. This is consistent with investment grade credit metrics
– Deliver ROIC that exceeds the weighted average cost of capital through the cycle – Make disciplined capital allocation decisions between reinvestment, debt reduction and distribution of surplus capital to
shareholders while maintaining an optimal capital structure
Surplus capital is identified on a forward basis, being the difference between the projected net debt position and the target net debt position whilst ROIC remains above 10 per cent.
The Qantas Group maintains access to a broad range of debt markets, both secured and unsecured. The Qantas Group maintains a prudent liquidity policy that ensures adequate coverage of liquidity requirements considering a range of adverse scenarios.
Metric 2016 2015
Net debt1 $4.8B to $6.0B5 5.6 6.4
FFO/net debt2 >45% 52% 45%
Debt/EBITDA3 <3.5 times 2.5 times 3 times
Return on Invested Capital (%) ROIC > WACC 22.7 16.2
Net capital expenditure4 $B 1.0 0.8
Shareholder distributions $B 1.0 –
1 Net debt is a non-statutory measure which includes on balance sheet debt and capitalised aircraft operating lease liabilities under the Group’s Financial Framework. Capitalised aircraft operating lease liabilities are measured at fair value at the lease commencement date and remeasured over the lease term on a principal and interest basis akin to a finance lease. The residual value of the capitalised aircraft lease liability denominated in a foreign currency is translated at the long-term exchange rate.
2 FFO/net debt is a non-statutory measure which is Management’s estimate based on Standard and Poor’s methodology. 3 Debt/EBITDA is a non-statutory measure which is Management’s estimate based on Moody’s methodology. 4 Net capital expenditure is a non-statutory measure which is equal to net investing cash flows included in the Consolidated Cash Flow Statement of $1.1 billion (which excludes aircraft
operating lease refinancing) less the implied proceeds from the return of leased aircraft of $0.1 billion.5 Target net debt range is based on the current invested capital of $9 billion.
In August 2016, the Board declared a seven cent fully franked ordinary final dividend of $134 million and announced an up to $366 million on-market share buy-back.
72
Q A N T A S A N N U A L R E P O R T 2 0 1 6
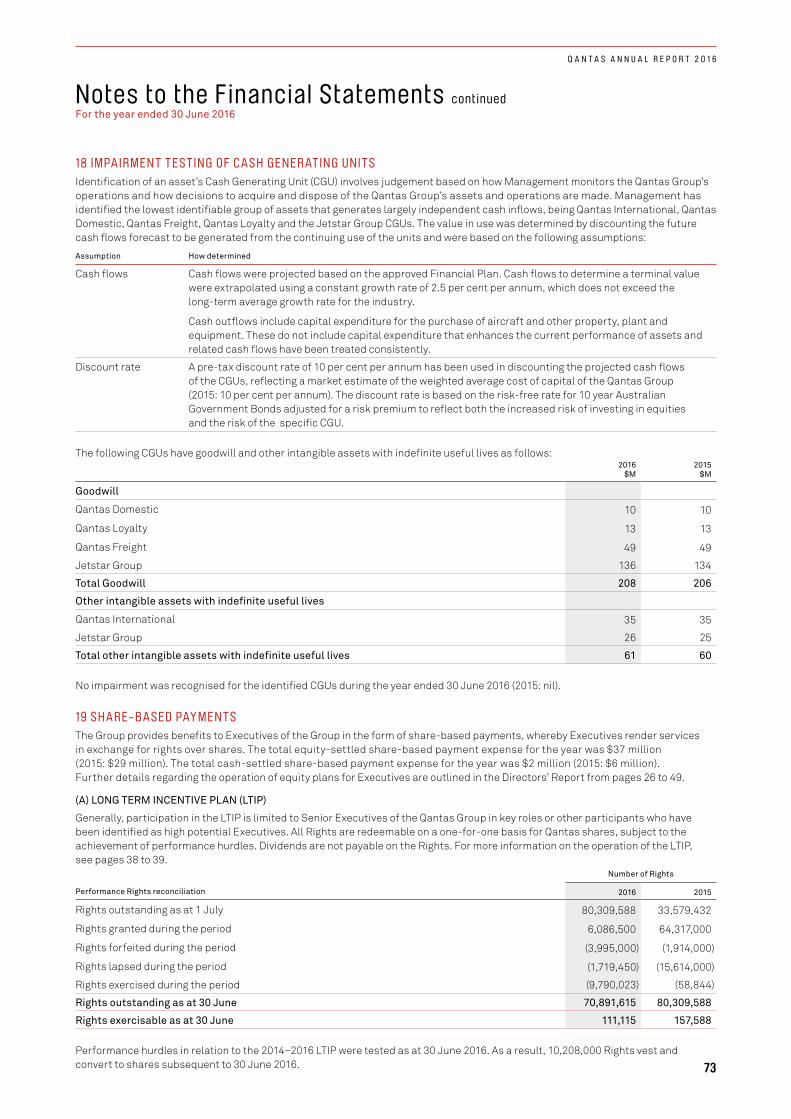
Notes to the Financial Statements continued For the year ended 30 June 2016
18 IMPAIRMENT TESTING OF CASH GENER ATING UNITS Identification of an asset’s Cash Generating Unit (CGU) involves judgement based on how Management monitors the Qantas Group’s operations and how decisions to acquire and dispose of the Qantas Group’s assets and operations are made. Management has identified the lowest identifiable group of assets that generates largely independent cash inflows, being Qantas International, Qantas Domestic, Qantas Freight, Qantas Loyalty and the Jetstar Group CGUs. The value in use was determined by discounting the future cash flows forecast to be generated from the continuing use of the units and were based on the following assumptions:
Assumption How determined
Cash flows Cash flows were projected based on the approved Financial Plan. Cash flows to determine a terminal value were extrapolated using a constant growth rate of 2.5 per cent per annum, which does not exceed the long-term average growth rate for the industry.
Cash outflows include capital expenditure for the purchase of aircraft and other property, plant and equipment. These do not include capital expenditure that enhances the current performance of assets and related cash flows have been treated consistently.
Discount rate A pre-tax discount rate of 10 per cent per annum has been used in discounting the projected cash flows of the CGUs, reflecting a market estimate of the weighted average cost of capital of the Qantas Group (2015: 10 per cent per annum). The discount rate is based on the risk-free rate for 10 year Australian Government Bonds adjusted for a risk premium to reflect both the increased risk of investing in equities and the risk of the specific CGU.
The following CGUs have goodwill and other intangible assets with indefinite useful lives as follows:2016
$M2015
$M
Goodwill
Qantas Domestic 10 10
Qantas Loyalty 13 13
Qantas Freight 49 49
Jetstar Group 136 134
Total Goodwill 208 206
Other intangible assets with indefinite useful lives
Qantas International 35 35
Jetstar Group 26 25
Total other intangible assets with indefinite useful lives 61 60
No impairment was recognised for the identified CGUs during the year ended 30 June 2016 (2015: nil).
19 SHARE-BASED PAYMENTSThe Group provides benefits to Executives of the Group in the form of share-based payments, whereby Executives render services in exchange for rights over shares. The total equity-settled share-based payment expense for the year was $37 million (2015: $29 million). The total cash-settled share-based payment expense for the year was $2 million (2015: $6 million). Further details regarding the operation of equity plans for Executives are outlined in the Directors’ Report from pages 26 to 49.
(A) LONG TERM INCENTIVE PLAN (LTIP)
Generally, participation in the LTIP is limited to Senior Executives of the Qantas Group in key roles or other participants who have been identified as high potential Executives. All Rights are redeemable on a one-for-one basis for Qantas shares, subject to the achievement of performance hurdles. Dividends are not payable on the Rights. For more information on the operation of the LTIP, see pages 38 to 39.
Number of Rights
Performance Rights reconciliation 2016 2015
Rights outstanding as at 1 July 80,309,588 33,579,432
Rights granted during the period 6,086,500 64,317,000
Rights forfeited during the period (3,995,000) (1,914,000)
Rights lapsed during the period (1,719,450) (15,614,000)
Rights exercised during the period (9,790,023) (58,844)
Rights outstanding as at 30 June 70,891,615 80,309,588
Rights exercisable as at 30 June 111,115 157,588
Performance hurdles in relation to the 2014–2016 LTIP were tested as at 30 June 2016. As a result, 10,208,000 Rights vest and convert to shares subsequent to 30 June 2016. 73
Q A N T A S A N N U A L R E P O R T 2 0 1 6

Notes to the Financial Statements continuedFor the year ended 30 June 2016
19 SHARE-BASED PAYMENTS CON T INUED
Fair Value Calculation
The estimated value of Rights granted was determined at grant date using a Monte Carlo model. The weighted average fair value of Rights granted during the year was $2.17 (2015: $1.06).
2016 2015
Inputs into the models 23 October 2015 1 September 2015 3 May 2015 24 October 2014 15 September 2014
Rights granted 1,119,500 4,967,000 2,580,500 4,688,500 57,048,000
Weighted average share value $3.86 $3.47 $3.40 $1.43 $1.48
Expected volatility 37.5% 37.5% 35% 35% 35%
Dividend yield 4.23% 4.23% 3.7% 1.2% 1.2%
Risk-free interest rate 1.84% 1.84% 2.0% 2.5% 2.5%
The expected volatility was determined having regard to the historical volatility of Qantas shares and the implied volatility on exchange traded options. The risk-free rate was the yield on an Australian Government Bond at the grant date matching the remaining useful lives of the plans. The yield is converted into a continuously compounded rate in the model. The expected life assumes immediate exercise after vesting.
(B) SHORT TERM INCENTIVE PLAN (STIP)For details on the operation of the STIP, see pages 37 to 38. There were 735,442 awards of Qantas shares made under the STIP during the year ended 30 June 2016 (2015: nil).
(C) MANAGER INCENTIVE PLAN (MIP) The MIP is the annual incentive plan for the broader management group. Each year, to the extent that the plan’s performance conditions are achieved, this group may receive an award that is a combination of cash and restricted shares. The MIP outcome is based on individual performance (50 per cent) and scorecard performance (50 per cent). The scorecard performance outcomes are the same as those for STIP. For scorecard performance outcomes, refer to the details of the operation of the STIP on pages 37 to 42. There were 1,519,286 awards of Qantas shares made under the MIP during the year ended 30 June 2016 (2015: nil).
20 FINANCIAL RISK MANAGEMENT
(A) RISKSThe Qantas Group is subject to risks which are an inherent part of the operations of an airline. The Qantas Group manages these risk exposures using various financial instruments, governed by a set of policies approved by the Board. The Qantas Group’s policy is not to enter into, issue or hold derivative financial instruments for speculative trading purposes.
The Qantas Group uses different methods to assess and manage different types of risk to which it is exposed. These methods include correlations between risk types, sensitivity analysis in the case of interest rate, foreign exchange and other price risks, and ageing analysis and sensitivity analysis for liquidity and credit risk. A summary of these risks has been presented below:
Risk Nature of Risk Management of Risk
Liquidity risk Difficulty in meeting financial liability obligations
Remaining within optimal capital structure, targeting a minimum liquidity level, ensuring long-term commitments are managed, maintaining access to a variety of additional funding sources and managing maturity profiles.
Interest rate risk Fluctuation in the fair value or future cash flows of a financial instrument because of changes in market interest rates
Floating versus fixed rate debt framework, interest rate swaps, forward rate agreement and options.
Foreign exchange risk Fluctuation in the fair value or future cash flows of a financial instrument because of changes in foreign exchange rates
Forward foreign exchange contracts, currency options and cross currency swaps.
Fuel price risk Exposure of future AUD fuel to unfavourable USD denominated price movements
USD price: Options and swaps on jet kerosene, gasoil and crude oil Foreign exchange risk: Foreign exchange contracts and currency options.
Credit risk Potential loss from a transaction in the event of a default by a counterparty during the term or on settlement of a transaction
Travel agents, industry settlement organisations and credit provided to direct customers: Stringent credit policies and accreditation of travel agents through industry programs.
Other financial asset counterparties: Transact only with counterparties that have acceptable credit ratings and counterparty limits.
74
Q A N T A S A N N U A L R E P O R T 2 0 1 6
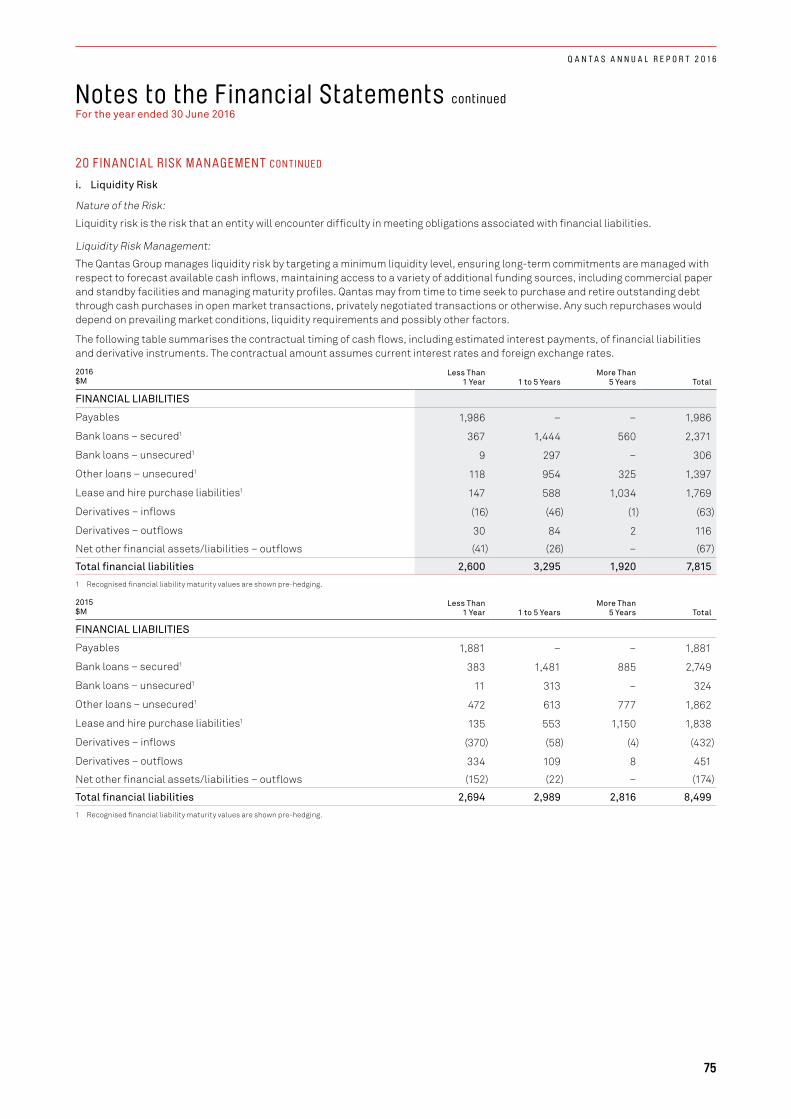
Notes to the Financial Statements continued For the year ended 30 June 2016
20 FINANCIAL RISK MANAGEMENT CON T INUED
i. Liquidity Risk
Nature of the Risk:
Liquidity risk is the risk that an entity will encounter difficulty in meeting obligations associated with financial liabilities.
Liquidity Risk Management:
The Qantas Group manages liquidity risk by targeting a minimum liquidity level, ensuring long-term commitments are managed with respect to forecast available cash inflows, maintaining access to a variety of additional funding sources, including commercial paper and standby facilities and managing maturity profiles. Qantas may from time to time seek to purchase and retire outstanding debt through cash purchases in open market transactions, privately negotiated transactions or otherwise. Any such repurchases would depend on prevailing market conditions, liquidity requirements and possibly other factors.
The following table summarises the contractual timing of cash flows, including estimated interest payments, of financial liabilities and derivative instruments. The contractual amount assumes current interest rates and foreign exchange rates.
2016 $M
Less Than1 Year 1 to 5 Years
More Than5 Years Total
FINANCIAL LIABILITIES
Payables 1,986 – – 1,986
Bank loans – secured1 367 1,444 560 2,371
Bank loans – unsecured1 9 297 – 306
Other loans – unsecured1 118 954 325 1,397
Lease and hire purchase liabilities1 147 588 1,034 1,769
Derivatives – inflows (16) (46) (1) (63)
Derivatives – outflows 30 84 2 116
Net other financial assets/liabilities – outflows (41) (26) – (67)
Total financial liabilities 2,600 3,295 1,920 7,815
1 Recognised financial liability maturity values are shown pre-hedging.
2015 $M
Less Than1 Year 1 to 5 Years
More Than5 Years Total
FINANCIAL LIABILITIES
Payables 1,881 – – 1,881
Bank loans – secured1 383 1,481 885 2,749
Bank loans – unsecured1 11 313 – 324
Other loans – unsecured1 472 613 777 1,862
Lease and hire purchase liabilities1 135 553 1,150 1,838
Derivatives – inflows (370) (58) (4) (432)
Derivatives – outflows 334 109 8 451
Net other financial assets/liabilities – outflows (152) (22) – (174)
Total financial liabilities 2,694 2,989 2,816 8,499
1 Recognised financial liability maturity values are shown pre-hedging.
75
Q A N T A S A N N U A L R E P O R T 2 0 1 6
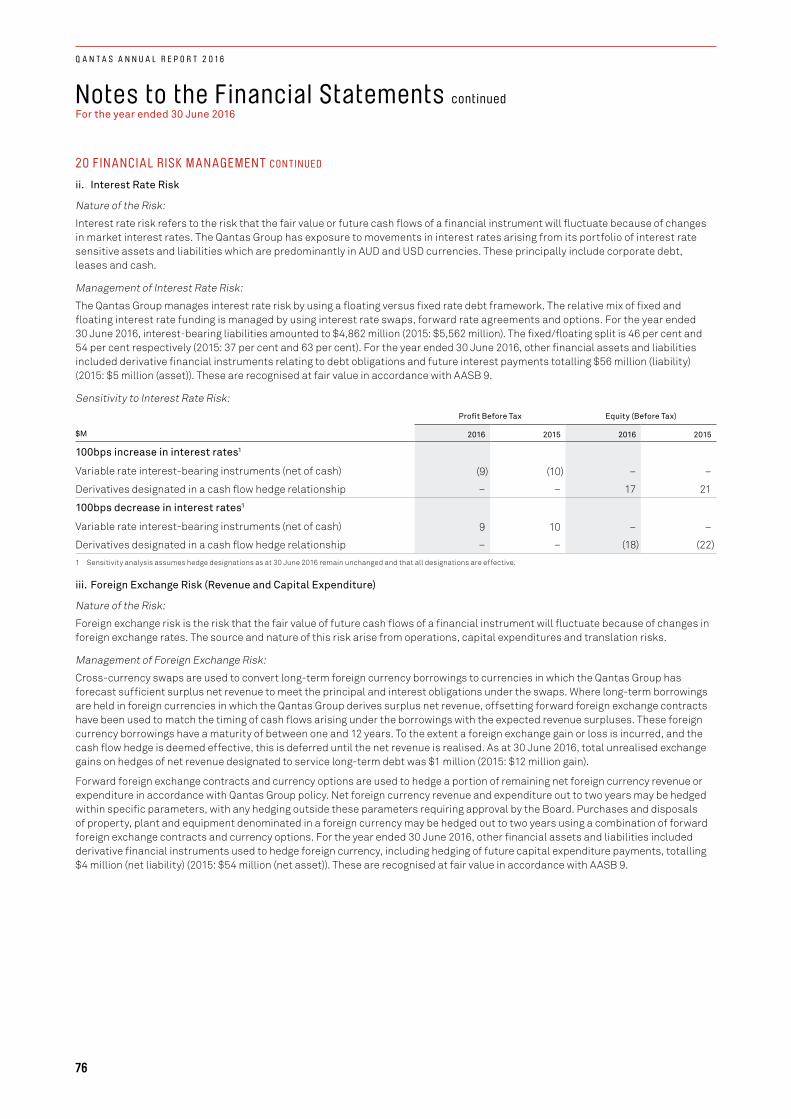
Notes to the Financial Statements continuedFor the year ended 30 June 2016
20 FINANCIAL RISK MANAGEMENT CON T INUED
ii. Interest Rate Risk
Nature of the Risk:
Interest rate risk refers to the risk that the fair value or future cash flows of a financial instrument will fluctuate because of changes in market interest rates. The Qantas Group has exposure to movements in interest rates arising from its portfolio of interest rate sensitive assets and liabilities which are predominantly in AUD and USD currencies. These principally include corporate debt, leases and cash.
Management of Interest Rate Risk:
The Qantas Group manages interest rate risk by using a floating versus fixed rate debt framework. The relative mix of fixed and floating interest rate funding is managed by using interest rate swaps, forward rate agreements and options. For the year ended 30 June 2016, interest-bearing liabilities amounted to $4,862 million (2015: $5,562 million). The fixed/floating split is 46 per cent and 54 per cent respectively (2015: 37 per cent and 63 per cent). For the year ended 30 June 2016, other financial assets and liabilities included derivative financial instruments relating to debt obligations and future interest payments totalling $56 million (liability) (2015: $5 million (asset)). These are recognised at fair value in accordance with AASB 9.
Sensitivity to Interest Rate Risk:
Profit Before Tax Equity (Before Tax)
$M 2016 2015 2016 2015
100bps increase in interest rates1
Variable rate interest-bearing instruments (net of cash) (9) (10) – –
Derivatives designated in a cash flow hedge relationship – – 17 21
100bps decrease in interest rates1
Variable rate interest-bearing instruments (net of cash) 9 10 – –
Derivatives designated in a cash flow hedge relationship – – (18) (22)
1 Sensitivity analysis assumes hedge designations as at 30 June 2016 remain unchanged and that all designations are effective.
iii. Foreign Exchange Risk (Revenue and Capital Expenditure)
Nature of the Risk:
Foreign exchange risk is the risk that the fair value of future cash flows of a financial instrument will fluctuate because of changes in foreign exchange rates. The source and nature of this risk arise from operations, capital expenditures and translation risks.
Management of Foreign Exchange Risk:
Cross-currency swaps are used to convert long-term foreign currency borrowings to currencies in which the Qantas Group has forecast sufficient surplus net revenue to meet the principal and interest obligations under the swaps. Where long-term borrowings are held in foreign currencies in which the Qantas Group derives surplus net revenue, offsetting forward foreign exchange contracts have been used to match the timing of cash flows arising under the borrowings with the expected revenue surpluses. These foreign currency borrowings have a maturity of between one and 12 years. To the extent a foreign exchange gain or loss is incurred, and the cash flow hedge is deemed effective, this is deferred until the net revenue is realised. As at 30 June 2016, total unrealised exchange gains on hedges of net revenue designated to service long-term debt was $1 million (2015: $12 million gain).
Forward foreign exchange contracts and currency options are used to hedge a portion of remaining net foreign currency revenue or expenditure in accordance with Qantas Group policy. Net foreign currency revenue and expenditure out to two years may be hedged within specific parameters, with any hedging outside these parameters requiring approval by the Board. Purchases and disposals of property, plant and equipment denominated in a foreign currency may be hedged out to two years using a combination of forward foreign exchange contracts and currency options. For the year ended 30 June 2016, other financial assets and liabilities included derivative financial instruments used to hedge foreign currency, including hedging of future capital expenditure payments, totalling $4 million (net liability) (2015: $54 million (net asset)). These are recognised at fair value in accordance with AASB 9.
76
Q A N T A S A N N U A L R E P O R T 2 0 1 6
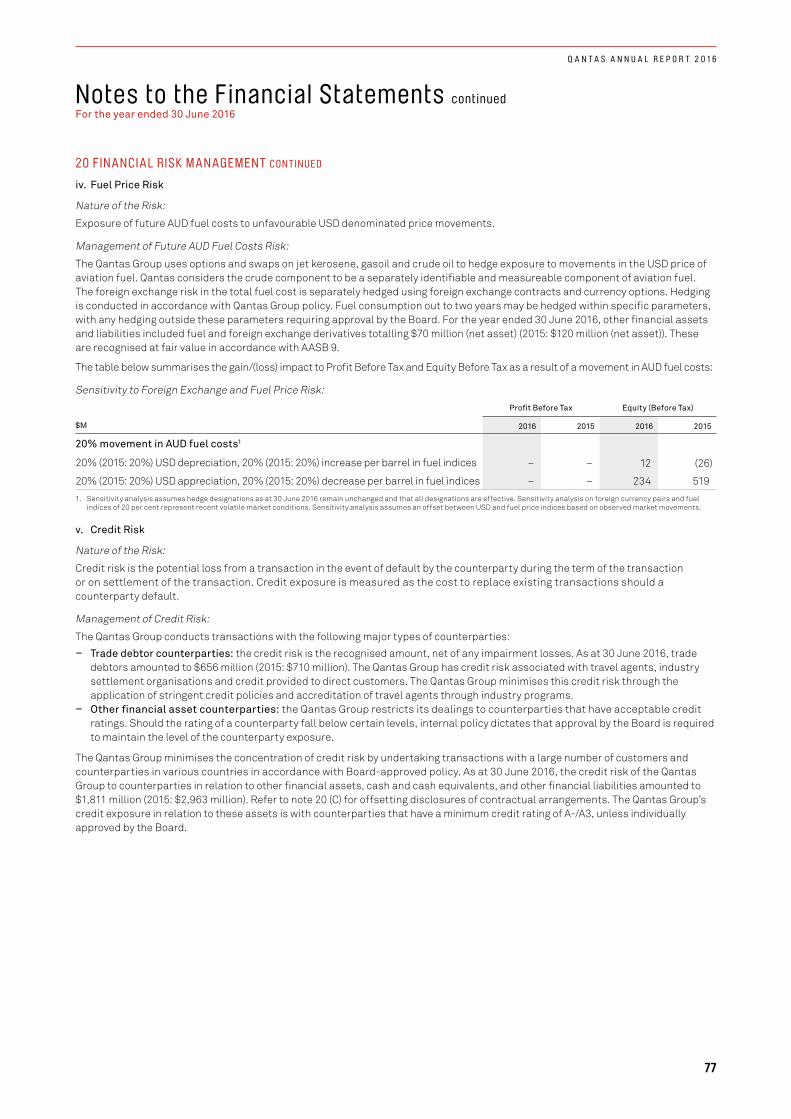
Notes to the Financial Statements continued For the year ended 30 June 2016
20 FINANCIAL RISK MANAGEMENT CON T INUED
iv. Fuel Price Risk
Nature of the Risk:
Exposure of future AUD fuel costs to unfavourable USD denominated price movements.
Management of Future AUD Fuel Costs Risk:
The Qantas Group uses options and swaps on jet kerosene, gasoil and crude oil to hedge exposure to movements in the USD price of aviation fuel. Qantas considers the crude component to be a separately identifiable and measureable component of aviation fuel. The foreign exchange risk in the total fuel cost is separately hedged using foreign exchange contracts and currency options. Hedging is conducted in accordance with Qantas Group policy. Fuel consumption out to two years may be hedged within specific parameters, with any hedging outside these parameters requiring approval by the Board. For the year ended 30 June 2016, other financial assets and liabilities included fuel and foreign exchange derivatives totalling $70 million (net asset) (2015: $120 million (net asset)). These are recognised at fair value in accordance with AASB 9.
The table below summarises the gain/(loss) impact to Profit Before Tax and Equity Before Tax as a result of a movement in AUD fuel costs:
Sensitivity to Foreign Exchange and Fuel Price Risk:
Profit Before Tax Equity (Before Tax)
$M 2016 2015 2016 2015
20% movement in AUD fuel costs1
20% (2015: 20%) USD depreciation, 20% (2015: 20%) increase per barrel in fuel indices – – 12 (26)
20% (2015: 20%) USD appreciation, 20% (2015: 20%) decrease per barrel in fuel indices – – 234 519
1. Sensitivity analysis assumes hedge designations as at 30 June 2016 remain unchanged and that all designations are effective. Sensitivity analysis on foreign currency pairs and fuel indices of 20 per cent represent recent volatile market conditions. Sensitivity analysis assumes an offset between USD and fuel price indices based on observed market movements.
v. Credit Risk
Nature of the Risk:
Credit risk is the potential loss from a transaction in the event of default by the counterparty during the term of the transaction or on settlement of the transaction. Credit exposure is measured as the cost to replace existing transactions should a counterparty default.
Management of Credit Risk:
The Qantas Group conducts transactions with the following major types of counterparties: – Trade debtor counterparties: the credit risk is the recognised amount, net of any impairment losses. As at 30 June 2016, trade
debtors amounted to $656 million (2015: $710 million). The Qantas Group has credit risk associated with travel agents, industry settlement organisations and credit provided to direct customers. The Qantas Group minimises this credit risk through the application of stringent credit policies and accreditation of travel agents through industry programs.
– Other financial asset counterparties: the Qantas Group restricts its dealings to counterparties that have acceptable credit ratings. Should the rating of a counterparty fall below certain levels, internal policy dictates that approval by the Board is required to maintain the level of the counterparty exposure.
The Qantas Group minimises the concentration of credit risk by undertaking transactions with a large number of customers and counterparties in various countries in accordance with Board-approved policy. As at 30 June 2016, the credit risk of the Qantas Group to counterparties in relation to other financial assets, cash and cash equivalents, and other financial liabilities amounted to $1,811 million (2015: $2,963 million). Refer to note 20 (C) for offsetting disclosures of contractual arrangements. The Qantas Group’s credit exposure in relation to these assets is with counterparties that have a minimum credit rating of A-/A3, unless individually approved by the Board.
77
Q A N T A S A N N U A L R E P O R T 2 0 1 6

Notes to the Financial Statements continuedFor the year ended 30 June 2016
20 FINANCIAL RISK MANAGEMENT CON T INUED
(B) FAIR VALUEThe fair value of cash, cash equivalents and non-interest-bearing financial assets and liabilities approximates their carrying value due to their short maturity. The fair value of financial assets and liabilities is determined by valuing them at the present value of future contracted cash flows. Cash flows are discounted using standard valuation techniques at the applicable market yield, having regard to the timing of the cash flows.
The fair value of forward foreign exchange and fuel contracts is determined as the unrealised gain/loss at balance date by reference to market exchange rates and fuel prices. The fair value of interest rate swaps is determined as the present value of future contracted cash flows. Cash flows are discounted using standard valuation techniques at the applicable market yield, having regard to the timing of the cash flows. The fair value of options is determined using standard valuation techniques. Other financial assets and liabilities represent the fair value of derivative financial instruments recognised on the Consolidated Balance Sheet in accordance with AASB 9. Refer to Note 29(E) for a definition of the fair value hierarchy.
2016 2015
Carrying Amount Held at Carrying Amount Held at
$M
Fair Value Through Profit
and Loss Amortised Cost Fair Value
Fair Value Through Profit
and Loss Amortised Cost Fair Value
Financial assets
Cash and cash equivalents – 1,980 1,986 – 2,908 2,917
Receivables – 929 929 – 1,093 1,093
Other financial assets1 275 – 275 662 – 662
Financial liabilities
Payables – 1,986 1,986 – 1,881 1,881
Interest-bearing liabilities – 4,862 4,952 – 5,562 5,575
Other financial liabilities1 264 – 264 484 – 484
1 Other financial assets and liabilities represent the fair value of derivative financial instruments recognised on the Consolidated Balance Sheet in accordance with AASB 9. These derivative financial instruments have been measured at fair value using Level 2 inputs in estimating their fair values.
The following section summarises derivative financial instruments in the Consolidated Financial Statements:
Type of Hedge Description Derivative
Cash flow hedges A derivative or financial instrument to hedge the exposure to variability in cash flows attributable to a particular risk associated with an asset, liability or forecast transaction.
Exchange derivative contracts to hedge future AUD fuel costs and foreign currency operational payments (forwards, swaps or options).
Interest rate derivative contracts to hedge future interest payments (forwards, swaps or options).
Foreign exchange derivative contracts to hedge future capital expenditure payments (forwards or options).
Fair value hedges A derivative or financial instrument designated as hedging the change in fair value of a recognised asset or liability.
Contracts to hedge the fair value movement of designated assets.
78
Q A N T A S A N N U A L R E P O R T 2 0 1 6
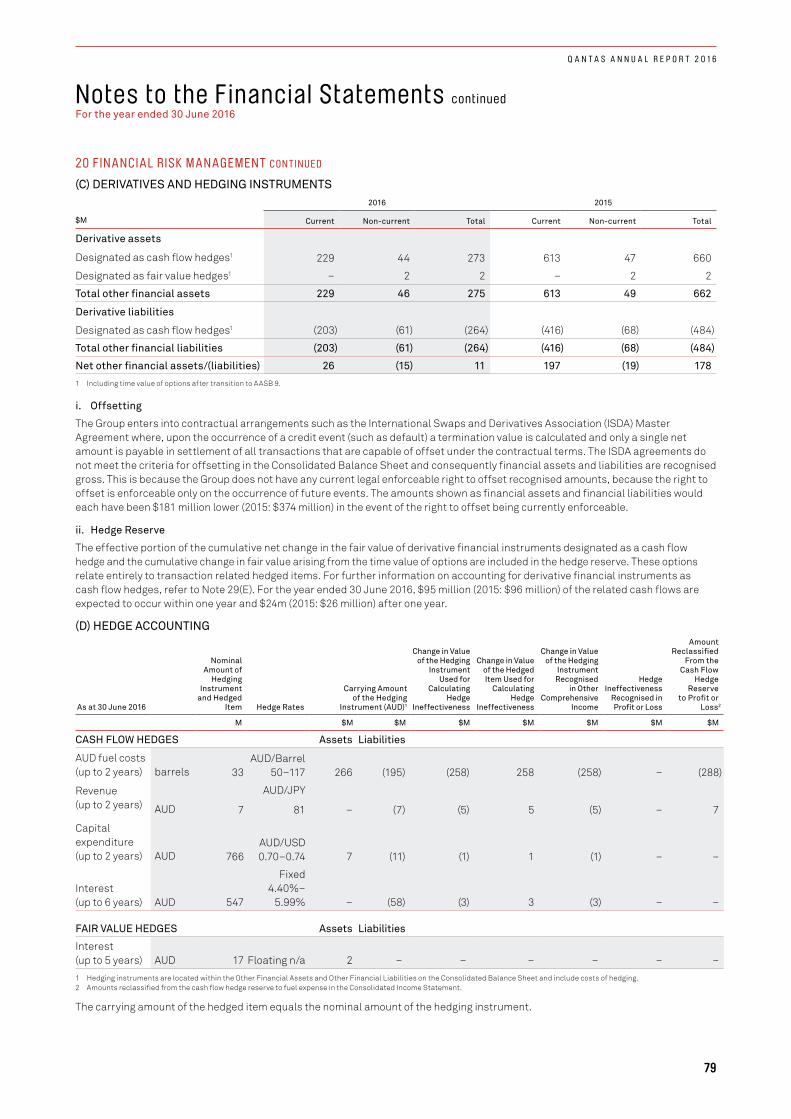
Notes to the Financial Statements continued For the year ended 30 June 2016
20 FINANCIAL RISK MANAGEMENT CON T INUED
(C) DERIVATIVES AND HEDGING INSTRUMENTS2016 2015
$M Current Non-current Total Current Non-current Total
Derivative assets
Designated as cash flow hedges1 229 44 273 613 47 660
Designated as fair value hedges1 – 2 2 – 2 2
Total other financial assets 229 46 275 613 49 662
Derivative liabilities
Designated as cash flow hedges1 (203) (61) (264) (416) (68) (484)
Total other financial liabilities (203) (61) (264) (416) (68) (484)
Net other financial assets/(liabilities) 26 (15) 11 197 (19) 178
1 Including time value of options after transition to AASB 9.
i. Offsetting
The Group enters into contractual arrangements such as the International Swaps and Derivatives Association (ISDA) Master Agreement where, upon the occurrence of a credit event (such as default) a termination value is calculated and only a single net amount is payable in settlement of all transactions that are capable of offset under the contractual terms. The ISDA agreements do not meet the criteria for offsetting in the Consolidated Balance Sheet and consequently financial assets and liabilities are recognised gross. This is because the Group does not have any current legal enforceable right to offset recognised amounts, because the right to offset is enforceable only on the occurrence of future events. The amounts shown as financial assets and financial liabilities would each have been $181 million lower (2015: $374 million) in the event of the right to offset being currently enforceable.
ii. Hedge Reserve
The effective portion of the cumulative net change in the fair value of derivative financial instruments designated as a cash flow hedge and the cumulative change in fair value arising from the time value of options are included in the hedge reserve. These options relate entirely to transaction related hedged items. For further information on accounting for derivative financial instruments as cash flow hedges, refer to Note 29(E). For the year ended 30 June 2016, $95 million (2015: $96 million) of the related cash flows are expected to occur within one year and $24m (2015: $26 million) after one year.
(D) HEDGE ACCOUNTING
As at 30 June 2016
Nominal Amount of
Hedging Instrument
and Hedged Item Hedge Rates
Carrying Amount of the Hedging
Instrument (AUD)1
Change in Value of the Hedging
Instrument Used for
Calculating Hedge
Ineffectiveness
Change in Value of the Hedged Item Used for
Calculating Hedge
Ineffectiveness
Change in Value of the Hedging
Instrument Recognised
in Other Comprehensive
Income
Hedge Ineffectiveness
Recognised in Profit or Loss
Amount Reclassified From the Cash Flow Hedge Reserve to Profit or Loss2
M $M $M $M $M $M $M $M
CASH FLOW HEDGES Assets Liabilities
AUD fuel costs (up to 2 years) barrels 33
AUD/Barrel50–117 266 (195) (258) 258 (258) – (288)
Revenue (up to 2 years) AUD 7
AUD/JPY
81 – (7) (5) 5 (5) – 7
Capital expenditure (up to 2 years) AUD 766
AUD/USD0.70–0.74 7 (11) (1) 1 (1) – –
Interest (up to 6 years) AUD 547
Fixed 4.40%–
5.99% – (58) (3) 3 (3) – –
FAIR VALUE HEDGES Assets Liabilities
Interest (up to 5 years) AUD 17 Floating n/a 2 – – – – – –
1 Hedging instruments are located within the Other Financial Assets and Other Financial Liabilities on the Consolidated Balance Sheet and include costs of hedging.2 Amounts reclassified from the cash flow hedge reserve to fuel expense in the Consolidated Income Statement.
The carrying amount of the hedged item equals the nominal amount of the hedging instrument.
79
Q A N T A S A N N U A L R E P O R T 2 0 1 6
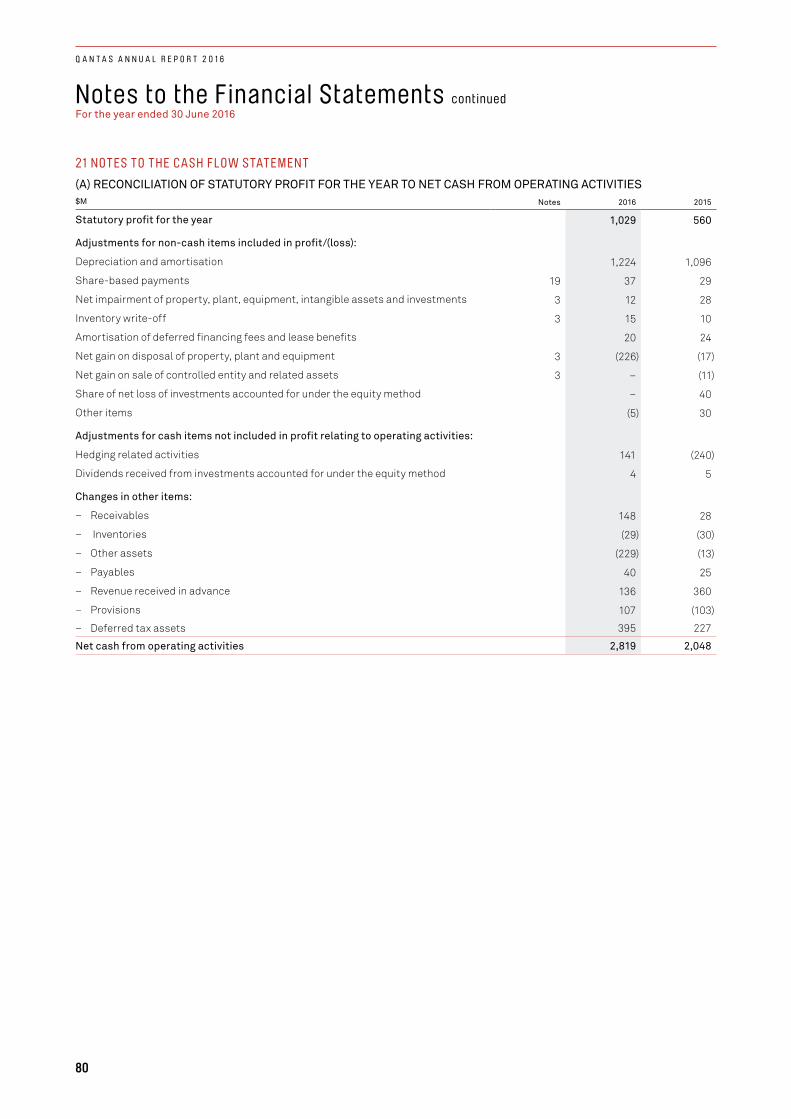
Notes to the Financial Statements continuedFor the year ended 30 June 2016
21 NOTES TO THE CASH FLOW STATEMENT
(A) RECONCILIATION OF STATUTORY PROFIT FOR THE YEAR TO NET CASH FROM OPERATING ACTIVITIES$M Notes 2016 2015
Statutory profit for the year 1,029 560
Adjustments for non-cash items included in profit/(loss):
Depreciation and amortisation 1,224 1,096
Share-based payments 19 37 29
Net impairment of property, plant, equipment, intangible assets and investments 3 12 28
Inventory write-off 3 15 10
Amortisation of deferred financing fees and lease benefits 20 24
Net gain on disposal of property, plant and equipment 3 (226) (17)
Net gain on sale of controlled entity and related assets 3 – (11)
Share of net loss of investments accounted for under the equity method – 40
Other items (5) 30
Adjustments for cash items not included in profit relating to operating activities:
Hedging related activities 141 (240)
Dividends received from investments accounted for under the equity method 4 5
Changes in other items:
− Receivables 148 28
− Inventories (29) (30)
− Other assets (229) (13)
− Payables 40 25
− Revenue received in advance 136 360
− Provisions 107 (103)
− Deferred tax assets 395 227
Net cash from operating activities 2,819 2,048
80
Q A N T A S A N N U A L R E P O R T 2 0 1 6
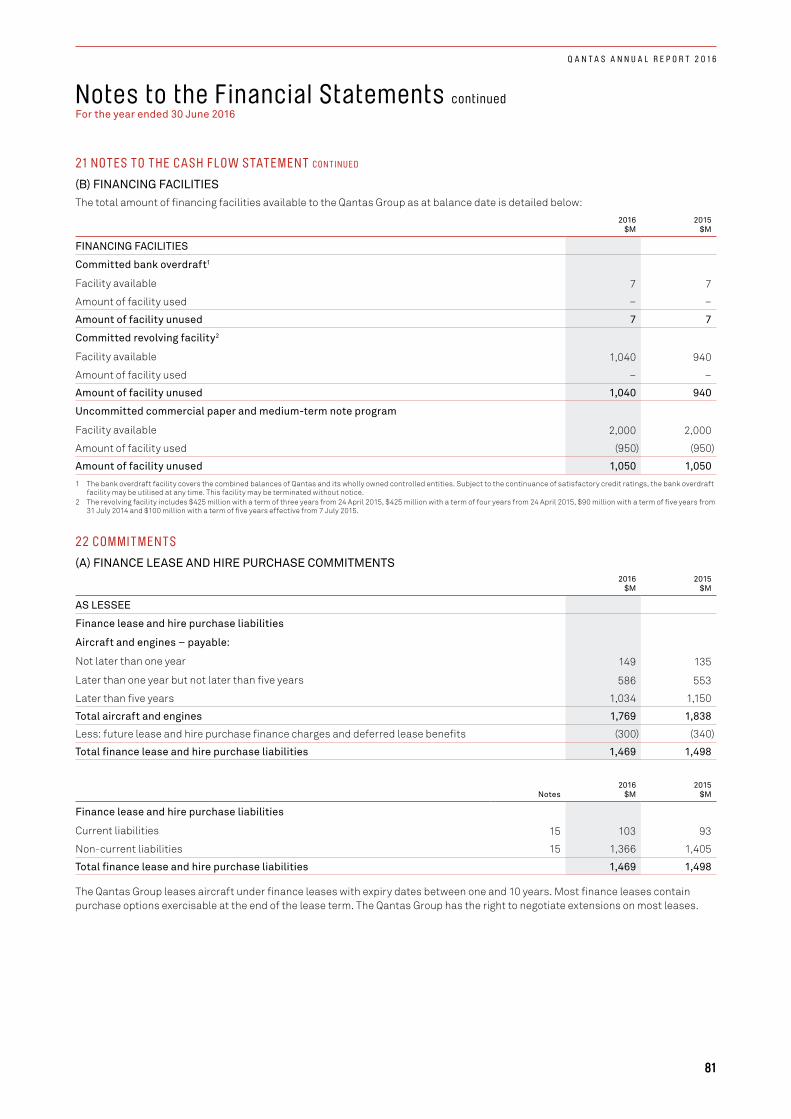
Notes to the Financial Statements continued For the year ended 30 June 2016
21 NOTES TO THE CASH FLOW STATEMENT C ON T INUE D
(B) FINANCING FACILITIESThe total amount of financing facilities available to the Qantas Group as at balance date is detailed below:
2016 $M
2015 $M
FINANCING FACILITIES
Committed bank overdraft1
Facility available 7 7
Amount of facility used – –
Amount of facility unused 7 7
Committed revolving facility2
Facility available 1,040 940
Amount of facility used – –
Amount of facility unused 1,040 940
Uncommitted commercial paper and medium-term note program
Facility available 2,000 2,000
Amount of facility used (950) (950)
Amount of facility unused 1,050 1,050
1 The bank overdraft facility covers the combined balances of Qantas and its wholly owned controlled entities. Subject to the continuance of satisfactory credit ratings, the bank overdraft facility may be utilised at any time. This facility may be terminated without notice.
2 The revolving facility includes $425 million with a term of three years from 24 April 2015, $425 million with a term of four years from 24 April 2015, $90 million with a term of five years from 31 July 2014 and $100 million with a term of five years effective from 7 July 2015.
22 COMMITMENTS
(A) FINANCE LEASE AND HIRE PURCHASE COMMITMENTS2016
$M2015
$M
AS LESSEE
Finance lease and hire purchase liabilities
Aircraft and engines – payable:
Not later than one year 149 135
Later than one year but not later than five years 586 553
Later than five years 1,034 1,150
Total aircraft and engines 1,769 1,838
Less: future lease and hire purchase finance charges and deferred lease benefits (300) (340)
Total finance lease and hire purchase liabilities 1,469 1,498
Notes2016
$M2015
$M
Finance lease and hire purchase liabilities
Current liabilities 15 103 93
Non-current liabilities 15 1,366 1,405
Total finance lease and hire purchase liabilities 1,469 1,498
The Qantas Group leases aircraft under finance leases with expiry dates between one and 10 years. Most finance leases contain purchase options exercisable at the end of the lease term. The Qantas Group has the right to negotiate extensions on most leases.
81
Q A N T A S A N N U A L R E P O R T 2 0 1 6
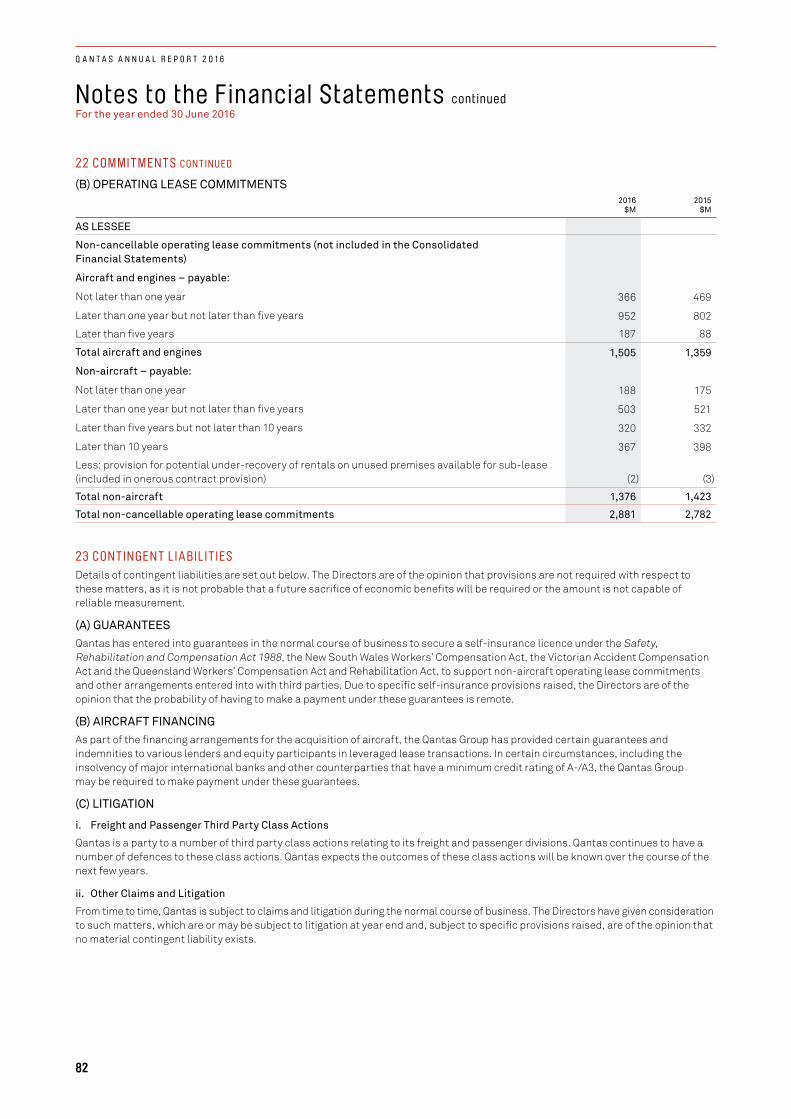
Notes to the Financial Statements continuedFor the year ended 30 June 2016
22 COMMITMENTS CON T INUED
(B) OPERATING LEASE COMMITMENTS2016
$M2015
$M
AS LESSEE
Non-cancellable operating lease commitments (not included in the Consolidated Financial Statements)
Aircraft and engines – payable:
Not later than one year 366 469
Later than one year but not later than five years 952 802
Later than five years 187 88
Total aircraft and engines 1,505 1,359
Non-aircraft – payable:
Not later than one year 188 175
Later than one year but not later than five years 503 521
Later than five years but not later than 10 years 320 332
Later than 10 years 367 398
Less: provision for potential under-recovery of rentals on unused premises available for sub-lease (included in onerous contract provision) (2) (3)
Total non-aircraft 1,376 1,423
Total non-cancellable operating lease commitments 2,881 2,782
23 CONTINGENT LIABILITIESDetails of contingent liabilities are set out below. The Directors are of the opinion that provisions are not required with respect to these matters, as it is not probable that a future sacrifice of economic benefits will be required or the amount is not capable of reliable measurement.
(A) GUARANTEESQantas has entered into guarantees in the normal course of business to secure a self-insurance licence under the Safety, Rehabilitation and Compensation Act 1988, the New South Wales Workers’ Compensation Act, the Victorian Accident Compensation Act and the Queensland Workers’ Compensation Act and Rehabilitation Act, to support non-aircraft operating lease commitments and other arrangements entered into with third parties. Due to specific self-insurance provisions raised, the Directors are of the opinion that the probability of having to make a payment under these guarantees is remote.
(B) AIRCRAFT FINANCINGAs part of the financing arrangements for the acquisition of aircraft, the Qantas Group has provided certain guarantees and indemnities to various lenders and equity participants in leveraged lease transactions. In certain circumstances, including the insolvency of major international banks and other counterparties that have a minimum credit rating of A-/A3, the Qantas Group may be required to make payment under these guarantees.
(C) LITIGATION
i. Freight and Passenger Third Party Class Actions
Qantas is a party to a number of third party class actions relating to its freight and passenger divisions. Qantas continues to have a number of defences to these class actions. Qantas expects the outcomes of these class actions will be known over the course of the next few years.
ii. Other Claims and Litigation
From time to time, Qantas is subject to claims and litigation during the normal course of business. The Directors have given consideration to such matters, which are or may be subject to litigation at year end and, subject to specific provisions raised, are of the opinion that no material contingent liability exists.
82
Q A N T A S A N N U A L R E P O R T 2 0 1 6
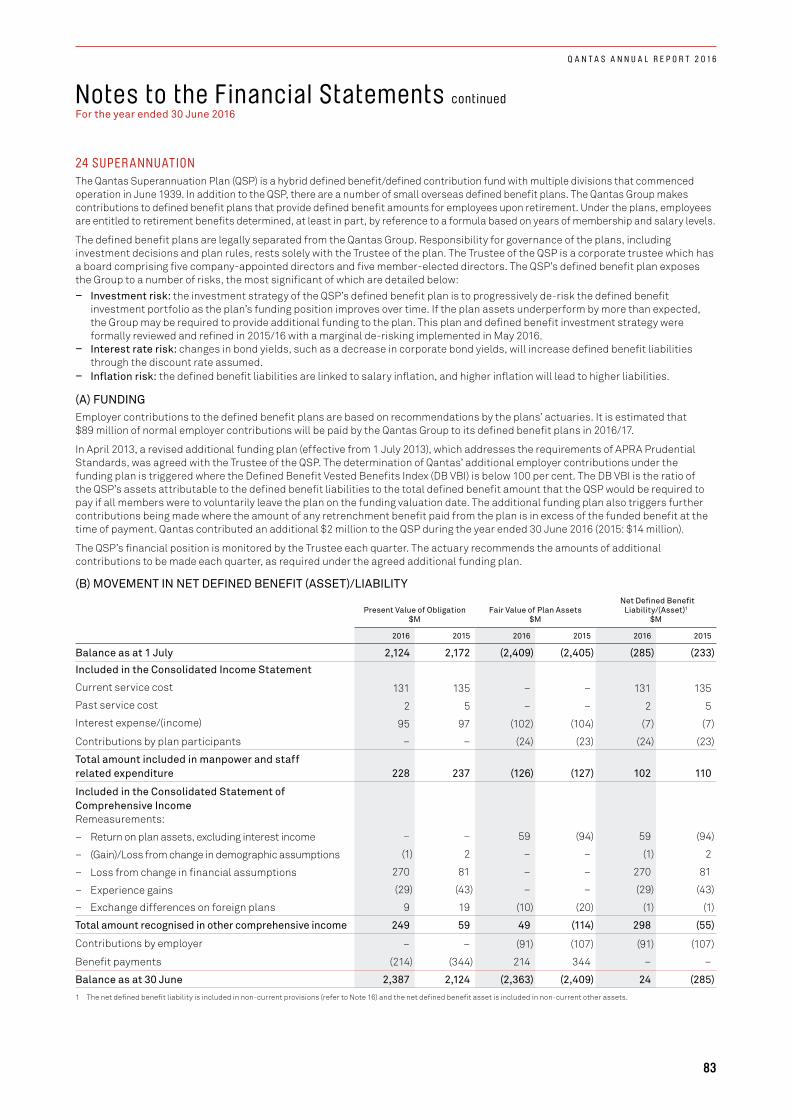
Notes to the Financial Statements continued For the year ended 30 June 2016
24 SUPER ANNUATIONThe Qantas Superannuation Plan (QSP) is a hybrid defined benefit/defined contribution fund with multiple divisions that commenced operation in June 1939. In addition to the QSP, there are a number of small overseas defined benefit plans. The Qantas Group makes contributions to defined benefit plans that provide defined benefit amounts for employees upon retirement. Under the plans, employees are entitled to retirement benefits determined, at least in part, by reference to a formula based on years of membership and salary levels.
The defined benefit plans are legally separated from the Qantas Group. Responsibility for governance of the plans, including investment decisions and plan rules, rests solely with the Trustee of the plan. The Trustee of the QSP is a corporate trustee which has a board comprising five company-appointed directors and five member-elected directors. The QSP’s defined benefit plan exposes the Group to a number of risks, the most significant of which are detailed below:
– Investment risk: the investment strategy of the QSP’s defined benefit plan is to progressively de-risk the defined benefit investment portfolio as the plan’s funding position improves over time. If the plan assets underperform by more than expected, the Group may be required to provide additional funding to the plan. This plan and defined benefit investment strategy were formally reviewed and refined in 2015/16 with a marginal de-risking implemented in May 2016.
– Interest rate risk: changes in bond yields, such as a decrease in corporate bond yields, will increase defined benefit liabilities through the discount rate assumed.
– Inflation risk: the defined benefit liabilities are linked to salary inflation, and higher inflation will lead to higher liabilities.
(A) FUNDINGEmployer contributions to the defined benefit plans are based on recommendations by the plans’ actuaries. It is estimated that $89 million of normal employer contributions will be paid by the Qantas Group to its defined benefit plans in 2016/17.
In April 2013, a revised additional funding plan (effective from 1 July 2013), which addresses the requirements of APRA Prudential Standards, was agreed with the Trustee of the QSP. The determination of Qantas’ additional employer contributions under the funding plan is triggered where the Defined Benefit Vested Benefits Index (DB VBI) is below 100 per cent. The DB VBI is the ratio of the QSP’s assets attributable to the defined benefit liabilities to the total defined benefit amount that the QSP would be required to pay if all members were to voluntarily leave the plan on the funding valuation date. The additional funding plan also triggers further contributions being made where the amount of any retrenchment benefit paid from the plan is in excess of the funded benefit at the time of payment. Qantas contributed an additional $2 million to the QSP during the year ended 30 June 2016 (2015: $14 million).
The QSP’s financial position is monitored by the Trustee each quarter. The actuary recommends the amounts of additional contributions to be made each quarter, as required under the agreed additional funding plan.
(B) MOVEMENT IN NET DEFINED BENEFIT (ASSET)/LIABILITY
Present Value of Obligation $M
Fair Value of Plan Assets $M
Net Defined Benefit Liability/(Asset)1
$M
2016 2015 2016 2015 2016 2015
Balance as at 1 July 2,124 2,172 (2,409) (2,405) (285) (233)
Included in the Consolidated Income Statement
Current service cost 131 135 – – 131 135
Past service cost 2 5 – – 2 5
Interest expense/(income) 95 97 (102) (104) (7) (7)
Contributions by plan participants – – (24) (23) (24) (23)
Total amount included in manpower and staff related expenditure 228 237 (126) (127) 102 110
Included in the Consolidated Statement of Comprehensive IncomeRemeasurements:
− Return on plan assets, excluding interest income – – 59 (94) 59 (94)
− (Gain)/Loss from change in demographic assumptions (1) 2 – – (1) 2
− Loss from change in financial assumptions 270 81 – – 270 81
− Experience gains (29) (43) – – (29) (43)
− Exchange differences on foreign plans 9 19 (10) (20) (1) (1)
Total amount recognised in other comprehensive income 249 59 49 (114) 298 (55)
Contributions by employer – – (91) (107) (91) (107)
Benefit payments (214) (344) 214 344 – –
Balance as at 30 June 2,387 2,124 (2,363) (2,409) 24 (285)
1 The net defined benefit liability is included in non-current provisions (refer to Note 16) and the net defined benefit asset is included in non-current other assets.
83
Q A N T A S A N N U A L R E P O R T 2 0 1 6
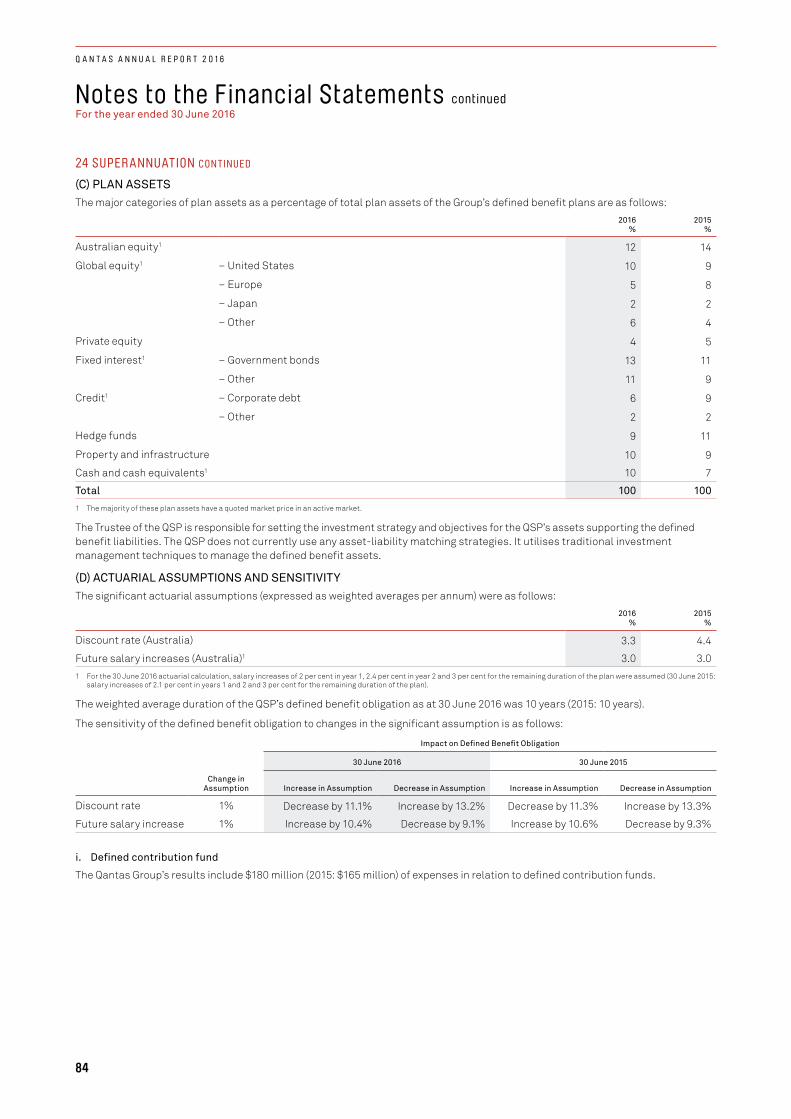
Notes to the Financial Statements continuedFor the year ended 30 June 2016
24 SUPER ANNUATION CON T INUED
(C) PLAN ASSETSThe major categories of plan assets as a percentage of total plan assets of the Group’s defined benefit plans are as follows:
2016 %
2015 %
Australian equity1 12 14
Global equity1 − United States 10 9
− Europe 5 8
− Japan 2 2
− Other 6 4
Private equity 4 5
Fixed interest1 − Government bonds 13 11
− Other 11 9
Credit1 − Corporate debt 6 9
− Other 2 2
Hedge funds 9 11
Property and infrastructure 10 9
Cash and cash equivalents1 10 7
Total 100 100
1 The majority of these plan assets have a quoted market price in an active market.
The Trustee of the QSP is responsible for setting the investment strategy and objectives for the QSP’s assets supporting the defined benefit liabilities. The QSP does not currently use any asset-liability matching strategies. It utilises traditional investment management techniques to manage the defined benefit assets.
(D) ACTUARIAL ASSUMPTIONS AND SENSITIVITYThe significant actuarial assumptions (expressed as weighted averages per annum) were as follows:
2016 %
2015 %
Discount rate (Australia) 3.3 4.4
Future salary increases (Australia)1 3.0 3.0
1 For the 30 June 2016 actuarial calculation, salary increases of 2 per cent in year 1, 2.4 per cent in year 2 and 3 per cent for the remaining duration of the plan were assumed (30 June 2015: salary increases of 2.1 per cent in years 1 and 2 and 3 per cent for the remaining duration of the plan).
The weighted average duration of the QSP’s defined benefit obligation as at 30 June 2016 was 10 years (2015: 10 years).
The sensitivity of the defined benefit obligation to changes in the significant assumption is as follows:
Impact on Defined Benefit Obligation
30 June 2016 30 June 2015
Change in Assumption Increase in Assumption Decrease in Assumption Increase in Assumption Decrease in Assumption
Discount rate 1% Decrease by 11.1% Increase by 13.2% Decrease by 11.3% Increase by 13.3%
Future salary increase 1% Increase by 10.4% Decrease by 9.1% Increase by 10.6% Decrease by 9.3%
i. Defined contribution fund
The Qantas Group’s results include $180 million (2015: $165 million) of expenses in relation to defined contribution funds.
84
Q A N T A S A N N U A L R E P O R T 2 0 1 6
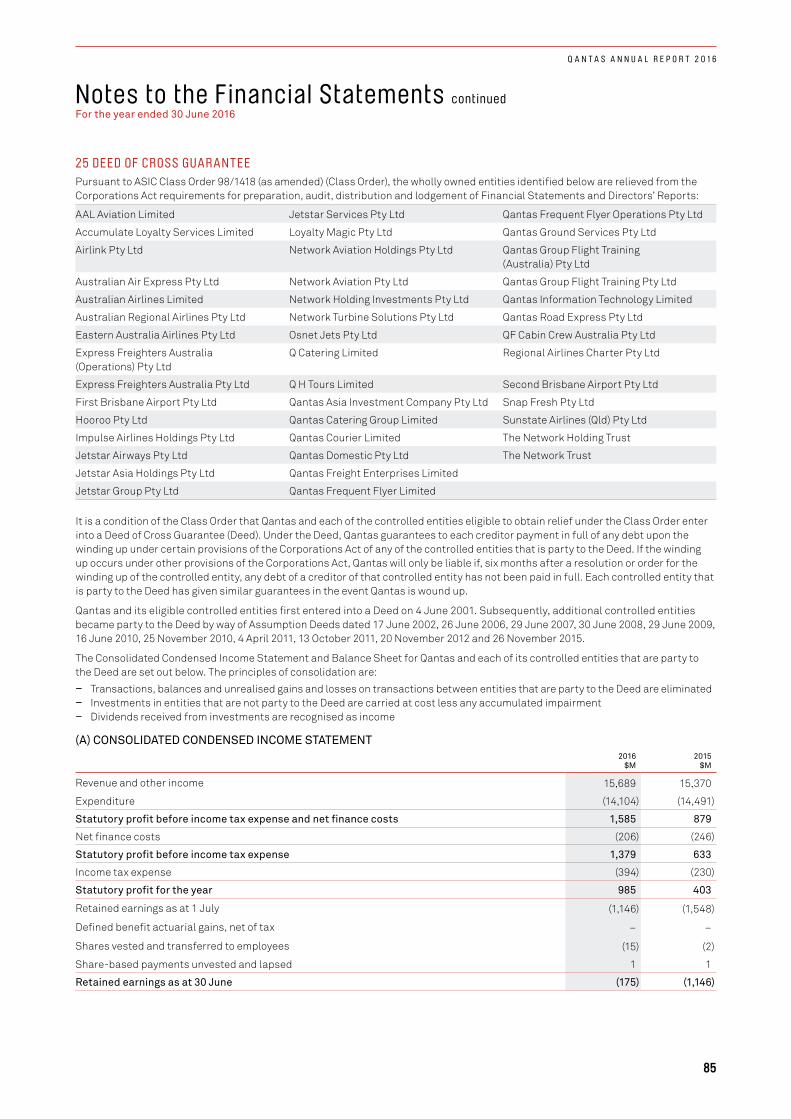
Notes to the Financial Statements continued For the year ended 30 June 2016
25 DEED OF CROS S GUAR ANTEEPursuant to ASIC Class Order 98/1418 (as amended) (Class Order), the wholly owned entities identified below are relieved from the Corporations Act requirements for preparation, audit, distribution and lodgement of Financial Statements and Directors’ Reports:
AAL Aviation Limited Jetstar Services Pty Ltd Qantas Frequent Flyer Operations Pty Ltd
Accumulate Loyalty Services Limited Loyalty Magic Pty Ltd Qantas Ground Services Pty Ltd
Airlink Pty Ltd Network Aviation Holdings Pty Ltd Qantas Group Flight Training (Australia) Pty Ltd
Australian Air Express Pty Ltd Network Aviation Pty Ltd Qantas Group Flight Training Pty Ltd
Australian Airlines Limited Network Holding Investments Pty Ltd Qantas Information Technology Limited
Australian Regional Airlines Pty Ltd Network Turbine Solutions Pty Ltd Qantas Road Express Pty Ltd
Eastern Australia Airlines Pty Ltd Osnet Jets Pty Ltd QF Cabin Crew Australia Pty Ltd
Express Freighters Australia (Operations) Pty Ltd
Q Catering Limited Regional Airlines Charter Pty Ltd
Express Freighters Australia Pty Ltd Q H Tours Limited Second Brisbane Airport Pty Ltd
First Brisbane Airport Pty Ltd Qantas Asia Investment Company Pty Ltd Snap Fresh Pty Ltd
Hooroo Pty Ltd Qantas Catering Group Limited Sunstate Airlines (Qld) Pty Ltd
Impulse Airlines Holdings Pty Ltd Qantas Courier Limited The Network Holding Trust
Jetstar Airways Pty Ltd Qantas Domestic Pty Ltd The Network Trust
Jetstar Asia Holdings Pty Ltd Qantas Freight Enterprises Limited
Jetstar Group Pty Ltd Qantas Frequent Flyer Limited
It is a condition of the Class Order that Qantas and each of the controlled entities eligible to obtain relief under the Class Order enter into a Deed of Cross Guarantee (Deed). Under the Deed, Qantas guarantees to each creditor payment in full of any debt upon the winding up under certain provisions of the Corporations Act of any of the controlled entities that is party to the Deed. If the winding up occurs under other provisions of the Corporations Act, Qantas will only be liable if, six months after a resolution or order for the winding up of the controlled entity, any debt of a creditor of that controlled entity has not been paid in full. Each controlled entity that is party to the Deed has given similar guarantees in the event Qantas is wound up.
Qantas and its eligible controlled entities first entered into a Deed on 4 June 2001. Subsequently, additional controlled entities became party to the Deed by way of Assumption Deeds dated 17 June 2002, 26 June 2006, 29 June 2007, 30 June 2008, 29 June 2009, 16 June 2010, 25 November 2010, 4 April 2011, 13 October 2011, 20 November 2012 and 26 November 2015.
The Consolidated Condensed Income Statement and Balance Sheet for Qantas and each of its controlled entities that are party to the Deed are set out below. The principles of consolidation are:
– Transactions, balances and unrealised gains and losses on transactions between entities that are party to the Deed are eliminated – Investments in entities that are not party to the Deed are carried at cost less any accumulated impairment – Dividends received from investments are recognised as income
(A) CONSOLIDATED CONDENSED INCOME STATEMENT2016
$M2015
$M
Revenue and other income 15,689 15,370
Expenditure (14,104) (14,491)
Statutory profit before income tax expense and net finance costs 1,585 879
Net finance costs (206) (246)
Statutory profit before income tax expense 1,379 633
Income tax expense (394) (230)
Statutory profit for the year 985 403
Retained earnings as at 1 July (1,146) (1,548)
Defined benefit actuarial gains, net of tax – –
Shares vested and transferred to employees (15) (2)
Share-based payments unvested and lapsed 1 1
Retained earnings as at 30 June (175) (1,146)
85
Q A N T A S A N N U A L R E P O R T 2 0 1 6

Notes to the Financial Statements continuedFor the year ended 30 June 2016
25 DEED OF CROS S GUAR ANTEE CON T INUED
(B) CONSOLIDATED CONDENSED BALANCE SHEET2016
$M2015
$M
CURRENT ASSETS
Cash and cash equivalents 1,833 2,759
Receivables 993 1,234
Other financial assets 229 613
Inventories 336 322
Assets classified as held for sale 17 136
Other 92 102
Total current assets 3,500 5,166
NON-CURRENT ASSETS
Receivables 1,195 1,406
Other financial assets 46 49
Investments 261 268
Property, plant and equipment 11,622 10,682
Intangible assets 817 702
Deferred tax asset 38 330
Other 229 292
Total non-current assets 14,208 13,729
Total assets 17,708 18,895
CURRENT LIABILITIES
Payables 2,039 2,000
Revenue received in advance 3,450 3,505
Interest-bearing liabilities 565 924
Other financial liabilities 203 414
Provisions 848 799
Total current liabilities 7,105 7,642
NON-CURRENT LIABILITIES
Revenue received in advance 1,521 1,359
Interest-bearing liabilities 5,478 6,056
Other financial liabilities 61 68
Provisions 362 329
Total non-current liabilities 7,422 7,812
Total liabilities 14,527 15,454
Net assets 3,181 3,441
EQUITY
Issued capital 3,625 4,630
Treasury shares (50) (7)
Reserves (219) (36)
Retained earnings (175) (1,146)
Equity attributable to members of Qantas 3,181 3,441
Non-controlling interests – –
Total equity 3,181 3,441
86
Q A N T A S A N N U A L R E P O R T 2 0 1 6
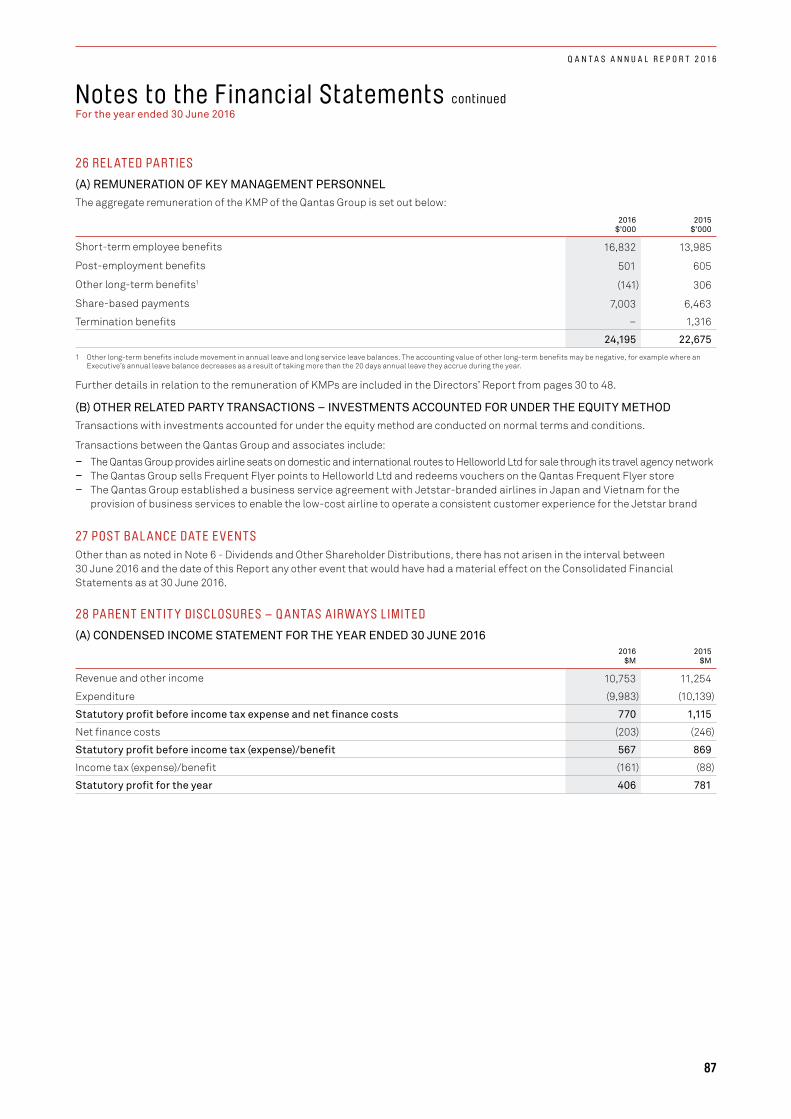
Notes to the Financial Statements continued For the year ended 30 June 2016
26 REL ATED PARTIES
(A) REMUNERATION OF KEY MANAGEMENT PERSONNELThe aggregate remuneration of the KMP of the Qantas Group is set out below:
2016 $’000
2015 $’000
Short-term employee benefits 16,832 13,985
Post-employment benefits 501 605
Other long-term benefits1 (141) 306
Share-based payments 7,003 6,463
Termination benefits – 1,316
24,195 22,675
1 Other long-term benefits include movement in annual leave and long service leave balances. The accounting value of other long-term benefits may be negative, for example where an Executive’s annual leave balance decreases as a result of taking more than the 20 days annual leave they accrue during the year.
Further details in relation to the remuneration of KMPs are included in the Directors’ Report from pages 30 to 48.
(B) OTHER RELATED PARTY TRANSACTIONS – INVESTMENTS ACCOUNTED FOR UNDER THE EQUITY METHODTransactions with investments accounted for under the equity method are conducted on normal terms and conditions.
Transactions between the Qantas Group and associates include: – The Qantas Group provides airline seats on domestic and international routes to Helloworld Ltd for sale through its travel agency network – The Qantas Group sells Frequent Flyer points to Helloworld Ltd and redeems vouchers on the Qantas Frequent Flyer store – The Qantas Group established a business service agreement with Jetstar-branded airlines in Japan and Vietnam for the
provision of business services to enable the low-cost airline to operate a consistent customer experience for the Jetstar brand
27 POST BAL ANCE DATE E VENTS Other than as noted in Note 6 - Dividends and Other Shareholder Distributions, there has not arisen in the interval between 30 June 2016 and the date of this Report any other event that would have had a material effect on the Consolidated Financial Statements as at 30 June 2016.
28 PARENT ENTIT Y DISCLOSURES – Q ANTAS AIRWAYS LIMITED
(A) CONDENSED INCOME STATEMENT FOR THE YEAR ENDED 30 JUNE 20162016
$M2015
$M
Revenue and other income 10,753 11,254
Expenditure (9,983) (10,139)
Statutory profit before income tax expense and net finance costs 770 1,115
Net finance costs (203) (246)
Statutory profit before income tax (expense)/benefit 567 869
Income tax (expense)/benefit (161) (88)
Statutory profit for the year 406 781
87
Q A N T A S A N N U A L R E P O R T 2 0 1 6
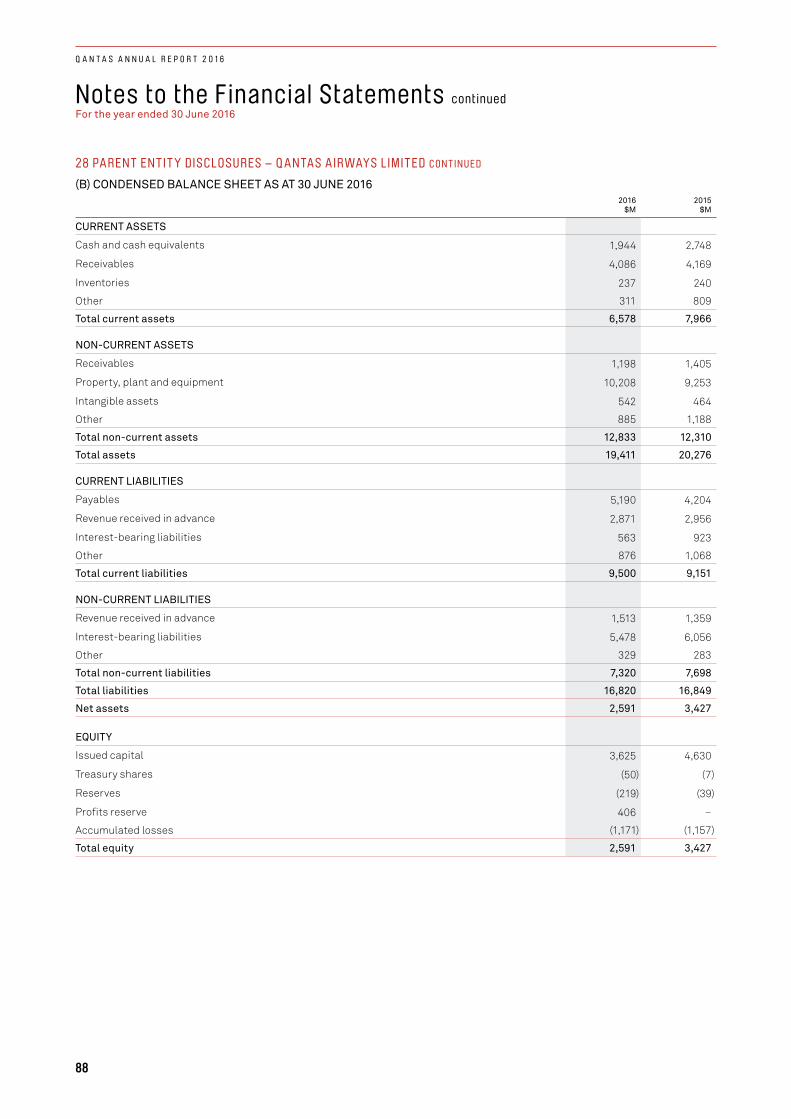
Notes to the Financial Statements continuedFor the year ended 30 June 2016
28 PARENT ENTIT Y DISCLOSURES – Q ANTAS AIRWAYS LIMITED CON T INUED
(B) CONDENSED BALANCE SHEET AS AT 30 JUNE 20162016
$M2015
$M
CURRENT ASSETS
Cash and cash equivalents 1,944 2,748
Receivables 4,086 4,169
Inventories 237 240
Other 311 809
Total current assets 6,578 7,966
NON-CURRENT ASSETS
Receivables 1,198 1,405
Property, plant and equipment 10,208 9,253
Intangible assets 542 464
Other 885 1,188
Total non-current assets 12,833 12,310
Total assets 19,411 20,276
CURRENT LIABILITIES
Payables 5,190 4,204
Revenue received in advance 2,871 2,956
Interest-bearing liabilities 563 923
Other 876 1,068
Total current liabilities 9,500 9,151
NON-CURRENT LIABILITIES
Revenue received in advance 1,513 1,359
Interest-bearing liabilities 5,478 6,056
Other 329 283
Total non-current liabilities 7,320 7,698
Total liabilities 16,820 16,849
Net assets 2,591 3,427
EQUITY
Issued capital 3,625 4,630
Treasury shares (50) (7)
Reserves (219) (39)
Profits reserve 406 –
Accumulated losses (1,171) (1,157)
Total equity 2,591 3,427
88
Q A N T A S A N N U A L R E P O R T 2 0 1 6
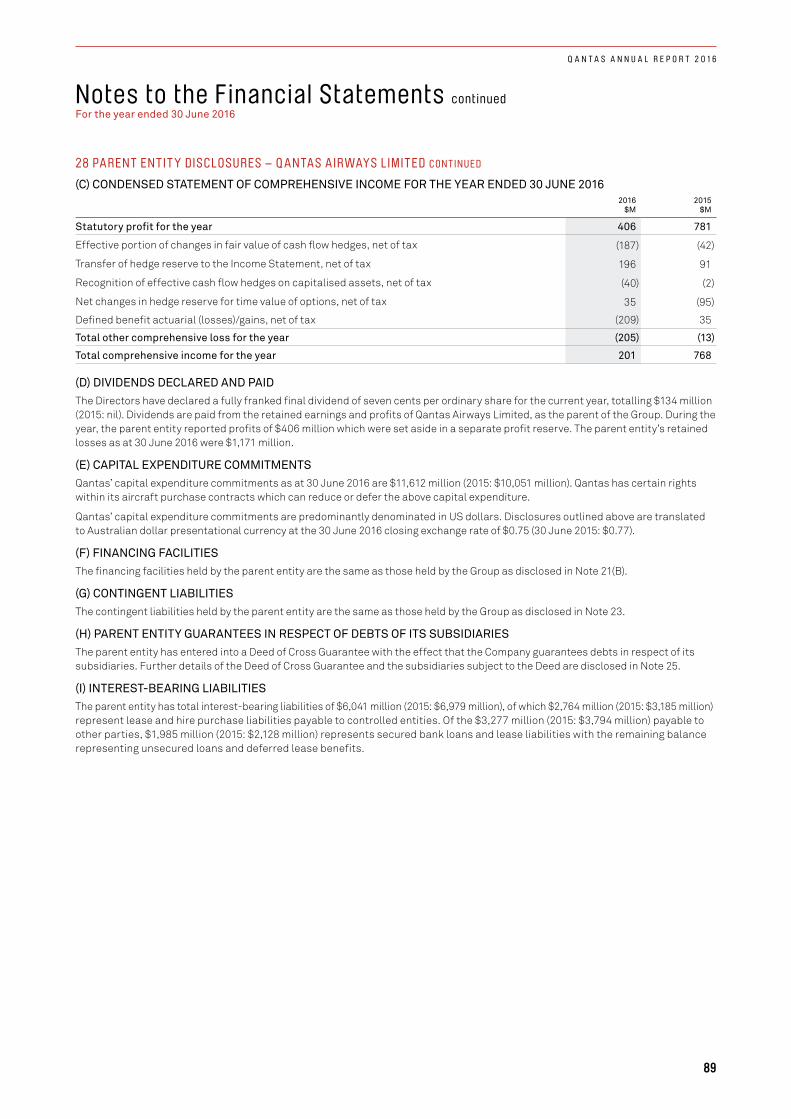
Notes to the Financial Statements continued For the year ended 30 June 2016
28 PARENT ENTIT Y DISCLOSURES – Q ANTAS AIRWAYS LIMITED CON T INUED
(C) CONDENSED STATEMENT OF COMPREHENSIVE INCOME FOR THE YEAR ENDED 30 JUNE 20162016
$M2015
$M
Statutory profit for the year 406 781
Effective portion of changes in fair value of cash flow hedges, net of tax (187) (42)
Transfer of hedge reserve to the Income Statement, net of tax 196 91
Recognition of effective cash flow hedges on capitalised assets, net of tax (40) (2)
Net changes in hedge reserve for time value of options, net of tax 35 (95)
Defined benefit actuarial (losses)/gains, net of tax (209) 35
Total other comprehensive loss for the year (205) (13)
Total comprehensive income for the year 201 768
(D) DIVIDENDS DECLARED AND PAIDThe Directors have declared a fully franked final dividend of seven cents per ordinary share for the current year, totalling $134 million (2015: nil). Dividends are paid from the retained earnings and profits of Qantas Airways Limited, as the parent of the Group. During the year, the parent entity reported profits of $406 million which were set aside in a separate profit reserve. The parent entity’s retained losses as at 30 June 2016 were $1,171 million.
(E) CAPITAL EXPENDITURE COMMITMENTSQantas’ capital expenditure commitments as at 30 June 2016 are $11,612 million (2015: $10,051 million). Qantas has certain rights within its aircraft purchase contracts which can reduce or defer the above capital expenditure.
Qantas’ capital expenditure commitments are predominantly denominated in US dollars. Disclosures outlined above are translated to Australian dollar presentational currency at the 30 June 2016 closing exchange rate of $0.75 (30 June 2015: $0.77).
(F) FINANCING FACILITIESThe financing facilities held by the parent entity are the same as those held by the Group as disclosed in Note 21(B).
(G) CONTINGENT LIABILITIES The contingent liabilities held by the parent entity are the same as those held by the Group as disclosed in Note 23.
(H) PARENT ENTITY GUARANTEES IN RESPECT OF DEBTS OF ITS SUBSIDIARIESThe parent entity has entered into a Deed of Cross Guarantee with the effect that the Company guarantees debts in respect of its subsidiaries. Further details of the Deed of Cross Guarantee and the subsidiaries subject to the Deed are disclosed in Note 25.
(I) INTEREST-BEARING LIABILITIES The parent entity has total interest-bearing liabilities of $6,041 million (2015: $6,979 million), of which $2,764 million (2015: $3,185 million) represent lease and hire purchase liabilities payable to controlled entities. Of the $3,277 million (2015: $3,794 million) payable to other parties, $1,985 million (2015: $2,128 million) represents secured bank loans and lease liabilities with the remaining balance representing unsecured loans and deferred lease benefits.
89
Q A N T A S A N N U A L R E P O R T 2 0 1 6

Notes to the Financial Statements continuedFor the year ended 30 June 2016
29 SUMMARY OF SIGNIFICANT ACCOUNTING POLICIES
(A) REPORTING ENTITYQantas Airways Limited (Qantas) is a for-profit company limited by shares, incorporated in Australia whose shares are publicly traded on the Australian Securities Exchange (ASX) and which is subject to the operation of the Qantas Sale Act 1992.
The Consolidated Financial Statements for the year ended 30 June 2016 comprise Qantas and its controlled entities (together referred to as the Qantas Group) and the Qantas Group’s interest in investments accounted for under the equity method.
Qantas has five subsidiaries that are material to the Qantas Group in 2016 and 2015. The Parent has majority voting rights in respect of each of the material subsidiaries. Materiality has been assessed based on the contribution of statutory profit/(loss) to the Qantas Group.
The Consolidated Financial Statements of Qantas for the year ended 30 June 2016 were authorised for issue in accordance with a resolution of the Directors on 2 September 2016.
i. Statement of Compliance
The Consolidated Financial Statements are general purpose financial statements which have been prepared in accordance with Australian Accounting Standards (AASBs) adopted by the Australian Accounting Standards Board (AASB) and with the Corporations Act 2001. The Consolidated Financial Statements also comply with International Financial Reporting Standards and interpretations (IFRICs) adopted by the International Accounting Standards Board (IASB).
ii. Basis of Preparation
The Consolidated Financial Statements are presented in Australian dollars, which is the functional currency of the Qantas Group, and have been prepared on the basis of historical cost except for the following material items in the Consolidated Balance Sheet:
– Derivatives at fair value through profit and loss are measured at fair value – Assets classified as held for sale are measured at lower of cost and fair value less costs to sell – Net defined benefit asset/(liability) are measured at fair value of plan assets less the present value of the defined benefit obligation
Qantas is a company of the kind referred to in ASIC Corporations (Rounding in Financial/Directors’ Reports) Instrument 2016/191. In accordance with that Instrument, all financial information presented has been rounded to the nearest million dollars, unless otherwise stated. In addition, all financial information presented is representative of the Qantas Group, unless otherwise stated.
(B) CRITICAL ACCOUNTING ESTIMATES AND JUDGEMENTSThe preparation of the Consolidated Financial Statements requires management to make judgements, estimates and assumptions that affect the application of accounting policies and reported amounts of assets, liabilities, income and expenses. The estimates and associated assumptions are based on historical experience and various other factors that are believed to be reasonable under the circumstances, the results of which form the basis for making the judgements about carrying values of assets and liabilities that are not readily apparent from other sources. Actual results may differ from these estimates.
Estimates and underlying assumptions are reviewed on an ongoing basis. Revisions to accounting estimates are recognised in the period in which the estimate is revised and in any future periods affected. Judgements made by management in the application of AASBs that have a significant effect on the Consolidated Financial Statements and estimates with a significant risk of material adjustment in future periods are included in the following notes:
– Note 16 – Provisions – Note 18 – Impairment Testing of Cash Generating Units – Note 24 – Superannuation
(C) PRINCIPLES OF CONSOLIDATION
i. Controlled Entities
Controlled entities are entities controlled by the Group. Control exists when the Group is exposed to or has rights to, variable returns from its involvement with the entity and has the ability to affect those returns through its power over the entity.
The Financial Statements of controlled entities are included in the Consolidated Financial Statements from the date that control commences until the date that control ceases.
ii. Non-controlling Interests
Non-controlling interests in the results and equity of controlled entities are shown separately in the Consolidated Income Statement, Consolidated Statement of Comprehensive Income, Consolidated Statement of Changes in Equity and Consolidated Balance Sheet.
90
Q A N T A S A N N U A L R E P O R T 2 0 1 6
Notes to the Financial Statements continued For the year ended 30 June 2016
29 SUMMARY OF SIGNIFICANT ACCOUNTING POLICIES C ON T INUE D
iii. Equity Accounted Investments
Associates are those entities in which the Group has significant influence, but not control or joint control, over the financial and operating policies. Interests in associates are accounted for under the equity accounting method and initially recognised at cost, including transaction costs.
Subsequent to initial recognition, the Consolidated Financial Statements include the Group’s share of profit or loss and other comprehensive income of equity accounted investees, until the date on which significant influence ceases.
Dividends reduce the carrying amount of the equity accounted investment.
When the Group’s share of losses exceeds the equity accounted carrying value of an associate, the Group’s carrying amount is reduced to nil and recognition of further losses is discontinued, except to the extent that the Group has incurred legal or constructive obligations to fund the associates’ operations or has made payments on behalf of an associate.
iv. Transactions Eliminated on Consolidation
Intra-group transactions, balances and unrealised gains and losses on transactions between controlled entities are eliminated in the Consolidated Financial Statements. Unrealised gains and losses arising from transactions with investments accounted for under the equity method are eliminated to the extent of the Group’s interest in the associate.
(D) FOREIGN CURRENCY
i. Foreign Currency Transactions
Transactions in foreign currencies are translated into the respective functional currencies of the Group’s companies at the exchange rates at the date of the transactions.
Monetary assets and liabilities denominated in foreign currencies are translated into the functional currency at the exchange rate at the reporting date. Non-monetary assets and liabilities that are measured at fair value in a foreign currency are translated into the functional currency at the exchange rate when the fair value was determined. Non-monetary items that are measured based on historical cost in a foreign currency are translated at the exchange rate at the date of the transactions. Foreign currency differences are generally recognised in the Consolidated Income Statement.
ii. Foreign Operations
The assets and liabilities of foreign operations, including goodwill and fair value adjustments arising on acquisition, are translated into Australian Dollars at the exchange rates at the reporting date. The income and expenses of foreign operations are translated into Australian Dollars at the exchange rates at the date of the transactions.
Foreign currency differences are recognised in the Consolidated Statement of Comprehensive Income and accumulated in the Foreign Currency Translation Reserve, except to the extent that the translation difference is allocated to Non-controlling Interests.
When a foreign operation is disposed of in its entirety or partially such that control, significant influence or joint control is lost, the cumulative amount in the Foreign Currency Translation Reserve related to that foreign operation is reclassified to the Consolidated Income Statement as part of the gain or loss on disposal. If the Group disposes of part of its interests in a subsidiary but retains control, then the relevant proportion of the cumulative amount is reattributed to non-controlling Interests. When the Group disposes of only part of an associate or joint venture while retaining significant influence or joint control, the relevant proportion of the cumulative amount is reclassified to the Consolidated Income Statement.
(E) FINANCIAL INSTRUMENTS
NON-DERIVATIVE FINANCIAL INSTRUMENTS
i. Recognition and Measurement of Non-derivative Financial Assets
At initial recognition, the Group measures a financial asset at its fair value plus, in the case of a financial asset not at fair value through profit or loss, transaction costs. Transaction costs of financial assets carried at fair value through profit or loss are expensed.
The Group subsequently classifies its financial assets in the following measurement categories: – Those to be measured subsequently at fair value (either through the Consolidated Income Statement or the Consolidated
Statement of Comprehensive Income) – Those to be measured at amortised cost
91
Q A N T A S A N N U A L R E P O R T 2 0 1 6
Notes to the Financial Statements continuedFor the year ended 30 June 2016
29 SUMMARY OF SIGNIFICANT ACCOUNTING POLICIES C ON T INUE D
ii. Recognition and Measurement of Non-derivative Financial Liabilities
At initial recognition, the Group measures a non-derivative financial liability at its fair value, less transaction costs.
The Group subsequently measures non-derivative financial liabilities at amortised cost, with any difference between cost and redemption value being recognised in the Consolidated Income Statement over the period of the borrowings on an effective interest basis. Non-derivative financial liabilities that are designated as hedged items are subject to measurement under the hedge accounting requirements.
DERIVATIVE FINANCIAL INSTRUMENTSDerivative financial instruments are recognised at fair value both initially and on an ongoing basis. The accounting for subsequent changes in fair value depends on whether the derivative is a designated hedging instrument, and if so, the nature of the item being hedged and the type of hedge relationship designated. The Group designates derivatives as either hedges of the fair value of recognised assets or liabilities or a firm commitment (fair value hedges), or hedges of highly probable forecast transactions (cash flow hedges).
At the inception of the transactions, the Qantas Group documents the relationship between hedging instruments and hedged items, including the risk management objective and strategy for undertaking each transaction. The Qantas Group also documents its assessment, both at hedge inception and on an ongoing basis, of whether the hedging instruments that are used in hedge transactions have been and will continue to be highly effective.
From time to time certain derivative financial instruments do not qualify for hedge accounting, notwithstanding that the derivatives are held to hedge identified exposures. Any changes in the fair value of a derivative instrument, or part of a derivative instrument that do not qualify for hedge accounting are classified as ‘ineffective’ and recognised immediately in the Consolidated Income Statement.
i. Fair Value Hedges
Changes in the fair value of derivative financial instruments that are designated and qualify as fair value hedges are recorded in the Consolidated Income Statement, together with any changes in the fair value of the hedged asset or liability or firm commitment attributable to the hedged risk.
ii. Cash Flow Hedges
Where a derivative is designated as a cash flow hedging instrument, the effective portion of changes in the fair value of the derivative is recognised in the Consolidated Statement of Comprehensive Income and accumulated in the hedging reserve. Any ineffective portion of changes in the fair value of the derivative are recognised immediately in the Consolidated Income Statement.
The amount accumulated in equity is retained in the Consolidated Statement of Comprehensive Income and reclassified to the Consolidated Income Statement in the same period or periods during which the hedged forecast cash flows affect profit or loss or the hedged item affects profit or loss. If the forecast transaction is no longer expected to occur, the hedge no longer meets the criteria for hedge accounting, the hedging instrument expires or is sold, terminated or exercised, or the designation is revoked, then hedge accounting is discontinued prospectively. If the forecast transaction is no longer expected to occur, then the amount accumulated in equity is reclassified to the Consolidated Income Statement. Where the hedged item is capital in nature, the cumulative gain or loss recognised in the hedge reserve is transferred to the carrying amount of the asset when the asset is recognised.
iii. Cost of Hedging
The time value of an option, the forward element of a forward contract and any foreign currency basis spread is excluded from the designation of a financial instrument and accounted for as a cost of hedging. The fair value changes of these elements are recognised in other comprehensive income and depending on the nature of the hedged item, will either be transferred to the Consolidated Income Statement in the same period that the underlying transaction affects the Consolidated Income Statement or be capitalised into the initial carrying value of a hedge and reported as ineffectiveness.
iv. Fair Value Calculations
The fair value of financial instruments traded in active markets is based on quoted market prices at balance date. The fair value of financial instruments that are not traded in an active market are estimated using valuation techniques consistent with accepted market practice. The Qantas Group uses a variety of methods and input assumptions that are based on market conditions existing at balance date. The different methods of estimating the fair value of these items have been defined in the Consolidated Financial Statements as follows:
Level 1: Quoted prices (unadjusted) in active markets for identical assets or liabilities
Level 2: Inputs other than quoted prices included within Level 1 that are observable for the asset or liability, either directly (i.e. as prices) or indirectly (i.e. derived from prices)
Level 3: Inputs for the asset or liability that are not based on observable market data (unobservable inputs)
92
Q A N T A S A N N U A L R E P O R T 2 0 1 6
Notes to the Financial Statements continued For the year ended 30 June 2016
29 SUMMARY OF SIGNIFICANT ACCOUNTING POLICIES C ON T INUE D
v. Financial Guarantee Contracts
Financial guarantee contracts are recognised as a financial liability at the time the guarantee is issued. The liability is initially measured at fair value and subsequently at the higher of the amount determined in accordance with AASB 137: Provisions, Contingent Liabilities and Contingent Assets, and the amount initially recognised less cumulative amortisation, where appropriate.
The fair value of financial guarantees is determined as the present value of the difference in net cash flows between the contractual payments under the debt instrument and the payments that would be required without the guarantee, or the estimated amount that would be payable to a third party for assuming the obligations.
Where guarantees in relation to loans or payables of associates and jointly controlled entities are provided for no compensation, the fair values are accounted for as contributions and recognised as part of the cost of the investment.
(F) REVENUE RECOGNITION
i. Passenger and Freight Revenue
Passenger and freight revenue is measured at the fair value of the consideration received, net of sales discount, passenger and freight interline/IATA commission and Goods and Services Tax. Other sales commissions paid by the Qantas Group are included in expenditure.
Passenger revenue and freight revenue is recognised when passengers or freight are uplifted. Unused tickets are recognised as revenue using estimates based on the terms and conditions of the ticket, historic trends and experience.
Passenger recoveries (including fuel surcharge on passenger tickets) are included in net passenger revenue. Freight fuel surcharge is included in net freight revenue.
Revenue from ancillary passenger revenue, passenger services fees, lease capacity revenue and air charter revenue is recognised as revenue when the services are provided.
Receipts for advanced passenger ticket sales or freight sales which have not yet been availed or recognised as revenue are deferred on the balance sheet as revenue received in advance.
ii. Frequent Flyer Marketing Revenue
Marketing revenue associated with the issuance of Frequent Flyer points is recognised when the service is performed (typically on the issuance of the point). Marketing revenue is measured as the difference between the cash received on issuance of a point and the amount deferred as unrecognised redemption revenue.
iii. Frequent Flyer Redemption Revenue
Revenue received for the issuance of points is deferred as a liability (revenue received in advance) until the points are redeemed or, in the case of Qantas Group flight redemption, the passenger is uplifted. Redemption revenue is measured based on Management’s estimate of the fair value of the expected awards for which the points will be redeemed. The fair value of the awards is reduced to take into account the proportion of points that are expected to expire (breakage). Redemption revenue arising from Qantas Group flight redemptions is recognised in passenger revenue. Redemptions on other airlines are recognised in other revenue.
iv. Frequent Flyer Membership Fee Revenue
Membership fee revenue results from the initial joining fee charged to members. Revenue is recognised on expiry of any refund period.
(G) TAXES
i. Tax Compliance
The Qantas Group is committed to embedding risk management practices to support the achievement of compliance objectives and fulfil corporate governance obligations. Tax risk management is governed by both the Qantas Group Risk Management Policy and the Qantas Group Tax Risk Management Policy, ensuring corporate governance obligations with respect to tax risks are met.
The Qantas Group has paid all taxes that it owes and all tax compliance obligations are up to date. The Australian Taxation Office (ATO) has advised that the Qantas Group is a key taxpayer continuing to have a ‘low’ likelihood of non-compliance. The ATO also acknowledged Qantas’ continued commitment to engage cooperatively and transparently to mitigate tax risks, including obtaining tax certainty on key transactions through the use of binding Private Rulings and entering into a multi-tax Annual Compliance Arrangement (ACA).
Tax Treaties
Due to the operation of income tax treaties and specific rules dealing with airlines, the Qantas Group appropriately reports the majority of its income in Australia with only a small component being reported in foreign jurisdictions (for the purpose of determining liability to company tax). This effectively results in more than 99 per cent of the Qantas Group’s profit being subject to taxation in Australia.
93
Q A N T A S A N N U A L R E P O R T 2 0 1 6
Notes to the Financial Statements continuedFor the year ended 30 June 2016
29 SUMMARY OF SIGNIFICANT ACCOUNTING POLICIES C ON T INUE D
Current TaxCurrent tax liability is the expected tax payable on the taxable income for the year, using tax rates enacted or substantially enacted at balance date and any adjustment to tax payable with respect to previous years.
Deferred TaxDeferred tax is recognised in respect of temporary differences between the carrying amounts of assets and liabilities for financial reporting purposes and the amounts used for taxation purposes. Deferred tax is not recognised for:
– Temporary differences arising from the initial recognition of assets or liabilities that affect neither accounting nor taxable profit – Temporary differences relating to investments in controlled entities and associates and jointly controlled entities to the extent
that they will probably not reverse in the foreseeable future or – Taxable temporary differences arising on the initial recognition of goodwill
Deferred tax assets are recognised for unused tax losses, unused tax credits and deductible temporary differences only to the extent that it is probable that future taxable profits will be available against which they can be used. Deferred tax assets are reviewed at each reporting date and are reduced to the extent that it is no longer probable that the related tax benefit will be realised. Such reductions are reversed when the probability of future taxable profits improves. Deferred tax is measured at the tax rates that are expected to be applied to temporary differences when they reverse, using tax rates enacted or substantially enacted at reporting date.
Qantas provides for income tax in both Australia and overseas jurisdictions where a liability exists.
ii. Income TaxIncome tax expense comprises current and deferred tax. Income tax expense is recognised in the Consolidated Income Statement except to the extent that it relates to items recognised directly in equity or in other comprehensive income, in which case it is recognised in equity or in other comprehensive income.
iii. Goods and Services Tax (GST)Revenues, expenses and assets are recognised net of the amount of GST, except where the amount of GST incurred is not recoverable from the taxation authority. In these circumstances, the GST is recognised as part of the cost of acquisition of the asset or as part of the expense. Receivables and payables are stated with the amount of GST included. The net amount of GST recoverable from, or payable to, the taxation authority is included as a current asset or liability in the Consolidated Balance Sheet. The GST components of cash flows arising from investing and financing activities which are recoverable from, or payable to, the taxation authority are classified as operating cash flows.
iv. Tax ConsolidationQantas and its Australian wholly owned controlled entities, trusts and partnerships are part of a tax consolidated group. As a consequence, all members of the tax consolidated group are taxed as a single entity.
(H) IMPAIRMENTi. Non-financial AssetsThe carrying amounts of non-financial assets are reviewed at each balance date to determine whether there is any indication of impairment. If any such indication exists, the asset’s recoverable amount is estimated. For goodwill and intangible assets with indefinite lives, recoverable amounts are estimated at the end of each financial year.
The recoverable amount of an asset is the greater of its fair value less costs to sell and value in use. Assets which primarily generate cash flows as a group, such as aircraft, are assessed on a cash generating unit (CGU) basis, inclusive of related infrastructure and intangible assets and compared to net cash inflows for the CGU. Estimated net cash flows used in determining recoverable amounts are discounted to their net present value using a pre-tax discount rate that reflects current market assessments of the time value of money and the risks specific to the assets or CGU.
Identification of an asset’s CGU requires judgement, as it requires identification of the lowest aggregation of assets that generate largely independent cash inflows. In Management’s judgement, the lowest aggregation of assets which give rise to CGUs as defined by AASB 136: Impairment of Assets are the Qantas Domestic CGU, Qantas International CGU, Qantas Loyalty CGU, Qantas Freight CGU and the Jetstar Group CGU.
ii. Financial AssetsThe carrying value of financial assets is assessed at each reporting date to determine whether there is any objective evidence that it is impaired. A financial asset is considered to be impaired if objective evidence indicates that one or more events have had a negative effect on the estimated future cash flows of that asset. An impairment loss in respect of a financial asset measured at amortised cost is calculated as the difference between its carrying amount and the present value of the estimated future cash flows discounted at the asset’s original effective interest rate.
94
Q A N T A S A N N U A L R E P O R T 2 0 1 6

Notes to the Financial Statements continued For the year ended 30 June 2016
29 SUMMARY OF SIGNIFICANT ACCOUNTING POLICIES C ON T INUE D
(I) PROPERTY, PLANT AND EQUIPMENT
i. Recognition and Measurement
Items of property, plant and equipment are stated at cost less accumulated depreciation and impairment losses. Items of property, plant and equipment are initially recorded at cost, being the fair value of the consideration provided plus incidental costs directly attributable to the acquisition.
The cost of acquired assets includes the initial estimate at the time of installation of the costs of dismantling and removing the items and restoring the site on which they are located, and changes in the measurement of existing liabilities recognised for these costs resulting from changes in the timing or outflow of resources required to settle the obligation or from changes in the discount rate. The unwinding of the discount is treated as a finance charge.
The cost also may include transfers from hedge reserve of any gain or loss on qualifying cash flow hedges of foreign currency purchases of property, plant and equipment in accordance with Note 29(E). Borrowing costs associated with the acquisition, construction or production of qualifying assets are recognised as part of the cost of the asset to which they relate.
ii. Subsequent Expenditure
Subsequent expenditure is capitalised only if it is probable that the future economic benefits associated with the expenditure will flow to the Group.
iii. Depreciation
Depreciation is provided on a straight-line basis on all items of property, plant and equipment except for freehold land, which is not depreciated. The depreciation rates of owned assets are calculated so as to allocate the cost or valuation of an asset, less any estimated residual value, over the asset’s estimated useful life to the Qantas Group. Assets are depreciated from the date of acquisition or, with respect to internally constructed assets, from the time an asset is completed and available for use. The costs of improvements to assets are depreciated over the remaining useful life of the asset or the estimated useful life of the improvement, whichever is the shorter. Assets under finance lease are depreciated over the term of the relevant lease or, where it is likely the Qantas Group will obtain ownership of the asset, the life of the asset.
The principal asset depreciation periods and estimated residual value percentages are:
Years Residual Value (%)
Buildings and leasehold improvements 10 – 40 01
Plant and equipment 3 – 20 0
Passenger aircraft and engines 2.5 – 20 0 – 10
Freighter aircraft and engines 2.5 – 20 0 – 20
Aircraft spare parts 15 – 20 0 – 20
1 Certain leases allow for the sale of leasehold improvements for fair value. In these instances, the expected fair value is used as the estimated residual value.
Useful lives and residual values are reviewed annually and reassessed having regard to commercial and technological developments, the estimated useful life of assets to the Qantas Group and the long-term fleet plan.
iv. Maintenance and Overhaul Costs
Embedded Maintenance
An element of the cost of an acquired aircraft (owned or finance-leased) is attributed to its service potential, reflecting the maintenance condition of its engines and airframe. This cost is depreciated over the shorter of the period to the next major inspection event or the remaining life of the asset or remaining lease term.
Subsequent Maintenance Expenditure
The costs of subsequent major cyclical maintenance checks for owned and leased aircraft (including operating leases) are recognised and depreciated over the shorter of the scheduled usage period to the next major inspection event or the remaining life of the aircraft or lease term (as appropriate). Maintenance checks which are covered by third party maintenance agreements where there is a transfer of risk and legal obligation are expensed on the basis of hours flown. All other maintenance costs are expensed as incurred.
95
Q A N T A S A N N U A L R E P O R T 2 0 1 6
Notes to the Financial Statements continuedFor the year ended 30 June 2016
29 SUMMARY OF SIGNIFICANT ACCOUNTING POLICIES C ON T INUE D
Modifications
Modifications that enhance the operating performance or extend the useful lives of aircraft are capitalised and depreciated over the remaining estimated useful life of the asset or remaining lease term (as appropriate). Manpower costs in relation to employees who are dedicated to major modifications to aircraft are capitalised as part of the cost of the modification to which they relate.
v. Manufacturers’ Credits
The Qantas Group receives credits from manufacturers in connection with the acquisition of certain aircraft and engines. These credits are recorded as a reduction to the cost of the related aircraft and engines. Where the aircraft are held under operating leases, the credits are deferred and reduced from the operating lease rentals on a straight-line basis over the period of the related lease.
(J) LEASES
i. Determining Whether an Arrangement Contains a Lease
At inception of an arrangement, the Group determines whether the arrangement is or contains a lease.
ii. Finance Leased and Hire Purchase Assets
Leased assets under which the Qantas Group assumes substantially all the risks and benefits of ownership are classified as finance leases. Other leases are classified as operating leases.
Finance leases are capitalised. A lease asset and a lease liability equal to the present value of the minimum lease payments and guaranteed residual value are recorded at the inception of the lease. Any gains and losses arising under sale and finance leaseback arrangements are deferred and depreciated over the lease term. Capitalised leased assets are depreciated on a straight-line basis over the period in which benefits are expected to arise from the use of those assets. Lease payments are allocated between the reduction in the principal component of the lease liability and the interest element.
Fully prepaid leases are classified in the Consolidated Balance Sheet as hire purchase assets to recognise that the financing structures impose certain obligations, commitments and/or restrictions on the Qantas Group, which differentiate these aircraft from owned assets.
iii. Operating Leases
Rental payments under operating leases are charged to the Consolidated Income Statement on a straight-line basis over the term of the lease.
With respect to any premises rented under long-term operating leases, which are subject to sub-tenancy agreements, a provision is made for any shortfall between primary payments to the head lessor less any recoveries from sub-tenants. These provisions are determined on a discounted cash flow basis, using a rate reflecting the cost of funds.
(K) INTANGIBLE ASSETS
i. Recognition and Measurement
Goodwill Goodwill is stated at cost less any accumulated impairment losses. With respect to investments accounted for under the equity method, the carrying amount of goodwill is included in the carrying amount of the investment.
Airport landing slots Airport landing slots are stated at cost less any accumulated impairment losses.
Software Software is stated at cost less accumulated amortisation and impairment losses. Software development expenditure, including the cost of materials, direct labour and other direct costs, is only recognised as an asset when the Qantas Group controls future economic benefits as a result of the costs incurred and it is probable that those future economic benefits will eventuate and the costs can be measured reliably.
Brand names and trademarks
Brand names and trademarks are carried at cost less any accumulated impairment losses.
Customer contracts/relationships
Customer contracts/relationships are carried at their fair value at the date of acquisition less accumulated amortisation and impairment losses.
Contract intangible assets Contract intangible assets are stated at cost less accumulated amortisation. Amortisation commences when the asset is ready for use.
ii. Subsequent Expenditure
Subsequent expenditure is capitalised only when it increases the future economic benefits embodied in the specific asset to which it relates. All other expenditure, including expenditure on internally generated goodwill and brands, is recognised in the Consolidated Income Statement as incurred.
96
Q A N T A S A N N U A L R E P O R T 2 0 1 6
Notes to the Financial Statements continued For the year ended 30 June 2016
29 SUMMARY OF SIGNIFICANT ACCOUNTING POLICIES C ON T INUE D
iii. Amortisation
Amortisation is calculated to write off the cost of intangible assets less their estimated residual values using the straight-line method over their estimated useful lives and is recognised in the Consolidated Income Statement. Goodwill, brand names and trademarks and airport landing slots are indefinite lived intangible assets and are allocated to the relevant CGU. These indefinite lived intangible assets are not amortised but tested annually for impairment. Contract intangible assets is not amortised until such time the intangible asset is ready for use, but tested annually for impairment.
Software 3 – 15 years
Customer contracts/relationships 5 – 10 years
(L) EMPLOYEE BENEFITS Wages, salaries, annual leave and sick leave
Liabilities for wages, salaries, annual leave (including leave loading) and sick leave vesting to employees are recognised in respect of employees’ services up to the end of the reporting period. These liabilities are measured at the amounts expected to be paid when they are settled and include related on-costs, such as workers’ compensation insurance, superannuation and payroll tax. The annual leave provision is discounted using corporate bond rates which most closely match the terms to maturity of the provision. The unwinding of the discount is treated as a finance charge.
Employee share plans The grant date fair value of equity-settled share-based payment awards granted to employees is generally recognised as an expense, with a corresponding increase in equity, over the vesting period of the awards. The amount recognised as an expense is adjusted to reflect the number of awards for which related service and non-market performance conditions are expected to be met, such that the amount ultimately recognised is based on the number of awards that meet the related service and non-market performance conditions at the vesting date. For share-based payment awards with non-vesting conditions (such as market performance conditions), the grant date fair value of the share-based payment is measured to reflect such conditions and that there is no true-up for differences between expected and actual outcomes.
The fair value of equity-based entitlements settled in cash is recognised as an employee expense with a corresponding increase in liability over the period during which employees unconditionally become entitled to payment. The liability is remeasured at each reporting date and at settlement date based on the fair value. Any changes in the fair value of the liability are recognised as an employee expense in the Consolidated Income Statement.
Long service leave The liability for long service leave is recognised as a provision for employee benefits and measured at the present value of estimated future payments to be made in respect of services provided by employees up to the end of the reporting period. The provision is calculated using expected future increases in wage and salary rates including related on-costs and expected settlement dates based on staff turnover history. The provision is discounted using corporate bond rates which most closely match the terms to maturity of the provision. The unwinding of the discount is treated as a finance charge.
Defined contribution superannuation plans
The Qantas Group contributes to employee defined contribution superannuation plans. Contributions to these plans are recognised as an expense in the Consolidated Income Statement as incurred.
Defined benefit superannuation plans
The Qantas Group’s net obligation with respect to defined benefit superannuation plans is calculated separately for each plan. The Qantas Superannuation Plan has been split based on the divisions which relate to accumulation members and defined benefit members. Only defined benefit members are included in the Qantas Group’s net obligation calculations. The calculation estimates the amount of future benefit that employees have earned in return for their service in the current and prior periods, which is discounted to determine its present value, and the fair value of any plan assets is deducted.
The calculation of defined benefit obligations is performed annually by a qualified actuary using the projected unit credit method. When the calculation results in a potential asset for the Group, the recognised asset is limited to the present value of economic benefits available in the form of any future refunds from the plan or reductions in future contributions to the plan. To calculate the present value of economic benefits, consideration is given to any applicable minimum funding requirements.
Remeasurements of the net defined benefit liability or asset, which comprise actuarial gains and losses, the return on plan assets (excluding interest) and the effect of the asset ceiling (if any, excluding interest), are recognised immediately in other comprehensive income. The Group determines the net interest expense (income) on the net defined benefit liability (asset) for the period by applying the discount rate used to measure the defined benefit obligation at the beginning of the annual period to the then-net defined benefit liability (asset), taking into account any changes in the net defined benefit liability (asset) during the period
97
Q A N T A S A N N U A L R E P O R T 2 0 1 6
Notes to the Financial Statements continuedFor the year ended 30 June 2016
Defined benefit superannuation plans cont.
as a result of contributions and benefit payments. Net interest expense and other expenses related to defined benefit plans are recognised in the Consolidated Income Statement.
The discount rate used is the corporate bond rate which has a maturity date that approximates the terms of Qantas obligations. When the benefits of a plan are changed or when a plan is curtailed, the resulting change in benefit that relates to past service or the gain or loss on curtailment is recognised immediately in profit or loss. The Group recognises gains and losses on the settlement of a defined benefit plan when the settlement occurs.
Employee termination benefits
Termination benefits are expensed at the earlier of when the Group can no longer withdraw the offer of those benefits and when the Group recognises costs for a restructuring. If benefits are not expected to be settled wholly within 12 months of the end of the reporting period, then they are discounted.
(M) PROVISIONSA provision is recognised if, as a result of a past event, there is a present legal or constructive obligation that can be measured reliably, and it is probable that an outflow of economic benefits will be required to settle the obligation.
If the effect is material, a provision is determined by discounting the expected future cash flows required to settle the obligation at a pre-tax rate that reflects current market assessments of the time value of money and the risks specific to the liability. The unwinding of the discount is treated as a finance charge.
Onerous contracts An onerous contract is a contract in which the unavoidable cost of meeting the obligations under the contract exceeds the economic benefit expected to be received. The Qantas Group has raised this provision in respect of operating leases on premises and onerous customer contracts.
A provision for onerous contracts is measured at present value of the lower of the expected cost of terminating the contract and the expected net cost of continuing with the contract. Before a provision is established, the Group recognises any impairment loss on the assets associated with that contract.
Make good on leased assets
Aircraft: a provision for return costs to meet contractual return aircraft minimum conditions, at the end of the lease terms for the aircraft under operating leases, are recognised over the lease term.
Property and environment: where the occupation of property or land gives rise to an obligation for site closure or rehabilitation, the Group recognises a provision for the costs associated with restoration.
Insurance, legal and other Insurance: The Qantas Group self-insures for risks associated with workers’ compensation in certain jurisdictions. Qantas has made provision for all notified assessed workers’ compensation liabilities, together with an estimate of liabilities incurred but not reported, based on an independent actuarial assessment. The provision is discounted using pre-tax rates that reflect current market assessments of the time value of money and the risks specific to the liabilities and have maturity dates approximating the terms of Qantas’ obligations. Workers’ compensation for all remaining employees is commercially insured.
Legal and other provisions: these are recognised where they are incurred as a result of a past event, there is legal or constructive obligation that can be measured reliably and it is probable that an outflow of economic benefits will be required to settle the obligation.
(N) NET FINANCE COSTSNet finance costs comprise interest payable on borrowings calculated using the effective interest method, unwinding of the discount on provisions and receivables, interest receivable on funds invested and gains and losses on mark-to-market movement in fair value hedges.
Finance income is recognised in the Consolidated Income Statement as it accrues, using the effective interest method.
Finance costs are recognised in the Consolidated Income Statement as incurred, except where interest costs relate to qualifying assets in which case they are capitalised to the cost of the assets. Qualifying assets are assets that necessarily take a substantial period of time to be made ready for intended use. Where funds are borrowed generally, borrowing costs are capitalised using the average interest rate applicable to the Qantas Group’s debt facilities.
(O) CAPITAL AND RESERVES
i. Ordinary Shares
Ordinary shares are classified as equity. Incremental costs directly attributable to issue of ordinary shares are recognised as a deduction from equity, net of any related income tax benefit.
29 SUMMARY OF SIGNIFICANT ACCOUNTING POLICIES C ON T INUE D
98
Q A N T A S A N N U A L R E P O R T 2 0 1 6

Notes to the Financial Statements continued For the year ended 30 June 2016
29 SUMMARY OF SIGNIFICANT ACCOUNTING POLICIES C ON T INUE D
ii. Repurchase of Share Capital
When share capital recognised as equity is repurchased, the amount of the consideration paid, including directly attributable costs is recognised as a deduction from equity.
iii. Treasury Shares
Shares held by the Qantas sponsored Employee Share Plan Trust are recognised as treasury shares and deducted from equity.
iv. Employee Compensation Reserve
The fair value of equity plans granted is recognised in the employee compensation reserve over the vesting period. This reserve will be reversed against treasury shares when the underlying shares vest and transfer to the employee. No gain or loss is recognised in the Consolidated Income Statement on the purchase, sale, issue or cancellation of Qantas’ own equity instruments.
v. Hedge Reserve
The hedge reserve is comprised of the effective portion of the cumulative net change in the fair value of cash flow hedging instruments and the cumulative change in fair value arising from the time value of options related to future forecast transactions.
vi. Foreign Currency Translation Reserve
The foreign currency translation reserve comprises all foreign exchange differences arising from the translation of the financial statements of foreign controlled entities and investments accounted for under the equity method.
vii. Defined Benefit Reserve
The defined benefit reserve comprises the remeasurements of the net defined benefit asset/(liability) which are recognised in other comprehensive income in accordance with AASB 119 Employee Benefits (2011).
(P) COMPARATIVESWhere applicable, various comparative balances have been reclassified to align with current period presentation.
(Q) SEGMENT REPORTINGUnderlying EBIT of the Qantas Group’s operating segments is prepared and presented on the basis that it reflects the revenue earned and the expenses incurred by each operating segment. The significant accounting policies applied in implementing this basis of preparation are set out below. These accounting policies have been consistently applied to all periods presented in the Consolidated Financial Statements.
Segment Performance Measure Basis of Preparation
External segment revenue
External segment revenue is reported by operating segments as follows:− Net passenger revenue is reported by the operating segment which operated the relevant flight or
provided the relevant service. For Qantas Airlines, where a multi-sector ticket covering international and domestic travel is sold, the revenue is reported by Qantas Domestic and Qantas International on a pro-rata basis using an industry standard allocation process
− Other revenue is reported by the operating segment that earned the revenue
Inter-segment revenue Inter-segment revenue for Qantas Domestic, Qantas International and Jetstar Group operating segments primarily represents:− Net passenger revenue arising from the redemption of Frequent Flyer points for Qantas Group flights
by Qantas Loyalty− Net freight revenue from the utilisation of Qantas Domestic, Qantas International and Jetstar Group’s
aircraft bellyspace by Qantas FreightInter-segment revenue for Qantas Loyalty primarily represents marketing revenue arising from the issuance of Frequent Flyer points to Qantas Domestic, Qantas International and Jetstar Group.
Inter-segment revenue transactions, which are eliminated on consolidation, occur in the ordinary course of business at prices that approximate market prices.
Qantas Loyalty does not derive net profit from inter-segment transactions relating to Frequent Flyer point issuances and redemptions.
99
Q A N T A S A N N U A L R E P O R T 2 0 1 6
Notes to the Financial Statements continuedFor the year ended 30 June 2016
Segment Performance Measure Basis of Preparation
Share of net profit/(loss) of investments accounted for under the equity method
Share of net profit/(loss) of investments accounted for under the equity method is reported by the operating segment which is accountable for the management of the investment. The share of net profit/(loss) of investments accounted for under the equity method for Qantas Airlines’ investments has been equally shared between Qantas Domestic and Qantas International.
Underlying EBITDAR The significant expenses impacting Underlying EBITDAR are as follows: – Manpower and staff related costs are reported by the operating segment that utilises the manpower.
Where manpower supports both Qantas Domestic and Qantas International, costs are reported by using an appropriate allocation methodology
– Fuel expenditure is reported by the segment that consumes the fuel in its operations – Aircraft operating variable costs are reported by the segment that incurs these costs – All other expenditure is reported by the operating segment to which they are directly attributable or, in
the case of Qantas Airlines, between Qantas Domestic and Qantas International using an appropriate allocation methodology
To apply this accounting policy, where necessary, expenditure is recharged between operating segments as a cost recovery.
(R) NEW STANDARDS AND INTERPRETATIONS NOT YET ADOPTEDThe following table details the standards, amendments to standards and interpretations that have been identified as those which may impact the Qantas Group in the period of initial application. They are available for early adoption at 30 June 2016, but have not been applied in preparing these Consolidated Financial Statements.
Topic Key Requirements and Effective Date Impact
AASB 9 Financial Instruments (AASB 9 (2014))
AASB 9 (2014) amends AASB 9 (2013) to include a new expected credit loss model for calculating impairment on financial assets.
AASB 9 (2014) is effective for annual reporting periods beginning on or after 1 January 2018, with early adoption permitted.
This standard is not expected to have a material impact on the financial statements of the Group.
AASB 15 Revenue from Contracts with Customers (AASB 15)
AASB 15 establishes a comprehensive framework for determining whether, how much and when revenue is recognised. It replaces existing revenue recognition guidance, including AASB 118 Revenue, AASB 111 Construction Contracts and AASB Interpretation 13 Customer Loyalty Programmes.
Qantas is assessing the potential impact on the Consolidated Financial Statements resulting from the application of AASB 15.
AASB 16 Leases (AASB 16) AASB 16 will replace AASB 117 Leases. It requires recognition of a right of use asset along with the associated lease liability where the Group is a lessee. Interest expense will be recognised in the income statement using the effective interest rate method, and the right of use asset will be depreciated.
The standard is effective for annual reporting periods beginning on or after 1 January 2019, with early adoption permitted where AASB 15 is also adopted.
Qantas is assessing the potential impact on the Consolidated Financial Statements resulting from the application of AASB 16.
29 SUMMARY OF SIGNIFICANT ACCOUNTING POLICIES C ON T INUE D
100
Q A N T A S A N N U A L R E P O R T 2 0 1 6
Directors’ DeclarationFor the year ended 30 June 2016
1. In the opinion of the Directors of Qantas Airways Limited (Qantas):
a. The Consolidated Financial Statements and Notes, and the Remuneration Report set out on pages 30 to 48 in the Directors’ Report, are in accordance with the Corporations Act 2001, including:
i. Giving a true and fair view of the financial position of the Qantas Group as at 30 June 2016 and of its performance for the financial year ended on that date
ii. Complying with Australian Accounting Standards (including the Australian Accounting Interpretations) and the Corporations Regulations 2001
b. There are reasonable grounds to believe that Qantas will be able to pay its debts as and when they become due and payable.
2. There are reasonable grounds to believe that Qantas and the controlled entities will be able to meet any obligations or liabilities to which they are or may become subject to by virtue of the Deed of Cross Guarantee between Qantas and those controlled entities pursuant to ASIC Class Order 98/1418.
3. The Directors have been given the declarations required by section 295A of the Corporations Act 2001 from the Chief Executive Officer and the Chief Financial Officer for the year ended 30 June 2016.
4. The Directors draw attention to Note 29(A) which includes a statement of compliance with International Financial Reporting Standards.
Signed in accordance with a Resolution of the Directors:
Leigh Clifford Alan Joyce
Chairman Chief Executive Officer
2 September 2016 2 September 2016
101
Q A N T A S A N N U A L R E P O R T 2 0 1 6
Independent Auditor’s ReportFor the year ended 30 June 2016
To the Members of Qantas Airways Limited
REPORT ON THE FINANCIAL REPORTWe have audited the accompanying Financial Report of Qantas Airways Limited (Qantas), which comprises the Consolidated Balance Sheet as at 30 June 2016, and Consolidated Income Statement, Consolidated Statement of Comprehensive Income, Consolidated Statement of Changes in Equity and the Consolidated Cash Flow Statement for the year ended on that date, Notes 1 to 29 comprising a summary of significant accounting policies and other explanatory information and the Directors’ Declaration of the Group comprising Qantas and the entities it controlled at the year’s end or from time to time during the financial year (Qantas Group).
Directors’ Responsibility for the Financial Report
The Directors of Qantas are responsible for the preparation of the Financial Report that gives a true and fair view in accordance with Australian Accounting Standards and the Corporations Act 2001 and for such internal control as the Directors determine is necessary to enable the preparation of the Financial Report that is free from material misstatement whether due to fraud or error. In Note 29(A)i, the Directors also state, in accordance with Australian Accounting Standard AASB 101 Presentation of Financial Statements, that the Financial Statements of the Group comply with International Financial Reporting Standards.
Auditor’s Responsibility
Our responsibility is to express an opinion on the Financial Report based on our audit. We conducted our audit in accordance with Australian Auditing Standards. These Auditing Standards require that we comply with relevant ethical requirements relating to audit engagements and plan and perform the audit to obtain reasonable assurance whether the Financial Report is free from material misstatement.
An audit involves performing procedures to obtain audit evidence about the amounts and disclosures in the Financial Report. The procedures selected depend on the auditor’s judgement, including the assessment of the risks of material misstatement of the Financial Report, whether due to fraud or error. In making those risk assessments, the auditor considers internal control relevant to the entity’s preparation of the Financial Report that gives a true and fair view in order to design audit procedures that are appropriate in the circumstances, but not for the purpose of expressing an opinion on the effectiveness of the entity’s internal control. An audit also includes evaluating the appropriateness of accounting policies used and the reasonableness of accounting estimates made by the Directors, as well as evaluating the overall presentation of the Financial Report.
We performed the procedures to assess whether in all material respects the Financial Report presents fairly, in accordance with the Corporations Act 2001 and Australian Accounting Standards, a true and fair view which is consistent with our understanding of the Group’s financial position and of its performance.
We believe that the audit evidence we have obtained is sufficient and appropriate to provide a basis for our audit opinion.
Independence
In conducting our audit, we have complied with the independence requirements of the Corporations Act 2001.
Auditor’s Opinion
In our opinion:
a. The Financial Report of the Qantas Group is in accordance with the Corporations Act 2001, including:
i. giving a true and fair view of the Qantas Group’s financial position as at 30 June 2016 and of its performance for the year ended on that date; and
ii. complying with Australian Accounting Standards and the Corporations Regulations 2001.
b. The Financial Report also complies with International Financial Reporting Standards as disclosed in Note 29(A)i.
REPORT ON THE REMUNERATION REPORTWe have audited the Remuneration Report included in the Directors’ Report for the year ended 30 June 2016. The Directors of Qantas are responsible for the preparation and presentation of the Remuneration Report in accordance with Section 300A of the Corporations Act 2001. Our responsibility is to express an opinion on the Remuneration Report, based on our audit conducted in accordance with auditing standards.
Auditor’s Opinion on the Directors’ Remuneration Report
In our opinion, the Remuneration Report of Qantas Airways Limited for the year ended 30 June 2016, complies with Section 300A of the Corporations Act 2001.
KPMG
Duncan McLennan Julian McPherson
Partner Partner
Sydney Sydney2 September 2016 2 September 2016
KPMG, an Australian partnership and a member firm of the KPMG network of independent member firms affiliated with KPMG International Cooperative (“KPMG International”), a Swiss entity.
Limited liability by a scheme approved under Professional Standards Legislation
102
Q A N T A S A N N U A L R E P O R T 2 0 1 6

Shareholder Information
The shareholder information set out below was applicable as at 22 July 2016.
TWENTY LARGEST SHAREHOLDERS
ShareholdersOrdinary Shares
Held% of Issued
Shares
1 HSBC Custody Nominees (Australia) Limited 513,912,965 26.78
2 J P Morgan Nominees Australia Limited 352,247,303 18.36
3 National Nominees Limited 248,589,405 12.96
4 Citicorp Nominees Pty Limited 200,548,122 10.45
5 Citicorp Nominees Pty Limited (Colonial First State Inv A/C) 66,853,779 3.48
6 BNP Paribas Noms Pty Ltd (DRP) 48,901,771 2.55
7 HSBC Custody Nominees (Australia) Limited (NT-CTH S C A/C) 24,852,606 1.30
8 Pacific Custodians Pty Limited 23,815,101 1.24
9 National Nominees Limited (N A/C) 8,892,909 0.46
10 CS Third Nominees Pty Limited 8,757,001 0.46
11 BNP Paribas Nominees Pty Ltd (Agency Lending Collateral) 7,878,000 0.41
12 BNP Paribas Nominees Pty Ltd (Agency Lending DRP A/C) 5,519,784 0.29
13 HSBC Custody Nominees (Australia) Limited-GSCO ECA 4,884,831 0.25
14 AMP Life Limited 4,285,548 0.22
15 RBC Investor Services Australia Nominees Pty Limited 3,956,162 0.21
16 Bond Street Custodians Limited 3,741,329 0.19
17 UBS Nominees Pty Ltd 3,579,866 0.19
18 CS Fourth Nominees Pty Limited 3,493,480 0.18
19 Dr Kui Lim Chong & Mrs Jocelyn Elizabeth Chong 2,750,000 0.14
20 Alan Joyce Pty Ltd 2,728,924 0.14
Total 1,540,188,886 80.26
DISTRIBUTION OF ORDINARY SHARES Analysis of ordinary shareholders by size of shareholding:
Number of SharesOrdinary Shares
HeldNumber of
Shareholders% of Issued
Shares
1–1,0001 22,396,973 44,420 1.17
1,001–5,000 123,774,332 49,904 6.45
5,001–10,000 55,388,915 7,838 2.89
10,001–100,000 102,836,848 4,626 5.36
100,001 and over 1,614,403,946 203 84.14
Total 1,918,801,014 106,991 100.00
1 2,428 shareholders hold less than a marketable parcel of shares in Qantas, as at 22 July 2016.
SUBSTANTIAL SHAREHOLDERSThe following shareholders have notified that they are substantial shareholders of Qantas:
ShareholdersOrdinary Shares
Held% of Issued
Shares
Westpac Banking Corporation Group1, 5 149,769,324 7.81
Commonwealth Bank of Australia2, 5 130,426,851 6.80
UBS AG and its related bodies corporate3 121,427,674 6.33
Franklin Resources, Inc.4 116,105,431 6.05
1 Substantial shareholder notice dated 5 July 2016.2 Substantial shareholder notice dated 29 June 2016.3 Substantial shareholder notice dated 12 July 2016.4 Substantial shareholder notice dated 28 June 2016.5 Percentages adjusted for buy-back shares cancelled.
103
Q A N T A S A N N U A L R E P O R T 2 0 1 6
Financial Calendar and Additional Information
2016 2017
23 February Half year results announcement 23 February Half year results announcement
30 June Year end 8 March Record date for interim dividend*
24 August Preliminary final results announcement 10 April Interim dividend payable*
8 September Record date for final dividend 30 June Year end
12 October Final dividend payable 25 August Preliminary final results announcement
21 October Annual General Meeting 11 September Record date for final dividend*
13 October Final dividend payable*
27 October Annual General Meeting
* Subject to a dividend being declared by the Board.
2016 ANNUAL GENERAL MEETINGThe 2016 AGM of Qantas Airways Limited will be held at 11:00am on Friday 21 October 2016 in Sydney.
Further details are available in the Investors section on the Qantas website (http://investor.qantas.com/home/)
COMPANY PUBLICATIONSIn addition to the Annual Report the following publications can be accessed from http://investor.qantas.com/home/:
– Annual Review – Databook – Traffic and Sustainability Statistics – Corporate Governance Statement – Workplace Gender Equality Report
REGISTERED OFFICEQantas Airways Limited ABN 16 009 661 901 10 Bourke Road, Mascot NSW 2020 Australia
Telephone +61 2 9691 3636 Facsimile +61 2 9490 1888
www.qantas.com
QANTAS SHARE REGISTRYLink Market Services Limited Level 12, 680 George Street, Sydney NSW 2000 Australia; or Locked Bag A14, Sydney South NSW 1235 Australia
Telephone 1800 177 747 (toll free within Australia) International +61 2 8280 7390 Facsimile +61 2 9287 0303 Email [email protected]
STOCK EXCHANGEAustralian Securities Exchange Exchange Centre, 20 Bridge Street, Sydney NSW 2000 Australia
ADDITIONAL SHAREHOLDER INFORMATIONUsing your Shareholder Reference Number (SRN) or Holder Identification Number (HIN) and postcode of your registered address you are able to view your holding online through Qantas’ share registry, Link Market Services. Log on at www.linkmarketservices.com.au, where you will have the option to:
– View your holding balance – Retrieve holding statements – Review your dividend payment history – Access shareholder forms
The Investor Centre also allows you to update or add details to your shareholding, including the following:
– Change or amend your address if you are registered with an SRN
– Nominate or amend your direct credit payment instructions – Set up or amend your DRP instructions – Sign up for electronic communications – Add/change TFN/ABN details
Company Secretaries
Andrew Finch
Anna Pritchard
John Morris
An electronic copy of this Annual Report is available at http://investor.qantas.com/home/
104
Q A N T A S A N N U A L R E P O R T 2 0 1 6

WSJC
VVTSVTBB
WBKK
WABB
ZISA
VYTFVVVV
500
500
500
450
H540
500
500
500
500
450
H540