Embed Size (px)
Citation preview

Q 4 2 0 2 0
SHAREHOLDER LET TER
P E L O T O N Q 4 : 2 0 2 0 | 2
P E L O T O N I N T E R A C T I V E , I N C .
FOURTH QUARTER & F Y 2020 HIGHLIGHTSAll financial comparisons are on a year-over-year basis unless otherwise noted.
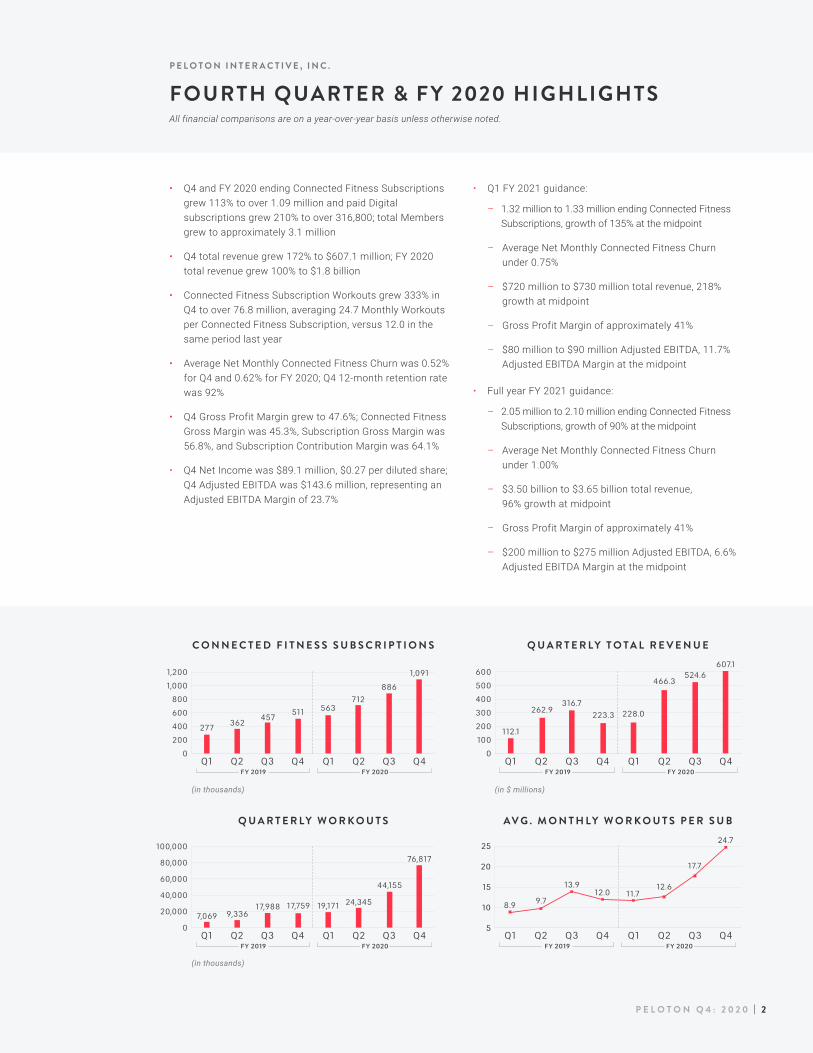
• Q4 and FY 2020 ending Connected Fitness Subscriptions grew 113% to over 1.09 million and paid Digital subscriptions grew 210% to over 316,800; total Members grew to approximately 3.1 million
• Q4 total revenue grew 172% to $607.1 million; FY 2020 total revenue grew 100% to $1.8 billion
• Connected Fitness Subscription Workouts grew 333% in Q4 to over 76.8 million, averaging 24.7 Monthly Workouts per Connected Fitness Subscription, versus 12.0 in the same period last year
• Average Net Monthly Connected Fitness Churn was 0.52% for Q4 and 0.62% for FY 2020; Q4 12-month retention rate was 92%
• Q4 Gross Profit Margin grew to 47.6%; Connected Fitness Gross Margin was 45.3%, Subscription Gross Margin was 56.8%, and Subscription Contribution Margin was 64.1%
• Q4 Net Income was $89.1 million, $0.27 per diluted share; Q4 Adjusted EBITDA was $143.6 million, representing an Adjusted EBITDA Margin of 23.7%
• Q1 FY 2021 guidance:
– 1.32 million to 1.33 million ending Connected Fitness Subscriptions, growth of 135% at the midpoint
– Average Net Monthly Connected Fitness Churn under 0.75%
– $720 million to $730 million total revenue, 218% growth at midpoint
– Gross Profit Margin of approximately 41%
– $80 million to $90 million Adjusted EBITDA, 11.7% Adjusted EBITDA Margin at the midpoint
• Full year FY 2021 guidance:
– 2.05 million to 2.10 million ending Connected Fitness Subscriptions, growth of 90% at the midpoint
– Average Net Monthly Connected Fitness Churn under 1.00%
– $3.50 billion to $3.65 billion total revenue, 96% growth at midpoint
– Gross Profit Margin of approximately 41%
– $200 million to $275 million Adjusted EBITDA, 6.6% Adjusted EBITDA Margin at the midpoint
C O N N E C T E D F I T N E S S S U B S C R I P T I O N S
0
200
400
600
800
1,000
1,200
Q4Q3Q2Q1Q4Q3Q2Q1
277362
457511 563
712
886
1,091
FY 2019 FY 2020
(in $ millions)(in thousands)
(in thousands)
0
100
200
300
400
500
600
Q4Q3Q2Q1Q4Q3Q2Q1
112.1
262.9316.7
223.3 228.0
466.3524.6
607.1
FY 2019 FY 2020
Q U A R T E R L Y T O T A L R E V E N U E
Q U A R T E R L Y W O R K O U T S
0
20,000
40,000
60,000
80,000
100,000
Q4Q3Q2Q1Q4Q3Q2Q1
7,069 9,33617,988 17,759 19,171 24,345
44,155
76,817
FY 2019 FY 2020
5
10
15
20
25
Q4Q3Q2Q1Q4Q3Q2Q1
8.9 9.7
13.912.0 11.7
12.6
24.7
17.7
FY 2019 FY 2020
A V G . M O N T H L Y W O R K O U T S P E R S U B
P E L O T O N Q 4 : 2 0 2 0 | 3
Peloton Shareholders,
As our global communities continue to battle the COVID-19 pandemic, we remain incredibly
appreciative of the tireless efforts of all first responders, local health officials, and essential workers
focused on the safe re-opening of our economy. We’re proud to play an important part in our
Members’ lives during this time by providing a platform where our Members can maintain their
physical and mental well-being, while we continue to expand the breadth of our content offering
and broaden access to the Peloton platform.
FY 2020 was a transformative year for Peloton. We made great progress in scaling our business,
from manufacturing and logistics, to member support and field operations. We launched operations
in Germany, our first foreign language market, and continued to grow our footprint in the United
States, Canada, and the United Kingdom. By the end of FY 2020 our Peloton membership base
grew to approximately 3.1 million, compared to 1.4 million Members in the prior year. Fueled in part
by the challenges associated with COVID-19, Member engagement reached new highs with 164
million Connected Fitness Subscription workouts completed in FY 2020.

P E L O T O N Q 4 : 2 0 2 0 | 4
In FY 2020, we expanded our fitness and wellness content offerings in strength, yoga, meditation,
and new floor-based categories such as Fit Family and Dance Cardio. Our Member engagement
levels continued to increase in FY 2020 in part due to our Members’ use of floor-based content, led
by Strength classes which posted the most significant year-over-year gains.
In addition to broadening our content, we also improved the accessibility of our platform through
our Digital offering. Paid Peloton Digital subscriptions grew 210% year-over-year as we reduced the
price of Peloton Digital to $12.99 and extended our Digital free trial period to 90 days during March
and April to give access to high-quality fitness content to those sheltering in place. With the goal
of being on every screen in your hand and in your home, we launched integrations with the four
leading over-the-top TV platforms including Amazon Fire TV, Android, Apple TV, and Roku.

P E L O T O N Q 4 : 2 0 2 0 | 5
O P E R AT I O N S
S H O W R O O M S
On June 15, 2020, we began re-opening select showrooms in the United States, United Kingdom, and Canada, following the re-opening of our German stores in late May. Our re-opening schedule has been guided by state, local, and municipal guidelines and is accompanied by extensive safety training for our retail team members and stringent cleaning practices. To date, nearly all 103 showroom locations have resumed normal operations or are taking customer appointments.
S I G N I F I C A N T C O N S T R U C T I O N P R O J E C T S
Following COVID-19 related delays, we have resumed construction of our new headquarters in New York City and our 11 Floral Street Studio in London. Both are expected to be completed in Spring 2021. Our Floral Street Studio will have three production studios, allowing us to significantly increase production of floor content as well as foreign language classes for our growing community of Members in Europe. Lastly, we expect our new manufacturing plant located in Shin Ji, Taiwan to be completed by the end of this calendar year. The additional factory at Tonic will provide us with significant additional production capacity, helping us scale over the next few years.
Showroom in Berlin, Germany
P E L O T O N Q 4 : 2 0 2 0 | 6
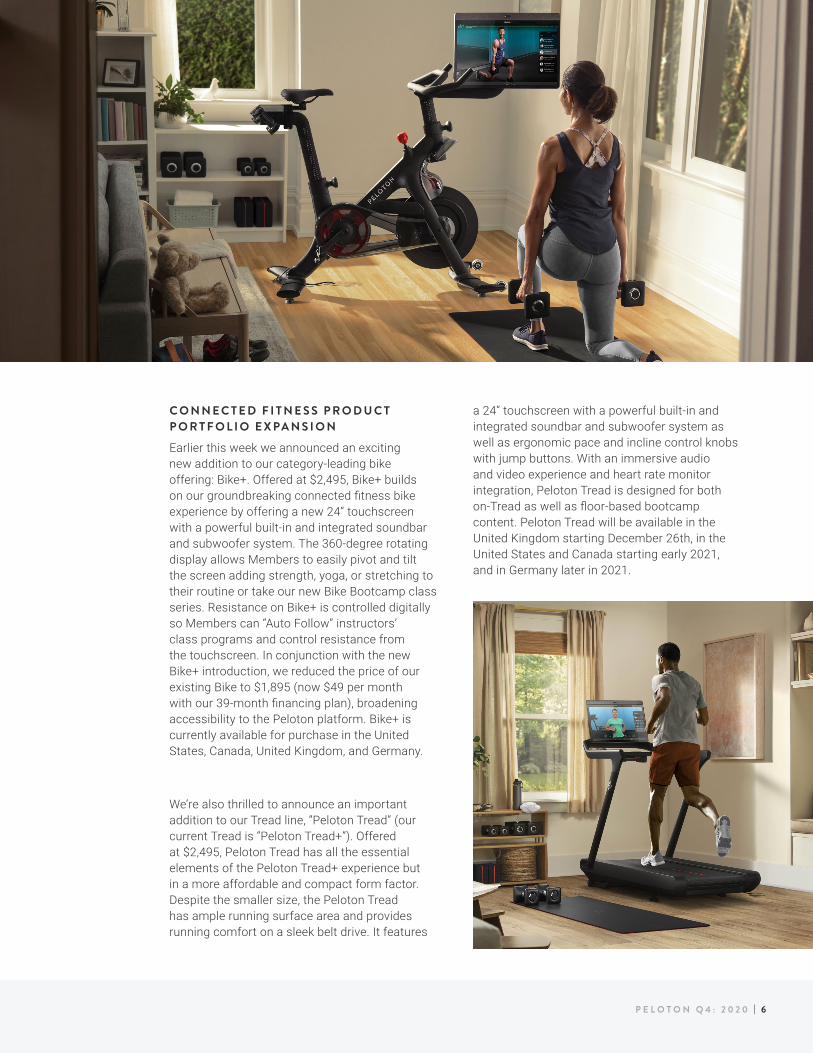
a 24” touchscreen with a powerful built-in and integrated soundbar and subwoofer system as well as ergonomic pace and incline control knobs with jump buttons. With an immersive audio and video experience and heart rate monitor integration, Peloton Tread is designed for both on-Tread as well as floor-based bootcamp content. Peloton Tread will be available in the United Kingdom starting December 26th, in the United States and Canada starting early 2021, and in Germany later in 2021.
C O N N E C T E D F I T N E S S P R O D U C T P O R T F O L I O E X PA N S I O N
Earlier this week we announced an exciting new addition to our category-leading bike offering: Bike+. Offered at $2,495, Bike+ builds on our groundbreaking connected fitness bike experience by offering a new 24” touchscreen with a powerful built-in and integrated soundbar and subwoofer system. The 360-degree rotating display allows Members to easily pivot and tilt the screen adding strength, yoga, or stretching to their routine or take our new Bike Bootcamp class series. Resistance on Bike+ is controlled digitally so Members can “Auto Follow” instructors’ class programs and control resistance from the touchscreen. In conjunction with the new Bike+ introduction, we reduced the price of our existing Bike to $1,895 (now $49 per month with our 39-month financing plan), broadening accessibility to the Peloton platform. Bike+ is currently available for purchase in the United States, Canada, United Kingdom, and Germany.
We’re also thrilled to announce an important addition to our Tread line, “Peloton Tread” (our current Tread is “Peloton Tread+”). Offered at $2,495, Peloton Tread has all the essential elements of the Peloton Tread+ experience but in a more affordable and compact form factor. Despite the smaller size, the Peloton Tread has ample running surface area and provides running comfort on a sleek belt drive. It features
P E L O T O N Q 4 : 2 0 2 0 | 7
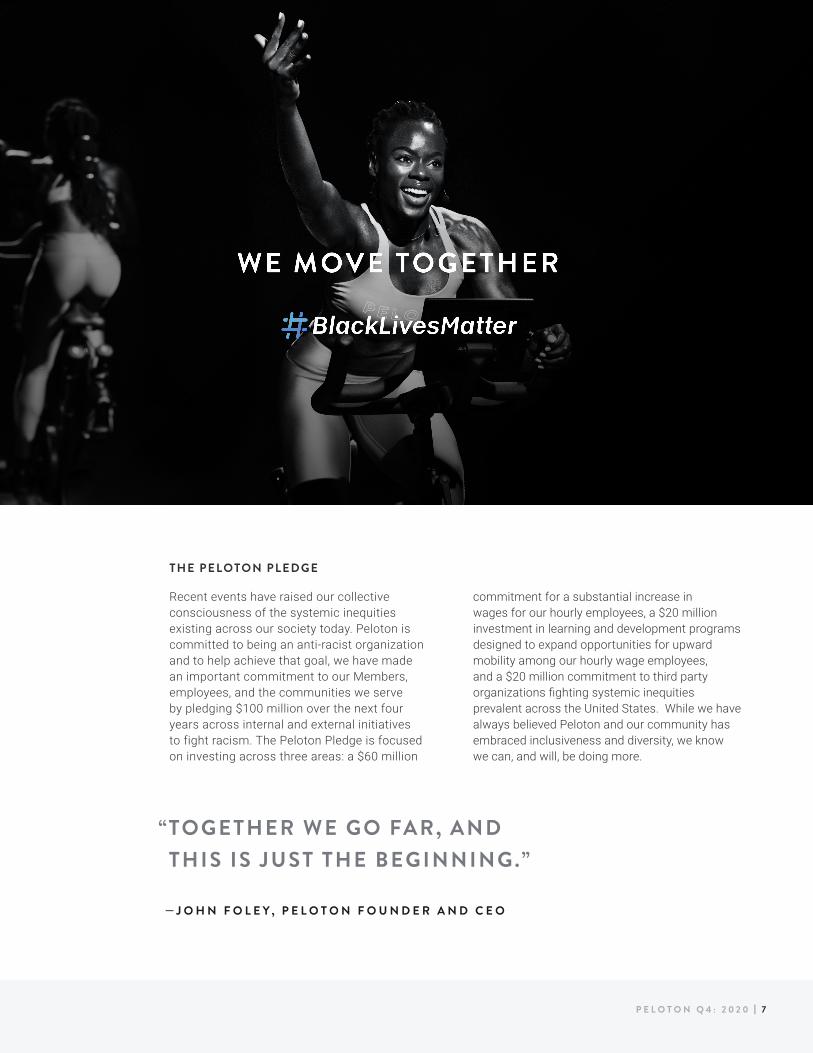
THE PELOTON PLEDGE
Recent events have raised our collective consciousness of the systemic inequities existing across our society today. Peloton is committed to being an anti-racist organization and to help achieve that goal, we have made an important commitment to our Members, employees, and the communities we serve by pledging $100 million over the next four years across internal and external initiatives to fight racism. The Peloton Pledge is focused on investing across three areas: a $60 million
commitment for a substantial increase in wages for our hourly employees, a $20 million investment in learning and development programs designed to expand opportunities for upward mobility among our hourly wage employees, and a $20 million commitment to third party organizations fighting systemic inequities prevalent across the United States. While we have always believed Peloton and our community has embraced inclusiveness and diversity, we know we can, and will, be doing more.
“ TOGETHER WE GO FAR, AND THIS IS JUST THE BEGINNING.”
— J O H N F O L E Y , P E L O T O N F O U N D E R A N D C E O
P E L O T O N Q 4 : 2 0 2 0 | 8
F I T N E S S P R O G R A M M I N G
On May 26th, we welcomed our instructors back to our new Peloton New York Studio (PSNY) to resume filming. Though classes remain closed to the public, the re-opening of our studios will allow us to increase the production of new classes to pre-COVID-19 levels over time.
During the height of the pandemic in New York City, we began “Live from Home” class production from our instructors’ homes. Over 9.8 million Live from Home workouts have been taken, with one highlight being Alex Toussaint’s support of ESPN’s The Last Dance tribute to Michael Jordan, which has logged 215,000 workouts. Other highlights from the quarter include the launch of our “No Equipment Needed” collection of Strength workouts, and our ESPN All-Star Partnership in July where 16 elite professional male and female athletes participated in a live broadcast cycling competition on the Peloton Bike.
Our new workouts for families, Fit Family, provided welcome relief to those Members sheltering in place, with over 300,000 workouts completed between our April 3rd launch and the end of the quarter. Our new Dance Cardio classes were also an instant hit, with Member workouts in the quarter surpassing 500,000. Offering themed music experiences remains a key Member request, and in the quarter we delivered eight new Artist Series, including Dolly Parton, BTS, Ricky Martin, and King Princess.
During the quarter we also announced the addition of two world class fitness instructors, Chelsea Jackson Roberts and Adrian Williams. Chelsea adds additional depth to our growing team of Yoga and Meditation instructors, while Adrian is motivating Members through highly engaging Running, Strength, and Bootcamp classes.
ESPN All-Star Ride graphic
A D R I A N W I L L I A M S
C H E L S E A J A C K S O N R O B E R T S
T A G S
We are continually inspired by our incredible Member community, and look for ways to bring our Members closer together through interactive social software features, such as “Tags”. Launched in April, Tags is a simple yet highly flexible way for Members to express themselves, connect with others, and workout together. Members create Tags to represent their shared interests like their favorite sports team, college, charity, employer, and more. With Tags, our Members have a new way to build, inspire, and interact with their community while enhancing the discovery and workout experience. To date, over 100,000 unique Tags have been created by over 795,000 participating Members.

P E L O T O N Q 4 : 2 0 2 0 | 9
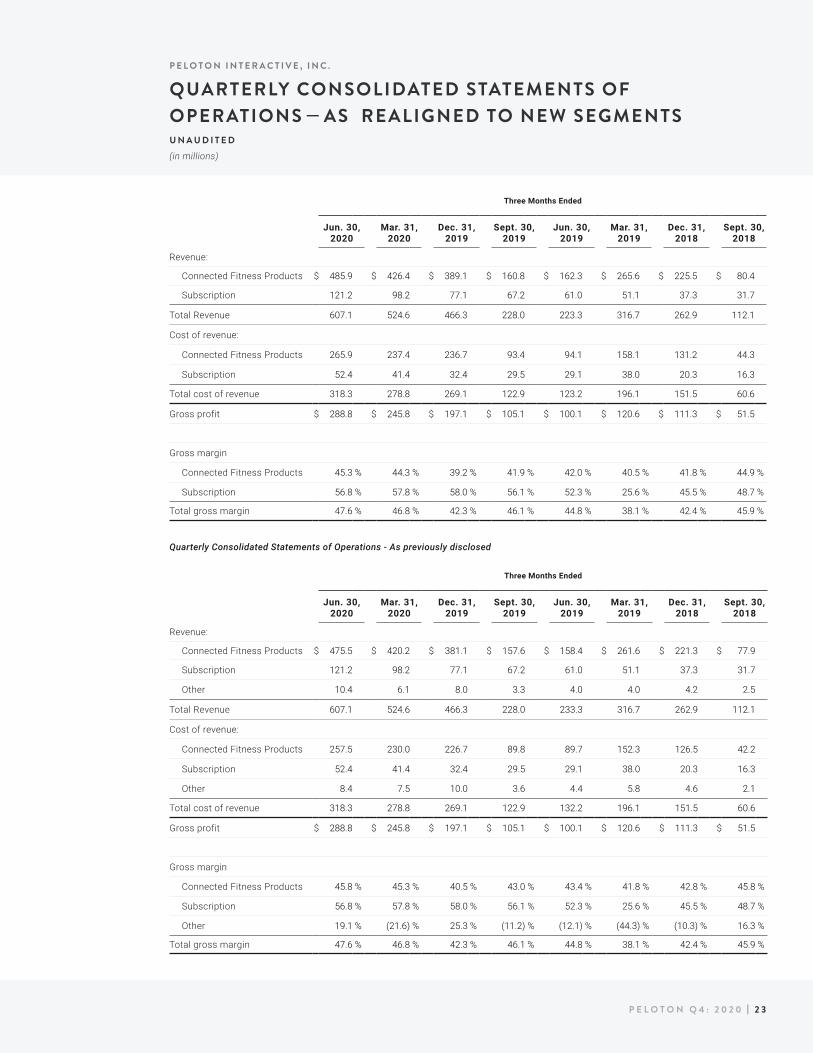
Beginning this quarter we have folded “Other” segment (which primarily consists of apparel) into the “Connected Fitness Product” segment. This realignment reflects how we manage our business. A table detailing how this change impacts prior reported quarters is provided in the Appendix of this letter. All periods presented as well as comparisons to prior periods reflect the change to our segment presentation.
In Q4 we saw strong sustained momentum in Connected Fitness subscriber and revenue growth due to COVID-19 while we continued to pause the majority of our media spend and kept most showrooms closed.
R E V E N U E
We generated total revenue of $607.1 million in Q4, representing 172% year-over-year growth. Connected Fitness segment revenue was $485.9 million in Q4, representing 199% year-over-year growth and 80% of total revenue. Growth of our Connected Fitness segment reflects both a significant carryover of undelivered Bikes from Q3 as well as continued strong organic demand due to the ongoing COVID-19 pandemic. Apparel sales growth also accelerated in the quarter, reflecting improved sell-through rates and our Memorial Day and Homecoming sales events in May.
Subscription revenue grew to $121.2 million in Q4, representing 99% year-over-year growth and 20% of total revenue, driven by strong Connected Fitness Product sales and continued low Average Net Monthly Connected Fitness Churn of 0.52%. Our Connected Fitness Subscription base reached 1.09 million at the end of Q4, representing year-over-year growth of 113%. Our low churn was the result of continued high engagement with our platform and elevated subscription reactivations. As of June 30, 95% of our Connected Fitness Subscription base were on month-to-month plans.
Member engagement grew in Q4 with 24.7 Average Monthly Workouts per Connected Fitness Subscription versus 12.0 Workouts in the same period last year. Members with a Connected Fitness Subscription worked out with us 76.8 million times, up from 17.8 million Workouts in the same period last year, representing 333% year-over-year growth. In addition, we ended the quarter with over 316,800 paying Digital subscriptions, up 210% year-over-year.
P E L O T O N I N T E R A C T I V E , I N C .
FINANCIAL DISCUSSION
R E V E N U E
$607.1 million
172% Y/Y
E N D I N G C O N N E C T E D F I T N E S S S U B S C R I P T I O N S
1.09 million
113% Y/Y
AV G . N E T M O N T H LY C O N N E C T E D F I T N E S S C H U R N
0.52%
P E L O T O N Q 4 : 2 0 2 0 | 1 0
G R O S S P R O F I T
Gross profit in Q4 was $288.8 million representing 188% year-over-year growth and a 47.6% gross margin, an improvement of 275 basis points versus the prior year period.
Connected Fitness segment gross profit was $220.0 million in Q4, representing 223% year-over-year growth. Our Connected Fitness segment gross margin was 45.3%, a 327 basis point increase versus last year. Compared to the year-ago period, our Connected Fitness gross profit margin benefited from a mix-shift to Bike deliveries and product cost efficiencies, partially offset by expense growth in supply chain and logistics, including expedited shipping and COVID-19-related costs.
Subscription gross profit was $68.8 million in Q4, representing 116% year-over-year growth. Subscription gross margin was 56.8%, up from 52.3% in the year-ago period. Subscription Contribution was $77.7 million in Q4, representing 112% year-over-year growth. Subscription Contribution Margin was 64.1%, versus the prior year period of 60.0%. Year-on-year margin improvement was driven primarily by leverage against fixed content production expenses.
For a reconciliation of non-GAAP financial measures to their corresponding GAAP measures, please refer to the reconciliation tables in the section below titled “Key Operating Metrics and Non-GAAP Financial Measures--Non-GAAP Financial Measures.”
G R O S S P R O F I T
$288.8 million
47.6% gross margin
C O N N E C T E D F I T N E S S G R O S S P R O F I T
$220.0 million
45.3% gross margin
S U B S C R I P T I O N G R O S S P R O F I T
$68.8 million
56.8% gross margin
S U B S C R I P T I O N C O N T R I B U T I O N
$77.7 million
64.1% contribution margin
P E L O T O N I N T E R A C T I V E , I N C .
FINANCIAL DISCUSSION

P E L O T O N Q 4 : 2 0 2 0 | 1 1
O P E R A T I N G E X P E N S E S
Total operating expense was $198.8 million in Q4, and grew 33% year-over-year, representing 33% of total revenue versus the prior year period of 67%.
Sales and marketing expense was $84.2 million in Q4, and grew 8% year-over-year, representing 14% of total revenue versus the prior year period of 35%. Given the robust organic demand due to COVID-19 and strong brand awareness, we continued to pause the majority of our media spend through the end of the quarter. At the close of Q4, our global showroom count was 95, up from 74 in the year prior.
General and administrative expense was $86.2 million in Q4, and grew 58% year-over-year, representing 14% of total revenue versus the prior year period of 24%. Year-over-year growth was driven by continued investment in our teams and systems, public company costs, legal expenses, and lease expense related to our new headquarters in New York City.
Research and development expense was $28.4 million in Q4, and grew 67% year-over-year, representing 5% of total revenue, versus the prior year period of 8%. This expense growth reflects continued investments in new Connected Fitness Product development and software features.
P E L O T O N I N T E R A C T I V E , I N C .
FINANCIAL DISCUSSION
T O T A L O P E R A T I N G E X P E N S E S
$198.8 million
33% of revenue
S A L E S A N D M A R K E T I N G
$84.2 million
14% of revenue
G E N E R A L A N D A D M I N I S T R A T I V E
$86.2 million
14% of revenue
R E S E A R C H A N D D E V E L O P M E N T
$28.4 million
5% of revenue

P E L O T O N Q 4 : 2 0 2 0 | 1 2
P R O F I T A B I L I T Y
Net income for Q4 was $89.1 million versus a net loss of $(47.4) million in the same period last year. Q4 Adjusted EBITDA was $143.6 million, representing an Adjusted EBITDA Margin of 23.7%, compared to (10.6)% in the same period last year. Basic and diluted earnings per share in Q4 were $0.31 and $0.27, respectively.
B A L A N C E S H E E T
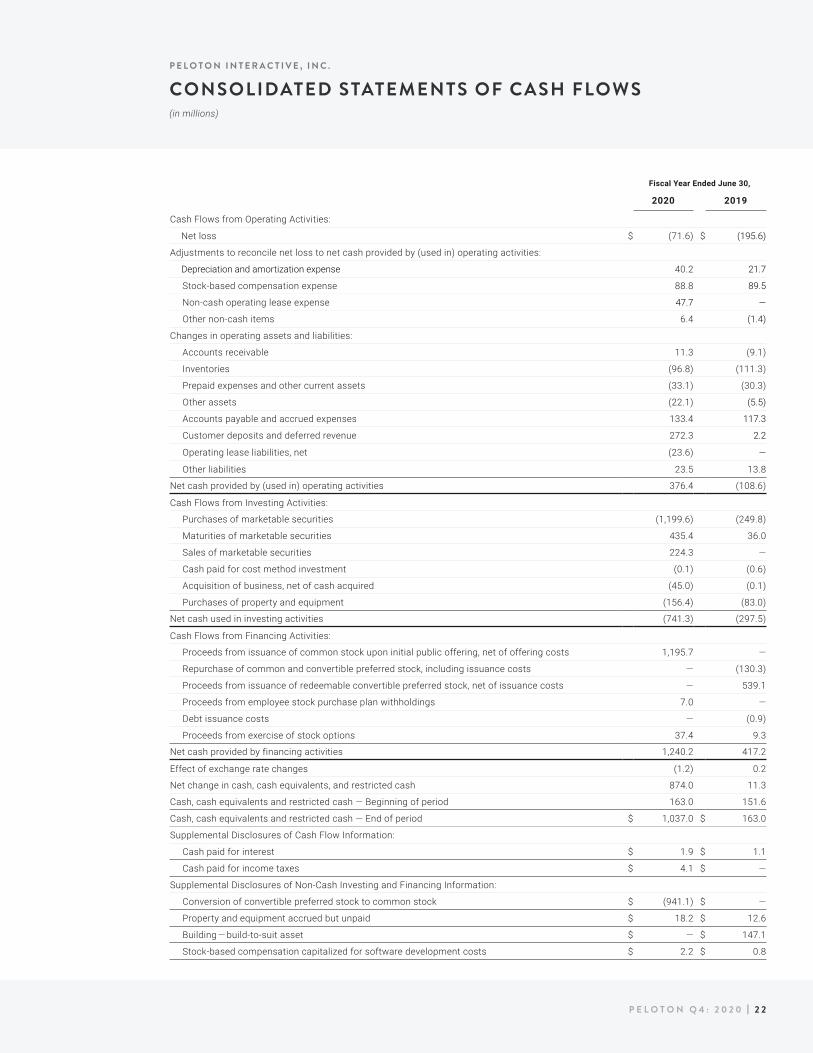
We ended Q4 with $1.8 billion in cash, cash equivalents, and marketable securities. We also have additional liquidity of $250.0 million in the form of a revolving credit facility, which remains undrawn to-date.
For fiscal year 2020, operating cash flow was $376.4 million. Capital expenditures were $156.4 million, the majority of which was related to the build out of our New York City headquarters, our new Peloton Studios in New York City and London, our new manufacturing facility in Taiwan, and new showrooms.
P E L O T O N I N T E R A C T I V E , I N C .
FINANCIAL DISCUSSION
N E T I N C O M E
$89.1 million
A D J U S T E D E B I T D A
$143.6 million
23.7% margin
C A S H A N D M A R K E T A B L E S E C U R I T I E S
$1.8 billion
P E L O T O N Q 4 : 2 0 2 0 | 1 3
P E L O T O N I N T E R A C T I V E , I N C .
Q1 AND FULL FISCAL YEAR 2021 BUSINESS OUTLOOK
F Y 2 0 2 1 Q 1 G U I D A N C E
• 1.32 million to 1.33 million ending Connected Fitness Subscriptions, growth of 135% at the midpoint
• Average Net Monthly Connected Fitness Churn under 0.75%
• $720 million to $730 million total revenue, 218% growth at midpoint
• Gross Profit Margin of approximately 41%
• $80 million to $90 million Adjusted EBITDA, 11.7% Adjusted EBITDA Margin at the midpoint
F U L L F I S C A L Y E A R 2 0 2 1 G U I D A N C E
• 2.05 million to 2.10 million ending Connected Fitness Subscriptions, growth of 90% at the midpoint
• Average Net Monthly Connected Fitness Churn under 1.00%
• $3.50 billion to $3.65 billion total revenue, 96% growth at midpoint
• Gross Profit Margin of approximately 41%
• $200 million to $275 million Adjusted EBITDA, 6.6% Adjusted EBITDA Margin at the midpoint
We entered Q1 FY 2021 with a backlog of $230 million Bike deliveries in all geographies and sales continue to surpass expectations in the first two months of the quarter. While we had expected demand to moderate, the unexpected resurgence of COVID-19 cases in many states has perpetuated the imbalance of supply and demand in many geographies, causing continued elongated order-to-delivery windows for our customers. While we have significantly increased our production capacity in recent months and continue to grow our manufacturing capabilities, we do not expect to return to normalized order-to-delivery windows in the United States prior to the end of Q2 FY 2021.
In Q1 FY 2021 and full year FY 2021, we expect a gross profit margin of approximately 41%, though we could see some fluctuation quarter to quarter based on product mix and other factors. We expect Connected Fitness Product gross margin to decline year-over-year driven by the price reduction of our existing Bike, the mix shift to Peloton Tread+ which carries a lower gross profit margin, and further investments to scale our supply chain and logistics operations.
We expect Subscription Contribution Margin in Q1 FY 2021 and full year FY 2021 to be flat year-over-year. With the massive opportunity in front of us, we will continue to
invest in improving the variety, depth, and quality of our fitness and wellness programming. While we expect some leveraging of the fixed costs of content production, these efficiencies will be largely offset by increases in variable costs associated with continued high engagement of our Members, a mix shift to Digital subscriptions, and content investments including new fitness verticals and increasing our library of international and foreign language classes. Our long term target of achieving a 70%+ Subscription Contribution Margin remains intact.
With strong sales flow-through, leveraging of fixed costs, and reductions to media spend, we expect Q1 FY 2021 Adjusted EBITDA of $80 million to $90 million, representing an Adjusted EBITDA Margin of 11.7% at the midpoint of the range. For FY 2021, we expect Adjusted EBITDA of $200 million to $275 million, representing an Adjusted EBITDA Margin of 6.6% at the midpoint of the range.
A reconciliation of non-GAAP guidance measures to corresponding GAAP measures is not available on a forward-looking basis without unreasonable effort due to the uncertainty regarding, and the potential variability of, many of the costs and expenses that may be incurred in the future. We have provided a reconciliation of GAAP to non-GAAP financial measures for the fourth quarter and for the full year in the reconciliation tables at the end of this letter.
P E L O T O N Q 4 : 2 0 2 0 | 1 4
differ materially due to a variety of factors, including: our ability to attract and retain Connected Fitness and Digital Subscription base; our limited operating history; our ability to anticipate and satisfy consumer preferences; the effects of the highly competitive market in which we operate; market acceptance of our Connected Fitness Products, including our newly introduced products, Bike+ and Peloton Tread; our ability to successfully develop and timely introduce new products and services; our ability to accurately forecast consumer demand and adequately manage our inventory; our ability to maintain the value and reputation of the Peloton brand; a decrease in sales of our Bike; the continued growth of the connected fitness market; the loss of any one of our third-party suppliers, manufacturers, or logistics partners; our ability to achieve the objectives of strategic and operational initiatives; litigation and related costs; the impact of privacy and data security laws; and other general market, political, economic, and business conditions.
Additional risks and uncertainties that could affect our financial results and business are or will be included under the caption “Risk Factors” in our Annual Report on Form-K for the fiscal year ended June 30, 2020, our most recent Quarterly Report on Form 10-Q, and our other SEC filings, which are available on the Investor Relations page of our website at https://investor.onepeloton.com/investor-relations and on the SEC website at www.sec.gov.
All forward-looking statements contained herein are based on information available to us as of the date hereof and you should not rely upon forward-looking statements as predictions of future events. The events and circumstances reflected in the forward-looking statements may not be achieved or occur. Although we believe that the expectations reflected in the forward-looking statements are reasonable, we cannot guarantee future results, performance, or achievements. We undertake no obligation to update any of these forward-looking statements for any reason after the date of this shareholder letter or to conform these statements to actual results or revised expectations, except as required by law. Undue reliance should not be placed on forward-looking statements.
P E L O T O N I N T E R A C T I V E , I N C .
Q1 AND FULL FISCAL YEAR 2021 BUSINESS OUTLOOK
WEBCAST
We will host a Q&A session at 5:00pm ET on Thursday, September 10, 2020 to discuss our financial results. To participate in the live call, please dial 1 (877) 667-0469 (US / Canada) or 1 (346) 406-0807 (international) and provide conference ID 7223628. A live webcast of the call will be available at https://investor.onepeloton.com/investor-relations/ and will be archived on our site following the call.
As our communities continue to struggle with the global pandemic and resulting macroeconomic issues, we are proud to provide a platform where our Members can maintain their physical and mental well-being. We want to thank our entire Peloton Family for all their hard work, especially our delivery, warehouse, sales, and Member experience teams who continue to work tirelessly in service to our Members. We are grateful for our amazing Peloton community as a constant source of inspiration for our teams as we continue to build the world’s best connected fitness experience.
Together we go far,Team Peloton
SAFE HARBOR STATEMENT
This shareholder letter includes forward-looking statements, which are statements other than statements of historical facts and statements in the future tense. These statements include, but are not limited to, statements regarding our future performance and our market opportunity, including expected financial results for the first quarter of fiscal year 2021 and full fiscal year 2021, the potential impact of COVID-19 on the fitness and wellness industry in general as well as our business, our business strategy and plans, our expectations regarding timing for completion of our new headquarters, the opening of our Floral Street Studio, and our new Tonic manufacturing plant, and our objectives and future operations. Forward-looking statements are based upon various estimates and assumptions, as well as information known to us as of the date hereof, and are subject to risks and uncertainties. Accordingly, actual results could
P E L O T O N Q 4 : 2 0 2 0 | 1 5
C O N N E C T E D F I T N E S S S U B S C R I P T I O N S
Our ability to expand the number of Connected Fitness Subscriptions is an indicator of our market penetration and growth. We define a Connected Fitness Subscription as a person, household, or commercial property, such as a hotel or residential building, who has either paid for a subscription to a Connected Fitness Product (a Connected Fitness Subscription with a successful credit card billing or with prepaid subscription credits or waivers) or requested a “pause” to their subscription for up to 3 months. We do not include canceled or unpaid Connected Fitness Subscriptions in the Connected Fitness Subscription count.
A V E R A G E N E T M O N T H L Y C O N N E C T E D F I T N E S S C H U R N
We use Average Net Monthly Connected Fitness Churn to measure the retention of our Connected Fitness Subscriptions. We define Average Net Monthly Connected Fitness Churn as Connected Fitness Subscription cancellations, net of reactivations, in the quarter, divided by the average number of beginning Connected Fitness Subscriptions in each month, divided by three months. This metric does not include data related to our Digital subscriptions for Members who pay a monthly fee for access to our content library on their own devices.
P E L O T O N I N T E R A C T I V E , I N C .
KEY OPERATING METRICS AND NON-GAAP FINANCIAL MEASURES
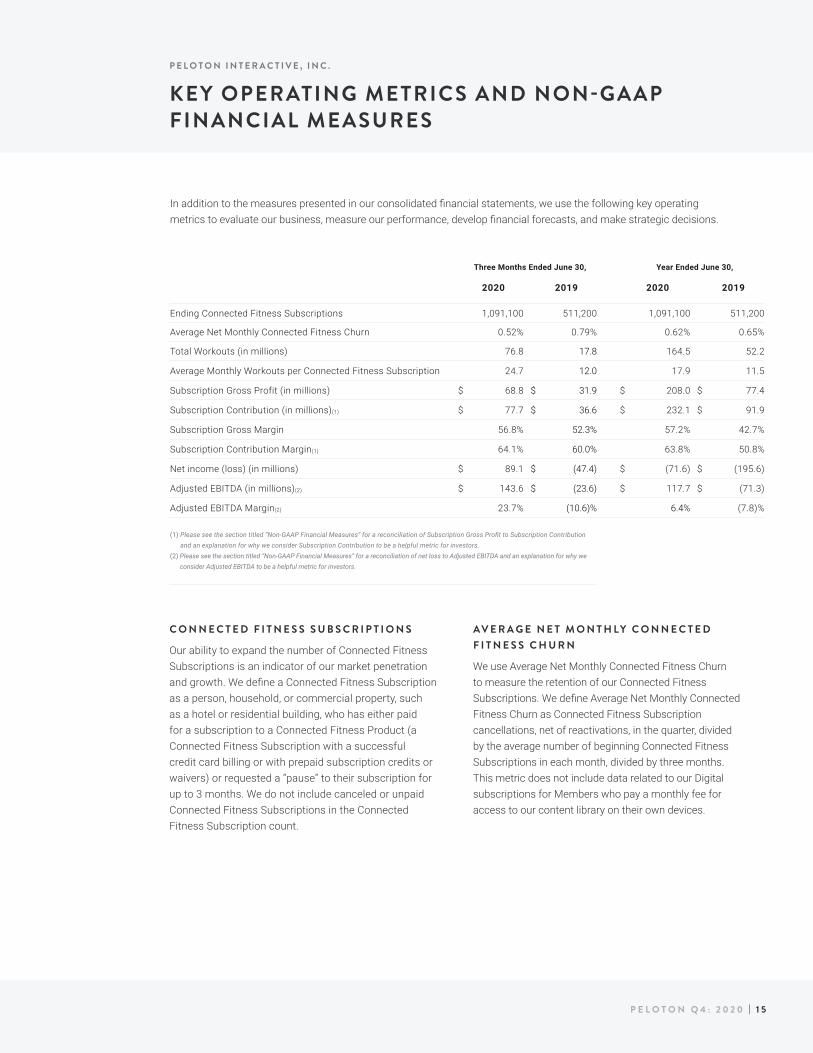
In addition to the measures presented in our consolidated financial statements, we use the following key operating metrics to evaluate our business, measure our performance, develop financial forecasts, and make strategic decisions.
Three Months Ended June 30, Year Ended June 30,
2020 2019 2020 2019
Ending Connected Fitness Subscriptions 1,091,100 511,200 1,091,100 511,200
Average Net Monthly Connected Fitness Churn 0.52% 0.79% 0.62% 0.65%
Total Workouts (in millions) 76.8 17.8 164.5 52.2
Average Monthly Workouts per Connected Fitness Subscription 24.7 12.0 17.9 11.5
Subscription Gross Profit (in millions) $ 68.8 $ 31.9 $ 208.0 $ 77.4
Subscription Contribution (in millions)(1) $ 77.7 $ 36.6 $ 232.1 $ 91.9
Subscription Gross Margin 56.8% 52.3% 57.2% 42.7%
Subscription Contribution Margin(1) 64.1% 60.0% 63.8% 50.8%
Net income (loss) (in millions) $ 89.1 $ (47.4) $ (71.6) $ (195.6)
Adjusted EBITDA (in millions)(2) $ 143.6 $ (23.6) $ 117.7 $ (71.3)
Adjusted EBITDA Margin(2) 23.7% (10.6)% 6.4% (7.8)%
(1) ��Please�see�the�section�titled�“Non-GAAP�Financial�Measures”�for�a�reconciliation�of�Subscription�Gross�Profit�to�Subscription�Contribution�and�an�explanation�for�why�we�consider�Subscription�Contribution�to�be�a�helpful�metric�for�investors.
(2) Please see the section titled “Non-GAAP Financial Measures” for a reconciliation of net loss to Adjusted EBITDA and an explanation for why we consider�Adjusted�EBITDA�to�be�a�helpful�metric�for�investors.
P E L O T O N Q 4 : 2 0 2 0 | 1 6
P E L O T O N I N T E R A C T I V E , I N C .
KEY OPERATING METRICS AND NON-GAAP FINANCIAL MEASURES
T O T A L W O R K O U T S A N D A V E R A G E M O N T H L Y W O R K O U T S P E R C O N N E C T E D F I T N E S S S U B S C R I P T I O N
We review Total Workouts and Average Monthly Workouts per Connected Fitness Subscription to measure engagement, which is the leading indicator of retention for our Connected Fitness Subscriptions. We define Total Workouts as all workouts completed during a given period. We define a Workout as a Connected Fitness Subscription for Members either completing at least 50% of an instructor-led or scenic ride or run or ten or more minutes of “Just Ride” or “Just Run” mode. We define Average Monthly Workouts per Connected Fitness Subscription as the Total Workouts completed in the quarter divided by the average number of Connected Fitness Subscriptions in each month, divided by three months.
N O N - G A A P F I N A N C I A L M E A S U R E S
In addition to our results determined in accordance with accounting principles generally accepted in the United States, or GAAP, we believe the following non-GAAP financial measures are useful in evaluating our operating performance.
These non-GAAP financial measures have limitations as analytical tools in that they do not reflect all of the amounts associated with our results of operations as determined in accordance with GAAP. Because of these limitations, Adjusted EBITDA, Adjusted EBITDA Margin, Subscription Contribution, and Subscription Contribution Margin should be considered along with other operating and financial performance measures presented in accordance with GAAP.
The presentation of these non-GAAP financial measures is not intended to be considered in isolation or as a substitute for, or superior to, financial information prepared and presented in accordance with GAAP. Investors are encouraged to review the reconciliation of these non-GAAP financial measures to their most directly comparable GAAP financial measures. A reconciliation of the non-GAAP financial measures to such GAAP measures can be found below.

P E L O T O N Q 4 : 2 0 2 0 | 1 7
Adjusted EBITDA and Adjusted EBITDA Margin are key performance measures that our management uses to assess our operating performance and the operating leverage in our business. Because Adjusted EBITDA and Adjusted EBITDA Margin facilitate internal comparisons of our historical operating performance on a more consistent basis, we use these measures for business planning purposes. We also believe this information will be useful for investors to facilitate comparisons of our operating performance and better identify trends in our business. We expect Adjusted EBITDA Margin to increase over the long-term as we continue to scale our business and achieve greater leverage in our operating expenses.
P E L O T O N I N T E R A C T I V E , I N C .
ADJUSTED EBITDA AND ADJUSTED EBITDA MARGIN
We calculate Adjusted EBITDA as net loss adjusted to exclude: other income, net; provision for income taxes; depreciation and amortization expense; stock-based compensation expense; transaction costs; certain litigation expenses, consisting of legal settlements and related fees for specific proceedings that arise outside of the ordinary course of our business; the ground lease expense related to build-to-suit lease obligations under ASC 840; and non-recurring incremental costs primarily consisting of hazard pay as a result of COVID-19. Adjusted EBITDA Margin is calculated by dividing Adjusted EBITDA by total revenue.
Three Months Ended June 30, Fiscal Year Ended June 30,(dollars in millions) (dollars in millions)
2020 2019 2020 2019
Net income (loss) (1) $ 89.1 $ (47.4) $ (71.6) $ (195.6)
Adjusted to exclude the following:
Other income, net (2.8) (1.8) (12.4) (6.7)
Income tax (benefit) expense 3.8 (0.1) 3.3 0.1
Depreciation and amortization expense 12.0 6.7 40.2 21.7
Stock-based compensation expense 32.5 13.5 88.8 89.5
Litigation and settlement expenses 1.1 2.3 60.1 12.1
Other adjustment items (2) 8.0 3.3 9.4 7.6
Adjusted EBITDA $ 143.6 $ (23.6) $ 117.7 $ (71.3)
Adjusted EBITDA margin 23.7% (10.6)% 6.4% (7.8)%
(1) Included in net loss are content costs for past use as follows:
Three Months Ended June 30, Fiscal Year Ended June 30,(dollars in millions) (dollars in millions)
2020 2019 2020 2019
Content costs for past use (1) $ 0.6 $ – $ 1.6 $ 16.4
(1)��From�time-to-time,�we�execute�music�royalty�agreements�with�various�music�rights�holders.�As�part�of�these�go-forward�license�agreements,�we�may�also�enter�into�agreements�whereby�we�are�released�from�all�potential�licensor�claims�regarding�our�alleged�past�use�of�copyrighted�material�in�our�content�in�exchange�for�a�mutually-agreed�payment.�We�refer�to�these�payments�as�content�costs�for�past�use.�Included�in�Adjusted�EBITDA�are�content�costs�for�past�use.�These�costs�had�a�negative�basis�point�impact�on�Adjusted�EBITDA�Margin�of�9�for�each�of�the�three�months�and�fiscal�year�ended�June�30,�2020,�and�zero�and�180�for�the�three�months�and�fiscal�year�ended�June�30,�2019,�respectively.
(2)��Includes�incremental�costs�associated�with�COVID-19�of�$8.5�million�for�the�fiscal�year�ended�June�30,�2020�and�the�ground�lease�expense�related�to�build-to-suit�lease�obligations�under�ASC�840�of��$7.2�million��for�the�fiscal�year�ended�June�30,�2019.

P E L O T O N Q 4 : 2 0 2 0 | 1 8
P E L O T O N I N T E R A C T I V E , I N C .
SUBSCRIPTION CONTRIBUTION AND SUBSCRIPTION CONTRIBUTION MARGIN
We use Subscription Contribution and Subscription Contribution Margin to measure our ability to scale and leverage the costs of our Connected Fitness Subscriptions. The continued growth of our Connected Fitness Subscription base will allow us to improve our Subscription Contribution Margin. While there are variable costs, including music royalties, associated with our Connected Fitness Subscriptions, a significant portion of our content creation costs are fixed given that we operate with a limited number of production studios and instructors. The fixed nature of those expenses should scale over time as we grow our Connected Fitness Subscription base.
We believe that these non-GAAP financial measures are useful to investors for period-to-period comparisons of our business and in understanding and evaluating our operating results because our management uses
Subscription Contribution and Subscription Contribution Margin in conjunction with financial measures prepared in accordance with GAAP for planning purposes, including the preparation of our annual operating budget, as a measure of our core operating results and the effectiveness of our business strategy, and in evaluating our financial performance.
We define Subscription Contribution as subscription revenue less cost of subscription revenue, adjusted to exclude from cost of subscription revenue, depreciation and amortization expense and stock-based compensation expense. Subscription Contribution Margin is calculated by dividing Subscription Contribution by subscription revenue.
The following table presents a reconciliation of Subscription Contribution to subscription gross profit, the most directly comparable financial measure prepared in accordance with GAAP, for each of the periods indicated:
Three Months Ended June 30, Fiscal Year Ended June 30,
(dollars in millions) (dollars in millions)
2020 2019 2020 2019
Subscription Revenue $ 121.2 $ 61.0 $ 363.7 $ 181.1
Less: Cost of Subscription (1) 52.4 29.1 155.7 103.7
Subscription Gross Profit $ 68.8 $ 31.9 $ 208.0 $ 77.4
Subscription Gross Margin 56.8% 52.3% 57.2% 42.7%
Add back:
Depreciation and amortization expense $ 4.9 $ 3.8 $ 16.6 $ 11.3
Stock-based compensation expense 3.9 0.8 7.5 3.2
Subscription Contribution $ 77.7 $ 36.6 $ 232.1 $ 91.9
Subscription Contribution Margin 64.1% 60.0% 63.8% 50.8%
(1) Included in cost of subscription are content costs for past use as follows:
Three Months Ended June 30, Fiscal Year Ended June 30,
(dollars in millions) (dollars in millions)
2020 2019 2020 2019
Content costs for past use (1) $ 0.6 $ – $ 1.6 $ 16.4
(1)��From�time-to-time,�we�execute�music�royalty�agreements�with�various�music�rights�holders.�As�part�of�these�go-forward�license�agreements,�we�may�also�enter�into�agreements�whereby�we�are�released�from�all�potential�licensor�claims�regarding�our�alleged�past�use�of�copyrighted�material�in�our�content�in�exchange�for�a�mutually-agreed�payment.�We�refer�to�these�payments�as�content�costs�for�past�use.�Included�in�Subscription�Contribution�and�Subscription�Contribution�Margin�are�content�costs�for�past�use.�These�costs�had�a�negative�basis�point�impact�on�Subscription�Contribution�Margin�of�47�and�44�for�the�three�months�and�fiscal�year�ended�June�30,�2020,�and�zero�and�908�for�the�three�months�and�fiscal�year�ended�June�30,�2019,�respectively.��
P E L O T O N Q 4 : 2 0 2 0 | 1 9
P E L O T O N I N T E R A C T I V E , I N C .
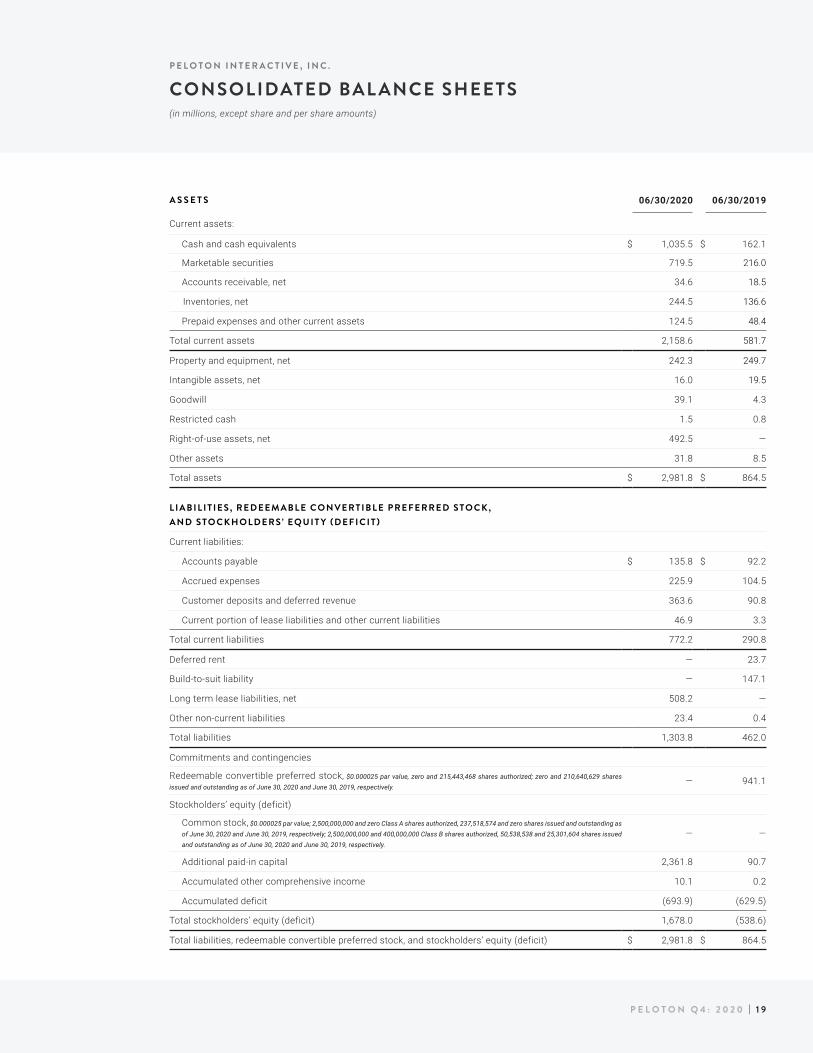
CONSOLIDATED BAL ANCE SHEETS(in millions, except share and per share amounts)
A S S E T S 06/30/2020 06/30/2019
Current assets:
Cash and cash equivalents $ 1,035.5 $ 162.1
Marketable securities 719.5 216.0
Accounts receivable, net 34.6 18.5
Inventories, net 244.5 136.6
Prepaid expenses and other current assets 124.5 48.4
Total current assets 2,158.6 581.7
Property and equipment, net 242.3 249.7
Intangible assets, net 16.0 19.5
Goodwill 39.1 4.3
Restricted cash 1.5 0.8
Right-of-use assets, net 492.5 —
Other assets 31.8 8.5
Total assets $ 2,981.8 $ 864.5
L I A B I L I T I E S , R E D E E M A B L E C O N V E R T I B L E P R E F E R R E D S T O C K , A N D S T O C K H O L D E R S ’ E Q U I T Y (D E F I C I T )
Current liabilities:
Accounts payable $ 135.8 $ 92.2
Accrued expenses 225.9 104.5
Customer deposits and deferred revenue 363.6 90.8
Current portion of lease liabilities and other current liabilities 46.9 3.3
Total current liabilities 772.2 290.8
Deferred rent — 23.7
Build-to-suit liability — 147.1
Long term lease liabilities, net 508.2 —
Other non-current liabilities 23.4 0.4
Total liabilities 1,303.8 462.0
Commitments and contingencies
Redeemable convertible preferred stock,�$0.000025�par�value,�zero�and�215,443,468�shares�authorized;�zero�and�210,640,629�shares�issued�and�outstanding�as�of�June�30,�2020�and�June�30,�2019,�respectively.
— 941.1
Stockholders’ equity (deficit)
Common stock,�$0.000025�par�value;�2,500,000,000�and�zero�Class�A�shares�authorized,�237,518,574�and�zero�shares�issued�and�outstanding�as�of�June�30,�2020�and�June�30,�2019,�respectively;�2,500,000,000�and�400,000,000�Class�B�shares�authorized,�50,538,538�and�25,301,604�shares�issued�and�outstanding�as�of�June�30,�2020�and�June�30,�2019,�respectively.
— —
Additional paid-in capital 2,361.8 90.7
Accumulated other comprehensive income 10.1 0.2
Accumulated deficit (693.9) (629.5)
Total stockholders’ equity (deficit) 1,678.0 (538.6)
Total liabilities, redeemable convertible preferred stock, and stockholders’ equity (deficit) $ 2,981.8 $ 864.5
P E L O T O N Q 4 : 2 0 2 0 | 2 0
P E L O T O N I N T E R A C T I V E , I N C .
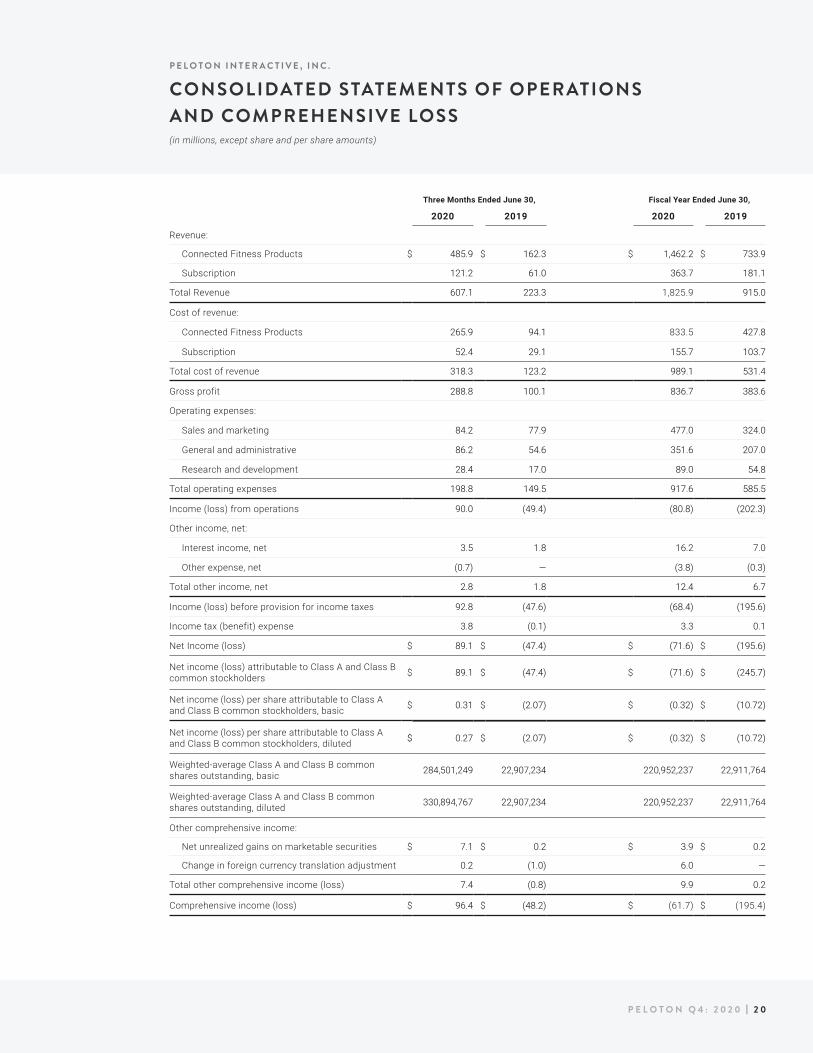
CONSOLIDATED STATEMENTS OF OPERATIONS AND COMPREHENSIVE LOSS(in millions, except share and per share amounts)
Three Months Ended June 30, Fiscal Year Ended June 30,
2020 2019 2020 2019
Revenue:
Connected Fitness Products $ 485.9 $ 162.3 $ 1,462.2 $ 733.9
Subscription 121.2 61.0 363.7 181.1
Total Revenue 607.1 223.3 1,825.9 915.0
Cost of revenue:
Connected Fitness Products 265.9 94.1 833.5 427.8
Subscription 52.4 29.1 155.7 103.7
Total cost of revenue 318.3 123.2 989.1 531.4
Gross profit 288.8 100.1 836.7 383.6
Operating expenses:
Sales and marketing 84.2 77.9 477.0 324.0
General and administrative 86.2 54.6 351.6 207.0
Research and development 28.4 17.0 89.0 54.8
Total operating expenses 198.8 149.5 917.6 585.5
Income (loss) from operations 90.0 (49.4) (80.8) (202.3)
Other income, net:
Interest income, net 3.5 1.8 16.2 7.0
Other expense, net (0.7) — (3.8) (0.3)
Total other income, net 2.8 1.8 12.4 6.7
Income (loss) before provision for income taxes 92.8 (47.6) (68.4) (195.6)
Income tax (benefit) expense 3.8 (0.1) 3.3 0.1
Net Income (loss) $ 89.1 $ (47.4) $ (71.6) $ (195.6)
Net income (loss) attributable to Class A and Class B common stockholders $ 89.1 $ (47.4) $ (71.6) $ (245.7)
Net income (loss) per share attributable to Class A and Class B common stockholders, basic $ 0.31 $ (2.07) $ (0.32) $ (10.72)
Net income (loss) per share attributable to Class A and Class B common stockholders, diluted $ 0.27 $ (2.07) $ (0.32) $ (10.72)
Weighted-average Class A and Class B common shares outstanding, basic 284,501,249 22,907,234 220,952,237 22,911,764
Weighted-average Class A and Class B common shares outstanding, diluted 330,894,767 22,907,234 220,952,237 22,911,764
Other comprehensive income:
Net unrealized gains on marketable securities $ 7.1 $ 0.2 $ 3.9 $ 0.2
Change in foreign currency translation adjustment 0.2 (1.0) 6.0 —
Total other comprehensive income (loss) 7.4 (0.8) 9.9 0.2
Comprehensive income (loss) $ 96.4 $ (48.2) $ (61.7) $ (195.4)

P E L O T O N Q 4 : 2 0 2 0 | 2 1
P E L O T O N I N T E R A C T I V E , I N C .
CONSOLIDATED STATEMENTS OF OPERATIONS AND COMPREHENSIVE LOSS (CONTINUED)
(in millions, except share and per share amounts)
Three Months Ended June 30, Fiscal Year Ended June 30,
2020 2019 2020 2019
Cost of revenue
Connected Fitness Products $ 1.9 $ 0.2 $ 3.2 $ 0.3
Subscription 3.9 0.8 7.5 3.2
Total cost of revenue 5.9 1.0 10.7 3.5
Sales and marketing 9.4 1.2 15.3 8.4
General and administrative 14.3 9.5 52.4 70.5
Research and development 3.0 1.7 10.4 7.1
Total stock-based compensation expense $ 32.5 $ 13.5 $ 88.8 $ 89.5
(1) Includes stock-based compensation expense as follows:
Three Months Ended June 30, Fiscal Year Ended June 30,
2020 2019 2020 2019
Cost of revenue
Connected Fitness Products $ 1.1 $ 0.4 $ 3.2 $ 1.2
Subscription 4.9 3.8 16.6 11.3
Total cost of revenue 6.0 4.3 19.9 12.6
Sales and marketing 2.8 1.3 9.3 4.0
General and administrative 3.1 1.1 10.6 5.2
Research and development 0.1 — 0.3 —
Total depreciation and amortization expense $ 12.0 $ 6.7 $ 40.2 $ 21.7
(2) Includes depreciation and amortization expense as follows:
P E L O T O N Q 4 : 2 0 2 0 | 2 2
P E L O T O N I N T E R A C T I V E , I N C .
CONSOLIDATED STATEMENTS OF CASH FLOWS(in millions)
Fiscal Year Ended June 30,
2020 2019
Cash Flows from Operating Activities:
Net loss $ (71.6) $ (195.6)
Adjustments to reconcile net loss to net cash provided by (used in) operating activities:
Depreciation and amortization expense 40.2 21.7
Stock-based compensation expense 88.8 89.5
Non-cash operating lease expense 47.7 —
Other non-cash items 6.4 (1.4)
Changes in operating assets and liabilities:
Accounts receivable 11.3 (9.1)
Inventories (96.8) (111.3)
Prepaid expenses and other current assets (33.1) (30.3)
Other assets (22.1) (5.5)
Accounts payable and accrued expenses 133.4 117.3
Customer deposits and deferred revenue 272.3 2.2
Operating lease liabilities, net (23.6) —
Other liabilities 23.5 13.8
Net cash provided by (used in) operating activities 376.4 (108.6)
Cash Flows from Investing Activities:
Purchases of marketable securities (1,199.6) (249.8)
Maturities of marketable securities 435.4 36.0
Sales of marketable securities 224.3 —
Cash paid for cost method investment (0.1) (0.6)
Acquisition of business, net of cash acquired (45.0) (0.1)
Purchases of property and equipment (156.4) (83.0)
Net cash used in investing activities (741.3) (297.5)
Cash Flows from Financing Activities:
Proceeds from issuance of common stock upon initial public offering, net of offering costs 1,195.7 —
Repurchase of common and convertible preferred stock, including issuance costs — (130.3)
Proceeds from issuance of redeemable convertible preferred stock, net of issuance costs — 539.1
Proceeds from employee stock purchase plan withholdings 7.0 —
Debt issuance costs — (0.9)
Proceeds from exercise of stock options 37.4 9.3
Net cash provided by financing activities 1,240.2 417.2
Effect of exchange rate changes (1.2) 0.2
Net change in cash, cash equivalents, and restricted cash 874.0 11.3
Cash, cash equivalents and restricted cash — Beginning of period 163.0 151.6
Cash, cash equivalents and restricted cash — End of period $ 1,037.0 $ 163.0
Supplemental Disclosures of Cash Flow Information:
Cash paid for interest $ 1.9 $ 1.1
Cash paid for income taxes $ 4.1 $ —
Supplemental Disclosures of Non-Cash Investing and Financing Information:
Conversion of convertible preferred stock to common stock $ (941.1) $ —
Property and equipment accrued but unpaid $ 18.2 $ 12.6
Building — build-to-suit asset $ — $ 147.1
Stock-based compensation capitalized for software development costs $ 2.2 $ 0.8
P E L O T O N Q 4 : 2 0 2 0 | 2 3
P E L O T O N I N T E R A C T I V E , I N C .
QUARTERLY CONSOLIDATED STATEMENTS OF OPERATIONS — AS REALIGNED TO NEW SEGMENTSU N A U D I T E D(in millions)
Three Months Ended
Jun. 30,2020
Mar. 31,2020
Dec. 31,2019
Sept. 30,2019
Jun. 30,2019
Mar. 31,2019
Dec. 31,2018
Sept. 30,2018
Revenue:
Connected Fitness Products $ 485.9 $ 426.4 $ 389.1 $ 160.8 $ 162.3 $ 265.6 $ 225.5 $ 80.4
Subscription 121.2 98.2 77.1 67.2 61.0 51.1 37.3 31.7
Total Revenue 607.1 524.6 466.3 228.0 223.3 316.7 262.9 112.1
Cost of revenue:
Connected Fitness Products 265.9 237.4 236.7 93.4 94.1 158.1 131.2 44.3
Subscription 52.4 41.4 32.4 29.5 29.1 38.0 20.3 16.3
Total cost of revenue 318.3 278.8 269.1 122.9 123.2 196.1 151.5 60.6
Gross profit $ 288.8 $ 245.8 $ 197.1 $ 105.1 $ 100.1 $ 120.6 $ 111.3 $ 51.5
Gross margin
Connected Fitness Products 45.3 % 44.3 % 39.2 % 41.9 % 42.0 % 40.5 % 41.8 % 44.9 %
Subscription 56.8 % 57.8 % 58.0 % 56.1 % 52.3 % 25.6 % 45.5 % 48.7 %
Total gross margin 47.6 % 46.8 % 42.3 % 46.1 % 44.8 % 38.1 % 42.4 % 45.9 %
Quarterly Consolidated Statements of Operations - As previously disclosed
Three Months Ended
Jun. 30,2020
Mar. 31,2020
Dec. 31,2019
Sept. 30,2019
Jun. 30,2019
Mar. 31,2019
Dec. 31,2018
Sept. 30,2018
Revenue:
Connected Fitness Products $ 475.5 $ 420.2 $ 381.1 $ 157.6 $ 158.4 $ 261.6 $ 221.3 $ 77.9
Subscription 121.2 98.2 77.1 67.2 61.0 51.1 37.3 31.7
Other 10.4 6.1 8.0 3.3 4.0 4.0 4.2 2.5
Total Revenue 607.1 524.6 466.3 228.0 233.3 316.7 262.9 112.1
Cost of revenue:
Connected Fitness Products 257.5 230.0 226.7 89.8 89.7 152.3 126.5 42.2
Subscription 52.4 41.4 32.4 29.5 29.1 38.0 20.3 16.3
Other 8.4 7.5 10.0 3.6 4.4 5.8 4.6 2.1
Total cost of revenue 318.3 278.8 269.1 122.9 132.2 196.1 151.5 60.6
Gross profit $ 288.8 $ 245.8 $ 197.1 $ 105.1 $ 100.1 $ 120.6 $ 111.3 $ 51.5
Gross margin
Connected Fitness Products 45.8 % 45.3 % 40.5 % 43.0 % 43.4 % 41.8 % 42.8 % 45.8 %
Subscription 56.8 % 57.8 % 58.0 % 56.1 % 52.3 % 25.6 % 45.5 % 48.7 %
Other 19.1 % (21.6) % 25.3 % (11.2) % (12.1) % (44.3) % (10.3) % 16.3 %
Total gross margin 47.6 % 46.8 % 42.3 % 46.1 % 44.8 % 38.1 % 42.4 % 45.9 %