Embed Size (px)
Citation preview
Q3 Results Presentation 2021
DisclaimerThis presentation does not constitute, or form part of, any offer to sell or issue or any solicitation of any offer to purchase or subscribefor, any shares in Caledonia Mining Corporation Plc (“Caledonia”), nor shall it (or any part of it) or the fact of its distribution, form thebasis of, or be relied on in connection with, or act as an inducement to enter into any contract or agreement thereto.
Certain forward-looking statements may be contained in the presentation which include, without limitation, expectations regardingmetal prices, estimates of production, operating expenditure, capital expenditure and projections regarding the completion of capitalprojects as well as the financial position of the Company. Although Caledonia believes that the expectations reflected in such forward-looking statements are reasonable, no assurance can be given that such expectations will prove to be accurate. Accordingly, resultscould differ from those projected as a result of, among other factors, changes in economic and market conditions, changes in theregulatory environment and other business and operational risks.
Accordingly, neither Caledonia, nor any of its directors, officers, employees, advisers, associated persons or subsidiary undertakingsshall be liable for any direct, indirect or consequential loss or damage suffered by any person as a result of relying upon thispresentation or any future communications in connection with this presentation and any such liabilities are expressly disclaimed.
Refer to the technical report entitled “Caledonia Mining Corporation Plc NI 43-101 Technical Report on the Blanket Gold Mine, Zimbabwe” dated May 17, 2021 prepared by Minxcon (Pty) Ltd and filed by the Company on SEDAR on May 26, 2021 for resources and reserves and planned production as stated in this presentation. Mr Dana Roets (B Eng (Min.), MBA, Pr.Eng., FSAIMM, AMMSA), Chief Operating Officer, is the Company's qualified person as defined by Canada's National Instrument 43-101 and has approved any scientific or technical information contained in this document.
2NYSE/AIM: CMCL
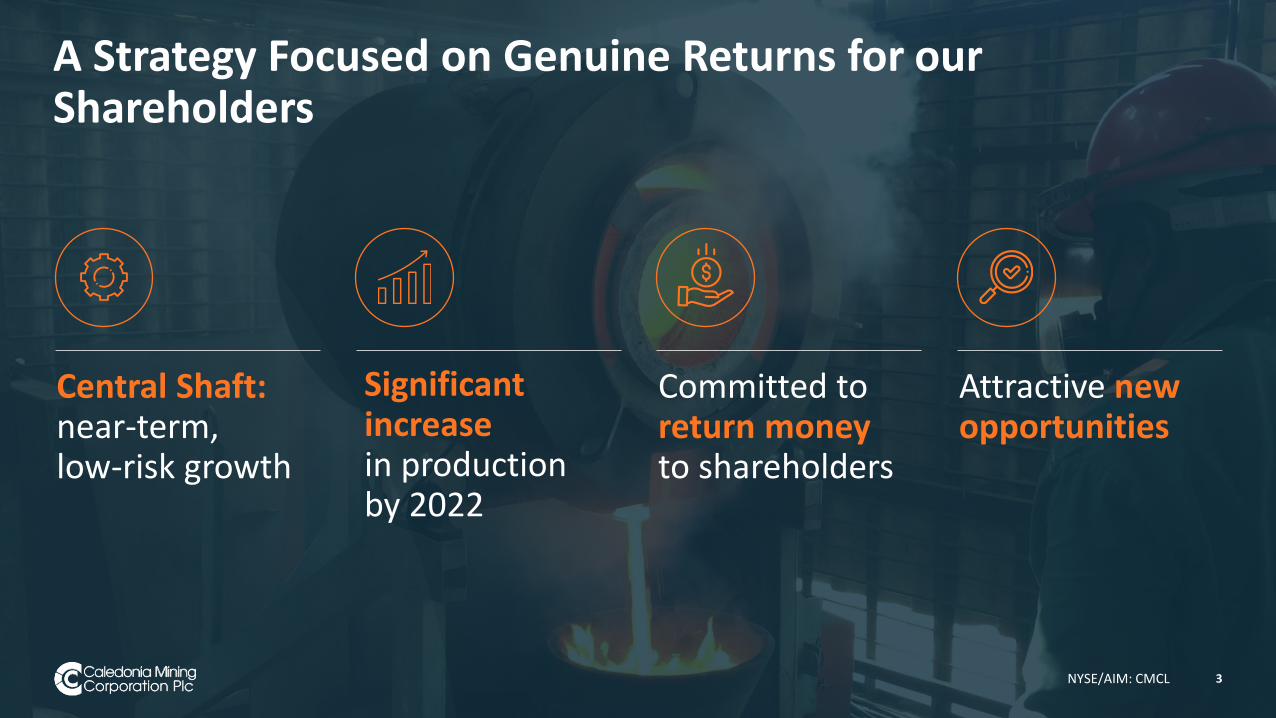
A Strategy Focused on Genuine Returns for our Shareholders
Central Shaft:near-term, low-risk growth
3NYSE/AIM: CMCL
Significant increasein production by 2022
Committed to return money to shareholders
Attractive new opportunities
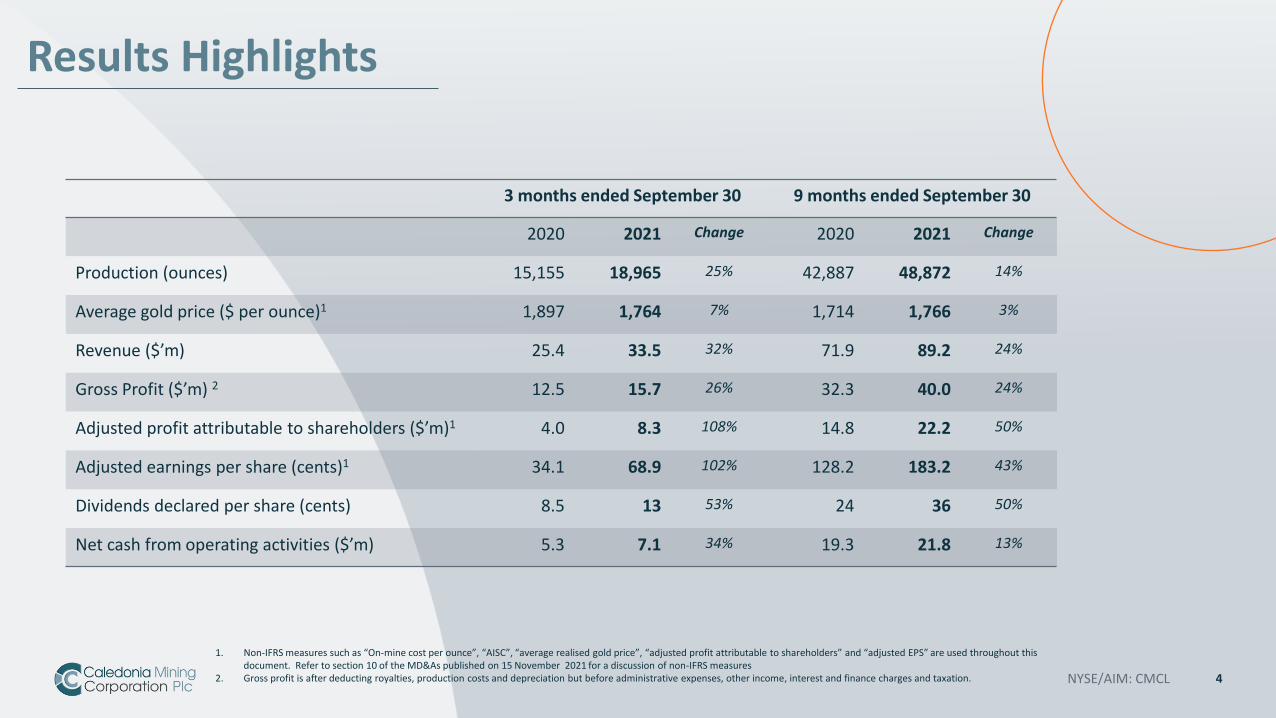
Results Highlights
NYSE/AIM: CMCL 4
1. Non-IFRS measures such as “On-mine cost per ounce”, “AISC”, “average realised gold price”, “adjusted profit attributable to shareholders” and “adjusted EPS” are used throughout this document. Refer to section 10 of the MD&As published on 15 November 2021 for a discussion of non-IFRS measures
2. Gross profit is after deducting royalties, production costs and depreciation but before administrative expenses, other income, interest and finance charges and taxation.
3 months ended September 30 9 months ended September 30
2020 2021 Change 2020 2021 Change
Production (ounces) 15,155 18,965 25% 42,887 48,872 14%
Average gold price ($ per ounce)1 1,897 1,764 7% 1,714 1,766 3%
Revenue ($’m) 25.4 33.5 32% 71.9 89.2 24%
Gross Profit ($’m) 2 12.5 15.7 26% 32.3 40.0 24%
Adjusted profit attributable to shareholders ($’m)1 4.0 8.3 108% 14.8 22.2 50%
Adjusted earnings per share (cents)1 34.1 68.9 102% 128.2 183.2 43%
Dividends declared per share (cents) 8.5 13 53% 24 36 50%
Net cash from operating activities ($’m) 5.3 7.1 34% 19.3 21.8 13%
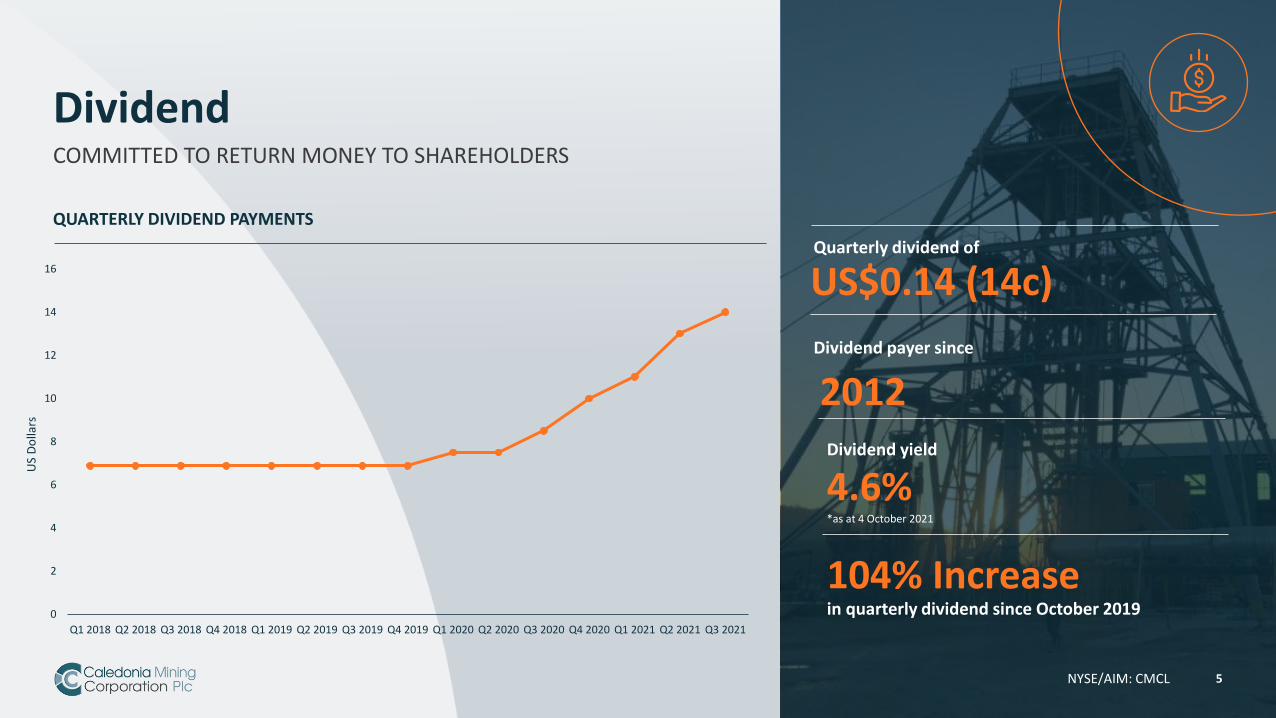
DividendCOMMITTED TO RETURN MONEY TO SHAREHOLDERS
QUARTERLY DIVIDEND PAYMENTS
D
Quarterly dividend of
US$0.14 (14c)
Dividend payer since
2012
NYSE/AIM: CMCL 5
Dividend yield
4.6% *as at 4 October 2021
104% Increase in quarterly dividend since October 2019 0
2
4
6
8
10
12
14
16
Q1 2018 Q2 2018 Q3 2018 Q4 2018 Q1 2019 Q2 2019 Q3 2019 Q4 2019 Q1 2020 Q2 2020 Q3 2020 Q4 2020 Q1 2021 Q2 2021 Q3 2021
US
Do
llars
in
NYSE/AIM: CMCL 6
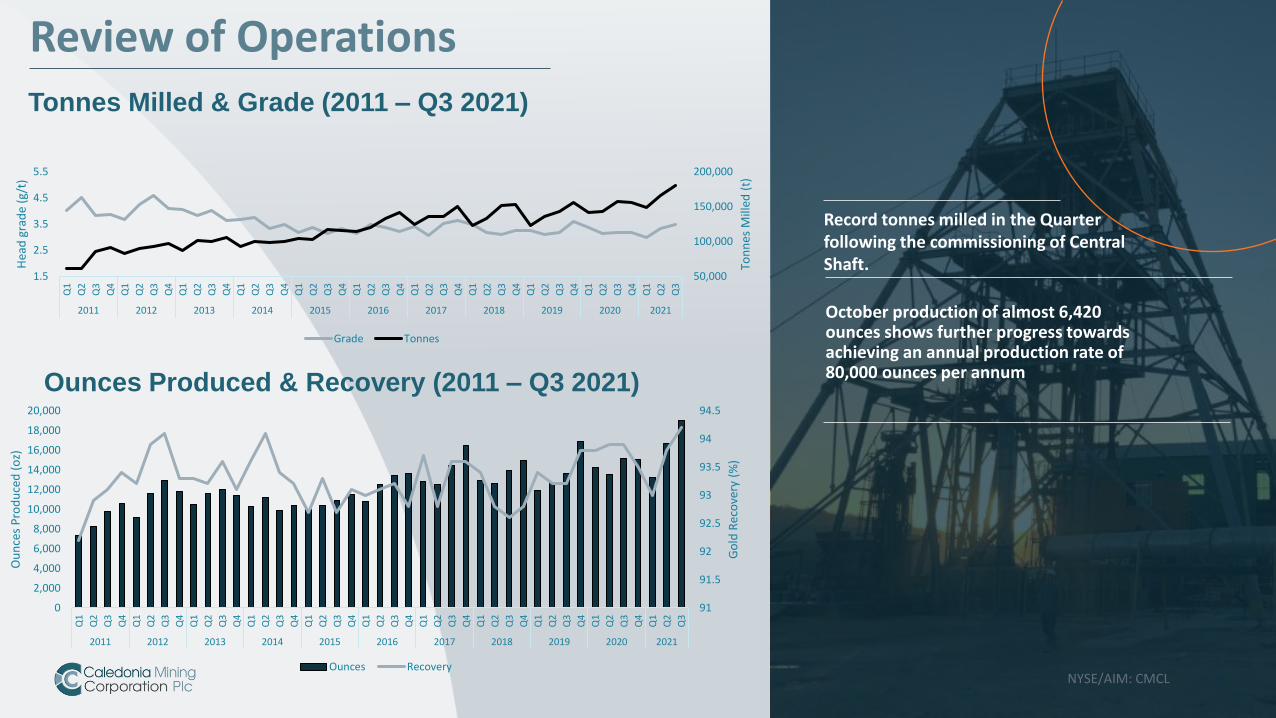
Tonnes Milled & Grade (2011 – Q3 2021)
Ounces Produced & Recovery (2011 – Q3 2021)
Record tonnes milled in the Quarter following the commissioning of Central Shaft.
October production of almost 6,420 ounces shows further progress towards achieving an annual production rate of 80,000 ounces per annum
Review of Operations
50,000
100,000
150,000
200,000
1.5
2.5
3.5
4.5
5.5
Q1
Q2
Q3
Q4
Q1
Q2
Q3
Q4
Q1
Q2
Q3
Q4
Q1
Q2
Q3
Q4
Q1
Q2
Q3
Q4
Q1
Q2
Q3
Q4
Q1
Q2
Q3
Q4
Q1
Q2
Q3
Q4
Q1
Q2
Q3
Q4
Q1
Q2
Q3
Q4
Q1
Q2
Q3
2011 2012 2013 2014 2015 2016 2017 2018 2019 2020 2021
Ton
nes
Mill
ed (
t)
Hea
d g
rad
e (g
/t)
Grade Tonnes
91
91.5
92
92.5
93
93.5
94
94.5
0
2,000
4,000
6,000
8,000
10,000
12,000
14,000
16,000
18,000
20,000
Q1
Q2
Q3
Q4
Q1
Q2
Q3
Q4
Q1
Q2
Q3
Q4
Q1
Q2
Q3
Q4
Q1
Q2
Q3
Q4
Q1
Q2
Q3
Q4
Q1
Q2
Q3
Q4
Q1
Q2
Q3
Q4
Q1
Q2
Q3
Q4
Q1
Q2
Q3
Q4
Q1
Q2
Q3
2011 2012 2013 2014 2015 2016 2017 2018 2019 2020 2021
Go
ld R
eco
very
(%
)
Ou
nce
s P
rod
uce
d (
oz)
Ounces Recovery
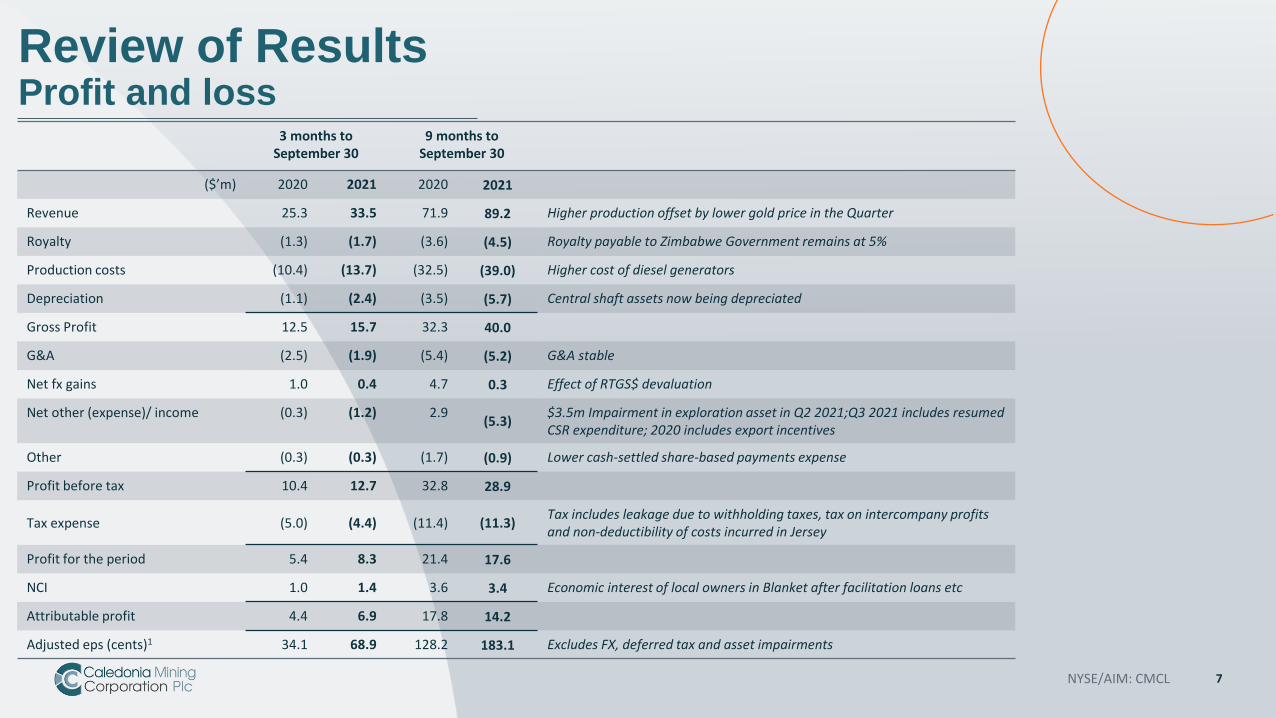
Review of ResultsProfit and loss
NYSE/AIM: CMCL 7
3 months to September 30
9 months to September 30
($’m) 2020 2021 2020 2021
Revenue 25.3 33.5 71.9 89.2 Higher production offset by lower gold price in the Quarter
Royalty (1.3) (1.7) (3.6) (4.5) Royalty payable to Zimbabwe Government remains at 5%
Production costs (10.4) (13.7) (32.5) (39.0) Higher cost of diesel generators
Depreciation (1.1) (2.4) (3.5) (5.7) Central shaft assets now being depreciated
Gross Profit 12.5 15.7 32.3 40.0
G&A (2.5) (1.9) (5.4) (5.2) G&A stable
Net fx gains 1.0 0.4 4.7 0.3 Effect of RTGS$ devaluation
Net other (expense)/ income (0.3) (1.2) 2.9(5.3)
$3.5m Impairment in exploration asset in Q2 2021;Q3 2021 includes resumed CSR expenditure; 2020 includes export incentives
Other (0.3) (0.3) (1.7) (0.9) Lower cash-settled share-based payments expense
Profit before tax 10.4 12.7 32.8 28.9
Tax expense (5.0) (4.4) (11.4) (11.3)Tax includes leakage due to withholding taxes, tax on intercompany profits and non-deductibility of costs incurred in Jersey
Profit for the period 5.4 8.3 21.4 17.6
NCI 1.0 1.4 3.6 3.4 Economic interest of local owners in Blanket after facilitation loans etc
Attributable profit 4.4 6.9 17.8 14.2
Adjusted eps (cents)1 34.1 68.9 128.2 183.1 Excludes FX, deferred tax and asset impairments
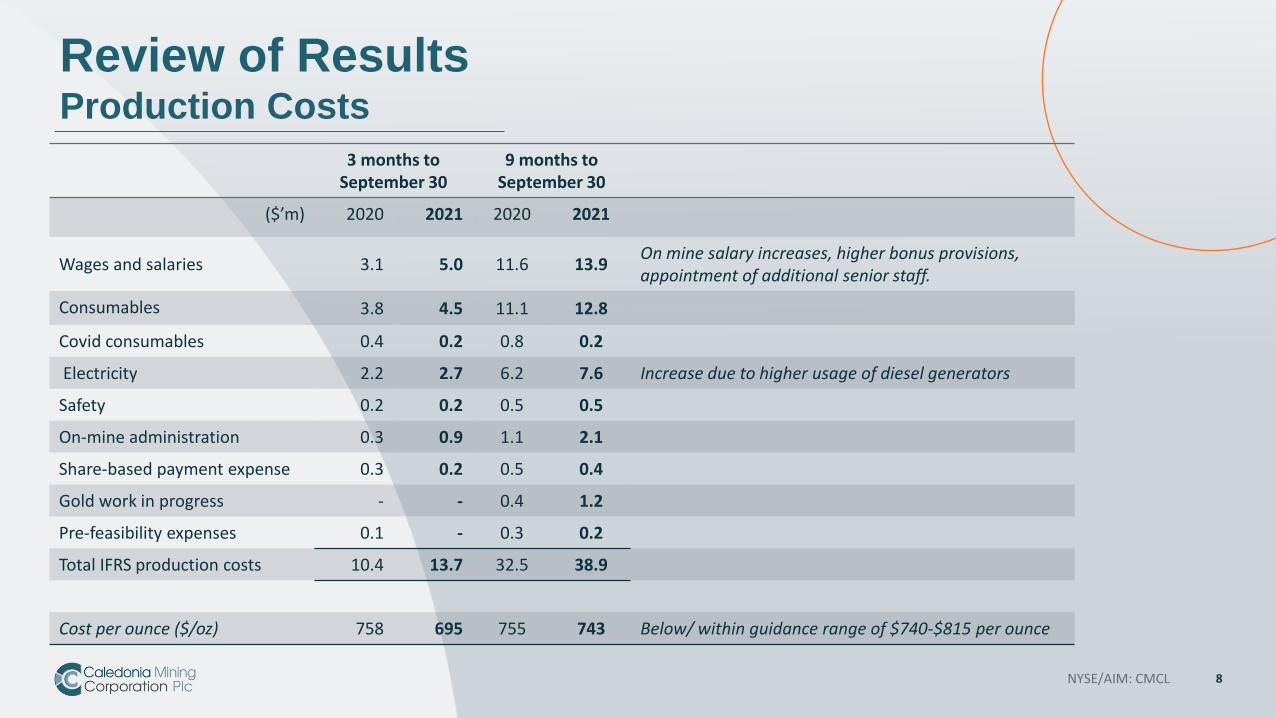
Review of ResultsProduction Costs
NYSE/AIM: CMCL 8
3 months to September 30
9 months to September 30
($’m) 2020 2021 2020 2021
Wages and salaries 3.1 5.0 11.6 13.9On mine salary increases, higher bonus provisions, appointment of additional senior staff.
Consumables 3.8 4.5 11.1 12.8
Covid consumables 0.4 0.2 0.8 0.2
Electricity 2.2 2.7 6.2 7.6 Increase due to higher usage of diesel generators
Safety 0.2 0.2 0.5 0.5
On-mine administration 0.3 0.9 1.1 2.1
Share-based payment expense 0.3 0.2 0.5 0.4
Gold work in progress - - 0.4 1.2
Pre-feasibility expenses 0.1 - 0.3 0.2
Total IFRS production costs 10.4 13.7 32.5 38.9
Cost per ounce ($/oz) 758 695 755 743 Below/ within guidance range of $740-$815 per ounce
Review of ResultsG&A
NYSE/AIM: CMCL 9
3 months to September 30
9 months to September 30
($’m) 2020 2021 2020 2021
Investor relations 0.1 0.1 0.3 0.3 Remains at a low level due to continued travel restrictions
Audit fee 0.1 - 0.2 0.2
Advisory service fees 0.2 0.1 0.5 0.3
Listing fees 0.1 0.1 0.3 0.3
Director fees 0.1 0.1 0.2 0.4 Increase in annual fee
Employee costs 0.8 1.1 2.4 3.2 increase in headcount and annual increase
Travel 0.1 - 0.1 -
Management liability insurance 0.9 0.2 1.0 0.2
Other 0.1 0.2 0.4 0.4
Total 2.5 1.9 5.4 5.3
AISC ($/oz) 1,119 909 1,028 966 Below/ within guidance range of $985-$1,080 per ounce
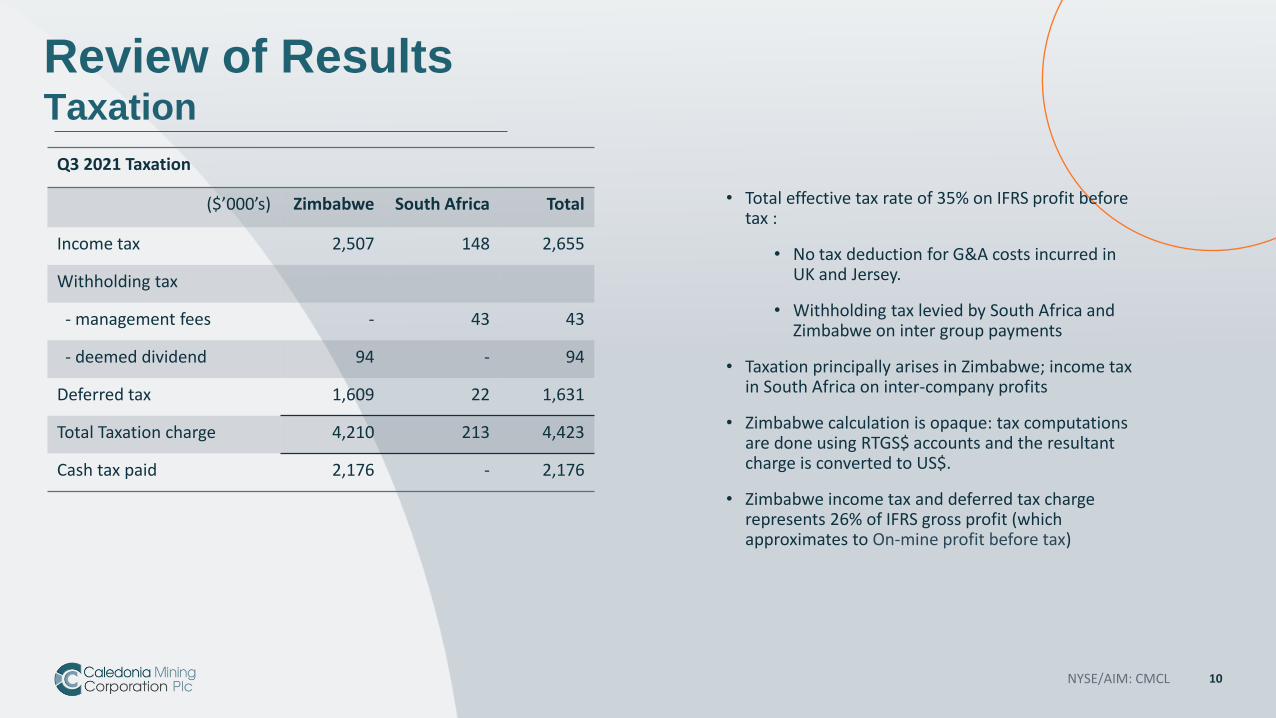
Review of ResultsTaxation
NYSE/AIM: CMCL 10
Q3 2021 Taxation
($’000’s) Zimbabwe South Africa Total
Income tax 2,507 148 2,655
Withholding tax
- management fees - 43 43
- deemed dividend 94 - 94
Deferred tax 1,609 22 1,631
Total Taxation charge 4,210 213 4,423
Cash tax paid 2,176 - 2,176
• Total effective tax rate of 35% on IFRS profit before tax :
• No tax deduction for G&A costs incurred in UK and Jersey.
• Withholding tax levied by South Africa and Zimbabwe on inter group payments
• Taxation principally arises in Zimbabwe; income tax in South Africa on inter-company profits
• Zimbabwe calculation is opaque: tax computations are done using RTGS$ accounts and the resultant charge is converted to US$.
• Zimbabwe income tax and deferred tax charge represents 26% of IFRS gross profit (which approximates to On-mine profit before tax)
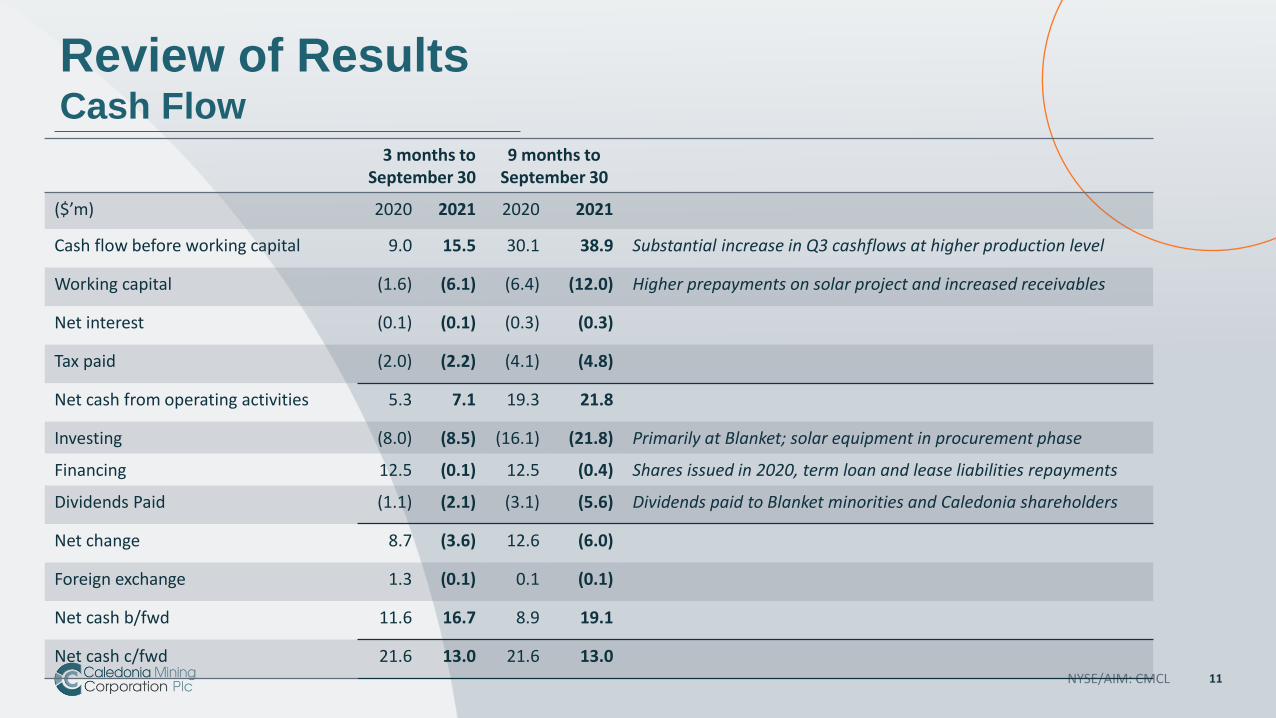
Review of ResultsCash Flow
NYSE/AIM: CMCL 11
3 months to September 30
9 months to September 30
($’m) 2020 2021 2020 2021
Cash flow before working capital 9.0 15.5 30.1 38.9 Substantial increase in Q3 cashflows at higher production level
Working capital (1.6) (6.1) (6.4) (12.0) Higher prepayments on solar project and increased receivables
Net interest (0.1) (0.1) (0.3) (0.3)
Tax paid (2.0) (2.2) (4.1) (4.8)
Net cash from operating activities 5.3 7.1 19.3 21.8
Investing (8.0) (8.5) (16.1) (21.8) Primarily at Blanket; solar equipment in procurement phase
Financing 12.5 (0.1) 12.5 (0.4) Shares issued in 2020, term loan and lease liabilities repayments
Dividends Paid (1.1) (2.1) (3.1) (5.6) Dividends paid to Blanket minorities and Caledonia shareholders
Net change 8.7 (3.6) 12.6 (6.0)
Foreign exchange 1.3 (0.1) 0.1 (0.1)
Net cash b/fwd 11.6 16.7 8.9 19.1
Net cash c/fwd 21.6 13.0 21.6 13.0

Review of ResultsBalance Sheet
NYSE/AIM: CMCL 12
($’000) Dec 31 2020
Sept 30 2021
Non-current assets 133,334 147,421
Other current assets 21,836 29,989 Increased inventories and receivables - refer overleaf
Cash and equivalents 19,092 13,213
Prepayments 1,974 7,110 Increase due to prepayments for solar - refer overleaf
Derivative financial assets 1,184 - Gold ETF sold in the Q2
Assets held for sale 500 - Mascot exploration asset: sale finalised and proceeds received in Q3
Total assets 177,920 197,733
Equity attrib. to shareholders 141,519 151,184
Non-controlling interests 16,524 18,649
Total equity 158,043 169,833
Non-current liabilities 9,913 13,317 Deferred tax and rehab provisions. No debt
Current liabilities 9,964 14,583 Mainly trade payables: less than $200k of debt
Total equity and liabilities 177,920 197,733
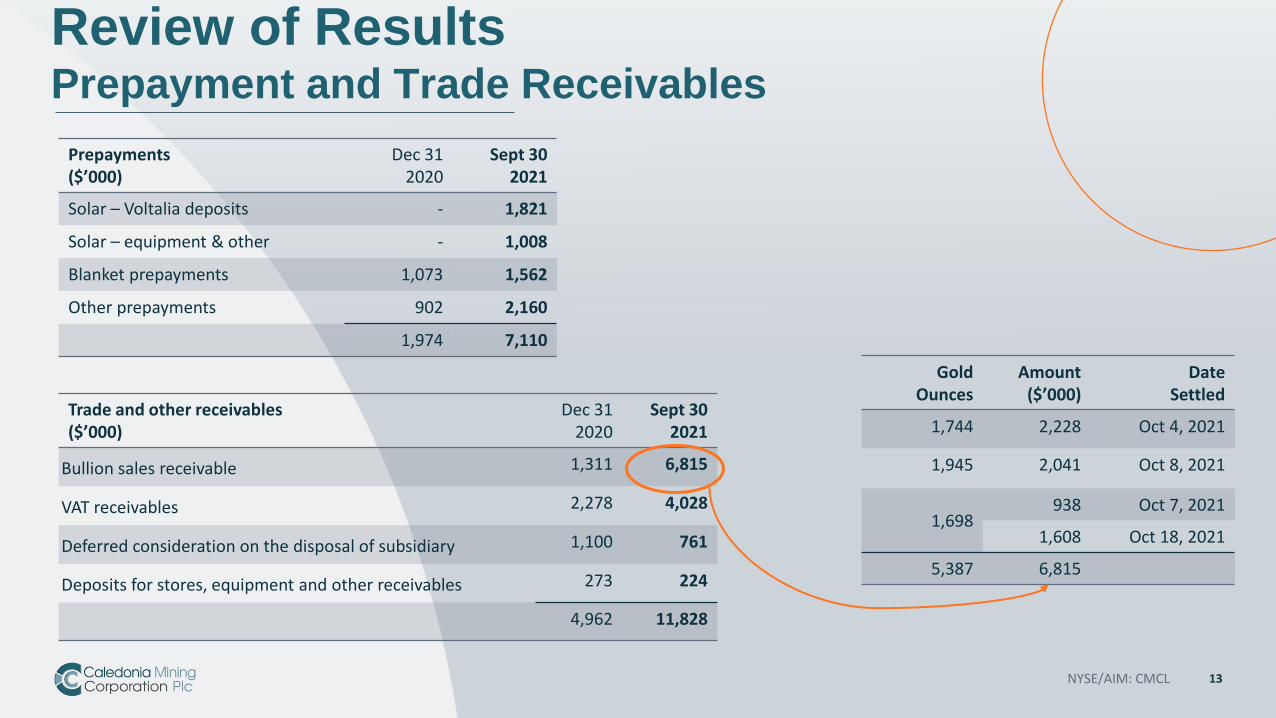
Review of ResultsPrepayment and Trade Receivables
NYSE/AIM: CMCL 13
Prepayments($’000)
Dec 312020
Sept 302021
Solar – Voltalia deposits - 1,821
Solar – equipment & other - 1,008
Blanket prepayments 1,073 1,562
Other prepayments 902 2,160
1,974 7,110
Trade and other receivables($’000)
Dec 312020
Sept 302021
Bullion sales receivable 1,311 6,815
VAT receivables 2,278 4,028
Deferred consideration on the disposal of subsidiary 1,100 761
Deposits for stores, equipment and other receivables 273 224
4,962 11,828
GoldOunces
Amount($’000)
DateSettled
1,744 2,228 Oct 4, 2021
1,945 2,041 Oct 8, 2021
1,698938 Oct 7, 2021
1,608 Oct 18, 2021
5,387 6,815
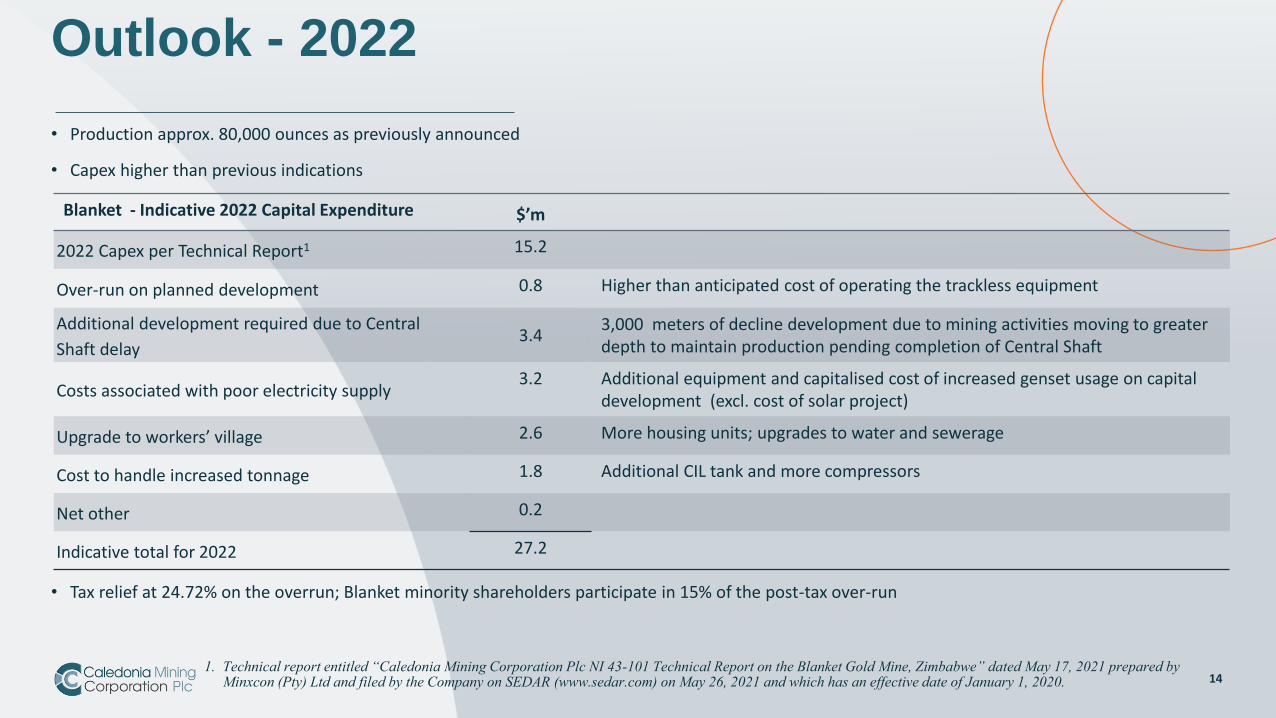
Outlook - 2022
14
Blanket - Indicative 2022 Capital Expenditure $’m
2022 Capex per Technical Report1 15.2
Over-run on planned development 0.8 Higher than anticipated cost of operating the trackless equipment
Additional development required due to Central
Shaft delay3.4
3,000 meters of decline development due to mining activities moving to greater depth to maintain production pending completion of Central Shaft
Costs associated with poor electricity supply 3.2 Additional equipment and capitalised cost of increased genset usage on capital
development (excl. cost of solar project)
Upgrade to workers’ village 2.6 More housing units; upgrades to water and sewerage
Cost to handle increased tonnage 1.8 Additional CIL tank and more compressors
Net other 0.2
Indicative total for 2022 27.2
• Production approx. 80,000 ounces as previously announced
• Capex higher than previous indications
• Tax relief at 24.72% on the overrun; Blanket minority shareholders participate in 15% of the post-tax over-run
1. Technical report entitled “Caledonia Mining Corporation Plc NI 43-101 Technical Report on the Blanket Gold Mine, Zimbabwe” dated May 17, 2021 prepared by Minxcon (Pty) Ltd and filed by the Company on SEDAR (www.sedar.com) on May 26, 2021 and which has an effective date of January 1, 2020.
Contacts
NYSE/AIM: CMCL 15
Website: www.caledoniamining.comTwitter: @CaledoniaMiningShare Codes: NYSE American – CMCL / AIM – CMCL
Caledonia MiningMark Learmonth, CFOTel: +44 (0) 1534 679800Email: [email protected]
Camilla Horsfall, VP Investor RelationsTel: +44 (0) 7817 841793Email: [email protected]
Investment ResearchWH Ireland: www.whirelandplc.comCantor Fitzgerald: www.cantor.com
London Financial PR: BlytheweighTim BlytheTel: +44 (0) 207 138 3205
Megan RayTel: +44 (0) 207 138 3222
North America IR: 3ppb LLCPatrick ChidleyTel: +1 917 991 7701
Paul DurhamTel: +1 203 940 2538
European IR: Swiss Resource CapitalJochen StaigerTel: +41 71 354 8501
AIM Broker/Nomad: WH IrelandAdrian HaddenTel: +44 (0) 207 220 1666Email: [email protected]