Embed Size (px)
Citation preview

NOVEMBER 09, 2021
PRESENTATION ON CEZ GROUP FINANCIAL RESULTS IN Q3 2021
NONAUDITED CONSOLIDATED RESULTS PREPARED IN ACCORDANCE WITH INTERNATIONAL FINANCIAL REPORTING STANDARDS (IFRS)

Summary Results and Selected Events
Performance of the Generation and Mining Segments
Performance of the Distribution and Sales Segments
CONTENTS
2

Main Financial Results for Q1-Q3
Operating revenues amounted to CZK 156.0 bn; for Q3, CZK 47.7 bn.
EBITDA amounted to CZK 47.5 bn; for Q3, CZK 15.9 bn.
Net income amounted to CZK 6.7 bn; for Q3, CZK 5.1 bn.
Adjusted net income* amounted to CZK 16.9 bn; for Q3, CZK 5.6 bn.
For the full year 2021, we estimate EBITDA of CZK 59-60 bn and adjusted net income of CZK 19-21 bn.
FINANCIAL RESULTS AND SELECTED EVENTS
3
Selected Events
Electricity prices in Q3 were well above the historical highs of 2008, with baseload contracts for 2022 delivery exceeding EUR
130/MWh in Q3 and even EUR 160/MWh in October.
Following the breach of obligation of Bohemia Energy company in Czechia, suppliers of the last resort took over electricity and
gas supplies of almost 900,000 end customers. For this reason, CEZ Group, through ČEZ Prodej, took over the supplies of almost
400,000 end customers.
The Bulgarian assets were transferred to the buyer on July 27 against payment of the purchase price of EUR 335 m. The
arbitration with the Bulgarian state is continuing and represents an additional potential income of hundreds of millions of EUR for
the shareholders.
The sale process of the generation assets in Poland was halted as the prices offered were not economically attractive enough.
CEZ Group has started updating the concepts of both sites in order to secure heat supplies from modern low-emission sources as
soon as possible.
* Adjusted net income = Net income adjusted for extraordinary effects that are generally unrelated to ordinary financial performance in a given period (such as fixed asset
impairments and goodwill write-off)

FINANCIAL AND OPERATING RESULTS
* Divested companies in Romania (as at Mar 31, 2021) and Bulgaria (as at Jul 27, 2021)
** Adjusted net income = Net income adjusted for extraordinary effects that are generally unrelated to ordinary financial performance in a given period
(such as fixed asset impairments and goodwill write-off)
*** On the last date of the period
4
Q1–Q3/2020 Q1–Q3/2021 Difference %
Operating revenues CZK bn 155.5 156.0 +0.4 +0%
EBITDA CZK bn 50.9 47.5 -3.4 -7%
of which: Existing assets (i.e. excluding divested assets*) CZK bn 45.2 44.9 -0.3 -1%
EBIT CZK bn 23.2 13.8 -9.4 -40%
Net income CZK bn 13.6 6.7 -6.9 -51%
Adjusted net income** CZK bn 18.7 16.9 -1.8 -10%
Operating cash flows CZK bn 52.0 26.1 -26.0 -50%
CAPEX CZK bn 18.9 19.3 +0.4 +2%
Q1–Q3/2020 Q1–Q3/2021 Difference %
Installed capacity*** GW 13.9 11.8 -2.1 -15%
Electricity generation TWh 44.1 40.1 -4.0 -9%
Electricity distributed to end customers TWh 36.8 33.7 -3.1 -8%
Sales of electricity to end customers TWh 24.3 21.2 -3.2 -13%
Sales of heat thousands TJ 15.7 17.4 +1.7 +11%
Workforce headcount*** thousands persons 32.8 27.2 -5.6 -17%
The significant year-on-year decline in operating cash flow is due to temporary effects arising from the significant fluctuations of market prices
and from commodity trading. These are, in particular, the effect of time arbitrations with emission allowances and the effect of margining on
commodity futures.
MAIN CAUSES OF YEAR-ON-YEAR CHANGE IN EBITDA
Divested
assets
Existing
assets
5
45.2 44.9
5.72.6
-1.9 -0.4 -1.1
+0.8 +0.7+1.6
30
35
40
45
50
55
Q1–Q3/2020 Generatingfacilities
Trading Specificeffects
MINING DISTRIBUTION SALES Q1–Q3/2021
CZK bn
CZK -0.3 bn
-0.7 %
50.947.5
GENERATION
EXISTING ASSETS
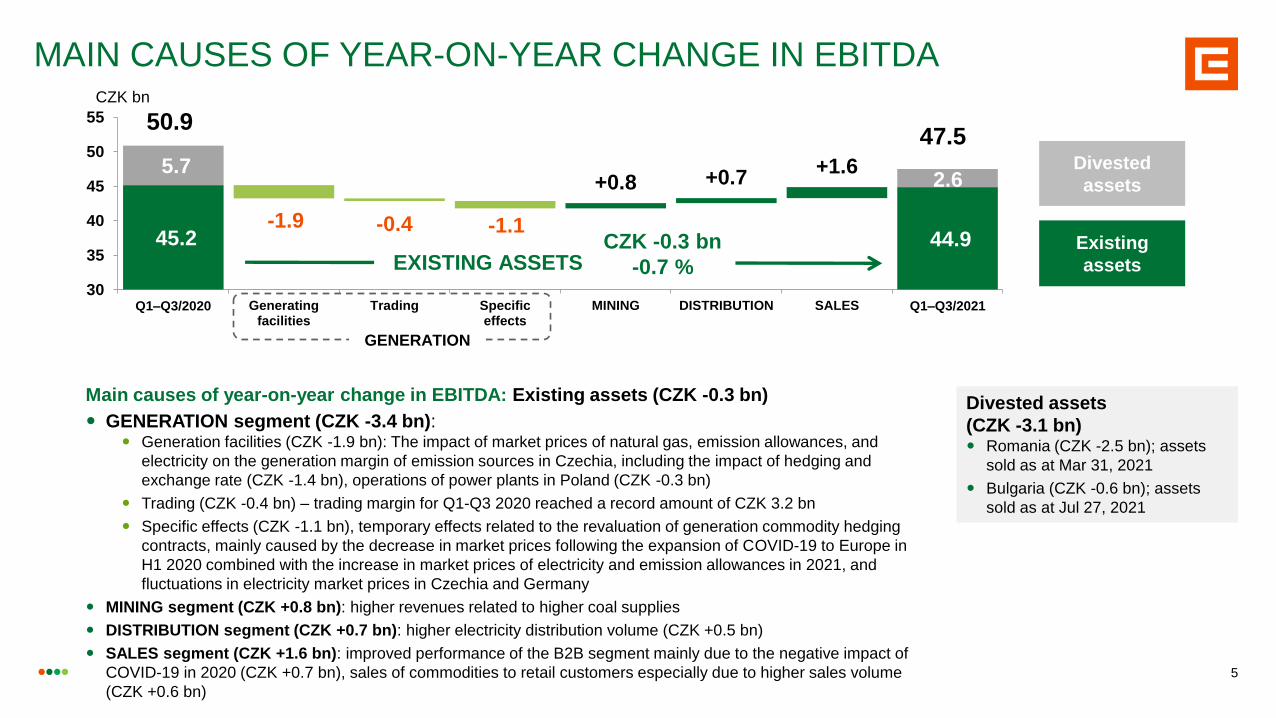
Main causes of year-on-year change in EBITDA: Existing assets (CZK -0.3 bn)
GENERATION segment (CZK -3.4 bn): Generation facilities (CZK -1.9 bn): The impact of market prices of natural gas, emission allowances, and
electricity on the generation margin of emission sources in Czechia, including the impact of hedging and
exchange rate (CZK -1.4 bn), operations of power plants in Poland (CZK -0.3 bn)
Trading (CZK -0.4 bn) – trading margin for Q1-Q3 2020 reached a record amount of CZK 3.2 bn
Specific effects (CZK -1.1 bn), temporary effects related to the revaluation of generation commodity hedging
contracts, mainly caused by the decrease in market prices following the expansion of COVID-19 to Europe in
H1 2020 combined with the increase in market prices of electricity and emission allowances in 2021, and
fluctuations in electricity market prices in Czechia and Germany
MINING segment (CZK +0.8 bn): higher revenues related to higher coal supplies
DISTRIBUTION segment (CZK +0.7 bn): higher electricity distribution volume (CZK +0.5 bn)
SALES segment (CZK +1.6 bn): improved performance of the B2B segment mainly due to the negative impact of
COVID-19 in 2020 (CZK +0.7 bn), sales of commodities to retail customers especially due to higher sales volume
(CZK +0.6 bn)
Divested assets
(CZK -3.1 bn) Romania (CZK -2.5 bn); assets
sold as at Mar 31, 2021
Bulgaria (CZK -0.6 bn); assets
sold as at Jul 27, 2021

(CZK bn) Q1–Q3/2020 Q1–Q3/2021 Difference %
EBITDA 50.9 47.5 -3.4 -7%
Depreciation and amortization -22.1 -21.8 +0.3 +1%
Impairments* -5.7 -11.9 -6.2 -110%
Other income (expenses) -5.7 -3.0 +2.7 +48%
Interest income (expenses) -3.7 -2.9 +0.7 +20%
Other -2.0 -0.0 +2.0 —
Income tax -3.9 -4.1 -0.3 -6%
Net income 13.6 6.7 -6.9 -51%
Adjusted net income 18.7 16.9 -1.8 -10%
MAIN CAUSES OF YEAR-ON-YEAR CHANGE IN NET INCOME
Depreciation, Amortization, and Impairments* (CZK -6.0 bn)
higher addition to impairments of fixed assets in Severočeské doly (CZK -8.4 bn), lower impairments in Poland (CZK +1.0 bn), in Romania (CZK +0.5 bn),
and in Bulgaria (CZK +0.1 bn)
higher depreciation of existing assets (CZK -1.3 bn), including ČEZ, a. s. (CZK -1.5 bn), due to accelerated depreciation of coal-fired power plants reflecting
the deterioration of market and regulatory conditions for long-term operation of coal-fired power plants, lower depreciation of Severočeské doly (CZK +0.3 bn)
Lower depreciation of divested assets (CZK +1.6 bn) due to the sale of Romanian (as at Mar 31, 2021) and Bulgarian companies (as at Jul 27, 2021)
Other Income and Expenses (CZK +2.7 bn)
Exchange rate effects and revaluating financial derivatives and securities (CZK +2.0 bn)
Lower interest expense (CZK +0.7 bn) due to a decrease in the total amount of debt
Net Income Adjustments
for Q1–Q3 2021, adjusted for impairments on fixed assets of Severočeské doly (CZK +9.2 bn) and in Poland (CZK +1.0 bn)
for Q1–Q3 2020, adjusted for the negative effect of impairments and goodwill write-off in Poland (CZK +1.8 bn), in Romania (CZK +1.5 bn), in Czechia
(CZK +0.9 bn), and the negative effect of impairments in Bulgaria (CZK +0.9 bn)
* Including profit/loss from sales of tangible and intangible fixed assets
6
Significant event after Q3 2021:
On Nov 2, 2021, ČEZ, a. s., received the amount
of CZK 1,484 m corresponding to the interest
related to the refunded overpayment of the gift tax
on emission allowances for the years 2011 and
2012.
This income will increase CEZ Group's net profit in
Q4 2021 and is not subject to income taxes.

MARKET PRICES OF ELECTRICITY FOR 2022 HAVE INCREASED SHARPLY DUE TO RISING GAS PRICES AND DUE TO THE EU'S CLIMATE AMBITION
Evolution of electricity, emission allowance, and gas market pricesEEX: Cal22 BL (EUR/MWh); EUA for delivery in 12/2022 (EUR/t); TTF Cal22 gas (EUR/MWh)
EUA—European Union Allowances (emission allowances)
The increase in electricity prices in H1
followed the development of emission
allowance prices and the EU's more ambitious
climate targets. The increase in electricity
prices to record levels in H2 was driven by gas
prices.
The gas price increased due to several largely
global factors:
• high global demand, reflecting high
global economic growth following the
reduction of Covid-19 restrictions
• supply recovery from the post-Covid-19
gas generation and output constraints
takes time
• low storage filling up in Europe after an
exceptionally long winter
• a hot summer, particularly in Asia and
southern Europe, when gas was used to
generate electricity for air conditioning
instead of being injected into storage
and at the expense of exports
• low wind in Europe and therefore low
wind generation
• the uncertain starting date of the Nord
Stream 2 pipeline from Russia
7
0
20
40
60
80
100
120
140
160
180
Electricity Allowance Gas
Oct 29,
2021
51
34
16
129
62
57
109
59
45
Jun 30,
2021 Jan 1,
2021
Sep 30,
2021 Mar 31,
2021

34.1
18.87.4
3.2
3.5
2.1
2022 2023 2024 2025
EUA purchase price (EUR/t)Electricity selling price (EUR/MWh)
HEDGING OF GENERATION MARKET RISK
FOR 2022 37 TWH OF ELECTRICITY SOLD AT 54.1 EUR/MWH,
11.4 M T EUA PURCHASED AT 31.1 EUR/T
Hedged volume as at Jun 30, 2021
€ 58.4 € 40.4 € 56.1 € 32.5 € 54.3 € 31.1 € 54.1
Electricity sold for 2022–2025 in TWh (as at Sep 30)
—
10.35.4
1.9
1.1
0.60.2
2022 2023 2024 2025
1.9
37.3
9.422.3
0.0
11.4
2.26.0
Hedged volume from Jul 1, 2021, to Sep 30, 2021
Hedged volume as at Jun 30, 2021
Hedged volume from Jul 1, 2021, to Sep 30, 2021
Contracted emission allowances for 2022–2025* in m t
(as at Sep 30)
* 100% of the expected annual volume of emission allowances for generation in Czechia for 2022–2025 is 12–17 m tons. 8
2022 2023 2024 2025 100% of expected deliveries
Share of hedged deliveries of electricity 79% 49% 21% 4% 44 to 47 TWh of annual external deliveries
Share of hedged deliveries of electricity from generation in Czechia (as at Sep 30)

0.360.33
0.28
0.00
0.10
0.20
0.30
0.40
0.50
0.60
2019 2020 E 2021
0.31 0.28
0.00
0.10
0.20
0.30
0.40
0.50
0.60
Q1–Q3/2020 Q1–Q3/2021
THE GROUP IS PROGRESSING IN MEETING ITS DECARBONIZATION TARGETS. EMISSION INTENSITY HAS DECREASED Y-O-Y BY 12%.
Emission intensity per electricity generated (t CO2/MWhe)
-12% -14%
CEZ Group's emission
intensity of 0.28 t CO2/MWhe
corresponds to:
• Approx. 80% of emissions
from a new CCGT source
• Approx. 50% of emissions
produced by the marginal
plant determining the
current market prices in
Germany
9
Selected events in decarbonization and the environment
In September 2021, CEZ Group made a commitment to SBTi to reduce emissions in line with the Paris Agreement and also joined the initiative Business Ambition for 1.5°C.
On 17 August, the operation of the EME3 coal-fired generating unit was terminated at the Mělník site, reducing ČEZ's installed
capacity by 500 MW.
Inven Capital became the first holder of a carbon-neutral business certificate in CEZ Group.
Current emissions of a
marginal power plant in
Germany
Emissions of new
CCGT plants

10
We increase capacity and ensure safe operation of nuclear power plants
Westinghouse will upgrade the control and monitoring systems of Temelín NPP under a contract concluded on Sep 13, 2021. In terms of technical complexity, this is
one of the most complex contracts in the history of Czechia, which will involve the partial replacement of the Westinghouse system that has ensured safe operation of
the Temelín NPP for 20 years.
The achievable output of Unit 1 of the Temelín NPP has increased by 4 MWe to 1,086 MWe . The increase was achieved by installing two new separators—steam
reheaters in the nonnuclear part of the power plant, which enhanced the unit’s efficiency at the same reactor output. The same investment was undertaken at Temelín
NPP Unit 2 in 2020. Increasing the efficiency of the unit will save up to 20,000 tons of CO2 per year.
The outage of Temelín NPP Unit 2 was completed in a shortened timeframe, despite an unexpected outage and forced repair of the 400kV ČEPS power output line.
As part of this outage, the reactor containment passed the safety test and met all impenetrability criteria.
The Dukovany and Temelín nuclear power plants were among the first nuclear power plants in the world to undergo an information and cyber security audit. In
accordance with the ISO/IEC 27001 standard, they were awarded an international certificate confirming the high level of the Information Security Management
System (ISMS).
We are gradually fulfilling the ESG commitments defined in the strategic VISION 2030—Clean Energy for Tomorrow
In the course of Q3 2021, the preparation of projects for the construction of RES (photovoltaics) in Czechia with investment support from the Modernization Fund
(MoFo) continued. ČEZ submitted 24 projects with a total installed capacity of more than 233 MWp to the first RES+ call No. 2/2021 for PV plants above 1 MWp, for
which the deadline for application submissions was Oct 29, 2021. We expect the evaluation of applications under this call to take place within 3–6 months.
Overall, the proportion of women working in nuclear power plants has exceeded 10%, increasing the number of women by more than 20% over the past five years.
On Sep 29, ČEZ, a. s., obtained the certification of the Anti-Corruption Management System according to ISO 37001:2016 for the activities of the Purchasing and
Compliance departments, awarded by KPMG Germany. Receiving the internationally recognized certification is a confirmation of the high level of anti-corruption
measures at ČEZ and fulfills the commitment of the company's management to develop the ethical dimension of the business of CEZ Group according to the best
international practices.
SELECTED EVENTS IN THE PAST QUARTER
ISMS—Information Security Management System
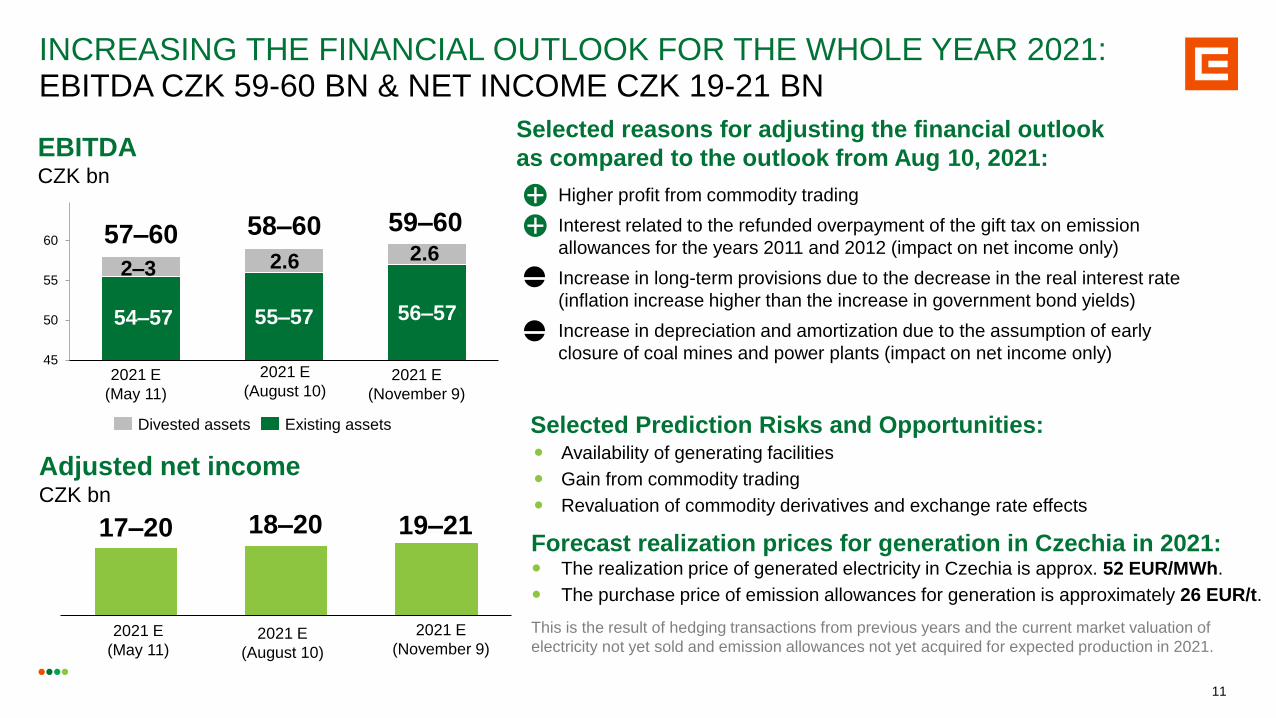
Forecast realization prices for generation in Czechia in 2021: The realization price of generated electricity in Czechia is approx. 52 EUR/MWh.
The purchase price of emission allowances for generation is approximately 26 EUR/t.
This is the result of hedging transactions from previous years and the current market valuation of
electricity not yet sold and emission allowances not yet acquired for expected production in 2021.
INCREASING THE FINANCIAL OUTLOOK FOR THE WHOLE YEAR 2021: EBITDA CZK 59-60 BN & NET INCOME CZK 19-21 BN
EBITDACZK bn
Adjusted net incomeCZK bn
Higher profit from commodity trading
Interest related to the refunded overpayment of the gift tax on emission
allowances for the years 2011 and 2012 (impact on net income only)
Increase in long-term provisions due to the decrease in the real interest rate
(inflation increase higher than the increase in government bond yields)
Increase in depreciation and amortization due to the assumption of early
closure of coal mines and power plants (impact on net income only)
54–57
2021 E
(May 11)
2021 E
(November 9)
Divested assets Existing assets
Selected reasons for adjusting the financial outlook
as compared to the outlook from Aug 10, 2021:
Availability of generating facilities
Gain from commodity trading
Revaluation of commodity derivatives and exchange rate effects
Selected Prediction Risks and Opportunities:
23
2021 E
(November 9)2021 E
(May 11)2021 E
(August 10)
2021 E
(August 10)
—
—
11
18–2017–20 19–21
55–57 56–57
2–32.6
45
50
55
60 57–60 58–60 59–60
2.6
54–57

Summary Results and Selected Events
Performance of the Generation and Mining Segments
Performance of the Distribution and Sales Segments
CONTENTS
12
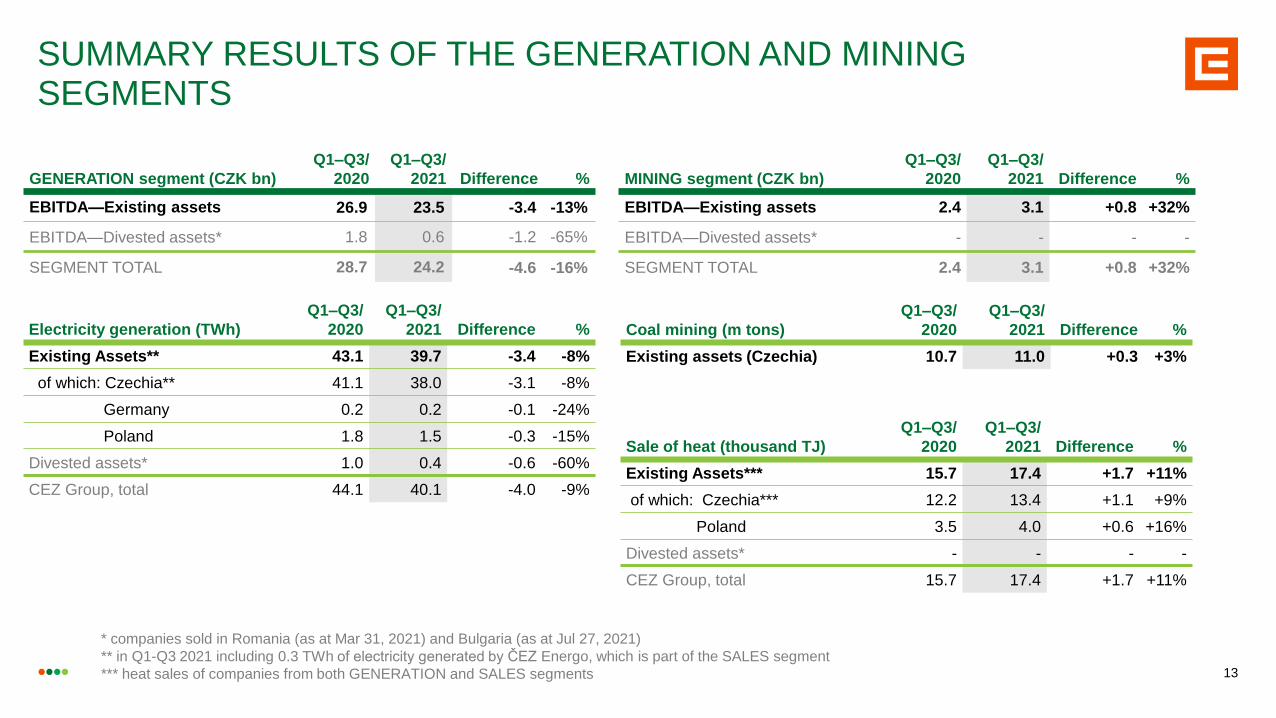
SUMMARY RESULTS OF THE GENERATION AND MINING SEGMENTS
Electricity generation (TWh)
Q1–Q3/
2020
Q1–Q3/
2021 Difference %
Existing Assets** 43.1 39.7 -3.4 -8%
of which: Czechia** 41.1 38.0 -3.1 -8%
Germany 0.2 0.2 -0.1 -24%
Poland 1.8 1.5 -0.3 -15%
Divested assets* 1.0 0.4 -0.6 -60%
CEZ Group, total 44.1 40.1 -4.0 -9%
GENERATION segment (CZK bn)
Q1–Q3/
2020
Q1–Q3/
2021 Difference %
EBITDA—Existing assets 26.9 23.5 -3.4 -13%
EBITDA—Divested assets* 1.8 0.6 -1.2 -65%
SEGMENT TOTAL 28.7 24.2 -4.6 -16%
13
* companies sold in Romania (as at Mar 31, 2021) and Bulgaria (as at Jul 27, 2021)
** in Q1-Q3 2021 including 0.3 TWh of electricity generated by ČEZ Energo, which is part of the SALES segment
*** heat sales of companies from both GENERATION and SALES segments
MINING segment (CZK bn)
Q1–Q3/
2020
Q1–Q3/
2021 Difference %
EBITDA—Existing assets 2.4 3.1 +0.8 +32%
EBITDA—Divested assets* - - - -
SEGMENT TOTAL 2.4 3.1 +0.8 +32%
Sale of heat (thousand TJ)
Q1–Q3/
2020
Q1–Q3/
2021 Difference %
Existing Assets*** 15.7 17.4 +1.7 +11%
of which: Czechia*** 12.2 13.4 +1.1 +9%
Poland 3.5 4.0 +0.6 +16%
Divested assets* - - - -
CEZ Group, total 15.7 17.4 +1.7 +11%
Coal mining (m tons)
Q1–Q3/
2020
Q1–Q3/
2021 Difference %
Existing assets (Czechia) 10.7 11.0 +0.3 +3%

GENERATION SEGMENT EBITDA—EXISTING ASSETS
14The breakdown of EBITDA of the GENERATION segment into five sub-segments is only indicative on the basis of central allocation assumptions (in particular the allocation of gross
margin and fixed costs of the central divisions of ČEZ, a. s.) and simplified consolidation with other companies in the segment.
Year-on-year effects in Q1–Q3:
Nuclear Generating Facilities (CZK +0.3 bn)
Impact of electricity realization prices and FX on electricity generation (CZK +0.9 bn), higher fixed operating costs (CZK -0.3 bn) and
received compensation for damages at Dukovany NPP in 2020 (CZK -0.2 bn)
Renewables (CZK +0.3 bn)—operation of hydro power plants (CZK +0.5 bn), operation of wind power plants (CZK -0.1 bn)
Fossil-Fuel Generation (CZK -2.5 bn), of which in Czechia (CZK -2.3 bn)
Effect of market prices of emission allowances and commodities on the generation margin in Czechia, including the impact of hedging
and exchange rate (CZK -1.4 bn)—mainly due to the increase in emission allowance prices based on the EC climate targets,
operational availability of resources in Czechia (CZK -0.2 bn), lower sales of ancillary services and control energy in Czechia
(CZK -0.2 bn), higher fixed costs in Czechia (CZK -0.3 bn), higher heat sales in Czechia (CZK +0.3 bn)
Operation of Polish generating facilities (CZK -0.3 bn), operation of the Počerady coal-fired power plant sold in 2020 (CZK -0.4 bn),
Trading (CZK -0.4 bn)— trading margin for Q1-Q3 2020 reached a record amount of CZK 3.2 bn
Specific temporary effects (CZK -1.1 bn)
Temporary effects related to the in-year revaluation of commodity hedging contracts for generation, caused mainly by the decrease in
market prices following the outbreak of Covid-19 in Europe in H1 2020 combined with the increase in market prices for electricity and
emission allowances in 2021 (CZK -0.9 bn), lower overhedge from German hedging contracts for generation supply in Czechia due to
changes in market prices for electricity in Czechia and Germany (CZK -0.2 bn)
Year-on-year effects in Q3: Nuclear generating facilities (CZK +0.2 bn): Impact
of electricity realization prices and FX on generation
(CZK +1.0 bn), lower generation volume due to timing
of outages (CZK -0.6 bn), higher fixed costs
(CZK -0.2 bn)
Fossil-Fuel Generation (CZK +0.1 bn): coal plants in
Czechia (CZK +0.4 bn), operation of CCGT Počerady
(CZK -0.1 bn), Polish generating facilities (CZK -0.2 bn)
Trading (CZK +1.8 bn): Higher trading margin
Specific effects (CZK +2.4 bn): Temporary effects
related to the revaluation of commodity generation
hedging contracts, or partial elimination of temporary
effects in H1 (CZK +1.8 bn), impact of fluctuations in
electricity market prices in Czechia and Germany on
the overhedge from hedging contracts (CZK +0.6 bn)
EBITDA (CZK bn) Q1–Q3/2020 Q1–Q3/2021 Difference % Q3/2020 Q3/2021 Difference %
Zero-emission Generating Facilities 19.5 20.1 +0.6 +3% 6.4 6.7 +0.3 +4%
of which: nuclear 15.8 16.1 +0.3 +2% 5.0 5.2 +0.2 +4%
of which: renewables 3.7 4.0 +0.3 +8% 1.4 1.5 +0.1 +4%
Fossil-Fuel Generation 4.9 2.3 -2.5 -52% -0.4 -0.3 +0.1 +28%
Trading 2.5 2.1 -0.4 -16% -0.0 1.8 +1.8 —
Specific temporary effects 0.1 -0.9 -1.1 — -0.8 1.6 +2.4 —
Generation segment, total 26.9 23.5 -3.4 -13% 5.2 9.7 +4.5 +87%

15
Renewables (-1%) hydro, wind, solar, biomass, biogas
Czechia hydro (+11%)
Higher generation at hydroelectric power plants due to better-than-
average hydrometeorologic conditions
Germany—Wind (-24%)
Worse-than-average weather conditions
The effect of the outage of some turbines for necessary repairs
Czechia and Poland biomass (-18%)
Nuclear plants (-0%)
Longer outages at Dukovany nuclear power plant
Increased output of both units at Temelín NPP by 4 MWe
22.1 22.0
2.9 2.8
1-9/2020 1-9/2021
ELECTRICITY GENERATION FROM NUCLEAR FACILITIES AND RENEWABLES—EXISTING ASSETS
-0%
25.0 24.8-1%
-1%Renewables
Nuclear30.0 30.5
4.0 3.8
2020 2021 E
+2%
34.0 34.4+1%
-4%
Q1–Q3 (TWh) Outlook (TWh)
Renewables (-4%)
Czechia hydro (+4%)
Higher generation at hydroelectric power plants due to better-than-
average hydrometeorologic conditions
Germany—Wind (-14%)
Worse-than-average weather conditions
The effect of the outage of some turbines for necessary repairs
Czechia and Poland biomass (-39%)
End of support for the green certificate mechanism in Poland
Nuclear plants (+2%)
Shorter outages at the Dukovany nuclear power plant
Increased capacity at the Temelín nuclear power plant
+
–
–
+
–
+
+
–
–
+
–

Outlook (TWh)Q1–Q3 (TWh)
16
Natural gas–fired generation (-19%) Lower generation at the Počerady 2 power plant due to unfavorable development
of gas prices and emission allowances
Coal-fired generation—Czechia (-19%) Sale of the Počerady power plant on Dec 31, 2020 (-3.5 TWh)
Termination of the Prunéřov 1 power plant’s operation on Jun 30, 2020 (-0.6 TWh)
Longer outages at the Tušimice 2 power plant
Shorter outages at the Ledvice 4 and Prunéřov 2 power plants
Coal-fired generation in Poland (-7%) adverse impact of emission allowance prices
13.711.1
1.4
1.3
3.0
2.5
1-9/2020 1-9/2021
FOSSIL-FUEL ELECTRICITY GENERATIONEXISTING ASSETS
-19%
18.1
14.8-18%
-7%
-19%
Generation
from coal in
Czechia
Generation from
coal in Poland
Q1–Q3/2021Q1–Q3/2020
19.716.0
2.0
1.8
3.9
3.1
2020 2021 E
-19%
-18%
-8%
-20%
Natural gas–fired generation (-20%) Impact of unfavorable market prices for commodities and emission allowances
Coal-fired generation—Czechia (-19%) Sale of the Počerady power plant on Dec 31, 2020 (-4.9 TWh)
Termination of the Prunéřov 1 power plant’s operation on Jun 30, 2020 (-0.6 TWh)
Lower generation at the Mělník 3 power plant due to the termination of its operation
as at Aug 17, 2021
Longer outages at the Tušimice 2 power plant
Shorter outages at the Ledvice 4 and Prunéřov 2 power plants
Coal-fired generation in Poland (-8%) adverse impact of emission allowance prices
Generation
from natural gas
25.6
20.9
–
–
+
–
–
–
+
–
–
–
–

MINING SEGMENT EBITDAEXISTING ASSETS
EBITDA (CZK bn) Q1–Q3/2020 Q1–Q3/2021 Difference % Q3/2020 Q3/2021 Difference %
Czechia 2.4 3.1 +0.8 +32% 0.6 1.0 +0.4 +62%
Year-on-year effects in Q1–Q3:
Czechia (CZK +0.8 bn)
Higher revenues related to higher coal supplies to CEZ Group (CZK +0.8 bn)
Decrease in revenues from coal sales to external customers (CZK -0.1 bn)
Lower fixed operating costs of Severočeské doly (CZK +0.1 bn), in particular
lower costs for equipment maintenance and personnel costs
Year-on-year effects in Q3:
Czechia (CZK +0.4 bn)
Higher revenues related to higher coal
supplies to CEZ Group (CZK +0.3 bn)
Higher revenues from coal sales to external
customers (CZK +0.1 bn)
17
Mining volume (m tons) Q1–Q3/2020 Q1–Q3/2021 Difference % Q3/2020 Q3/2021 Difference %
Czechia 10.7 11.0 +0.3 +3% 2.9 3.3 +0.4 +15%

Summary Results and Selected Events
Performance of the Generation and Mining Segments
Performance of the Distribution and Sales Segments
CONTENTS
18

SUMMARY RESULTS OF THE DISTRIBUTION AND SALES SEGMENTS
Electricity distributed to end-use
customers (TWh) Q1–Q3/2020 Q1–Q3/2021 Diff %
Existing assets (Czechia) 25.3 27.0 +1.7 +7%
Divested assets* 11.6 6.8 -4.8 -41%
CEZ Group, total 36.8 33.7 -3.1 -8%
DISTRIBUTION segment
EBITDA (CZK bn) Q1–Q3/2020 Q1–Q3/2021 Diff %
Existing assets 12.9 13.6 +0.7 +6%
Divested assets* 3.1 1.7 -1.5 -47%
TOTAL SEGMENT EBITDA 16.0 15.3 -0.7 -5%
19* Companies sold in Romania (as at Mar 31, 2021) and Bulgaria (as at Jul 27, 2021)
SALES segment
EBITDA (CZK bn) Q1–Q3/2020 Q1–Q3/2021 Diff %
Existing assets 3.0 4.6 +1.6 +54%
Divested assets* 0.8 0.3 -0.4 -57%
TOTAL SEGMENT EBITDA 3.8 4.9 +1.2 +31%
Electricity sales to end-use
customers (TWh) Q1–Q3/2020 Q1–Q3/2021 Diff %
Existing assets 14.0 14.7 +0.7 +5%
Divested assets* 10.4 6.5 -3.9 -38%
CEZ Group, total 24.3 21.2 -3.2 -13%
Gas sales to end-use customers
(TWh) Q1–Q3/2020 Q1–Q3/2021 Diff %
Existing assets 5.2 4.4 -0.8 -15%
of which: Czechia 3.6 4.3 +0.6 +18%
Poland 0.3 0.0 -0.3 -100%
Slovakia 1.3 0.2 -1.1 -88%
Divested assets* 0.9 0.4 -0.5 -53%
CEZ Group, total 6.2 4.9 -1.3 -21%

DISTRIBUTION SEGMENT EBITDAEXISTING ASSETS
Year-on-year effects in Q1–Q3:Czechia (CZK +0.7 bn)
Higher gross margin on the electricity distribution (CZK +0.5 bn), especially higher
volume of distributed electricity
Higher revenue from activities to ensure input power and connection (CZK +0.4 bn)
Higher fixed operating expenses (CZK -0.2 bn)
EBITDA (CZK bn) Q1–Q3/2020 Q1–Q3/2021 Difference % Q3/2020 Q3/2021 Difference %
Czechia 12.9 13.6 +0.7 +6% 4.0 4.0 +0.0 +0%
Year-on-year effects in Q3:
Czechia (CZK +0.0 bn)
Higher revenue from activities to ensure input power and
connection (CZK +0.1 bn)
Higher fixed operating cost (CZK -0.1 bn)
20
Electricity distributed
to end customers (TWh) Q1–Q3/2020 Q1–Q3/2021 Difference % Q3/2020 Q3/2021 Difference %
Czechia 25.3 27.0 +1.7 +7% 7.8 7.9 +0.1 +2%

21
26.8 25.6 26.9
1-9/2019 1-9/2020 1-9/2021
Temperature- and calendar-adjusted
electricity consumption (TWh)Electricity distribution (TWh)
The recalculated consumption is based on the
internal model and volume of electricity
distributed by ČEZ Distribuce.
The volume of electricity distributed corresponds to the
total electricity consumption in the ČEZ Distribuce area.
16.0 14.6 15.4
6.97.2
8.1
3.53.4
3.4
1-9/2019 1-9/2020 1-9/2021
+6%
25.327.0+7%
+12%
+0%
Large customers
Residential
customers
Retail customers
(businesses)
+5%-5%
26.5
-9%
-5%
+4%
-2%
The company’s distribution area covers 66% of Czechia’s territory, so the data are a good indicator of total nationwide electricity consumption trends.
ELECTRICITY CONSUMPTION IN THE DISTRIBUTION AREA OF
ČEZ DISTRIBUCE INCREASED ABOVE THE 2019 LEVEL

SALES SEGMENT EBITDA—EXISTING ASSETS
* This includes Poland, Italy, and other countries where ESCO activities are managed by Elevion Group.
** These include mainly telecommunications companies, ČEZ Slovensko and other companies in the Sales segment.
Year-on-year effects in Q1–Q3:
Retail segment—ČEZ Prodej (CZK +0.9 bn)
Sales of commodities especially due to higher sales volume (CZK +0.6 bn)
Higher settlement of unbilled electricity (CZK +0.3 bn)
B2B segment—Energy Services—Germany and other countries* (CZK +0.2 bn)
Restored growth after the negative impact of Covid-19 on 2020, especially for
German companies Kofler and Elevion (CZK +0.2 bn)
B2B segment—Czech commodity sales (CZK +0.4 bn)
Especially the negative impact of Covid-19 on commodity sales in 2020
(CZK +0.3 bn)
B2B segment—Other activities** (CZK +0.2 bn)
ČEZ Slovensko (CZK +0.2 bn) negative impact of COVID-19 in 2020 and benefit
from the sale of the commodities portfolio as at Apr 1, 2021
EBITDA (CZK bn) Q1–Q3/2020 Q1–Q3/2021 Difference % Q3/2020 Q3/2021 Difference %
Retail segment—ČEZ Prodej 2.4 3.3 +0.9 +36% 0.6 0.7 +0.1 +15%
B2B segment—of which ESCO companies: 0.6 1.1 +0.5 +96% 0.0 0.2 +0.2 >200%
Energy Services—Czechia and Slovakia 0.4 0.4 -0.0 -11% -0.0 -0.0 +0.0 +63%
Energy Services—Germany and other countries* 0.3 0.5 +0.2 +76% -0.0 0.1 +0.1 —
Commodity Sales—Czechia -0.1 0.3 +0.4 — 0.0 0.1 +0.1 +71%
B2B segment—Other activities** 0.0 0.2 +0.2 >200% 0.0 0.1 +0.0 +30%
Total SALES Segment 3.0 4.6 +1.6 +54% 0.7 1.0 +0.3 +49%
Year-on-year effects in Q3:
Retail segment—ČEZ Prodej (CZK +0.1 bn)
Sales of commodities mainly due to higher sales volume (CZK +0.1 bn)
B2B segment—Energy Services—Germany and other countries*
(CZK + 0.1 bn)
Restored growth especially in Germany after the negative impact of
COVID-19
B2B segment—Czech commodity sales (CZK +0.1 bn)
Negative impact of COVID-19 on commodity sales in 2020
22

Electricity and gas supply increased by
13% year-on-year
(TWh)
Number of customers
stable year-on-year
(service points in thousands)
VOLUME OF ELECTRICITY AND GAS SOLD, AND THE NUMBER
OF CUSTOMERS
CZECHIA—RETAIL
Electricity and gas supplies
increased mainly due to the colder
winter in 2021.
In addition, the increase in the
volume of electricity sold was due
to higher residential customer
consumption in 2021 as a result of
COVID-19 measures.
The increase in natural gas volume
was further supported by the
acquisition of new customers, which
is also reflected in the overall
year-on-year increase in the
number of service points.
Overall, the number of service
points is stabilized, or more
precisely, increased by almost
4 thousand.2.3
2.7
5.66.2
1-9/2020 1-9/2021
+19%
7.98.9
+10%
Natural Gas
Electricity
+13%
437 456
2,416 2,402
30.9.2020 30.9.2021
+4%
2,854 2,858
-0%
+0%
23

Revenue outlook (CZK bn)
* This includes Poland, Italy, and other countries where ESCO activities are managed by Elevion Group.
24
REVENUE FROM ENERGY SERVICE SALES
EXISTING ASSETS
Revenues in Q1–Q3 (CZK bn)
Germany—Elevion Group (+8 %)
+ Organic growth increase despite the negative influence of COVID-19
Czechia and Slovakia—ČEZ ESCO group (+1%)
- Negative impact of Covid-19 on Q1 2021 (2020 affected only starting from Q3),
Q3 sales realized just below 2020 level
+ Acquisition driven growth
Other countries*—Elevion Group (-5%)
- Negative impact of Covid-19 on Q1 2021 (2020 only impacted starting from
Q3), Q3 sales realized 2% above the 2020 level.
Germany—Elevion Group (+8%)
+ Organic growth despite the negative influence of Covid-19
Czechia and Slovakia—ČEZ ESCO group (+9%)
+ Assumption of resumed organic growth and implementation
of orders deferred in connection to COVID-19
+ Acquisition driven growth
Other countries*—Elevion Group (+ 20%)
+ Assumption of resumed organic growth and implementation
of orders deferred in connection to COVID-19
+ Acquisition increase
2.2 2.1
4.4 4.4
9.5 10.3
1-9/2020 1-9/2021
-5%
16.1 16.8+4%
+1%
+8%
3.1 3.7
6.4 7.0
13.014.1
2020 2021 E
+20%
22.524.7
+10%
+9%
+8%
Germany
(Elevion Group)
Czechia and
Slovakia (ČEZ
ESCO group)
Other countries*
(Elevion Group)
+
+ +
–
–
+
+
+
+

Financial Performance and Investments
Operating revenues by segment and country
EBITDA for Q1–Q3 by segment and country
Net income for Q3
Investments in fixed assets (CAPEX)
Expected year-on-year change in EBITDA incl. change by segment
Development of Cash Flow, Debt, and Financial Exposure
Credit facilities and debt structure as at Sep 30
Cash flow (change in net debt for Q1–Q3)
Hedging against currency and commodity risks in generation in Czechia
Market Developments, Balance Sheet, and Other Information
Market Developments
Electricity Balance
Calculation of Alternative Indicators according to ESMA
ANNEXES
25

Czechia 81 %
Germany 6 %
Poland 3 %
Other 2 %
Bulgaria 6 %
Romania 3 %
26
OPERATING REVENUES FOR Q1–Q3—BY SEGMENT AND COUNTRYCEZ GROUP
Operating
revenues
by
country
DIVESTED
ASSETS
26
Operating revenues for Q1–Q3 2021GENERATION (CZK bn) Q1–Q3/2020 Q1–Q3/2021 Difference %
Czechia 72.2 79.7 +7.5 +10%
Germany 0.5 0.4 -0.1 -22%
Poland 4.7 4.1 -0.7 -14%
Romania 2.8 1.2 -1.7 -58%
Other Countries 1.7 2.2 +0.5 +30%
Intersegment eliminations -2.6 -2.2
Total 79.4 85.3 +5.9 +7%
DISTRIBUTION (CZK bn) Q1–Q3/2020 Q1–Q3/2021 Difference %
Czechia 25.0 25.2 +0.2 +1%
Romania 4.0 1.5 -2.6 -63%
Bulgaria 3.7 2.9 -0.7 -20%
Intersegment eliminations 0.0 0.0
Total 32.7 29.6 -3.1 -9%
MINING (CZK bn) Q1–Q3/2020 Q1–Q3/2021 Difference %
Czechia 6.2 7.0 +0.7 +12%
SALES (CZK bn) Q1–Q3/2020 Q1–Q3/2021 Difference %
Czechia 40.5 43.0 +2.5 +6%
Germany 9.7 10.4 +0.7 +7%
Romania 6.5 2.5 -4.0 -61%
Bulgaria 11.1 9.4 -1.7 -16%
Other Countries 4.9 2.9 -2.1 -42%
Intersegment eliminations -0.1 -0.1
Total 72.7 68.1 -4.6 -6%
Operating revenues (CZK bn) Q1–Q3/2021
GENERATION 85.3 45%
MINING 7.0 4%
DISTRIBUTION 29.6 16%
SALES 68.1 36%
Intersegment eliminations -34.0
Total 156.0
27
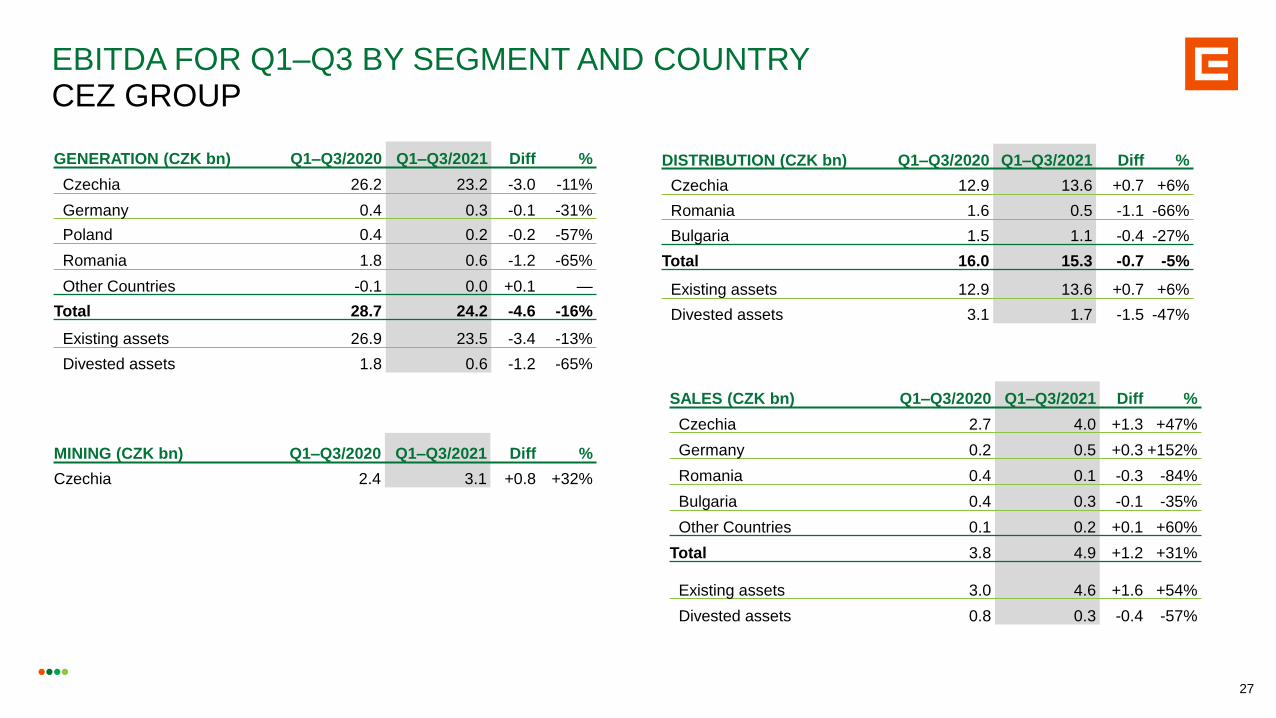
EBITDA FOR Q1–Q3 BY SEGMENT AND COUNTRYCEZ GROUP
GENERATION (CZK bn) Q1–Q3/2020 Q1–Q3/2021 Diff %
Czechia 26.2 23.2 -3.0 -11%
Germany 0.4 0.3 -0.1 -31%
Poland 0.4 0.2 -0.2 -57%
Romania 1.8 0.6 -1.2 -65%
Other Countries -0.1 0.0 +0.1 —
Total 28.7 24.2 -4.6 -16%
Existing assets 26.9 23.5 -3.4 -13%
Divested assets 1.8 0.6 -1.2 -65%
27
DISTRIBUTION (CZK bn) Q1–Q3/2020 Q1–Q3/2021 Diff %
Czechia 12.9 13.6 +0.7 +6%
Romania 1.6 0.5 -1.1 -66%
Bulgaria 1.5 1.1 -0.4 -27%
Total 16.0 15.3 -0.7 -5%
Existing assets 12.9 13.6 +0.7 +6%
Divested assets 3.1 1.7 -1.5 -47%
MINING (CZK bn) Q1–Q3/2020 Q1–Q3/2021 Diff %
Czechia 2.4 3.1 +0.8 +32%
SALES (CZK bn) Q1–Q3/2020 Q1–Q3/2021 Diff %
Czechia 2.7 4.0 +1.3 +47%
Germany 0.2 0.5 +0.3 +152%
Romania 0.4 0.1 -0.3 -84%
Bulgaria 0.4 0.3 -0.1 -35%
Other Countries 0.1 0.2 +0.1 +60%
Total 3.8 4.9 +1.2 +31%
Existing assets 3.0 4.6 +1.6 +54%
Divested assets 0.8 0.3 -0.4 -57%

(CZK bn) Q3/2020 Q3/2021 Difference %
EBITDA 12.2 15.9 +3.7 +30%
Depreciation and amortization -7.2 -7.9 -0.7 -10%
Impairments* -3.8 -0.4 +3.5 +91%
Other income (expenses) -2.0 -1.1 +0.9 +45%
Interest income (expenses) -1.1 -0.9 +0.2 +15%
Other -0.9 -0.2 +0.7 +81%
Income tax -0.3 -1.4 -1.1 >200%
Net income -1.1 5.1 +6.2 —
Adjusted net income 2.3 5.6 +3.3 +144%
NET INCOME FOR Q3—CEZ GROUP
* Including profit/loss from sales of tangible and intangible fixed assets
28
Depreciation, Amortization, and Impairments* (CZK +2.7 bn)
Lower impairments of fixed assets in Poland (CZK +1.6 bn), Romania (CZK +0.8 bn), Bulgaria (CZK +0.2 bn), Severočeské doly (CZK +0.3 bn), and Elektrárna
Dětmarovice (CZK +0.3 bn)
higher depreciation of existing assets (CZK -1.2 bn), including ČEZ, a. s. (CZK -1.5 bn), due to accelerated depreciation of coal-fired power plants reflecting the
deterioration of market and regulatory conditions for long-term operation of coal-fired power plants, lower depreciation of Severočeské doly (CZK +0.3 bn)
lower depreciation of divested assets (CZK +0.5 bn) due to the sale of Romanian (as at Mar 31, 2021) and Bulgarian companies (as at Jul 27, 2021)
Other Income and Expenses (CZK +0.9 bn)
Exchange rate effects and revaluating financial derivatives and securities (CZK +0.6 bn)
Lower interest expense (CZK +0.2 bn)
Net Income Adjustments
For Q3 2021, adjusted for the negative impact of the impairment of fixed assets of Severočeské doly (CZK +0.5 bn)
For Q3 2020, adjusted for the negative impact of impairment of fixed assets and goodwill write-off in Poland (CZK +1.4 bn), Czechia (CZK +1.0 bn), and
Romania (CZK +0.8 bn) and for the impact of impairment in Bulgaria (CZK +0.2 bn)

INVESTMENT IN FIXED ASSETS (CAPEX) CEZ GROUP
Existing assets
GENERATION segment—higher expenditure in 2021 mainly due to the acquisition of more nuclear fuel and nuclear materials
(impact of timing of deliveries); also higher investments at nuclear sites and higher IT investments (renewal of IT infrastructure and
license purchases)
DISTRIBUTION segment—year-on-year increase in investments in accordance with the gradual onset of increased investments
within the parameters of the 5th regulatory period (especially associated with the connection of customers and manufacturers)
SALES segment—mainly year-on-year increase in investment in Telco Pro Services group companies and investment in digitization
Divested assets—Romanian assets sold on Mar 31, 2021 and Bulgarian assets sold on Jul 27, 2021
CAPEX (CZK bn) Q1–Q3/2020 Q1–Q3/2021 Q3/2020 Q3/2021
GENERATION Segment 6.3 7.0 1.9 3.5
Of which: Nuclear fuel acquisition 1.3 2.0 0.2 0.8
MINING Segment 1.5 1.5 0.6 0.7
DISTRIBUTION Segment 8.1 8.7 3.1 3.1
SALES Segment 0.9 1.0 0.4 0.4
Existing Assets—TOTAL 16.8 18.2 6.0 7.6
Divested assets 2.2 1.1 0.8 0.0
TOTAL CEZ GROUP 18.9 19.3 6.8 7.7
29
Year-on-year effects in Q1–Q3:

56-57
57.9
EBITDA 2021 E
SALESsegment
DISTRIBUTION segment
MININGsegment
Fossil FuelFacilities
NuclearFacilities
Renewables
Trading
EBITDA 2020
GE
NE
RA
TIO
N
se
gm
en
t
-1.0 to 0.0
+0.3 to +0.7
+0.8 to +1.5
-5.0 to -4.2
+0.4 to +0.6
+0.3 to +0.7
+1.4 to +1.8
ESTIMATED YEAR-ON-YEAR CHANGE IN EBITDA
BY BUSINESS SEGMENT—EXISTING ASSETS
EXISTING ASSETS (CEZ Group excluding divested assets)
GENERATION Segment
Trading
Lower gain from commodity trading
Renewables
• Higher realization prices of electricity incl. hedging
Nuclear Facilities
• Higher realization prices of electricity incl. hedging
• Higher generation volume
• Increase in nuclear reserves due to a decrease in the real interest rate
Fossil-fuel Generation
Impact of market prices for natural gas, emission allowances, electricity, and
lower generation volumes on gross margin from generation in Czechia and Poland
• Lower revenue from sales of ancillary services
• Higher maintenance costs
MINING Segment
• Higher coal sales to CEZ Group
DISTRIBUTION Segment
• Positive effect of correction factors
• Effect of a new regulatory period on ČEZ Distribuce
SALES Segment
• Growth ambitions in ESCO services
• Negative effect of COVID-19 on ESCOs in 2020
+
(CZK bn)
+
+
—
—
—
—
+
+
+
—
—
+
30
EBITDA 2020
EBITDA 2021 E

0
5
10
15
20
25
202
1
202
2
202
3
202
4
202
5
202
6
202
8
203
0
203
2
203
8
203
9
204
2
204
7
EURCZK JPY USD
CZK bn
Bond Maturity Profile (as at Sep 30, 2021)Utilization of Short-Term Lines and Available Committed
Credit Facilities (as at Sep 30, 2021)
⚫ Committed facilities are kept as a reserve for covering unexpected
expenses and to fund short-term financial needs.
⚫ CEZ Group has access to a total of CZK 40 bn in committed credit
facilities, having drawn CZK 8.6 bn as at Sep 30, 2021. Use of credit
facilities is primarily related to higher margin deposits on commodity
exchanges following a high increase of electricity market prices.
⚫ The payment of dividends for 2020 (CZK 28 billion) began on
August 2, 2021. 99% of the amount awarded was paid by
Sep 30, 2021.
* The available credit facilities include the undrawn portion of the long-term EIB loan (EUR 100 m).
Available
credit
facilities*
Undrawn,
Commited
CZK 31.4 bn
Drawn
Committed
CZK 8.6 bn
Drawn
Uncommitted
CZK 4.4 bn
EUR 541 m duly repaid on
Oct 19, 2021
CREDIT FACILITIES AND DEBT STRUCTURE AS AT SEP 30CEZ GROUP
Debt Level
By Sep 30, 2020 By Sep 30, 2021
Debt and loans CZK bn 171.6 141.2
Cash and fin. assets** CZK bn 10.1 11.5
Net debt CZK bn 161.5 129.8
Net debt / EBITDA*** 2.4 2.1
** Cash and Cash Equivalents & Highly Liquid Financial Assets*** The indicator includes EBITDA from already sold Romanian and Bulgarian assets in the amount of CZK 3.8 bn. Not including this EBITDA in the calculation, the indicator would be 2.3.
31

NET DEBT DECREASED BY ALMOST CZK 14 BN IN Q1–Q3CEZ GROUP
143.5 129.8+47.5 -5.2
-16.2-21.2
+34.9 -27.6
+1.5
Net debtas at
December 31,2020 EBITDA
Interest,income tax
Otheroperating
effectsAcquisition offixed assets
Divestments/acquisitions Dividends Other
Net debtas at
September 30,2021
Interest, income taxes (CZK -5.2 bn): income taxes paid (CZK -2.3 bn), balance of interest paid and received (CZK -2.9 bn)
Other operating effects (CZK -16.2 bn): time arbitrage transactions on carbon allowances (CZK -10.2 billion), margin deposits related to
increase of market prices of electricity in 2021 and hedging of credit risks (CZK -6.4 bn), other effects (CZK +0.4 bn)
Acquisition of fixed assets (CZK -21.2 bn): acquisition of fixed assets (CAPEX) for the period (CZK -19.3 bn), change in liabilities from
fixed asset acquisition (CZK -1.1 bn), change in equity securities (CZK -0.7 bn)
Divestments/acquisitions (CZK +34.9 bn): sale of Romanian assets (CZK +24.6 bn), sale of Bulgarian assets (CZK +9.5 bn), sale of a
stake in ESCO Slovensko (CZK +0.8 bn), sales price installment of Počerady (CZK +0.7 bn), on the other hand, acquisitions mainly of ESCO
companies (CZK -0.8 bn)
Other (CZK +1.5 bn): mainly revaluation of bonds and bank loans
2.2 2.1*
Decrease in net debt by CZK 13.7 bn
Net debt / Annual EBITDA
32* the indicator includes annual EBITDA from already sold Romanian and Bulgarian assets in the amount of CZK 3.8 bn. Not including this annual EBITDA in the calculation, the indicator would be 2.3.

33
CURRENCY AND COMMODITY HEDGING OF ELECTRICITY GENERATION IN CZECHIA FOR 2022–2025
2022 2023 2024 2025
33
2022 2023 2024 2025 100% of expected deliveries
Total share of hedged deliveries 79% 49% 21% 4% 44 to 47 TWh per year
Emission-free sources (nuclear and ČEZ RES)* 85% 56% 24% 6% 29 to 31 TWh per year
Emission facilities—medium-term hedged* 77% 52% 22% — 10 to 13 TWh per year
Emission facilities—other fuels** 53% — — — 4 to 5 TWh per year
Commodity hedges of expected electricity deliveries from generation in Czechia (as of Sep 30)
Currency Hedges of Expected Revenues from Electricity Generation in Czechia (as at Sep 30)
* hedged over a 3-year horizon
** gas and selected coal-fired resources which, due to the nature of generation and market conditions, are hedged only on an annual / intra-annual basis
Total currency hedges
(natural & transactional) as at Sep 30, 2021
Natural currency hedging (debt in EUR, capital
and other expenditure and costs in EUR)
95% 95% 95% 95%
76% 87% 53% 90%
The currency position for 2022–2025 is hedged at CZK 25.4–26.1/EUR, the currency position for 2021 at CZK 27.1/EUR.

10
30
50
70
EUR / t
300
500
700
900
CZK
34
MARKET DEVELOPMENTS FROM JAN 1, 2020, TO SEP 30, 2021
CO2 emissions allowances
(to be delivered in December 2022) CEZ shares
Coal and gasElectricity
(BL to be delivered in 2022 and 2023)
0
55
110
165
220
20
75
130
185
240
EUR/MWhUSD / t
coal front month coal forward 2022 gas front month gas forward 2022
30
60
90
120
150
EUR / MWh
forward 2022 forward 2023
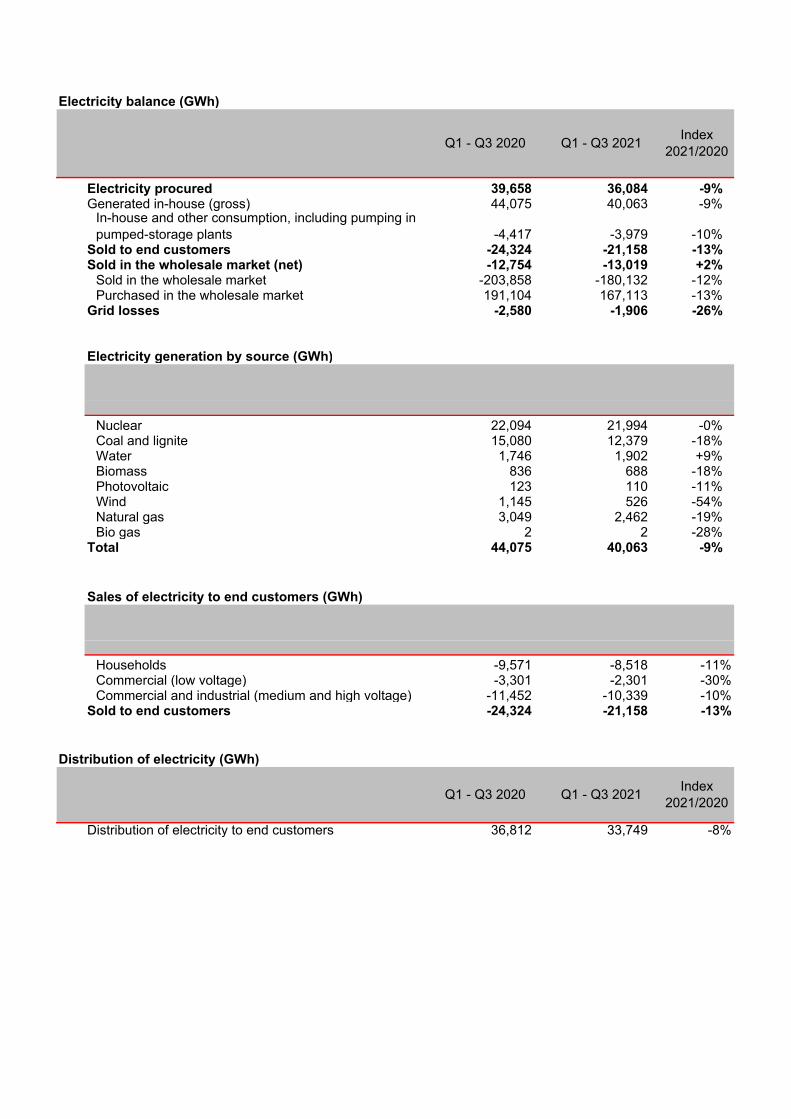
Electricity balance (GWh)
Electricity procured 39,658 36,084 -9%Generated in-house (gross) 44,075 40,063 -9%
In-house and other consumption, including pumping in pumped-storage plants -4,417 -3,979 -10%
Sold to end customers -24,324 -21,158 -13%Sold in the wholesale market (net) -12,754 -13,019 +2%
Sold in the wholesale market -203,858 -180,132 -12%Purchased in the wholesale market 191,104 167,113 -13%
Grid losses -2,580 -1,906 -26%
Electricity generation by source (GWh)
Nuclear 22,094 21,994 -0%Coal and lignite 15,080 12,379 -18%Water 1,746 1,902 +9%Biomass 836 688 -18%Photovoltaic 123 110 -11%Wind 1,145 526 -54%Natural gas 3,049 2,462 -19%Bio gas 2 2 -28%
Total 44,075 40,063 -9%
Sales of electricity to end customers (GWh)
Households -9,571 -8,518 -11%Commercial (low voltage) -3,301 -2,301 -30%Commercial and industrial (medium and high voltage) -11,452 -10,339 -10%
Sold to end customers -24,324 -21,158 -13%
Distribution of electricity (GWh)
Distribution of electricity to end customers 36,812 33,749 -8%
Q1 - Q3 2020 Q1 - Q3 2021Index
2021/2020
Q1 - Q3 2020 Q1 - Q3 2021Index
2021/2020

Electricity balance (GWh) by segment
Q1 - Q3 2021
GWh +/- GWh +/- GWh +/- GWh +/- GWh +/-
Electricity procured 35,840 -9% 0 - 244 +9% 0 - 36,084 -9%Generated in-house (gross) 39,808 -9% 0 - 255 +10% 0 - 40,063 -9%In-house and other consumption, including pumping in pumped-storage plants -3,968 -10% 0 - -11 +18% 0 - -3,979 -10%
Sold to end customers -1,738 -9% 0 - -20,644 -13% 1,224 -3% -21,158 -13%Sold in the wholesale market (net) -34,103 -9% 1,906 -26% 20,401 -13% -1,224 -3% -13,019 +2%
Sold in the wholesale market -192,899 -11% 0 - -3,530 -9% 16,297 -4% -180,132 -12%Purchased in the wholesale market 158,797 -11% 1,906 -26% 23,930 -12% -17,521 -4% 167,113 -13%
Grid losses 0 - -1,906 -26% 0 - 0 - -1,906 -26%
Electricity generation by source (GWh) by segment
GWh +/- GWh +/- GWh +/- GWh +/- GWh +/-Nuclear 21,994 -0% 0 - 0 - 0 - 21,994 -0%Coal and lignite 12,379 -18% 0 - 0 - 0 - 12,379 -18%Water 1,902 +9% 0 - 0 - 0 - 1,902 +9%Biomass 688 -18% 0 - 0 - 0 - 688 -18%Photovoltaic 110 -11% 0 - 0 - 0 - 110 -11%Wind 526 -54% 0 - 0 - 0 - 526 -54%Natural gas 2,207 -22% 0 - 255 +10% 0 - 2,462 -19%Bio gas 2 -28% 0 - 0 - 0 - 2 -28%
Total 39,808 -9% 0 - 255 +10% 0 - 40,063 -9%
Sales of electricity to end customers (GWh) by segment
GWh +/- GWh +/- GWh +/- GWh +/- GWh +/-Households 0 - 0 - -8,518 -11% 0 - -8,518 -11%Commercial (low voltage) -6 -79% 0 - -2,295 -30% 0 - -2,301 -30%Commercial and industrial (medium and high voltage) -1,732 -8% 0 - -9,832 -9% 1,224 -3% -10,339 -10%
Sold to end customers -1,738 -9% 0 - -20,644 -13% 1,224 -3% -21,158 -13%
CEZ Group
Generation Distribution Sale Eliminations CEZ Group
EliminationsGeneration Distribution Sale
CEZ GroupEliminationsGeneration Distribution Sale

Electricity balance (GWh) by country
Q1 - Q3 2021
GWh +/- GWh +/- GWh +/- GWh +/- GWh +/- GWh +/- GWh +/- GWh +/-
Electricity procured 34,236 -7% 1,300 -17% 388 -60% 3 -42% 157 -24% 0 - 0 - 36,084 -9%Generated in-house (gross) 37,992 -8% 1,517 -15% 394 -60% 3 -42% 157 -24% 0 - 0 - 40,063 -9%In-house and other consumption, including pumping in pumped-storage plants -3,756 -10% -217 -6% -6 -55% 0 - 0 - 0 - 0 - -3,979 -10%
Sold to end customers -13,409 +9% -118 -53% -1,045 -61% -5,417 -30% 0 - -1,168 -14% 0 - -21,158 -13%Sold in the wholesale market (net) -19,574 -15% -1,182 -10% 924 -60% 5,801 -29% -157 -24% 1,168 -14% 0 - -13,019 +2%
Sold in the wholesale market -180,682 -11% -1,425 -21% -378 -65% -176 -44% -157 -24% -55 -24% 2,741 -17% -180,132 -12%Purchased in the wholesale market 161,108 -11% 243 -50% 1,302 -61% 5,977 -30% 0 - 1,223 -15% -2,741 -17% 167,113 -13%
Grid losses -1,253 -15% 0 - -267 -54% -387 -27% 0 - 0 - 0 - -1,906 -26%
Electricity generation by source (GWh) by country
GWh +/- GWh +/- GWh +/- GWh +/- GWh +/- GWh +/- GWh +/- GWh +/-Nuclear 21,994 -0% 0 - 0 - 0 - 0 - 0 - 0 - 21,994 -0%Coal and lignite 11,107 -19% 1,272 -7% 0 - 0 - 0 - 0 - 0 - 12,379 -18%Water 1,864 +11% 8 +56% 30 -44% 0 - 0 - 0 - 0 - 1,902 +9%Biomass 452 +6% 237 -42% 0 - 0 - 0 - 0 - 0 - 688 -18%Photovoltaic 106 -9% 0 - 0 - 3 -42% 0 - 0 - 0 - 110 -11%Wind 5 -11% 0 - 364 -61% 0 - 157 -24% 0 - 0 - 526 -54%Natural gas 2,462 -19% 0 - 0 - 0 - 0 - 0 - 0 - 2,462 -19%Bio gas 2 -28% 0 - 0 - 0 - 0 - 0 - 0 - 2 -28%
Total 37,992 -8% 1,517 -15% 394 -60% 3 -42% 157 -24% 0 - 0 - 40,063 -9%
Sales of electricity to end customers (GWh) by country
GWh +/- GWh +/- GWh +/- GWh +/- GWh +/- GWh +/- GWh +/- GWh +/-Households -5,506 +11% 0 - -509 -61% -2,502 -24% 0 - 0 - 0 - -8,518 -11%Commercial (low voltage) -1,398 -3% -5 -81% -235 -62% -634 -43% 0 - -28 -73% 0 - -2,301 -30%Commercial and industrial (medium and high voltage) -6,505 +10% -113 -49% -301 -60% -2,281 -31% 0 - -1,139 -10% 0 - -10,339 -10%
Sold to end customers -13,409 +9% -118 -53% -1,045 -61% -5,417 -30% 0 - -1,168 -14% 0 - -21,158 -13%
Distribution of electricity (GWh) by country
Q1 - Q3 2021GWh +/- GWh +/- GWh +/- GWh +/- GWh +/- GWh +/- GWh +/- GWh +/-
Distribution of electricity to end customers 26,951 +7% 0 - 1,773 -62% 5,025 -26% 0 - 0 - 0 - 33,749 -8%
Others
Czechia Poland
Czechia Poland
Czechia Poland
Eliminations CEZ GroupCzechia Poland Romania Bulgaria Germany
Romania Bulgaria CEZ GroupOthers EliminationsGermany
Romania Bulgaria Others
Germany
Germany
Romania Bulgaria Others Eliminations CEZ Group
Eliminations CEZ Group

Definitions and Calculations of Indicators Unspecified in IFRS
Definitions and Calculations of Indicators Unspecified in IFRS
In accordance with ESMA guidelines, ČEZ provides detailed information on indicators that are not reported as standard in IFRS financial reporting framework or the components of which are not directly available from financial statements and accompanying notes to the financial statements. Such indicators represent supplementary information in respect of financial data, providing reports’ users with additional information for their assessment of the financial position and performance of CEZ Group or ČEZ. In general, these indicators are also commonly used in other commercial companies, not only in the energy sector.
Indicator
Adjusted Net Income (After-Tax Income, Adjusted)
Purpose: This is a supporting indicator, intended primarily for investors, creditors, and shareholders, which allows interpreting achieved financial results with the exclusion of extraordinary, usually nonrecurring effects that are generally unrelated to ordinary financial performance and value creation in a given period.
Definition: Net income (after-tax income) +/− additions to and reversals of impairments of property, plant, and equipment and intangible assets (including goodwill write-off) +/− additions to and reversals of impairments of developed projects +/− other extraordinary effects that are generally unrelated to ordinary financial performance and value creation in a given period +/− effects of the above on income tax.
Net Debt Purpose: The indicator shows the real level of a company’s financial debt, i.e., the carrying amount of debt net of cash, cash equivalents, and highly liquid financial assets held. The indicator is primarily used to assess the overall appropriateness of the indebtedness, e.g., in comparison with selected profit or balance sheet indicators.
Definition: Long-Term Debt, Net of Current Portion + Current Portion of Long-Term Debt + Short-Term Loans – (Cash and Cash Equivalents + Highly Liquid Financial Assets).
The components of the indicator, except for Highly Liquid Financial Assets, are reported individually on the balance sheet, with items related to assets held for sale are presented separately on the balance sheet.
Net Debt / EBITDA Purpose: This indicates a company’s capability to pay back its debt as well as its ability to take on additional debt to grow its business. CEZ Group uses this indicator primarily to assess the adequacy of its capital structure to the structure and stability of its expected cash flows.
Definition: Net Debt / EBITDA. Net Debt is the amount at the end of the reported period. EBITDA is the running total for the past 12 months, i.e. as at September 30 and EBITDA for the period from October 1 of previous year until September 30 of current year.

Definitions and Calculations of Indicators Unspecified in IFRS
Most of the components used in the calculation of individual indicators are directly shown in financial statements. The components of calculations that are not included in the financial statements are usually shown directly in a company’s books and are calculated as follows:
Highly Liquid Financial Assets—component of Net Debt indicator (CZK billions):
As at Dec 31, 2020
As at Sep 30, 2021
Current debt financial assets 0.1 0.0Non-current debt financial assets 0.0 0.0Current term deposits 2.8 3.2Non-current term deposits 0.0 0.0Short-term equity securities 0.0 0.3Highly liquid financial assets, total 2.9 3.4
Adjusted Net Income indicator—calculation for periods in question:
Adjusted Net Income (After-Tax Income, Adjusted) Unit Q1–Q3 2020 Q1–Q3 2021
Net income CZK billions 13.6 6.7
Impairments of property, plant, and equipment and intangible assets (including goodwill write-off)1)
CZK billions 5.7 12.2
Impairments of developed projects2) CZK billions - -
Effects of additions to or reversals of impairments on income tax3)
CZK billions (0.6) (0.3)
Other extraordinary effects4) CZK billions - (1.7)
Adjusted net income CZK billions 18.7 16.9
1) Corresponds to the total value reported in the row Impairment of Property, Plant and Equipment and Intangible Assets in the Consolidated Statement of Income
2) Included in the row Other operating expenses in the Consolidated Statement of Income 3) Included in the row Income taxes in the Consolidated Statement of Income 4) The adjustment consists of a correction of adjustment of the net income by the part of impairments of property,
plant, and equipment and intangible assets (including the related effect on income taxes) that relates—based on its characteristics—to the current year. This item represents impairments of non-current assets in 2021 of sold companies in Romania and Bulgaria, which reflect that net income for this period —taking into account the “Locked-box date” as defined in agreements for the sale of assets—belongs effectively to purchasers.
Totals and subtotals can differ from the sum of partial values due to rounding.