Embed Size (px)
Citation preview

Investor Briefing
Q3
No. 298 | OCTOBER 24, 2017
Contents
Investor Briefing
Consolidated Results 3
Business Solutions 5
Entertainment Group 7
Consumer Mobility 9
International 10
AT&T Mobility 11
Highlights 14
Q3
Financial and Operational Information 17
27Discussion and Reconciliation of Non-GAAP Measures
Consolidated Results 3
Business Solutions 5
Entertainment Group 7
Consumer Mobility 9
International 10
AT&T Mobility 11
Highlights 14
CONTENTS
Q3
3
Investor Briefing
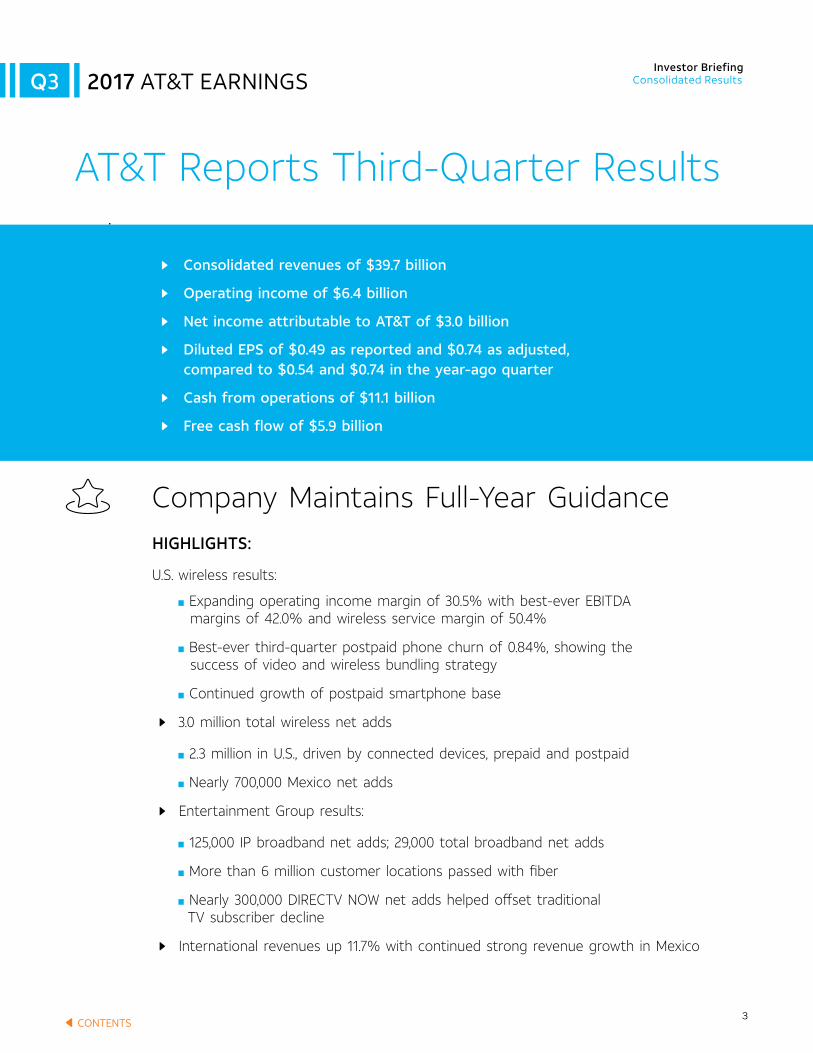
AT&T Reports Third-Quarter Results
Nj Consolidated revenues of $39.7 billion
Nj Operating income of $6.4 billion
Nj Net income attributable to AT&T of $3.0 billion
Nj Diluted EPS of $0.49 as reported and $0.74 as adjusted, compared to $0.54 and $0.74 in the year-ago quarter
Nj Cash from operations of $11.1 billion
Nj Free cash flow of $5.9 billion
Consolidated Results
HIGHLIGHTS: U.S. wireless results:
Expanding operating income margin of 30.5% with best-ever EBITDA margins of 42.0% and wireless service margin of 50.4%
Best-ever third-quarter postpaid phone churn of 0.84%, showing the success of video and wireless bundling strategy
Continued growth of postpaid smartphone base
Nj 3.0 million total wireless net adds
2.3 million in U.S., driven by connected devices, prepaid and postpaid
Nearly 700,000 Mexico net adds
Nj Entertainment Group results:
125,000 IP broadband net adds; 29,000 total broadband net adds
More than 6 million customer locations passed with fiber
Nearly 300,000 DIRECTV NOW net adds helped offset traditional TV subscriber decline
Nj International revenues up 11.7% with continued strong revenue growth in Mexico
Company Maintains Full-Year Guidance

CONTENTS
Q3
Third-quarter net income attributable to AT&T totaled $3.0 billion, or $0.49 per diluted share, compared with $3.3 billion, or $0.54 per diluted share, in the year-ago quarter. Adjusting for $0.25 of costs for amortization, merger- and integration-related expenses and other items including hurricane and earthquake impacts, earnings per diluted share was $0.74, the same as in the year-ago quarter.
Cash from operating activities was $11.1 billion in the third quarter and $29.3 billion year to date. Capital expenditures were $5.3 billion in the quarter and $16.5 billion year to date. Free cash flow — cash from operating activities minus capital expenditures — was $5.9 billion for the quarter and $12.8 billion year to date.
4
Investor BriefingConsolidated Results
CONSOLIDATED FINANCIAL RESULTS
AT&T's consolidated revenues for the third quarter totaled $39.7 billion versus $40.9 billion in the year-ago quarter, primarily due to declines in legacy wireline services and consumer mobility. Excluding the impact of hurricanes and earthquakes in the third quarter, revenues would have been $39.8 billion. Compared with results for the third quarter of 2016, operating expenses were $33.3 billion versus $34.5 billion; operating income was flat versus the year-ago quarter at $6.4 billion; and operating income margin was 16.1% versus 15.7%. When adjusting for amortization, merger- and integration-related expenses and other items, operating income was $8.1 billion versus $8.3 billion in the year-ago quarter and operating income margin was 20.3%, the same as in the year-ago quarter.
v vv
Cash from OperationsI N B I L L I O N S
Free Cash Flow Capital Expenditures
$3.2 $3.7 $5.9
$6.0 $5.2 $5.3
1Q17 2Q17 3Q17
$9.2 $8.9
$11.1
$5.2 $3.7
$5.8 $6.5
3Q16
$11.0
4Q16
$10.1
Adjusted Earnings Per Share
REPORTED:
1Q17 2Q17 3Q17
$0.56 $0.63 $0.49
3Q16
$0.74
4Q16
$0.66
$0.54 $0.39
$0.74$0.79
$0.74
Consolidated RevenuesI N B I L L I O N S
1Q17 2Q17 3Q17
$39.4 $39.8 $39.7$41.8
3Q16
$40.9
4Q16

BUSINESS WIRELESS FINANCIAL RESULTS
Business wireless revenues were down year over year at $9.7 billion primarily due to lower equipment revenues.
Nj Wireless service revenues were down 0.2% year over year, reflecting fewer migrations from consumer plans and customer shifts to unlimited data plans.
BUSINESS WIRELINE FINANCIAL RESULTS
In business wireline, declines in legacy products were partially offset by continued growth in strategic business services. Continued weakness in business fixed investment along with technology transitions also impacted results. Total business wireline revenues were $7.4 billion, down 6.0% year over year.
Nj Strategic business services, the wireline capabilities that lead AT&T’s most advanced business solutions — including VPNs, Ethernet, cloud, hosting, IP conferencing, voice over IP, dedicated internet, IP broadband and security services — continued its solid performance. Revenues grew by $174 million, or 6.0%, versus the year-earlier quarter. These services represent 42% of total business wireline revenues and an annualized revenue stream of more than $12 billion. This growth helped offset a decline of more than $600 million in legacy services in the quarter.
The Business Solutions segment provides both wireless and wireline services to business customers and wireless services to individual subscribers who participate through employer-sponsored plans. AT&T's wireless and wired networks provide complete communications solutions to these customers. AT&T’s business customer revenues include results from enterprise, public sector, wholesale and small/midsize customers.
5
FINANCIAL HIGHLIGHTS
Total third-quarter revenues from business customers were $17.1 billion, down 4.0% versus the year-earlier quarter due to declines in legacy wireline and wireless equipment.
Nj Growth in strategic business services helped offset declines in legacy wireline services and wireless sales.
Nj Third-quarter operating expenses were $12.6 billion, down 6.7% versus the third quarter of 2016. Operating income totaled $4.5 billion, up 4.6% year over year with cost efficiencies, fewer wireless equipment upgrades and lower depreciation expenses more than offsetting declines in legacy services.
Nj Third-quarter operating income margin was 26.4%, up 220 basis points year over year with growth in IP revenues and increased cost efficiencies more than offsetting declines in higher-margin legacy services.
Investor Briefing
CONTENTS
Business Solutions
Q3
$16.8 $17.1
Revenues & EBITDA MarginI N B I L L I O N S
Revenues EBITDA EBITDA Margin
$6.7 $6.8 $6.8
39.6% 39.7% 40.0%
2Q17 3Q17
$6.8 $6.3
38.5% 34.9%
3Q16
$17.8
4Q16 1Q17
$18.0$17.1
6
Investor BriefingBusiness Solutions
CONTENTS
Q3
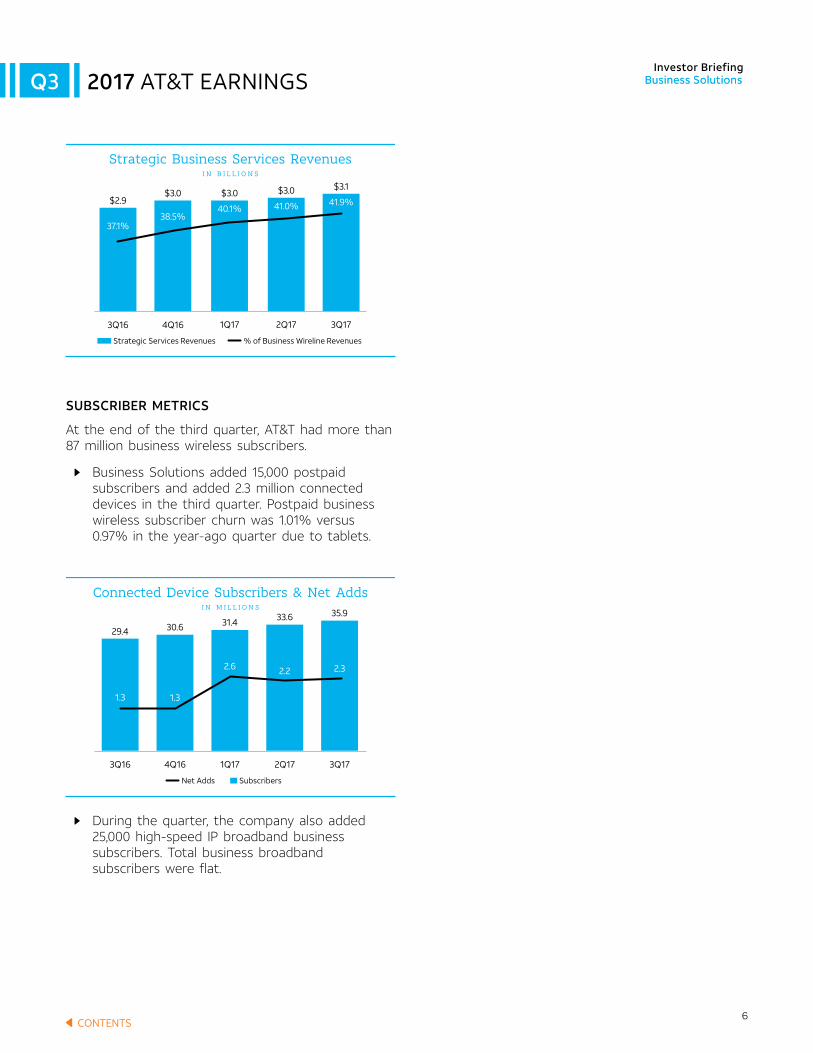
SUBSCRIBER METRICS
At the end of the third quarter, AT&T had more than 87 million business wireless subscribers.
Nj Business Solutions added 15,000 postpaid subscribers and added 2.3 million connected devices in the third quarter. Postpaid business wireless subscriber churn was 1.01% versus 0.97% in the year-ago quarter due to tablets.
Nj During the quarter, the company also added 25,000 high-speed IP broadband business subscribers. Total business broadband subscribers were flat.
Business Solutions
Strategic Business Services RevenuesI N B I L L I O N S
Strategic Services Revenues % of Business Wireline Revenues
40.1% 41.0% 41.9%
1Q17 2Q17 3Q17
$3.0 $3.0 $3.1
3Q16 4Q16
37.1%
$2.9
38.5%
$3.0
Connected Device Subscribers & Net AddsI N M I L L I O N S
SubscribersNet Adds
2.6 2.2 2.3
1Q17 2Q17 3Q17
31.4 33.6 35.9
3Q16 4Q16
1.3 1.3
29.4 30.6
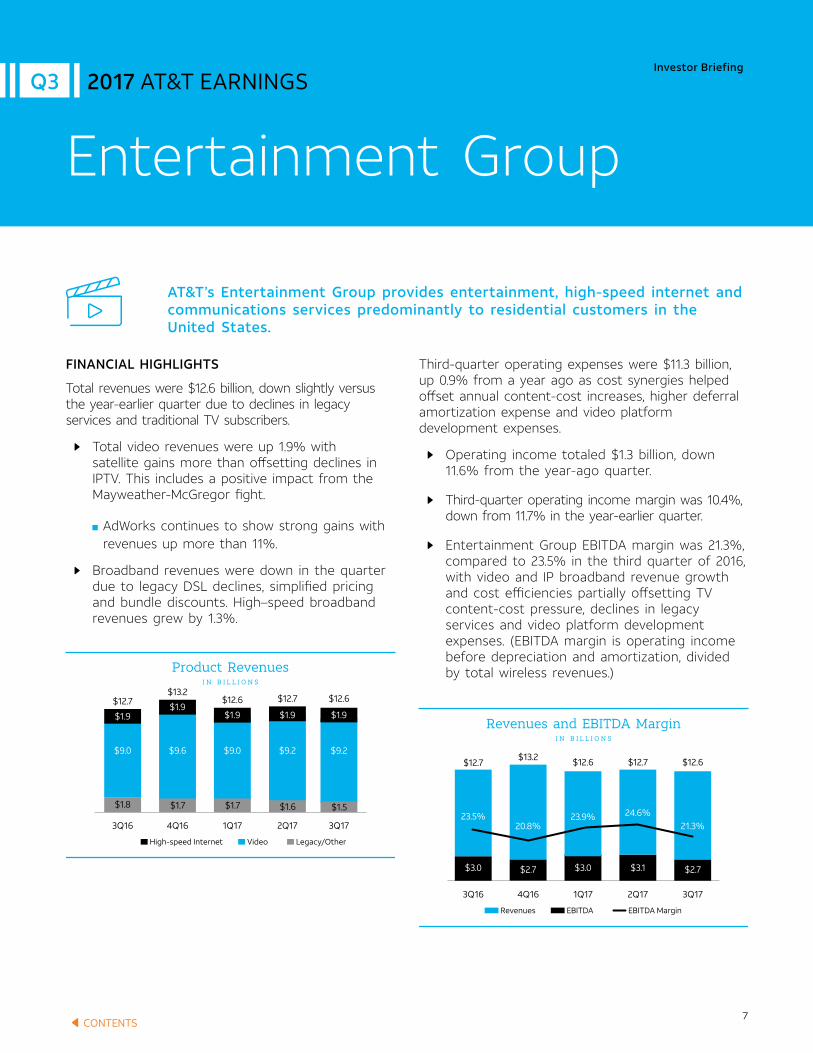
FINANCIAL HIGHLIGHTS
Total revenues were $12.6 billion, down slightly versus the year-earlier quarter due to declines in legacy services and traditional TV subscribers.
Nj Total video revenues were up 1.9% with satellite gains more than offsetting declines in IPTV. This includes a positive impact from the Mayweather-McGregor fight.
AdWorks continues to show strong gains with revenues up more than 11%.
Nj Broadband revenues were down in the quarter due to legacy DSL declines, simplified pricing and bundle discounts. High–speed broadband revenues grew by 1.3%.
7
Third-quarter operating expenses were $11.3 billion, up 0.9% from a year ago as cost synergies helped offset annual content-cost increases, higher deferral amortization expense and video platform development expenses.
Nj Operating income totaled $1.3 billion, down 11.6% from the year-ago quarter.
Nj Third-quarter operating income margin was 10.4%, down from 11.7% in the year-earlier quarter.
Nj Entertainment Group EBITDA margin was 21.3%, compared to 23.5% in the third quarter of 2016, with video and IP broadband revenue growth and cost efficiencies partially offsetting TV content-cost pressure, declines in legacy services and video platform development expenses. (EBITDA margin is operating income before depreciation and amortization, divided by total wireless revenues.)
AT&T’s Entertainment Group provides entertainment, high-speed internet and communications services predominantly to residential customers in the United States.
Investor Briefing
CONTENTS
Entertainment Group
Q3
Product RevenuesI N B I L L I O N S
Video Legacy/OtherHigh-speed Internet
$9.0 $9.2 $9.2
$1.7 $1.6 $1.5
$1.9 $1.9 $1.9
1Q17 2Q17 3Q17
$12.6 $12.7 $12.6
$9.0 $9.6
$1.8
$1.9
$1.7
3Q16
$12.7
4Q16
$13.2
$1.9
$3.0 $3.1 $2.7
23.9% 24.6%21.3%
$12.6 $12.7 $12.6
Revenues and EBITDA MarginI N B I L L I O N S
Revenues EBITDA EBITDA Margin
1Q17 2Q17 3Q17
$3.0 $2.7
23.5%20.8%
3Q16
$12.7
4Q16
$13.2
CONTENTS
Q3
8
Investor BriefingEntertainment Group
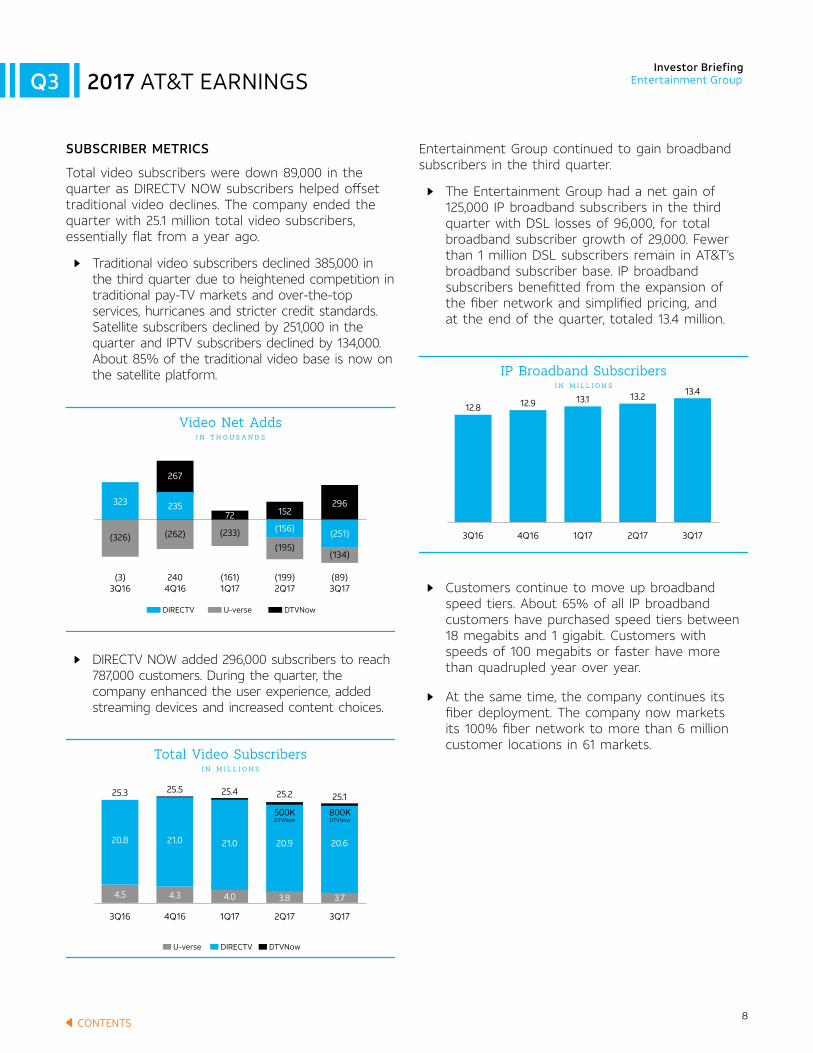
Entertainment Group continued to gain broadband subscribers in the third quarter.
Nj The Entertainment Group had a net gain of 125,000 IP broadband subscribers in the third quarter with DSL losses of 96,000, for total broadband subscriber growth of 29,000. Fewer than 1 million DSL subscribers remain in AT&T’s broadband subscriber base. IP broadband subscribers benefitted from the expansion of the fiber network and simplified pricing, and at the end of the quarter, totaled 13.4 million.
Nj Customers continue to move up broadband speed tiers. About 65% of all IP broadband customers have purchased speed tiers between 18 megabits and 1 gigabit. Customers with speeds of 100 megabits or faster have more than quadrupled year over year.
Nj At the same time, the company continues its fiber deployment. The company now markets its 100% fiber network to more than 6 million customer locations in 61 markets.
SUBSCRIBER METRICS
Total video subscribers were down 89,000 in the quarter as DIRECTV NOW subscribers helped offset traditional video declines. The company ended the quarter with 25.1 million total video subscribers, essentially flat from a year ago.
Nj Traditional video subscribers declined 385,000 in the third quarter due to heightened competition in traditional pay-TV markets and over-the-top services, hurricanes and stricter credit standards. Satellite subscribers declined by 251,000 in the quarter and IPTV subscribers declined by 134,000. About 85% of the traditional video base is now on the satellite platform.
Nj DIRECTV NOW added 296,000 subscribers to reach 787,000 customers. During the quarter, the company enhanced the user experience, added streaming devices and increased content choices.
Total Video SubscribersI N M I L L I O N S
DIRECTV DTVNowU-verse
4.0 3.8 3.7
21.0 20.9 20.6
1Q17 2Q17 3Q17
25.4 25.2 25.1
4.5 4.3
20.8 21.0
3Q16
25.3
4Q16
25.5
500KDTVNow
800KDTVNow
IP Broadband SubscribersI N M I L L I O N S
1Q17 2Q17 3Q17
13.1 13.2 13.4
3Q16 4Q16
12.8 12.9
Video Net AddsI N T H O U S A N D S
DIRECTV U-verse DTVNow
(233)
(161)1Q17
(326) (262)(195)
(134)
323 235
267
(156) (251)
152296
(3)3Q16
240 4Q16
(199)2Q17
(89)3Q17
72

SUBSCRIBER METRICS
At the end of the third quarter, AT&T had 51.4 million Consumer Mobility subscribers.
Nj In the quarter, Consumer Mobility added 14,000 total subscribers with 324,000 prepaid and 102,000 postpaid net adds offsetting a loss of 394,000 reseller and 18,000 connected device subscribers. Effective July 1, 2017, we are reporting prepaid Internet of Things (IoT) connections as a separate class within our prepaid category. These connections primarily relate to customers who actively subscribe for vehicle connectivity. This resulted in 97,000 additional prepaid net adds in the quarter with a prepaid base increase of 543,000 connections and a corresponding decline in the connected device base reflecting subscriber activity prior to the third quarter.
Nj Consumer Mobility postpaid churn was 1.17%, down from 1.19% in the year-ago quarter. Consumer Mobility postpaid phone churn was 0.93% versus 1.03% in the year-ago quarter.
FINANCIAL HIGHLIGHTS
Total revenues from Consumer Mobility customers totaled $7.7 billion, down 6.3% versus the year-earlier quarter, reflecting lower equipment revenues and lower postpaid service revenues mostly due to migrations to business plans.
Nj Third-quarter operating expenses were $5.4 billion, down 4.7% versus the third quarter of 2016, reflecting lower volumes, increased cost efficiencies and lower depreciation expense.
Nj AT&T’s Consumer Mobility operating income totaled $2.3 billion, down 9.8% versus the third quarter of 2016. Third-quarter operating income margin was 29.9%, down 120 basis points from the year-earlier quarter with lower volumes, increased cost efficiencies and lower depreciation expense partially offsetting revenue pressure.
Nj Consumer Mobility EBITDA margin was 41.3%, compared to 42.5% in the third quarter of 2016. EBITDA service margin was 49.1%, compared to 50.9% in the year-ago quarter. (EBITDA service margin is operating income before depreciation and amortization, divided by total service revenues.)
Consumer Mobility
The Consumer Mobility segment provides nationwide wireless service to consumer and wholesale subscribers located in the United States and in U.S. territories. The company’s wireless network powers voice and data services, including high-speed internet, video entertainment and home monitoring services.
Investor Briefing
CONTENTS9
Q3
EBITDA Service Margin
1Q17 2Q17 3Q17
48.6% 50.1% 49.1%
3Q16
50.9%
4Q16
46.1%
Prepaid Net AddsI N T H O U S A N D S
1Q17 2Q17 3Q17*
282267
324
3Q16
304
4Q16
406
*Eff ective July 1, 2017 we prospectively reclassifi ed prepaid internet of things (IoT) connections from connected devices to prepaid.

10
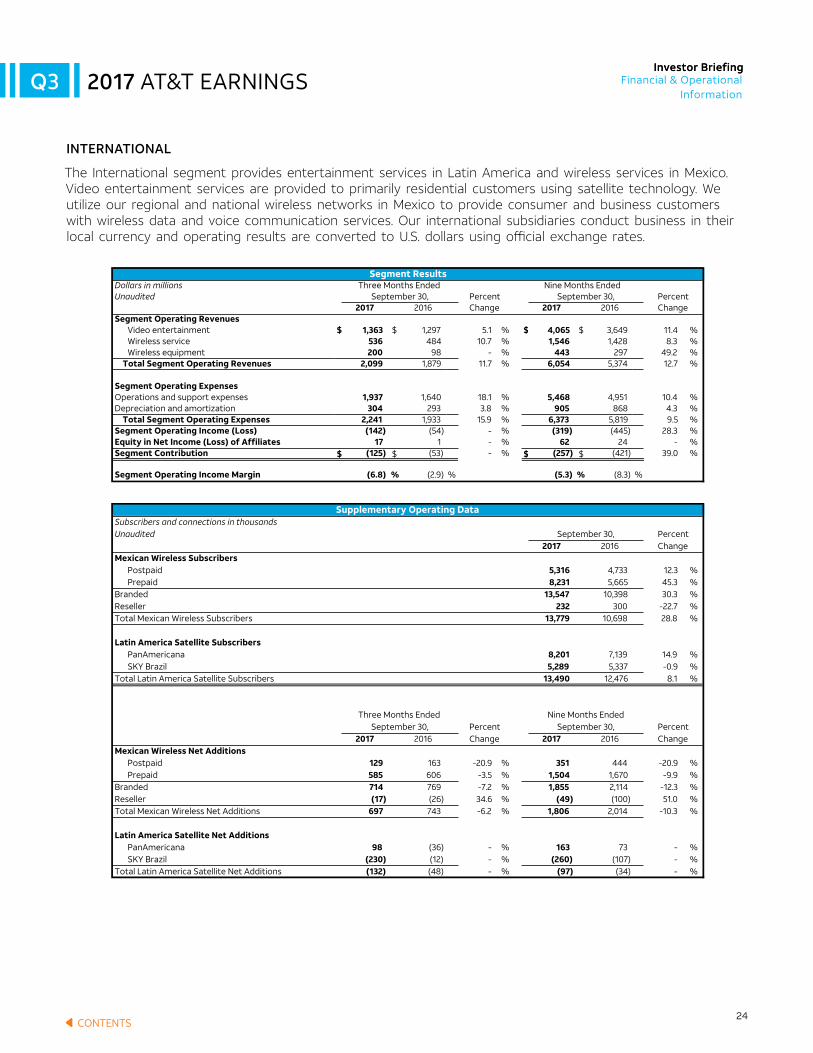
Total International revenues totaled $2.1 billion, up from $1.9 billion in the year-ago quarter. Third-quarter operating expenses were $2.2 billion. AT&T’s International operating loss totaled ($142 million), compared to ($54 million) in the year-ago third quarter. Third-quarter operating income margin was (6.8)%.
MEXICO
AT&T owns and operates a wireless network in Mexico. AT&T covered more than 90 million people in Mexico with 4G LTE at the end of the third quarter and expects to cover approximately 100 million POPs by the end of 2018.
Nj Wireless revenues from Mexico were $736 million, up 26.5% versus the year-earlier quarter, largely due to subscriber growth, which was partially offset by competitive pricing.
Nj Third-quarter operating loss was $224 million compared to a loss of $148 million in the year-ago quarter, reflecting additional customer acquisition expenses, foreign exchange and one-time items in the year-ago quarter.
Nj In the quarter, AT&T added 129,000 postpaid subscribers and 585,000 prepaid subscribers to reach 13.8 million total wireless subscribers in Mexico, a 29% increase from a year ago.
DIRECTV LATIN AMERICA
DIRECTV Latin America revenues reflect price increases driven by macroeconomic conditions with mixed local currencies. Total revenues from Latin America were $1.4 billion, up 5.1%. Operating income was $82 million.
Nj Third-quarter subscriber net losses were 132,000 with prepaid losses in Brazil offsetting gains in other countries. Total subscribers at the end of the quarter were 13.5 million. Sky Mexico had approximately 8.0 million subscribers as of June 30, 2017.
The International segment includes wireless services in Mexico and satellite entertainment services in Latin America. AT&T is a leading provider of pay television services in Latin America with satellite operations serving Argentina, Brazil, Chile, Colombia, Ecuador, Peru, Uruguay, Venezuela and parts of the Caribbean. The company also owns 41% of Sky Mexico. Sky Mexico financial results are accounted for as an equity-method investment.
Investor Briefing
CONTENTS
International
Q3
RevenuesI N B I L L I O N S
Latin America Mexico Wireless
$1.3 $1.4 $1.4
$0.6 $0.7 $0.7
1Q17 2Q17 3Q17
$1.9 $2.0 $2.1
$1.3
$0.6
$1.3
$0.6
3Q16
$1.9
4Q16
$1.9Wireless Subscribers - Mexico
I N M I L L I O N S
Postpaid Prepaid Other
7.27.6
8.2
5.1 5.25.3
1Q17 2Q17 3Q17
12.613.1 13.8
3Q16 4Q16
5.76.7
4.75.0
12.00.3
0.2 0.2
10.70.3
0.3
11
FINANCIAL HIGHLIGHTS
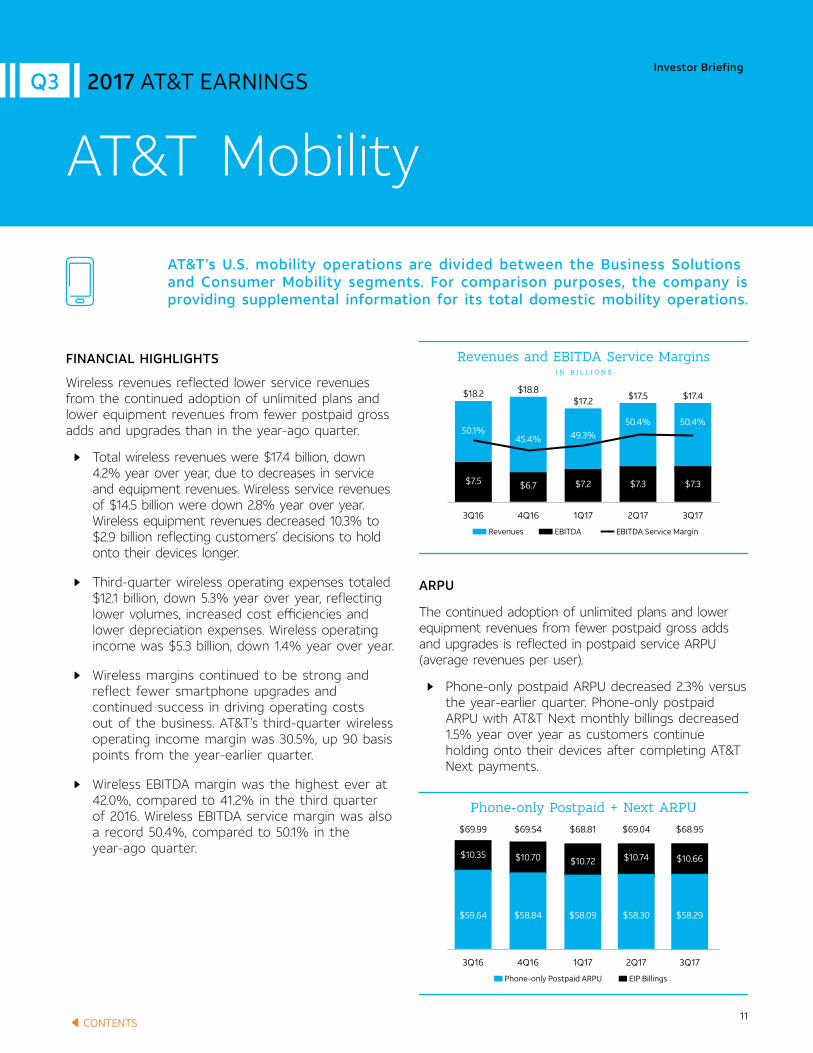
Wireless revenues reflected lower service revenues from the continued adoption of unlimited plans and lower equipment revenues from fewer postpaid gross adds and upgrades than in the year-ago quarter.
Nj Total wireless revenues were $17.4 billion, down 4.2% year over year, due to decreases in service and equipment revenues. Wireless service revenues of $14.5 billion were down 2.8% year over year. Wireless equipment revenues decreased 10.3% to $2.9 billion reflecting customers’ decisions to hold onto their devices longer.
Nj Third-quarter wireless operating expenses totaled $12.1 billion, down 5.3% year over year, reflecting lower volumes, increased cost efficiencies and lower depreciation expenses. Wireless operating income was $5.3 billion, down 1.4% year over year.
Nj Wireless margins continued to be strong and reflect fewer smartphone upgrades and continued success in driving operating costs out of the business. AT&T’s third-quarter wireless operating income margin was 30.5%, up 90 basis points from the year-earlier quarter.
Nj Wireless EBITDA margin was the highest ever at 42.0%, compared to 41.2% in the third quarter of 2016. Wireless EBITDA service margin was also a record 50.4%, compared to 50.1% in the year-ago quarter.
ARPU
The continued adoption of unlimited plans and lower equipment revenues from fewer postpaid gross adds and upgrades is reflected in postpaid service ARPU (average revenues per user).
Nj Phone-only postpaid ARPU decreased 2.3% versus the year-earlier quarter. Phone-only postpaid ARPU with AT&T Next monthly billings decreased 1.5% year over year as customers continue holding onto their devices after completing AT&T Next payments.
AT&T’s U.S. mobility operations are divided between the Business Solutions and Consumer Mobility segments. For comparison purposes, the company is providing supplemental information for its total domestic mobility operations.
Investor Briefing
CONTENTS
AT&T Mobility
Q3
Revenues and EBITDA Service MarginsI N B I L L I O N S
Revenues EBITDA EBITDA Service Margin
$7.2 $7.3 $7.3
49.3%50.4% 50.4%
1Q17 2Q17 3Q17
$17.2 $17.5 $17.4
$7.5 $6.7
50.1%45.4%
3Q16
$18.2
4Q16
$18.8
Phone-only Postpaid + Next ARPU
Phone-only Postpaid ARPU EIP Billings
1Q17 2Q17 3Q17
$58.09
$68.81
$10.72
$58.30 $58.29
$69.04 $68.95
$10.74 $10.66
$59.64
$10.35
$58.84
3Q16
$69.99
4Q16
$69.54
$10.70
CONTENTS
Q3
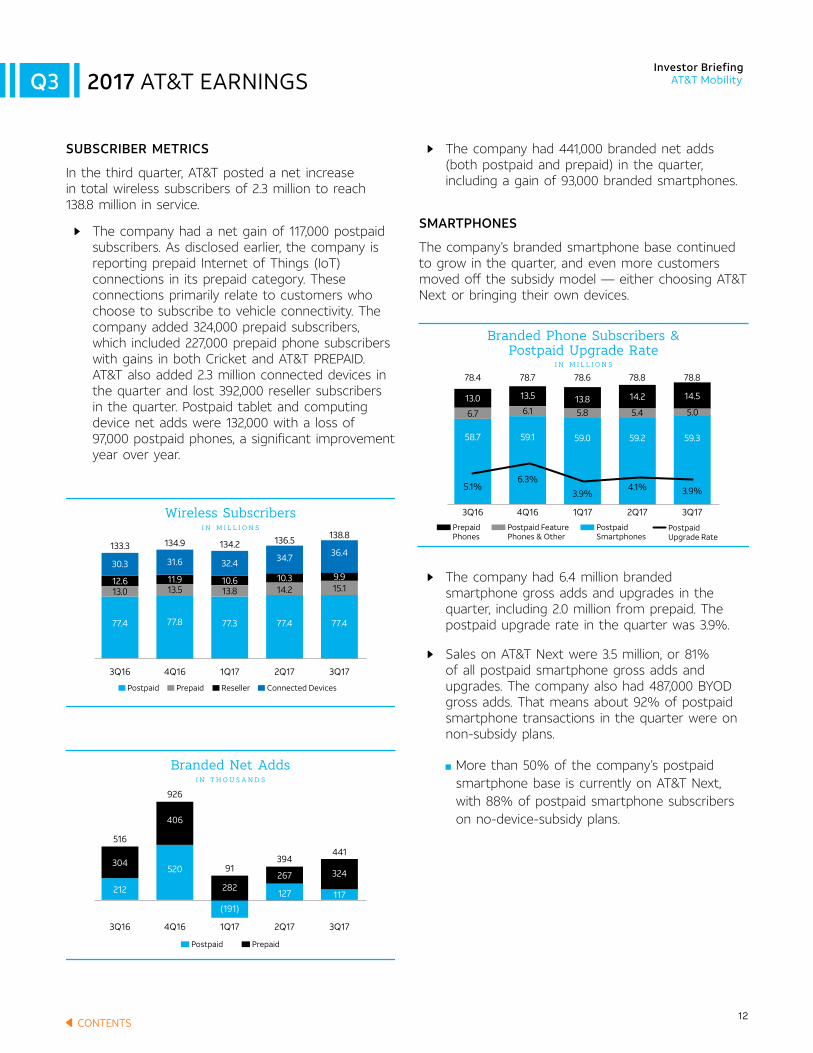
Nj The company had 441,000 branded net adds (both postpaid and prepaid) in the quarter, including a gain of 93,000 branded smartphones.
SMARTPHONES
The company’s branded smartphone base continued to grow in the quarter, and even more customers moved off the subsidy model — either choosing AT&T Next or bringing their own devices.
Nj The company had 6.4 million branded smartphone gross adds and upgrades in the quarter, including 2.0 million from prepaid. The postpaid upgrade rate in the quarter was 3.9%.
Nj Sales on AT&T Next were 3.5 million, or 81% of all postpaid smartphone gross adds and upgrades. The company also had 487,000 BYOD gross adds. That means about 92% of postpaid smartphone transactions in the quarter were on non-subsidy plans.
More than 50% of the company’s postpaid smartphone base is currently on AT&T Next, with 88% of postpaid smartphone subscribers on no-device-subsidy plans.
SUBSCRIBER METRICS
In the third quarter, AT&T posted a net increase in total wireless subscribers of 2.3 million to reach 138.8 million in service.
Nj The company had a net gain of 117,000 postpaid subscribers. As disclosed earlier, the company is reporting prepaid Internet of Things (IoT) connections in its prepaid category. These connections primarily relate to customers who choose to subscribe to vehicle connectivity. The company added 324,000 prepaid subscribers, which included 227,000 prepaid phone subscribers with gains in both Cricket and AT&T PREPAID. AT&T also added 2.3 million connected devices in the quarter and lost 392,000 reseller subscribers in the quarter. Postpaid tablet and computing device net adds were 132,000 with a loss of 97,000 postpaid phones, a significant improvement year over year.
12
Investor BriefingAT&T Mobility
Wireless SubscribersI N M I L L I O N S
Postpaid Prepaid Reseller Connected Devices
32.4 34.7 36.4
10.6 10.3 9.9
13.8 14.2 15.1
77.3 77.4 77.4
1Q17 2Q17 3Q17
134.2 136.5 138.8
30.3
12.6
31.6
11.913.0
77.4
13.5
77.8
3Q16
133.3
4Q16
134.9
Branded Net AddsI N T H O U S A N D S
Postpaid Prepaid
(191)
282
1Q17
91
212 127 117
304267 324520
406
3Q16 2Q17 3Q17
516
394441
4Q16
926
Branded Phone Subscribers &Postpaid Upgrade Rate
I N M I L L I O N S
Postpaid Feature Phones & Other
PrepaidPhones
Postpaid Upgrade Rate
Postpaid Smartphones
1Q17 2Q17 3Q17
59.0 59.2 59.3
5.8 5.4 5.013.8 14.2 14.5
78.6 78.8 78.8
3.9%4.1% 3.9%
58.7 59.1
6.7
13.06.1
13.5
3Q16
78.4
4Q16
78.7
5.1%6.3%

CONTENTS
Q3
13
Investor Briefing
CHURN
Postpaid churn was 1.07%, up slightly from the year-ago quarter due to higher tablet churn. Postpaid phone churn was a record low for a third quarter of 0.84%, compared to 0.90% in the year-ago quarter. Branded churn was 1.70%, compared to 1.63% in the year-ago quarter. Total churn was 1.32%, down from 1.45% in the year-ago quarter.
AT&T Mobility
1.12%
1.01% 1.07%
Postpaid Churn
Postpaid Churn Postpaid Phone Churn
0.90%0.79% 0.84%
1Q17 2Q17 3Q17
0.90%0.98%
3Q16
1.05%
4Q16
1.16%
14
In recent weeks, AT&T:
NATURAL DISASTER RESPONSE
Nj Kept customers connected to their friends, family and businesses through Hurricanes Harvey, Irma, Nate and Maria, multiple earthquakes in Mexico and wildfires across Northern California. The company deployed its fleet of network recovery technologies as needed, including drones, Cell on Wheels, Cell on Light Trucks, emergency communication vehicles and portable and fixed generators. During these recent natural disasters, AT&T provided unlimited calls, texts and data for its affected customers. Additionally, the company established multiple text-to-donate programs for consumers and internal giving campaigns for its employees to support recovery efforts.
WIRELESS
Nj Expanded “HBO for Life” to new and existing AT&T Unlimited Choice customers, letting all customers with AT&T Unlimited Choice or AT&T Unlimited Plus enjoy HBO included in their wireless plan.
Nj Increased the company’s offerings of 5G Evolution capable devices, expanding its portfolio to include the Motorola Z2 Force Edition, LG V30, Samsung Galaxy S8 Active and Samsung Galaxy Note8.
Nj Introduced World Connect Advantage as its lead international long distance offer, letting customers make unlimited wireless calls to landline numbers in 70 countries and wireless numbers in 36 of those countries for only $15 a month.
Nj Was named Best-in-Class in Forrester’s 2017 U.S. Customer Experience Index (CX IndexTM) for the company’s Cricket Wireless brand.1
ENTERTAINMENT
Nj Introduced and began beta testing the company’s next-generation video platform that will eventually support its video delivery services. The beta platform includes exciting new features such as Cloud DVR.
Nj Launched Fixed Wireless Internet availability across 9 additional states: Arkansas, California, Illinois, Indiana, Kansas, Michigan, Ohio, Texas and Wisconsin. The service is now available to more than 160,000 locations across 18 states. This is part of the company’s FCC Connect America Fund commitment to serve more than 1.1 million locations by 2020.
Investor Briefing
CONTENTS
AT&T helps millions around the globe connect with leading entertainment, mobile, high-speed internet and voice services. The company is one of the world’s largest providers of pay TV with customers in the U.S. and 11 Latin American countries. And it helps businesses worldwide serve their customers better with mobility and highly secure cloud solutions.
Highlights
Q3
1 Best In Class Status = Cricket Wireless received a Best In Class ranking (a top-15 brand) among all 314 brands covered in Forrester’s proprietary 2017 US CX Index™ survey. The ranking was based on responses from 118,992 US individuals ages 18 to 88. The proprietary survey results are based on consumers’ opinions of their experiences with the brands in the survey. Forrester Research does not endorse any company included in any CX Index™ report and does not advise any person to select the products or services of any particular company based on the ratings included in such reports.

Q3
15
Investor Briefing
Nj Signed a contract to modernize the U.S. Army’s communications. We’re providing collaboration capabilities to support 1 million users worldwide.
Nj Introduced, on a limited availability basis, a new cloud-to-cloud feature for AT&T NetBond® for Cloud that efficiently moves workloads across highly secure connections between public, private and hybrid cloud services in the NetBond for Cloud ecosystem. By implementing this feature, a business can connect each ecosystem cloud — private or public — to another over a private AT&T MPLS VPN connection.
Nj Formed a cross-carrier alliance, the Mobile Authentication Taskforce, to address mobile authentication issues currently facing the industry and consumers. Comprised of AT&T, Verizon, T-Mobile and Sprint, the taskforce will collaborate to develop an innovative identity authentication solution.
Nj Announced plans for AT&T Asset Management-Operations Center – a new cloud-enabled IoT solution connecting to multiple devices and multiple cloud infrastructures for tracking, monitoring and managing deployed IoT assets.
Nj Announced that AT&T will offer unlimited data plans for in-vehicle 4G LTE Wi-Fi hotspots in 2018 Honda Odyssey minivans and 2018 Chrysler Pacifica minivans.
Nj Was selected by Omnicom Group to deploy a universal global network solution that will increase efficiencies and deliver an added level of security for the company and its clients.
INTERNATIONAL
Nj Maintained the most reliable voice and data network in Mexico and the largest high-speed 4G LTE network in North America, covering over 400 million people and businesses. AT&T now covers more than 90 million people in Mexico, up from 78 million at the end of 2016.
Nj Successfully performed LTE-M pilots in Tijuana and Puebla, including the first LTE-M international data session between the United States and Mexico. AT&T is on track to deploy LTE-M across its network in Mexico by the end of 2017.
Nj Expanded the company’s 100% fiber network powered by AT&T Fiber to parts of Biloxi-Gulfport, Miss., Columbus, Ga., Lafayette, La., Macon, Ga., Montgomery, Ga. and Savannah Ga. Ultra-fast speeds are now available in parts of 61 metros with plans to reach at least 14 more metros. AT&T now markets the ultra-fast service to more than 6 million locations. The company plans to reach at least 7 million locations by the end of 2017.
Nj Announced the additions of CBS and SHOWTIME to the DIRECTV NOW platform and added more than 80 new local affiliate stations, for a total of more than 180 live local channels. The company now offers at least one live local channel to more than 75% of U.S. households as of October 23, 2017.
Nj Debuted Mr. Mercedes, a new original series based on Stephen King’s best-selling detective novel, on AT&T AUDIENCE Network to critical acclaim and strong audience reception.
Nj Hosted AT&T SHAPE, an immersive tech and entertainment expo in Hollywood that explored the convergence of technology and entertainment. More than 10,000 registered to attend this flagship event, which featured speakers, interactive demos and hands-on creation activities.
BUSINESS
Nj Continued to gain FirstNet momentum to support public safety communications needs. To date, 27 states and territories have announced their decisions to opt-in to the FirstNet network. On Sept. 29, FirstNet started the 90-day timeline for undecided states to make their decision to opt in or out of the FirstNet network.
Nj Announced an innovative strategic collaboration between Walt Disney World Resort and AT&T to develop an interactive mobile application proof of concept. It is designed to improve response to a work order as drawings, procedures, maintenance manuals and other important information are auto loaded onto Disney employees' tablets as they arrive at the site of a service request.
Highlights
CONTENTS
Q3
16
Investor Briefing
CONTENTS
AT&T INVESTOR BRIEFING
The AT&T Investor Briefing is published by the Investor Relations staff of AT&T Inc. Requests for further information may be directed to one of the Investor Relations managers by phone at 210-351-3327.
Correspondence should be sent to: Investor Relations AT&T Inc. 208 S. Akard Street Dallas, TX 75202
Email address: [email protected]
Senior Vice President-Investor Relations Mike Viola
Investor Relations Staff Jamie Anderson Tim Bever Michael Black Jeston Dumas Kent Evans Matt Gallaher Martin Sheehan Chris Womack
FOURTH-QUARTER 2017 EARNINGS DATE: JANUARY 31, 2018
AT&T will release fourth-quarter 2017 earnings on January 31, 2018, after the market closes.
The company’s Investor Briefing and related earnings materials will be available on the AT&T website at https://investors.att.com by 4:30 p.m. Eastern time.
AT&T will also host a conference call to discuss the results at 4:30 p.m. Eastern time the same day. Dial-in and replay information will be announced on First Call approximately 8 weeks before the call, which will also be broadcast live and will be available for replay over the internet at https://investors.att.com.
CAUTIONARY LANGUAGE CONCERNING FORWARD-LOOKING STATEMENTS
Information set forth in this Investor Briefing contains financial estimates and other forward-looking statements that are subject to risks and uncertainties, and actual results may differ materially. A discussion of factors that may affect future results is contained in AT&T’s filings with the Securities and Exchange Commission. AT&T disclaims any obligation to update or revise statements contained in this Investor Briefing based on new information or otherwise.
This Investor Briefing may contain certain non-GAAP financial measures. Reconciliations between the non-GAAP financial measures and the GAAP financial measures are included in the exhibits to the Investor Briefing and are available on the company’s website at https://investors.att.com.

Business Solutions
CONTENTS
Investor Briefing
17
Investor Briefing
CONTENTS
AT&T INC. FINANCIAL DATA
2017 2016 2017 2016
Service $ 36,378 $ 37,272 -2.4 % $ 109,372 $ 111,515 -1.9 % Equipment 3,290 3,618 -9.1 % 9,498 10,430 -8.9 %
39,668 40,890 -3.0 % 118,870 121,945 -2.5 %
4,191 4,455 -5.9 % 12,177 13,090 -7.0 %5,284 4,909 7.6 % 15,156 14,239 6.4 %
9,431 9,526 -1.0 % 27,714 28,436 -2.5 %8,317 9,013 -7.7 % 24,917 26,363 -5.5 %6,042 6,579 -8.2 % 18,316 19,718 -7.1 %
33,265 34,482 -3.5 % 98,280 101,846 -3.5 %6,403 6,408 -0.1 % 20,590 20,099 2.4 %
(1,686) (1,224) 37.7 % (4,374) (3,689) 18.6 %11 16 -31.3 % (148) 57 - %
246 (7) - % 354 154 - %4,974 5,193 -4.2 % 16,422 16,621 -1.2 %1,851 1,775 4.3 % 5,711 5,803 -1.6 %3,123 3,418 -8.6 % 10,711 10,818 -1.0 %
(94) (90) 4.4 % (298) (279) 6.8 %$ 3,029 $ 3,328 -9.0 % $ 10,413 $ 10,539 -1.2 %
$ 0.49 $ 0.54 -9.3 % $ 1.69 $ 1.70 -0.6 %
6,162 6,168 -0.1 % 6,164 6,171 -0.1 %
$ 0.49 $ 0.54 -9.3 % $ 1.69 $ 1.70 -0.6 %
6,182 6,189 -0.1 % 6,184 6,191 -0.1 %
AT&T Inc.Financial Data
Consolidated Statements of Income
Dollars in millions except per share amounts Three Months Ended Nine Months Ended
Unaudited September 30, Percent September 30, Percent
Change Change
Operating Revenues
Total Operating Revenues
Operating Expenses Cost of services and sales Equipment Broadcast, programming and operations Other cost of services (exclusive of depreciation
Selling, general and administrative Depreciation and amortization Total Operating ExpensesOperating IncomeInterest ExpenseEquity in Net Income (Loss) of AffiliatesOther Income (Expense) - NetIncome Before Income Taxes Income Tax ExpenseNet Income Less: Net Income Attributable to
Net Income Attributable to AT&T
Basic Earnings Per Share Attributable to AT&T Weighted Average Common
Diluted Earnings Per Share Attributable to AT&T Weighted Average Common
Financial & Operational Information
Q3

18
Investor Briefing
CONTENTS
Q3Investor Briefing
CONTENTS
Financial & Operational Information
Sep. 30, Dec. 31,2017 2016
$ 48,499 $ 5,788 15,876 16,794
1,258 1,555 10,724 14,232 76,357 38,369
126,462 124,899 105,668 105,207
96,071 94,176 11,573 14,243 7,775 8,441 1,627 1,674
18,332 16,812 $ 443,865 $ 403,821
$ 8,551 $ 9,832 28,928 31,138
4,503 4,519 2,703 2,079 3,008 3,008
47,693 50,576 154,728 113,681
64,381 60,128 31,231 33,578 19,723 21,748
115,335 115,454
6,495 6,495 89,527 89,604 36,074 34,734 (12,716) (12,659)
5,580 4,961 1,149 975
126,109 124,110 $ 443,865 $ 403,821
AT&T Inc.Financial Data
Consolidated Balance SheetsDollars in millions Unaudited
AssetsCurrent AssetsCash and cash equivalentsAccounts receivable - net of allowances for doubtful accounts of $741 and $661Prepaid expensesOther current assetsTotal current assetsProperty, Plant and Equipment - NetGoodwillLicensesCustomer Lists and Relationships - NetOther Intangible Assets - NetInvestments in Equity AffiliatesOther AssetsTotal Assets
Liabilities and Stockholders' EquityCurrent LiabilitiesDebt maturing within one yearAccounts payable and accrued liabilitiesAdvanced billing and customer depositsAccrued taxesDividends payableTotal current liabilitiesLong-Term DebtDeferred Credits and Other Noncurrent LiabilitiesDeferred income taxesPostemployment benefit obligationOther noncurrent liabilitiesTotal deferred credits and other noncurrent liabilities
Accumulated other comprehensive incomeNoncontrolling interestTotal stockholders' equityTotal Liabilities and Stockholders' Equity
Stockholders' EquityCommon stock Additional paid-in capitalRetained earningsTreasury stock
AT&T INC. FINANCIAL DATA
19
Investor Briefing
CONTENTS
Q3
CONTENTS
2017 2016
$ 10,711 $ 10,818
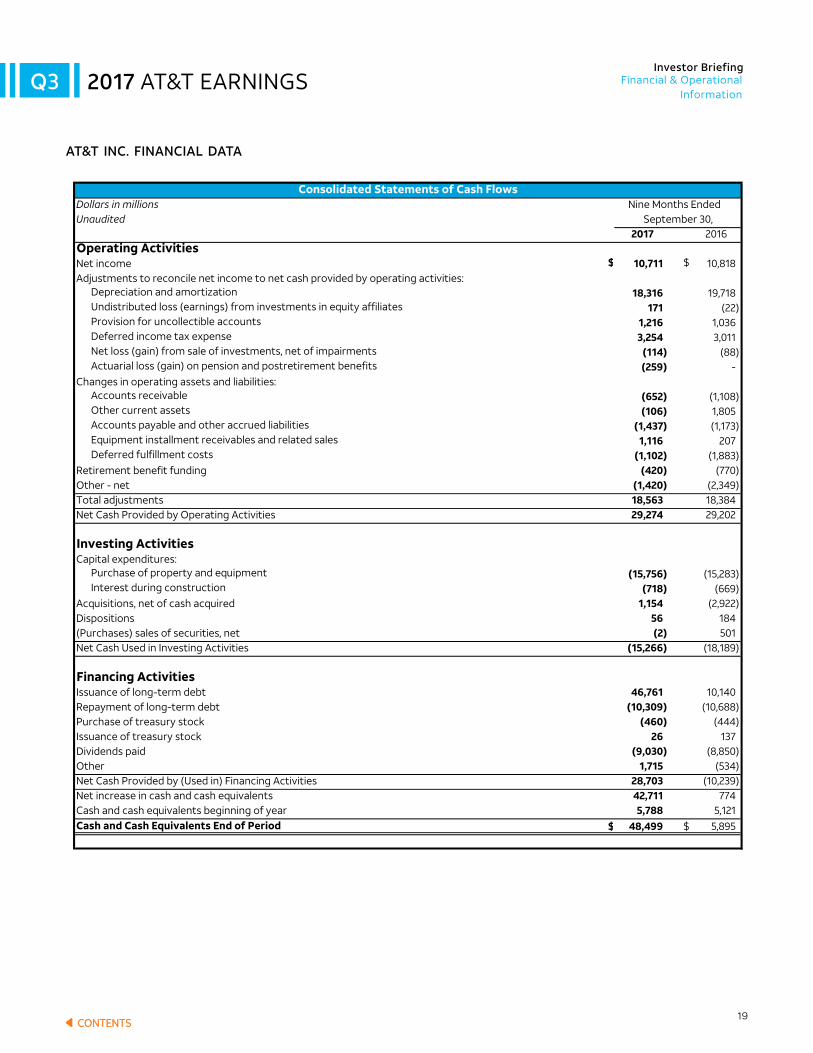
Depreciation and amortization 18,316 19,718 Undistributed loss (earnings) from investments in equity affiliates 171 (22) Provision for uncollectible accounts 1,216 1,036 Deferred income tax expense 3,254 3,011 Net loss (gain) from sale of investments, net of impairments (114) (88) Actuarial loss (gain) on pension and postretirement benefits (259) -
Accounts receivable (652) (1,108) Other current assets (106) 1,805 Accounts payable and other accrued liabilities (1,437) (1,173) Equipment installment receivables and related sales 1,116 207 Deferred fulfillment costs (1,102) (1,883)
(420) (770) (1,420) (2,349) 18,563 18,384 29,274 29,202
Purchase of property and equipment (15,756) (15,283) Interest during construction (718) (669)
1,154 (2,922) 56 184 (2) 501
(15,266) (18,189)
46,761 10,140 (10,309) (10,688)
(460) (444) 26 137
(9,030) (8,850) 1,715 (534)
28,703 (10,239) 42,711 774 5,788 5,121
$ 48,499 $ 5,895
AT&T Inc.Financial Data
Consolidated Statements of Cash FlowsDollars in millions Nine Months EndedUnaudited September 30,
Operating ActivitiesNet incomeAdjustments to reconcile net income to net cash provided by operating activities:
Changes in operating assets and liabilities:
Retirement benefit fundingOther - netTotal adjustmentsNet Cash Provided by Operating Activities
Investing ActivitiesCapital expenditures:
Acquisitions, net of cash acquiredDispositions(Purchases) sales of securities, netNet Cash Used in Investing Activities
Financing ActivitiesIssuance of long-term debtRepayment of long-term debtPurchase of treasury stock
Cash and cash equivalents beginning of yearCash and Cash Equivalents End of Period
Issuance of treasury stockDividends paidOtherNet Cash Provided by (Used in) Financing ActivitiesNet increase in cash and cash equivalents
AT&T INC. FINANCIAL DATA
Financial & Operational Information

20
Investor Briefing
CONTENTS
Q3
CONTENTS
AT&T INC. FINANCIAL DATA
2017 2016 2017 2016
Purchase of property and equipment $ 5,006 $ 5,581 -10.3 % $ 15,756 $ 15,283 3.1 %Interest during construction $ 245 $ 232 5.6 % $ 718 $ 669 7.3 %
$ 0.49 $ 0.48 2.1 % $ 1.47 $ 1.44 2.1 %
6,139 6,141 - %56.4 % 50.1 % 630 BP
256,800 273,140 -6.0 %
2017 2016
Domestic 138,826 133,338 4.1 %Mexico 13,779 10,698 28.8 %
152,605 144,036 5.9 %
106,098 100,821 5.2 %
Domestic 25,110 25,321 -0.8 %PanAmericana 8,201 7,139 14.9 %Brazil 5,289 5,337 -0.9 %
38,600 37,797 2.1 %
IP 14,384 13,715 4.9 %DSL 1,331 1,903 -30.1 %
15,715 15,618 0.6 %
Network Access Lines 12,249 14,603 -16.1 %U-verse VoIP Connections 5,774 5,707 1.2 %
18,023 20,310 -11.3 %
2017 2016 2017 2016
Domestic 2,323 1,532 51.6 % 6,686 4,674 43.0 %Mexico 697 743 -6.2 % 1,806 2,014 -10.3 %
3,020 2,275 32.7 % 8,492 6,688 27.0 %
1,156 1,285 -10.0 % 2,782 3,881 -28.3 %
Domestic (90) (2) - % (450) (103) - %PanAmericana 98 (36) - % 163 73 - %Brazil (230) (12) - % (260) (107) - %
(222) (50) - % (547) (137) - %
IP 150 171 -12.3 % 520 447 16.3 %DSL (121) (194) 37.6 % (410) (607) 32.5 %
29 (23) - % 110 (160) - %
AT&T Inc.Consolidated Supplementary Data
Supplementary Financial DataDollars in millions except per share amounts Three Months Ended Nine Months EndedUnaudited September 30, Percent September 30, Percent
Change ChangeCapital expenditures
Dividends Declared per Share
End of Period Common Shares Outstanding (000,000)Debt RatioTotal Employees
Supplementary Operating DataSubscribers and connections in thousandsUnaudited September 30, Percent
ChangeWireless Subscribers
Total Wireless Subscribers
Total Branded Wireless Subscribers
Video Connections
Total Video Connections
Broadband Connections
Total Broadband Connections
Voice Connections
Total Retail Consumer Voice Connections
Three Months Ended Nine Months EndedSeptember 30, Percent September 30, Percent
Change ChangeWireless Net Additions
Total Wireless Net Additions
Total Branded Wireless Net Additions
Video Net Additions
Total Video Net Additions
Broadband Net Additions
Total Broadband Net Additions
Financial & Operational Information

Investor Briefing
CONTENTS
Q3
21CONTENTS
2017 2016 2017 2016
Wireless service $ 8,034 $ 8,050 -0.2 % $ 23,969 $ 23,868 0.4 %Fixed strategic services 3,087 2,913 6.0 % 9,089 8,469 7.3 %Legacy voice and data services 3,434 4,042 -15.0 % 10,572 12,577 -15.9 %Other service and equipment 852 886 -3.8 % 2,513 2,619 -4.0 %Wireless equipment 1,654 1,876 -11.8 % 4,873 5,422 -10.1 %
17,061 17,767 -4.0 % 51,016 52,955 -3.7 %
10,233 10,925 -6.3 % 30,722 32,584 -5.7 %2,325 2,539 -8.4 % 6,972 7,568 -7.9 %
12,558 13,464 -6.7 % 37,694 40,152 -6.1 %4,503 4,303 4.6 % 13,322 12,803 4.1 %
- - - % - - - %$ 4,503 $ 4,303 4.6 % $ 13,322 $ 12,803 4.1 %
26.4 % 24.2 % 26.1 % 24.2 %
2017 2016
Postpaid/Branded 51,412 50,014 2.8 %Reseller 77 58 32.8 %Connected Devices 35,909 29,355 22.3 %
87,398 79,427 10.0 %
1,017 963 5.6 %
2017 2016 2017 2016
Postpaid/Branded 15 191 -92.1 % (74) 509 - %Reseller 2 1 - % 3 (34) - %Connected Devices 2,292 1,290 77.7 % 7,015 4,067 72.5 %
2,309 1,482 55.8 % 6,944 4,542 52.9 %
1.01 % 0.97 % 4 BP 1.02 % 0.97 % 5 BP
25 15 66.7 % 41 52 -21.2 %
BUSINESS SOLUTIONS
The Business Solutions segment provides services to business customers, including multinational companies; governmental and wholesale customers; and individual subscribers who purchase wireless services through employer-sponsored plans. We provide advanced IP-based services including Virtual Private Networks (VPN); Ethernet-related products and broadband, collectively referred to as strategic business services; as well as traditional data and voice products. We utilize our wireless and wired networks (referred to as “wired” or “wireline”) to provide a complete communications solution to our business customers.
Segment ResultsDollars in millions Three Months Ended Nine Months EndedUnaudited September 30, Percent September 30, Percent
Change ChangeSegment Operating Revenues
Total Segment Operating Revenues
Segment Operating ExpensesOperations and support expensesDepreciation and amortization Total Segment Operating ExpensesSegment Operating IncomeEquity in Net Income of AffiliatesSegment Contribution
Segment Operating Income Margin
Supplementary Operating DataSubscribers and connections in thousandsUnaudited September 30, Percent
ChangeBusiness Solutions Wireless Subscribers
Total Business Solutions Wireless Subscribers
Business Solutions IP Broadband Connections
Three Months Ended Nine Months EndedSeptember 30, Percent September 30, Percent
Business Solutions IP Broadband
Net Additions
Change ChangeBusiness Solutions Wireless Net Additions
Total Business Solutions Wireless Net Additions
Business Solutions Wireless Postpaid Churn
Financial & Operational Information
BUSINESS SOLUTIONS
The Business Solutions segment provides services to business customers, including multinational companies; governmental and wholesale customers; and individual subscribers who purchase wireless services through employer-sponsored plans. We provide advanced IP-based services including Virtual Private Networks (VPN); Ethernet-related products and broadband, collectively referred to as strategic business services; as well as traditional data and voice products. We utilize our wireless and wired networks (referred to as “wired” or
“wireline”) to provide a complete communications solution to our business customers.
22
Investor Briefing
CONTENTS
Q3
2017 2016 2017 2016
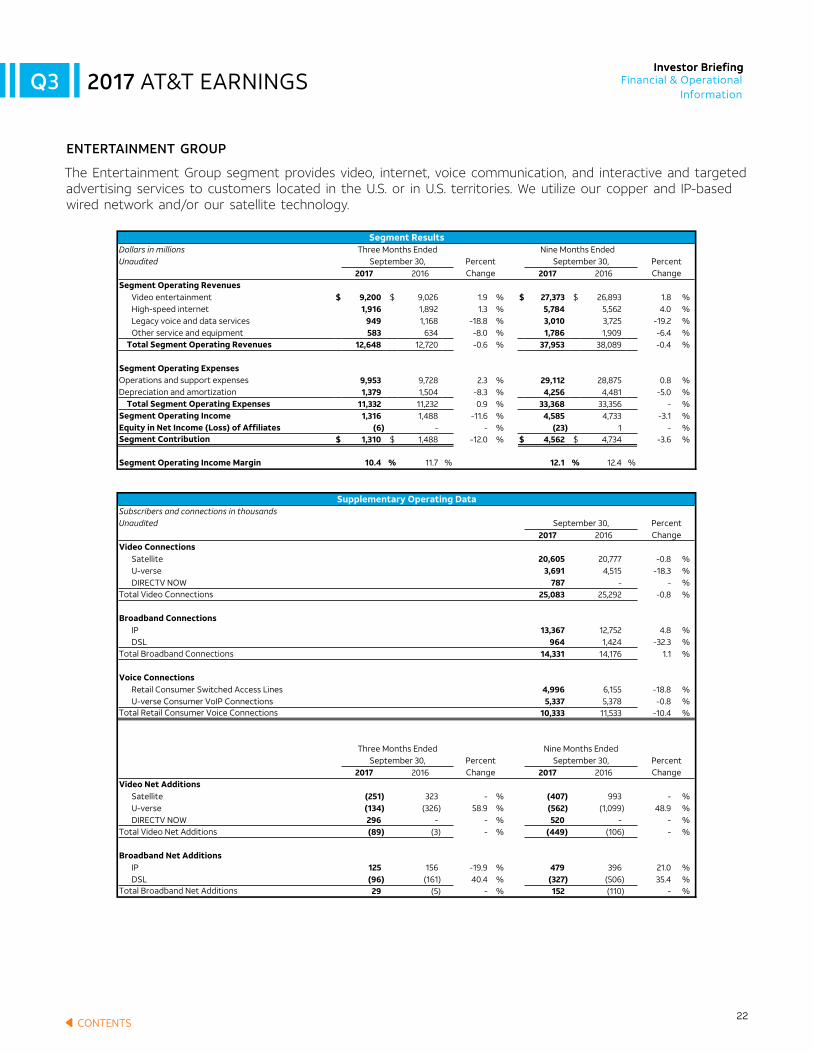
Video entertainment $ 9,200 $ 9,026 1.9 % $ 27,373 $ 26,893 1.8 %High-speed internet 1,916 1,892 1.3 % 5,784 5,562 4.0 %Legacy voice and data services 949 1,168 -18.8 % 3,010 3,725 -19.2 %Other service and equipment 583 634 -8.0 % 1,786 1,909 -6.4 %
12,648 12,720 -0.6 % 37,953 38,089 -0.4 %
9,953 9,728 2.3 % 29,112 28,875 0.8 %1,379 1,504 -8.3 % 4,256 4,481 -5.0 %
11,332 11,232 0.9 % 33,368 33,356 - %1,316 1,488 -11.6 % 4,585 4,733 -3.1 %
(6) - - % (23) 1 - %$ 1,310 $ 1,488 -12.0 % $ 4,562 $ 4,734 -3.6 %
10.4 % 11.7 % 12.1 % 12.4 %
2017 2016
Satellite 20,605 20,777 -0.8 %U-verse 3,691 4,515 -18.3 %DIRECTV NOW 787 - - %
25,083 25,292 -0.8 %
IP 13,367 12,752 4.8 %DSL 964 1,424 -32.3 %
14,331 14,176 1.1 %
Retail Consumer Switched Access Lines 4,996 6,155 -18.8 %U-verse Consumer VoIP Connections 5,337 5,378 -0.8 %
10,333 11,533 -10.4 %
2017 2016 2017 2016
Satellite (251) 323 - % (407) 993 - %U-verse (134) (326) 58.9 % (562) (1,099) 48.9 %DIRECTV NOW 296 - - % 520 - - %
(89) (3) - % (449) (106) - %
IP 125 156 -19.9 % 479 396 21.0 %DSL (96) (161) 40.4 % (327) (506) 35.4 %
29 (5) - % 152 (110) - %
ENTERTAINMENT GROUP
The Entertainment Group segment provides video, internet, voice communication, and interactive and targeted advertising services to customers located in the U.S. or in U.S. territories. We utilize our copper and IP-based wired network and/or our satellite technology.
Segment ResultsDollars in millions Three Months Ended Nine Months EndedUnaudited September 30, Percent September 30, Percent
Change ChangeSegment Operating Revenues
Total Segment Operating Revenues
Segment Operating ExpensesOperations and support expensesDepreciation and amortization Total Segment Operating ExpensesSegment Operating IncomeEquity in Net Income (Loss) of AffiliatesSegment Contribution
Segment Operating Income Margin
Supplementary Operating DataSubscribers and connections in thousandsUnaudited September 30, Percent
ChangeVideo Connections
Total Video Connections
Broadband Connections
Total Broadband Connections
Voice Connections
Total Retail Consumer Voice Connections
Three Months Ended Nine Months EndedSeptember 30, Percent September 30, Percent
Total Broadband Net Additions
Change ChangeVideo Net Additions
Total Video Net Additions
Broadband Net Additions
Investor BriefingFinancial & Operational
Information
ENTERTAINMENT GROUP
The Entertainment Group segment provides video, internet, voice communication, and interactive and targeted advertising services to customers located in the U.S. or in U.S. territories. We utilize our copper and IP-based wired network and/or our satellite technology.
23
Investor Briefing
CONTENTS
Q3
2017 2016 2017 2016
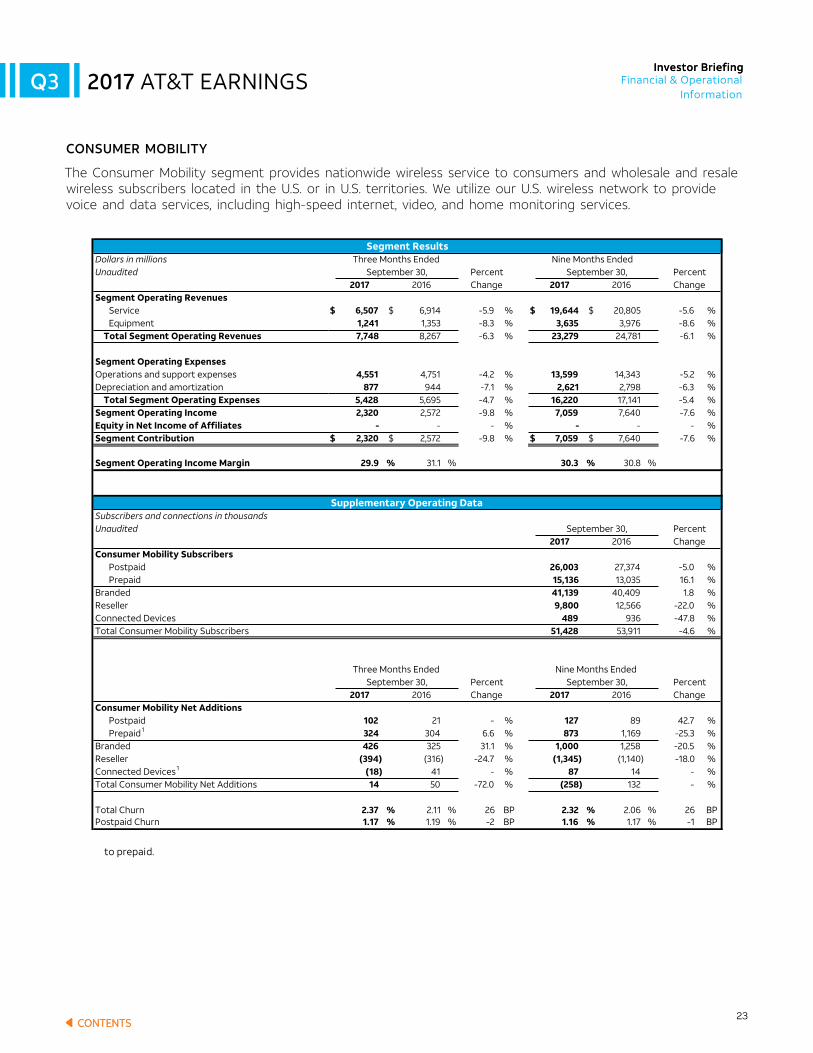
Service $ 6,507 $ 6,914 -5.9 % $ 19,644 $ 20,805 -5.6 %Equipment 1,241 1,353 -8.3 % 3,635 3,976 -8.6 %
7,748 8,267 -6.3 % 23,279 24,781 -6.1 %
4,551 4,751 -4.2 % 13,599 14,343 -5.2 %877 944 -7.1 % 2,621 2,798 -6.3 %
5,428 5,695 -4.7 % 16,220 17,141 -5.4 %2,320 2,572 -9.8 % 7,059 7,640 -7.6 %
- - - % - - - %$ 2,320 $ 2,572 -9.8 % $ 7,059 $ 7,640 -7.6 %
29.9 % 31.1 % 30.3 % 30.8 %
2017 2016
Postpaid 26,003 27,374 -5.0 %Prepaid 15,136 13,035 16.1 %
41,139 40,409 1.8 %9,800 12,566 -22.0 %
489 936 -47.8 %51,428 53,911 -4.6 %
2017 2016 2017 2016
Postpaid 102 21 - % 127 89 42.7 %Prepaid1 324 304 6.6 % 873 1,169 -25.3 %
426 325 31.1 % 1,000 1,258 -20.5 %(394) (316) -24.7 % (1,345) (1,140) -18.0 %
(18) 41 - % 87 14 - %14 50 -72.0 % (258) 132 - %
2.37 % 2.11 % 26 BP 2.32 % 2.06 % 26 BP1.17 % 1.19 % -2 BP 1.16 % 1.17 % -1 BP
CONSUMER MOBILITY
The Consumer Mobility segment provides nationwide wireless service to consumers and wholesale and resale wireless subscribers located in the U.S. or in U.S. territories. We utilize our U.S. wireless network to provide voice and data services, including high-speed internet, video, and home monitoring services.
Segment ResultsDollars in millions Three Months Ended Nine Months EndedUnaudited September 30, Percent September 30, Percent
Change ChangeSegment Operating Revenues
Total Segment Operating Revenues
Segment Operating ExpensesOperations and support expensesDepreciation and amortization Total Segment Operating ExpensesSegment Operating IncomeEquity in Net Income of AffiliatesSegment Contribution
Segment Operating Income Margin
Supplementary Operating DataSubscribers and connections in thousandsUnaudited September 30, Percent
ChangeConsumer Mobility Subscribers
BrandedResellerConnected DevicesTotal Consumer Mobility Subscribers
Three Months Ended Nine Months EndedSeptember 30, Percent September 30, Percent
Change ChangeConsumer Mobility Net Additions
Branded
1Effective July 1, 2017 we prospectively reclassified prepaid internet of things (IoT) connections from connected devices
to prepaid.
ResellerConnected Devices1
Total Consumer Mobility Net Additions
Total ChurnPostpaid Churn
Investor Briefing
CONTENTS
Financial & Operational Information
CONSUMER MOBILITY
The Consumer Mobility segment provides nationwide wireless service to consumers and wholesale and resale wireless subscribers located in the U.S. or in U.S. territories. We utilize our U.S. wireless network to provide voice and data services, including high-speed internet, video, and home monitoring services.
24
Investor Briefing
CONTENTS
Q3Investor Briefing
2017 2016 2017 2016
Video entertainment $ 1,363 $ 1,297 5.1 % $ 4,065 $ 3,649 11.4 %Wireless service 536 484 10.7 % 1,546 1,428 8.3 %Wireless equipment 200 98 - % 443 297 49.2 %
2,099 1,879 11.7 % 6,054 5,374 12.7 %
1,937 1,640 18.1 % 5,468 4,951 10.4 %304 293 3.8 % 905 868 4.3 %
2,241 1,933 15.9 % 6,373 5,819 9.5 %(142) (54) - % (319) (445) 28.3 %
17 1 - % 62 24 - %$ (125) $ (53) - % $ (257) $ (421) 39.0 %
(6.8) % (2.9) % (5.3) % (8.3) %
2017 2016
Postpaid 5,316 4,733 12.3 %Prepaid 8,231 5,665 45.3 %
13,547 10,398 30.3 %232 300 -22.7 %
13,779 10,698 28.8 %
PanAmericana 8,201 7,139 14.9 %SKY Brazil 5,289 5,337 -0.9 %
13,490 12,476 8.1 %
2017 2016 2017 2016
Postpaid 129 163 -20.9 % 351 444 -20.9 %Prepaid 585 606 -3.5 % 1,504 1,670 -9.9 %
714 769 -7.2 % 1,855 2,114 -12.3 %(17) (26) 34.6 % (49) (100) 51.0 %
697 743 -6.2 % 1,806 2,014 -10.3 %
PanAmericana 98 (36) - % 163 73 - %SKY Brazil (230) (12) - % (260) (107) - %
(132) (48) - % (97) (34) - %
INTERNATIONAL
The International segment provides entertainment services in Latin America and wireless services in Mexico. Video entertainment services are provided to primarily residential customers using satellite technology. We utilize our regional and national wireless networks in Mexico to provide consumer and business customers with wireless data and voice communication services. Our international subsidiaries conduct business in their local currency and operating results are converted to U.S. dollars using official exchange rates.
Segment ResultsDollars in millions Three Months Ended Nine Months EndedUnaudited September 30, Percent September 30, Percent
Change ChangeSegment Operating Revenues
Total Segment Operating Revenues
Segment Operating ExpensesOperations and support expensesDepreciation and amortization Total Segment Operating ExpensesSegment Operating Income (Loss)Equity in Net Income (Loss) of AffiliatesSegment Contribution
Segment Operating Income Margin
Supplementary Operating DataSubscribers and connections in thousandsUnaudited September 30, Percent
ChangeMexican Wireless Subscribers
BrandedResellerTotal Mexican Wireless Subscribers
Latin America Satellite Subscribers
Total Latin America Satellite Subscribers
Three Months Ended Nine Months EndedSeptember 30, Percent September 30,
ResellerTotal Mexican Wireless Net Additions
Latin America Satellite Net Additions
Total Latin America Satellite Net Additions
PercentChange Change
Mexican Wireless Net Additions
Branded
Financial & Operational Information
INTERNATIONAL
The International segment provides entertainment services in Latin America and wireless services in Mexico. Video entertainment services are provided to primarily residential customers using satellite technology. We utilize our regional and national wireless networks in Mexico to provide consumer and business customers with wireless data and voice communication services. Our international subsidiaries conduct business in their local currency and operating results are converted to U.S. dollars using official exchange rates.

25
Investor Briefing
CONTENTS
Q3Investor Briefing
CONTENTS
2017 2016 2017 2016
Service $ 14,541 $ 14,964 -2.8 % $ 43,613 $ 44,673 -2.4 %Equipment 2,895 3,229 -10.3 % 8,508 9,398 -9.5 %
17,436 18,193 -4.2 % 52,121 54,071 -3.6 %
10,113 10,697 -5.5 % 30,308 31,822 -4.8 %2,010 2,107 -4.6 % 5,999 6,244 -3.9 %
12,123 12,804 -5.3 % 36,307 38,066 -4.6 %$ 5,313 $ 5,389 -1.4 % $ 15,814 $ 16,005 -1.2 %
30.5 % 29.6 % 30.3 % 29.6 %
2017 2016
Postpaid 77,415 77,388 - %Prepaid 15,136 13,035 16.1 %
92,551 90,423 2.4 %9,877 12,624 -21.8 %
36,398 30,291 20.2 %138,826 133,338 4.1 %
326 323 0.9 %
2017 2016 2017 2016
Postpaid 117 212 -44.8 % 53 598 -91.1 %Prepaid1 324 304 6.6 % 873 1,169 -25.3 %
441 516 -14.5 % 926 1,767 -47.6 %(392) (315) -24.4 % (1,342) (1,174) -14.3 %
2,274 1,331 70.8 % 7,102 4,081 74.0 %2,323 1,532 51.6 % 6,686 4,674 43.0 %
3 1 - % (2,720) 24 - %
1.32 % 1.45 % -13 BP 1.35 % 1.41 % -6 BP1.07 % 1.05 % 2 BP 1.07 % 1.04 % 3 BP
SUPPLEMENTAL OPERATING INFORMATION - AT&T MOBILITY
As a supplemental discussion of our operating results, for comparison purposes, we are providing a view of our combined domestic wireless operations (AT&T Mobility).
Operating ResultsDollars in millions Three Months Ended Nine Months EndedUnaudited September 30, Percent September 30, Percent
Change ChangeOperating Revenues
Total Operating Revenues
Operating ExpensesOperations and support expensesDepreciation and amortization Total Operating ExpensesOperating Income
Operating Income Margin
Supplementary Operating DataSubscribers and connections in thousandsUnaudited September 30, Percent
ChangeAT&T Mobility Subscribers
BrandedResellerConnected DevicesTotal AT&T Mobility Subscribers
Domestic Licensed POPs (000,000)
Three Months Ended Nine Months EndedSeptember 30, Percent September 30, Percent
Change ChangeAT&T Mobility Net Additions
Branded
Postpaid Churn1Effective July 1, 2017 we prospectively reclassified prepaid internet of things (IoT) connections from connected devices
to prepaid.
ResellerConnected Devices1
Total AT&T Mobility Net AdditionsM&A Activity, Partitioned Customers and
Total Churn
Financial & Operational Information
SUPPLEMENTAL OPERATING INFORMATION - AT&T MOBILITY
As a supplemental discussion of our operating results, for comparison purposes, we are providing a view of our combined domestic wireless operations (AT&T Mobility).

26
Investor Briefing
CONTENTS
Q3Investor Briefing
CONTENTS
September 30, 2017
Revenues
Operations and Support
Expenses EBITDA
Depreciation and
AmortizationOperating
Income (Loss)
Equity in Net Income (Loss)
of AffiliatesSegment
ContributionBusiness Solutions $ 17,061 $ 10,233 $ 6,828 $ 2,325 $ 4,503 $ - $ 4,503 Entertainment Group 12,648 9,953 2,695 1,379 1,316 (6) 1,310 Consumer Mobility 7,748 4,551 3,197 877 2,320 - 2,320 International 2,099 1,937 162 304 (142) 17 (125) Segment Total 39,556 26,674 12,882 4,885 7,997 $ 11 $ 8,008 Corporate and Other 201 89 112 21 91 Acquisition-related items - 134 (134) 1,136 (1,270) Certain Significant items (89) 326 (415) - (415) AT&T Inc. $ 39,668 $ 27,223 $ 12,445 $ 6,042 $ 6,403
September 30, 2016
Revenues
Operations and Support
Expenses EBITDA
Depreciation and
Amortization Operating
Income (Loss)
Equity in Net Income (Loss)
of AffiliatesSegment
ContributionBusiness Solutions $ 17,767 $ 10,925 $ 6,842 $ 2,539 $ 4,303 $ - $ 4,303 Entertainment Group 12,720 9,728 2,992 1,504 1,488 - 1,488 Consumer Mobility 8,267 4,751 3,516 944 2,572 - 2,572 International 1,879 1,640 239 293 (54) 1 (53) Segment Total 40,633 27,044 13,589 5,280 8,309 $ 1 $ 8,310 Corporate and Other 270 270 - 17 (17) Acquisition-related items - 290 (290) 1,282 (1,572) Certain Significant items (13) 299 (312) - (312) AT&T Inc. $ 40,890 $ 27,903 $ 12,987 $ 6,579 $ 6,408
September 30, 2017
Revenues
Operations and Support
Expenses EBITDA
Depreciation and
AmortizationOperating
Income (Loss)
Equity in Net Income (Loss)
of AffiliatesSegment
ContributionBusiness Solutions $ 51,016 $ 30,722 $ 20,294 $ 6,972 $ 13,322 $ - $ 13,322 Entertainment Group 37,953 29,112 8,841 4,256 4,585 (23) 4,562 Consumer Mobility 23,279 13,599 9,680 2,621 7,059 - 7,059 International 6,054 5,468 586 905 (319) 62 (257) Segment Total 118,302 78,901 39,401 14,754 24,647 $ 39 $ 24,686 Corporate and Other 657 397 260 54 206 Acquisition-related items - 622 (622) 3,508 (4,130) Certain Significant items (89) 44 (133) - (133) AT&T Inc. $ 118,870 $ 79,964 $ 38,906 $ 18,316 $ 20,590
September 30, 2016
Revenues
Operations and Support
Expenses EBITDA
Depreciation and
Amortization Operating
Income (Loss)
Equity in Net Income (Loss)
of AffiliatesSegment
ContributionBusiness Solutions $ 52,955 $ 32,584 $ 20,371 $ 7,568 $ 12,803 $ - $ 12,803 Entertainment Group 38,089 28,875 9,214 4,481 4,733 1 4,734 Consumer Mobility 24,781 14,343 10,438 2,798 7,640 - 7,640 International 5,374 4,951 423 868 (445) 24 (421) Segment Total 121,199 80,753 40,446 15,715 24,731 $ 25 $ 24,756 Corporate and Other 759 940 (181) 54 (235) Acquisition-related items - 818 (818) 3,949 (4,767) Certain Significant items (13) (383) 370 - 370 AT&T Inc. $ 121,945 $ 82,128 $ 39,817 $ 19,718 $ 20,099
Dollars in millionsUnaudited
SUPPLEMENTAL SEGMENT RECONCILIATION
Three Months EndedDollars in millionsUnaudited
Nine Months Ended
Financial & Operational Information
SUPPLEMENTAL SEGMENT RECONCILIATION

Business Solutions
CONTENTS
Investor Briefing
27
FREE CASH FLOW
Free cash flow is defined as cash from operations minus Capital expenditures. Free cash flow after dividends is defined as cash from operations minus Capital expenditures and dividends. Free cash flow dividend payout ratio is defined as the percentage of dividends paid to free cash flow. We believe these metrics provide useful information to our investors because management views free cash flow as an important indicator of how much cash is generated by routine business operations, including Capital expenditures, and makes decisions based on it. Management also views free cash flow as a measure of cash available to pay debt and return cash to shareowners.
EBITDA
Our calculation of EBITDA, as presented, may differ from similarly titled measures reported by other companies. For AT&T, EBITDA excludes other income (expense) – net, and equity in net income (loss) of affiliates, as these do not reflect the operating results of our subscriber base or operations that are not under our control. Equity in net income (loss) of affiliates represents the proportionate share of the net income (loss) of affiliates in which we exercise significant influence, but do not control. Because we do not control these entities, management excludes these results when evaluating the performance of our primary operations. EBITDA also excludes interest expense and the provision for income taxes. Excluding these items eliminates the expenses associated with our capital and tax structures. Finally, EBITDA excludes depreciation and amortization in order to eliminate the impact of capital investments. EBITDA does not give effect to cash used for debt service requirements and thus does not reflect available funds for distributions, reinvestment or other discretionary uses. EBITDA is not presented as an alternative measure of operating results or cash flows from operations, as determined in accordance with U.S. generally accepted accounting principles (GAAP).
EBITDA service margin is calculated as EBITDA divided by service revenues.
Investor Briefing
CONTENTS
Discussion and Reconciliation of Non-GAAP Measures
We believe the following measures are relevant and useful information to investors as they are part of AT&T's internal management reporting and planning processes and are important metrics that management uses to evaluate the operating performance of AT&T and its segments. Management also uses these measures as a method of comparing performance with that of many of our competitors.
Q3
Discussion and Reconciliation of Non-GAAP Measures
We believe the following measures are relevant and useful information to investors as they are part of AT&T's internal management reporting and planning processes and are important metrics that management uses to evaluate the operating performance of AT&T and its segments. Management also uses these measures as a method of comparing performance with that of many of our competitors.
Free Cash Flow Free cash flow is defined as cash from operations minus Capital expenditures. Free cash flow after dividends is defined as cash from operations minus Capital expenditures and dividends. Free cash flow dividend payout ratio is defined as the percentage of dividends paid to free cash flow. We believe these metrics provide useful information to our investors because management views free cash flow as an important indicator of how much cash is generated by routine business operations, including Capital expenditures, and makes decisions based on it. Management also views free cash flow as a measure of cash available to pay debt and return cash to shareowners.
Free Cash Flow and Free Cash Flow Dividend Payout Ratio
Dollars in millions Three Months Ended Nine Months Ended September 30, September 30,
2017 2016 2017 2016 Net cash provided by operating activities $ 11,114 $ 10,995 $ 29,274 $ 29,202 Less: Capital expenditures (5,251) (5,813) (16,474) (15,952) Free Cash Flow 5,863 5,182 12,800 13,250
Less: Dividends paid (3,009) (2,951) (9,030) (8,850) Free Cash Flow after Dividends $ 2,854 $ 2,231 $ 3,770 $ 4,400 Free Cash Flow Dividend Payout Ratio 51.3% 56.9% 70.5% 66.8%
EBITDA
Our calculation of EBITDA, as presented, may differ from similarly titled measures reported by other companies. For AT&T, EBITDA excludes other income (expense) – net, and equity in net income (loss) of affiliates, as these do not reflect the operating results of our subscriber base or operations that are not under our control. Equity in net income (loss) of affiliates represents the proportionate share of the net income (loss) of affiliates in which we exercise significant influence, but do not control. Because we do not control these entities, management excludes these results when evaluating the performance of our primary operations. EBITDA also excludes interest expense and the provision for income taxes. Excluding these items eliminates the expenses associated with our capital and tax structures. Finally, EBITDA excludes depreciation and amortization in order to eliminate the impact of capital investments. EBITDA does not give effect to cash used for debt service requirements and thus does not reflect available funds for distributions, reinvestment or other discretionary uses. EBITDA is not presented as an alternative measure of operating results or cash flows from operations, as determined in accordance with U.S. generally accepted accounting principles (GAAP).
EBITDA service margin is calculated as EBITDA divided by service revenues.
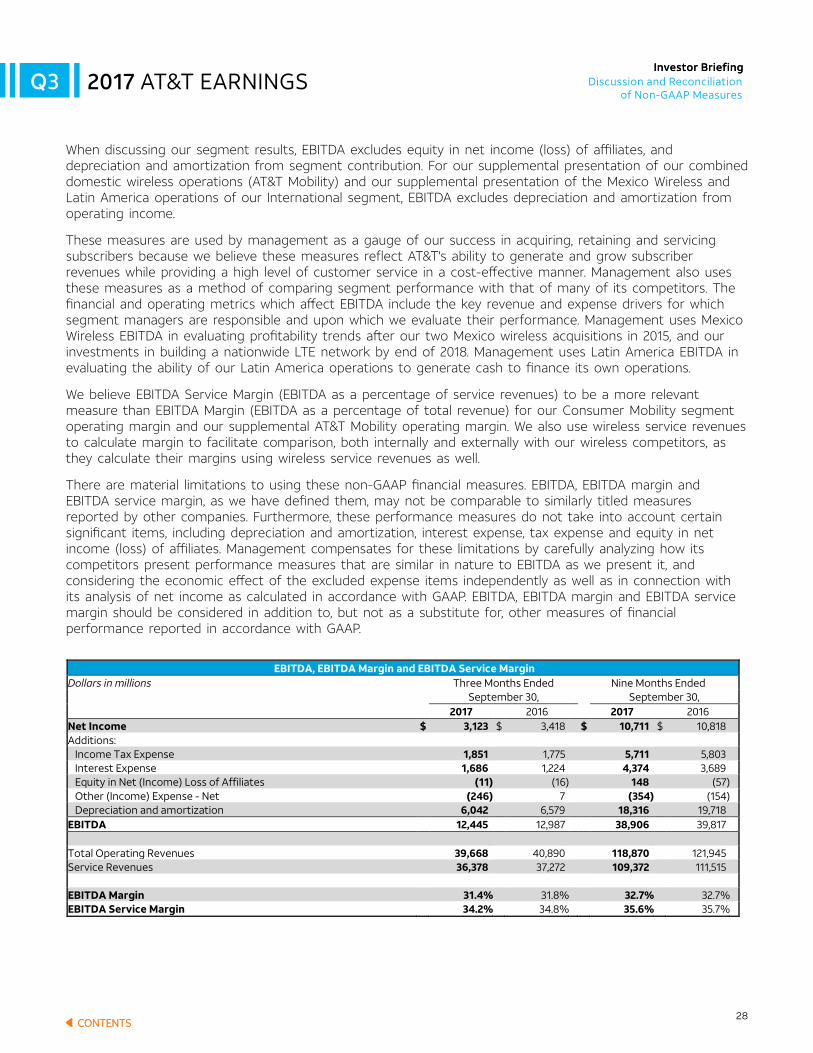
When discussing our segment results, EBITDA excludes equity in net income (loss) of affiliates, and depreciation and amortization from segment contribution. For our supplemental presentation of our combined domestic wireless operations (AT&T Mobility) and our supplemental presentation of the Mexico Wireless and Latin America operations of our International segment, EBITDA excludes depreciation and amortization from operating income.
1
28
Investor Briefing
CONTENTS
Q3Investor Briefing
CONTENTS
When discussing our segment results, EBITDA excludes equity in net income (loss) of affiliates, and depreciation and amortization from segment contribution. For our supplemental presentation of our combined domestic wireless operations (AT&T Mobility) and our supplemental presentation of the Mexico Wireless and Latin America operations of our International segment, EBITDA excludes depreciation and amortization from operating income.
These measures are used by management as a gauge of our success in acquiring, retaining and servicing subscribers because we believe these measures reflect AT&T's ability to generate and grow subscriber revenues while providing a high level of customer service in a cost-effective manner. Management also uses these measures as a method of comparing segment performance with that of many of its competitors. The financial and operating metrics which affect EBITDA include the key revenue and expense drivers for which segment managers are responsible and upon which we evaluate their performance. Management uses Mexico Wireless EBITDA in evaluating profitability trends after our two Mexico wireless acquisitions in 2015, and our investments in building a nationwide LTE network by end of 2018. Management uses Latin America EBITDA in evaluating the ability of our Latin America operations to generate cash to finance its own operations.
We believe EBITDA Service Margin (EBITDA as a percentage of service revenues) to be a more relevant measure than EBITDA Margin (EBITDA as a percentage of total revenue) for our Consumer Mobility segment operating margin and our supplemental AT&T Mobility operating margin. We also use wireless service revenues to calculate margin to facilitate comparison, both internally and externally with our wireless competitors, as they calculate their margins using wireless service revenues as well.
There are material limitations to using these non-GAAP financial measures. EBITDA, EBITDA margin and EBITDA service margin, as we have defined them, may not be comparable to similarly titled measures reported by other companies. Furthermore, these performance measures do not take into account certain significant items, including depreciation and amortization, interest expense, tax expense and equity in net income (loss) of affiliates. Management compensates for these limitations by carefully analyzing how its competitors present performance measures that are similar in nature to EBITDA as we present it, and considering the economic effect of the excluded expense items independently as well as in connection with its analysis of net income as calculated in accordance with GAAP. EBITDA, EBITDA margin and EBITDA service margin should be considered in addition to, but not as a substitute for, other measures of financial performance reported in accordance with GAAP.
EBITDA, EBITDA Margin and EBITDA Service Margin Dollars in millions Three Months Ended Nine Months Ended
September 30, September 30, 2017 2016 2017 2016
Net Income $ 3,123 $ 3,418 $ 10,711 $ 10,818 Additions: Income Tax Expense 1,851 1,775 5,711 5,803 Interest Expense 1,686 1,224 4,374 3,689 Equity in Net (Income) Loss of Affiliates (11) (16) 148 (57) Other (Income) Expense - Net (246) 7 (354) (154) Depreciation and amortization 6,042 6,579 18,316 19,718 EBITDA 12,445 12,987 38,906 39,817
Total Operating Revenues 39,668 40,890 118,870 121,945 Service Revenues 36,378 37,272 109,372 111,515
EBITDA Margin 31.4% 31.8% 32.7% 32.7% EBITDA Service Margin 34.2% 34.8% 35.6% 35.7%
2
Discussion and Reconciliation of Non-GAAP Measures
29
Investor Briefing
CONTENTS
Q3Investor Briefing
CONTENTS
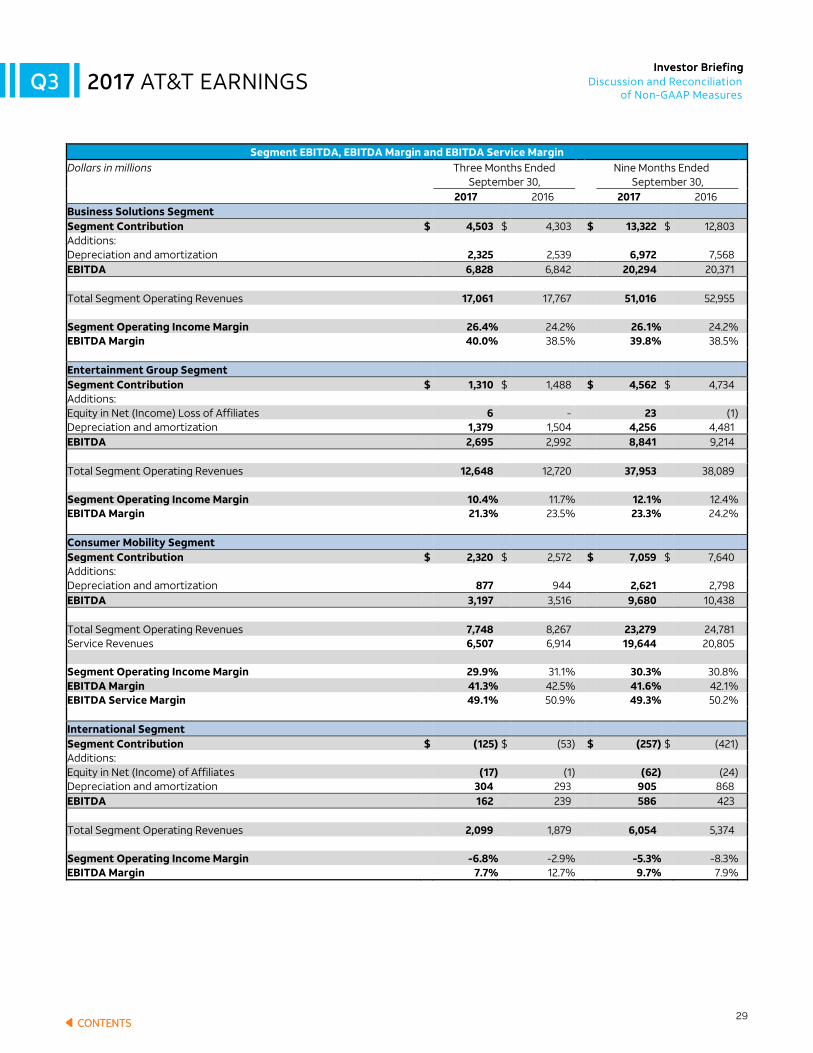
Segment EBITDA, EBITDA Margin and EBITDA Service Margin Dollars in millions Three Months Ended Nine Months Ended
September 30, September 30, 2017 2016 2017 2016
Business Solutions Segment Segment Contribution $ 4,503 $ 4,303 $ 13,322 $ 12,803 Additions: Depreciation and amortization 2,325 2,539 6,972 7,568 EBITDA 6,828 6,842 20,294 20,371
Total Segment Operating Revenues 17,061 17,767 51,016 52,955
Segment Operating Income Margin 26.4% 24.2% 26.1% 24.2% EBITDA Margin 40.0% 38.5% 39.8% 38.5%
Entertainment Group Segment Segment Contribution $ 1,310 $ 1,488 $ 4,562 $ 4,734 Additions: Equity in Net (Income) Loss of Affiliates 6 - 23 (1) Depreciation and amortization 1,379 1,504 4,256 4,481 EBITDA 2,695 2,992 8,841 9,214
Total Segment Operating Revenues 12,648 12,720 37,953 38,089
Segment Operating Income Margin 10.4% 11.7% 12.1% 12.4% EBITDA Margin 21.3% 23.5% 23.3% 24.2%
Consumer Mobility Segment Segment Contribution $ 2,320 $ 2,572 $ 7,059 $ 7,640 Additions: Depreciation and amortization 877 944 2,621 2,798 EBITDA 3,197 3,516 9,680 10,438
Total Segment Operating Revenues 7,748 8,267 23,279 24,781 Service Revenues 6,507 6,914 19,644 20,805
Segment Operating Income Margin 29.9% 31.1% 30.3% 30.8% EBITDA Margin 41.3% 42.5% 41.6% 42.1% EBITDA Service Margin 49.1% 50.9% 49.3% 50.2%
International Segment Segment Contribution $ (125) $ (53) $ (257) $ (421) Additions: Equity in Net (Income) of Affiliates (17) (1) (62) (24) Depreciation and amortization 304 293 905 868EBITDA 162 239 586 423
Total Segment Operating Revenues 2,099 1,879 6,054 5,374
Segment Operating Income Margin -6.8% -2.9% -5.3% -8.3% EBITDA Margin 7.7% 12.7% 9.7% 7.9%
3
Discussion and Reconciliation of Non-GAAP Measures
30
Investor Briefing
CONTENTS
Q3Investor Briefing
CONTENTS
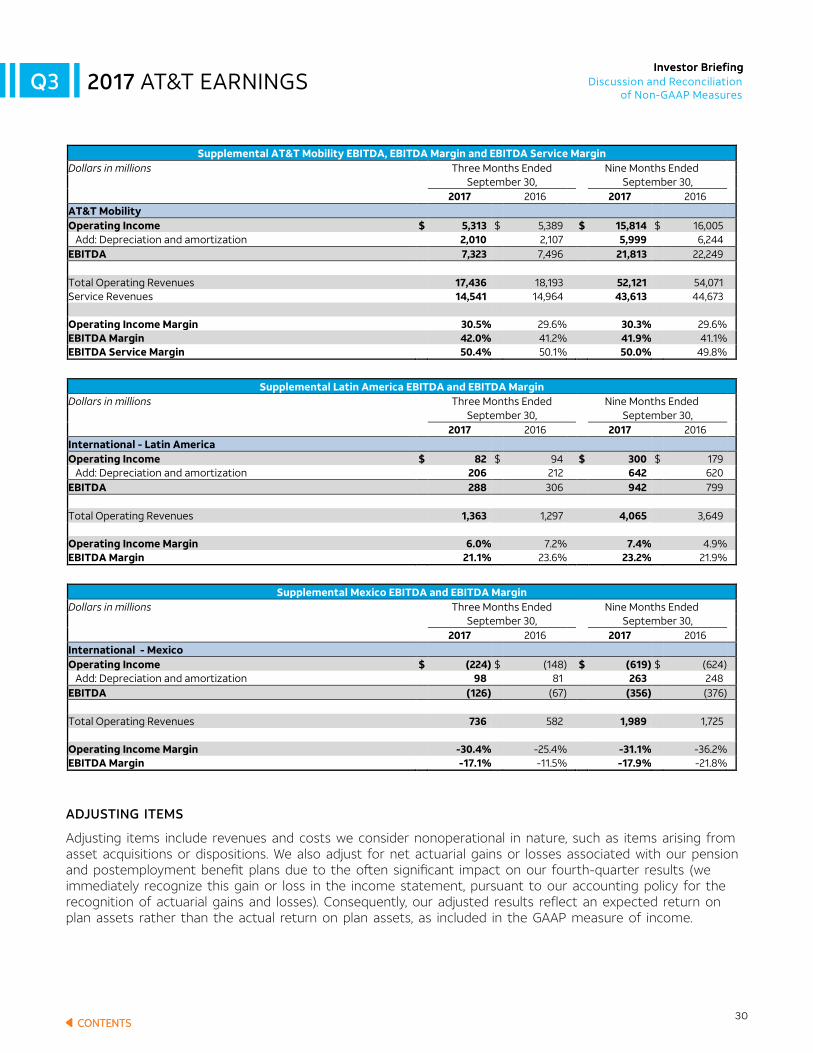
ADJUSTING ITEMS
Adjusting items include revenues and costs we consider nonoperational in nature, such as items arising from asset acquisitions or dispositions. We also adjust for net actuarial gains or losses associated with our pension and postemployment benefit plans due to the often significant impact on our fourth-quarter results (we immediately recognize this gain or loss in the income statement, pursuant to our accounting policy for the recognition of actuarial gains and losses). Consequently, our adjusted results reflect an expected return on plan assets rather than the actual return on plan assets, as included in the GAAP measure of income.
Supplemental AT&T Mobility EBITDA, EBITDA Margin and EBITDA Service Margin Dollars in millions Three Months Ended Nine Months Ended
September 30, September 30, 2017 2016 2017 2016
AT&T Mobility Operating Income $ 5,313 $ 5,389 $ 15,814 $ 16,005 Add: Depreciation and amortization 2,010 2,107 5,999 6,244 EBITDA 7,323 7,496 21,813 22,249
Total Operating Revenues 17,436 18,193 52,121 54,071 Service Revenues 14,541 14,964 43,613 44,673
Operating Income Margin 30.5% 29.6% 30.3% 29.6% EBITDA Margin 42.0% 41.2% 41.9% 41.1% EBITDA Service Margin 50.4% 50.1% 50.0% 49.8%
Supplemental Latin America EBITDA and EBITDA Margin Dollars in millions Three Months Ended Nine Months Ended
September 30, September 30, 2017 2016 2017 2016
International - Latin America Operating Income $ 82 $ 94 $ 300 $ 179 Add: Depreciation and amortization 206 212 642 620 EBITDA 288 306 942 799
1,363 1,297 4,065 3,649
6.0% 7.2% 7.4% 4.9%
Total Operating Revenues
Operating Income Margin EBITDA Margin 21.1% 23.6% 23.2% 21.9%
Supplemental Mexico EBITDA and EBITDA Margin Dollars in millions Three Months Ended Nine Months Ended
September 30, September 30, 2017 2016 2017 2016
International - Mexico Operating Income $ (224) $ (148) $ (619) $ (624) Add: Depreciation and amortization 98 81 263 248 EBITDA (126) (67) (356) (376)
Total Operating Revenues 736 582 1,989 1,725
Operating Income Margin -30.4% -25.4% -31.1% -36.2% EBITDA Margin -17.1% -11.5% -17.9% -21.8%
Adjusting Items
Adjusting items include revenues and costs we consider nonoperational in nature, such as items arising from asset acquisitions or dispositions. We also adjust for net actuarial gains or losses associated with our pension and postemployment benefit plans due to the often significant impact on our fourth-quarter results, unless earlier remeasurement is required (we immediately recognize this gain or loss in the income statement, pursuant to our accounting policy for the recognition of actuarial gains and losses.) Consequently, our adjusted results reflect an expected return on plan assets rather than the actual return on plan assets, as included in the GAAP measure of income.
The tax impact of adjusting items is calculated using the effective tax rate during the quarter except for adjustments that, given their magnitude can drive a change in the effective tax rate, reflect the actual tax expense or combined marginal rate of approximately 38%. Certain foreign operations with losses, where such losses are not realizable for tax purposes, are not tax effected, resulting in no tax impact for Venezuelan devaluation. For years prior to 2017, adjustments related to Mexico operations were taxed at the 30% marginal rate for Mexico.
4
Discussion and Reconciliation of Non-GAAP Measures
31
Investor Briefing
CONTENTS
Q3Investor Briefing
CONTENTS
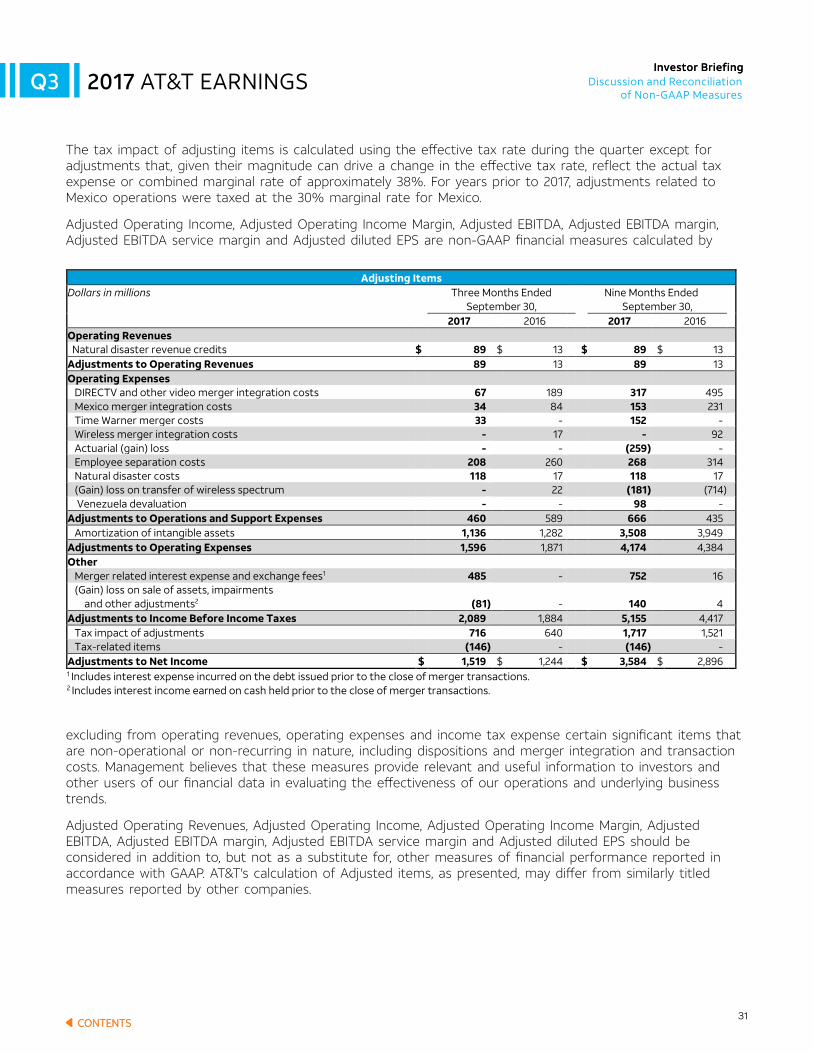
The tax impact of adjusting items is calculated using the effective tax rate during the quarter except for adjustments that, given their magnitude can drive a change in the effective tax rate, reflect the actual tax expense or combined marginal rate of approximately 38%. For years prior to 2017, adjustments related to Mexico operations were taxed at the 30% marginal rate for Mexico.
Adjusted Operating Income, Adjusted Operating Income Margin, Adjusted EBITDA, Adjusted EBITDA margin, Adjusted EBITDA service margin and Adjusted diluted EPS are non-GAAP financial measures calculated by
excluding from operating revenues, operating expenses and income tax expense certain significant items that are non-operational or non-recurring in nature, including dispositions and merger integration and transaction costs. Management believes that these measures provide relevant and useful information to investors and other users of our financial data in evaluating the effectiveness of our operations and underlying business trends.
Adjusted Operating Revenues, Adjusted Operating Income, Adjusted Operating Income Margin, Adjusted EBITDA, Adjusted EBITDA margin, Adjusted EBITDA service margin and Adjusted diluted EPS should be considered in addition to, but not as a substitute for, other measures of financial performance reported in accordance with GAAP. AT&T's calculation of Adjusted items, as presented, may differ from similarly titled measures reported by other companies.
Adjusting Items Dollars in millions Three Months Ended Nine Months Ended
September 30, September 30, 2017 2016 2017 2016
Operating Revenues Natural disaster revenue credits $ 89 $ 13 $ 89 $ 13 Adjustments to Operating Revenues 89 13 89 13 Operating Expenses DIRECTV and other video merger integration costs 67 189 317 495 Mexico merger integration costs 34 84 153 231 Time Warner merger costs 33 - 152 - Wireless merger integration costs - 17 - 92 Actuarial (gain) loss - - (259) - Employee separation costs 208 260 268 314 Natural disaster costs 118 17 118 17 (Gain) loss on transfer of wireless spectrum - 22 (181) (714) Venezuela devaluation - - 98 -Adjustments to Operations and Support Expenses 460 589 666 435 Amortization of intangible assets 1,136 1,282 3,508 3,949 Adjustments to Operating Expenses 1,596 1,871 4,174 4,384 Other Merger related interest expense and exchange fees1 485 - 752 16 (Gain) loss on sale of assets, impairments
and other adjustments2 (81) - 140 4 Adjustments to Income Before Income Taxes 2,089 1,884 5,155 4,417 Tax impact of adjustments 716 640 1,717 1,521 Tax-related items (146) - (146) -Adjustments to Net Income $ 1,519 $ 1,244 $ 3,584 $ 2,896 1 Includes interest expense incurred on the debt issued prior to the close of merger transactions. 2 Includes interest income earned on cash held prior to the close of merger transactions.
Adjusted Operating Income, Adjusted Operating Income Margin, Adjusted EBITDA, Adjusted EBITDA margin, Adjusted EBITDA service margin and Adjusted diluted EPS are non-GAAP financial measures calculated by excluding from operating revenues, operating expenses and income tax expense certain significant items that are non-operational or non-recurring in nature, including dispositions and merger integration and transaction costs. Management believes that these measures provide relevant and useful information to investors and other users of our financial data in evaluating the effectiveness of our operations and underlying business trends.
Adjusted Operating Revenues, Adjusted Operating Income, Adjusted Operating Income Margin, Adjusted EBITDA, Adjusted EBITDA margin, Adjusted EBITDA service margin and Adjusted diluted EPS should be considered in addition to, but not as a substitute for, other measures of financial performance reported in accordance with GAAP. AT&T's calculation of Adjusted items, as presented, may differ from similarly titled measures reported by other companies.
5
Discussion and Reconciliation of Non-GAAP Measures

32
Investor Briefing
CONTENTS
Q3
Net Debt to Adjusted EBITDA
Net Debt to EBITDA ratios are non-GAAP financial measures frequently used by investors and credit rating agencies and management believes these measures provide relevant and useful information to investors and other users of our financial data. The Net Debt to Adjusted EBITDA ratio is calculated by dividing the Net Debt by Annualized Adjusted EBITDA. Net Debt is calculated by subtracting cash and cash equivalents and certificates of deposit and time deposits that are greater than 90 days, from the sum of debt maturing within one year and long-term debt. Annualized Adjusted EBITDA is calculated by annualizing the year-to-date Adjusted EBITDA.
Net Debt to Adjusted EBITDA
Dollars in millions Three Months Ended Mar. 31, Jun. 30, Sep. 30, YTD 2017 2017 2017 2017 Adjusted EBITDA $ 13,080 $ 13,587 $ 12,994 $ 39,661 Add back severance - (60) (208) (268) Net Debt Adjusted EBITDA 13,080 13,527 12,786 39,393 Annualized Adjusted EBITDA 52,524 End-of-period current debt 8,551 End-of-period long-term debt 154,728 Total End-of-Period Debt 163,279 Less: Cash and Cash Equivalents 48,499 Net Debt Balance 114,780 Annualized Net Debt to Adjusted EBITDA Ratio 2.19
7
NET DEBT TO ADJUSTED EBITDA
Net Debt to EBITDA ratios are non-GAAP financial measures frequently used by investors and credit rating agencies and management believes these measures provide relevant and useful information to investors and other users of our financial data. The Net Debt to Adjusted EBITDA ratio is calculated by dividing the Net Debt by annualized Adjusted EBITDA. Net Debt is calculated by subtracting cash and cash equivalents and certificates of deposit and time deposits that are greater than 90 days, from the sum of debt maturing within one year and long-term debt. Annualized Adjusted EBITDA is calculated by annualizing the year-to-date Adjusted EBITDA.
Investor Briefing
Adjusted Operating Income, Adjusted Operating Income Margin,
Adjusted EBITDA, Adjusted EBITDA Margin and Adjusted EBITDA Service Margin Dollars in millions Three Months Ended Nine Months Ended September 30, September 30, 2017 2016 2017 2016 Operating Income $ 6,403 $ 6,408 $ 20,590 $ 20,099 Adjustments to Operating Revenues 89 13 89 13 Adjustments to Operating Expenses 1,596 1,871 4,174 4,384 Adjusted Operating Income1 8,088 8,292 24,853 24,496 EBITDA 12,445 12,987 38,906 39,817 Adjustments to Operating Revenues 89 13 89 13 Adjustments to Operations and Support Expenses 460 589 666 435 Adjusted EBITDA1 12,994 13,589 39,661 40,265 Total Operating Revenues 39,668 40,890 118,870 121,945 Adjustments to Operating Revenues 89 13 89 13 Total Adjusted Operating Revenues 39,757 40,903 118,959 121,958 Service Revenues 36,378 37,272 109,372 111,515 Adjustments to Service Revenues 89 13 89 13 Adjusted Service Revenues 36,467 37,285 109,461 111,528 Operating Income Margin 16.1% 15.7% 17.3% 16.5% Adjusted Operating Income Margin1 20.3% 20.3% 20.9% 20.1% Adjusted EBITDA Margin1 32.7% 33.2% 33.3% 33.0% Adjusted EBITDA Service Margin1 35.6% 36.4% 36.2% 36.1% 1 Adjusted Operating Income, Adjusted EBITDA and associated margins exclude all actuarial gains or losses ($259 million gain for the first nine months of 2017) associated with our postemployment benefit plan, which we immediately recognize in the income statement, pursuant to our accounting policy for the recognition of actuarial gains/losses.
Adjusted Diluted EPS Three Months Ended Nine Months Ended September 30, September 30, 2017 2016 2017 2016 Diluted Earnings Per Share (EPS) $ 0.49 $ 0.54 $ 1.69 $ 1.70 Amortization of intangible assets 0.12 0.14 0.38 0.42 Merger integration and other items1 0.06 0.03 0.14 0.09 Asset abandonments, impairments and other adjustments 0.05 0.03 0.06 0.03 Actuarial (gain) loss - - (0.03) - (Gain) loss on transfer of wireless spectrum - - (0.02) (0.07) Venezuela devaluation - - 0.02 - Tax-related items 0.02 - 0.02 - Adjusted EPS $ 0.74 $ 0.74 $ 2.26 $ 2.17 Year-over-year growth - Adjusted 0.0% 4.1% Weighted Average Common Shares Outstanding with Dilution (000,000) 6,182 6,189 6,184 6,191 1Includes combined merger integration items, merger-related interest income and expense.
6
Discussion and Reconciliation of Non-GAAP Measures

33
Investor Briefing
CONTENTS
Q3
SUPPLEMENTAL OPERATIONAL MEASURES
We provide a supplemental discussion of our domestic wireless operations that is calculated by combining our Consumer Mobility and Business Solutions segments, and then adjusting to remove non-wireless operations. The following table presents a reconciliation of our supplemental AT&T Mobility results
We provide a supplemental presentation of the Latin America and Mexico Wireless operations within our International segment. The following table presents a reconciliation of our International segment.
Investor Briefing
CONTENTS
Supplemental Operational Measures
We provide a supplemental discussion of our domestic wireless operations that is calculated by combining our Consumer Mobility and Business Solutions segments, and then adjusting to remove non-wireless operations. The following table presents a reconciliation of our supplemental AT&T Mobility results.
Supplemental Operational Measure Three Months Ended
September 30, 2017 September 30, 2016 Consumer
Mobility Business
Solutions Adjustments1 AT&T Mobility Consumer
Mobility Business
Solutions Adjustments1 AT&T Mobility Operating Revenues Wireless service $ 6,507 $ 8,034 $ - $ 14,541 $ 6,914 $ 8,050 $ - $ 14,964 Fixed strategic services - 3,087 (3,087) - - 2,913 (2,913) - Legacy voice and data services - 3,434 (3,434) - - 4,042 (4,042) - Other services and equipment - 852 (852) - - 886 (886) - Wireless equipment 1,241 1,654 - 2,895 1,353 1,876 - 3,229 Total Operating Revenues 7,748 17,061 (7,373) 17,436 8,267 17,767 (7,841) 18,193
Operating Expenses Operations and support 4,551 10,233 (4,671) 10,113 4,751 10,925 (4,979) 10,697 EBITDA 3,197 6,828 (2,702) 7,323 3,516 6,842 (2,862) 7,496 Depreciation and amortization 877 2,325 (1,192) 2,010 944 2,539 (1,376) 2,107 Total Operating Expense 5,428 12,558 (5,863) 12,123 5,695 13,464 (6,355) 12,804 Operating Income $ 2,320 $ 4,503 $ (1,510) $ 5,313 $ 2,572 $ 4,303 $ (1,486) $ 5,389 1 Non-wireless (fixed) operations reported in Business Solutions segment.
Supplemental Operational Measure Nine Months Ended
September 30, 2017 September 30, 2016 Consumer
Mobility Business
Solutions Adjustments1 AT&T Mobility Consumer
Mobility Business
Solutions Adjustments1 AT&T Mobility Operating Revenues
$ 19,644 $ 23,969 $ - $ 43,613 $ 20,805 $ 23,868 $ - $ 44,673 - 9,089 (9,089) - - 8,469 (8,469) - - 10,572 (10,572) - - 12,577 (12,577) - - 2,513 (2,513) - - 2,619 (2,619) -
Wireless service Fixed strategic services Legacy voice and data services Other services and equipment Wireless equipment 3,635 4,873 - 8,508 3,976 5,422 - 9,398 Total Operating Revenues 23,279 51,016 (22,174) 52,121 24,781 52,955 (23,665) 54,071
Operating Expenses Operations and support 13,599 30,722 (14,013) 30,308 14,343 32,584 (15,105) 31,822 EBITDA 9,680 20,294 (8,161) 21,813 10,438 20,371 (8,560) 22,249 Depreciation and amortization 2,621 6,972 (3,594) 5,999 2,798 7,568 (4,122) 6,244 Total Operating Expense 16,220 37,694 (17,607) 36,307 17,141 40,152 (19,227) 38,066 Operating Income $ 7,059 $ 13,322 $ (4,567) $ 15,814 $ 7,640 $ 12,803 $ (4,438) $ 16,005 1 Non-wireless (fixed) operations reported in Business Solutions segment.
8
Discussion and Reconciliation of Non-GAAP Measures

34
Investor Briefing
CONTENTS
Q3
SUPPLEMENTAL INTERNATIONAL
We provide a supplemental presentation of the Latin America and Mexico Wireless operations within our International segment. The following table presents a reconciliation of our International segment.
Discussion and Reconciliation of Non-GAAP Measures
Supplemental International
We provide a supplemental presentation of the Latin America and Mexico Wireless operations within our International segment. The following table presents a reconciliation of our International segment.
Supplemental International Three Months Ended
September 30, 2017 September 30, 2016 Latin America Mexico International Latin America Mexico International
Operating Revenues Video service $ 1,363 $ - $ 1,363 $ 1,297 $ - $ 1,297 Wireless service - 536 536 - 484 484 Wireless equipment - 200 200 - 98 98 Total Operating Revenues 1,363 736 2,099 1,297 582 1,879
Operating Expenses Operations and support 1,075 862 1,937 991 649 1,640 Depreciation and amortization 206 98 304 212 81 293 Total Operating Expenses 1,281 960 2,241 1,203 730 1,933 Operating Income (Loss) 82 (224) (142) 94 (148) (54) Equity in Net Income of Affiliates 17 - 17 1 - 1 Segment Contribution $ 99 $ (224) $ (125) $ 95 $ (148) $ (53)
Supplemental International Nine Months Ended
September 30, 2017 September 30, 2016 Latin America Mexico International Latin America Mexico International
Operating Revenues Video service $ 4,065 $ - $ 4,065 $ 3,649 $ - $ 3,649 Wireless service - 1,546 1,546 - 1,428 1,428 Wireless equipment - 443 443 - 297 297 Total Operating Revenues 4,065 1,989 6,054 3,649 1,725 5,374
Operating Expenses Operations and support 3,123 2,345 5,468 2,850 2,101 4,951 Depreciation and amortization 642 263 905 620 248 868 Total Operating Expenses 3,765 2,608 6,373 3,470 2,349 5,819 Operating Income (Loss) 300 (619) (319) 179 (624) (445) Equity in Net Income of Affiliates 62 - 62 24 - 24 Segment Contribution $ 362 $ (619) $ (257) $ 203 $ (624) $ (421)
9