Embed Size (px)
Citation preview

Q3 2019 Earnings Presentation

Forward Looking Statements & Disclosures
2
Forward Looking Statement: With the exception of the historical information contained in this presentation, the matters
described herein contain forward-looking statements that are made pursuant to the safe harbor provisions of the Private
Securities Litigation Reform Act of 1995. Forward-looking statements involve a number of risks and uncertainties that may
cause actual results to be materially different from such forward-looking statements. Such factors include, among others,
general economic conditions and economic conditions in the industrial sector, competitive influences, risks that current
customers will commence or increase captive production, delayed customer product launches, risks of capacity
underutilization, quality issues, availability of raw materials, currency, pending and completed transactions and other risks
associated with international trade, the Company's dependence on certain major customers, and other risk factors and
cautionary statements listed from time to time in the Company's periodic reports filed with the Securities and Exchange
Commission, including, but not limited to, the Company's Annual Report on 10-K for the fiscal year ended December 31, 2018
and the Company’s Quarterly Report on Form 10-Q for the three months ended September 30, 2019.
With respect to any non-GAAP financial measures included in the following presentation, the accompanying information
required by SEC Regulation G can be found at the back of this presentation or in the “Investor Relations” section of the
Company’s web site, www.nninc.com, under the heading “News & Events” and subheading “Presentations.”
Disclaimer: NN disclaims any obligation to update any such factors or to publicly announce the result of any revisions to any of
the forward-looking statements included herein or therein to reflect future events or developments.

Third Quarter 2019

Third Quarter 2019 Overview
• Sales - Up 4.0% YOY to $213.9M; Organic Sales +4.4%; Acquisition +0.3%; Foreign Exchange -0.7%
– Life Sciences group up $15.6M or 20% YOY.
• Operating Income / EPS
– GAAP - Up 70bps and GAAP EPS at a loss of $0.13 per share versus a loss of $0.48 in the prior year
– Adjusted - 12.9% of sales versus the prior year at 12.8% of sales and adjusted EPS of $0.27 versus prior year at $0.30
• EBITDA
– Reported EBITDA was $30.5M or 14.2% of sales versus $27.1M or 13.2% of sales in the prior year
– Adjusted EBITDA was $40.2M or 18.8% of sales versus $37.4M or 18.2% of sales in the prior year
• Net debt - $855.0M at end of Q3 versus net debt of $864.0M in the prior year
• Free Cash Flow - +$17.5M in Q3, positively impacted by lower working capital and reduced rate of capital expenditures.
• Key quarterly highlights
‒ Initiated plan to accelerate debt repayment through $32 million cash improvement plan consisting of a reduction in operating expenses totaling $10 million, reduction of capital expenditures, elimination of dividend ($12 million)
‒ Life Sciences margins continue to expand YOY
‒ Power Solutions growth driven by organic growth associated with smart meters and acquisition of Technical Arts
‒ Mobile Solutions driving lower fixed costs in reaction to reduced sales
4

Management is focused on de-leveraging the balance sheet and improving earnings
Cost and Cash Savings Activities
• Corporate Overhead & SGA Expenses– Personnel – currently achieved a 20% headcount reduction at Charlotte headquarters yielding approximately $5 million
in annual cost reductions.– Rent – in process of consolidating corporate offices with targeted annual savings in excess of $1.5 million.
o Actively seeking new tenants for office space.– Audit, Legal and Professional fees – targeted reduction of $1 million. – Travel & Entertainment – eliminated $300k in expenses and have targeted 10% reduction of travel for 2020 ($450k).
• Operating Groups– Power Solutions – closure of Fairfield facility by year end expected to save $800k annually.– Mobile Solutions – Ohio facility reorganization in October 2019 resulted in $1.5 million reduction in annual indirect
labor and benefits. – Life Sciences – margin improvement through ongoing synergy realization.– All Groups – ongoing evaluation of opportunities for facility consolidation and reduction in fixed costs.
• Dividend – eliminated annual $12 million cash dividend.
• Capital Expenditures – targeted reduction in CAPEX to approximately 4% of sales.
5
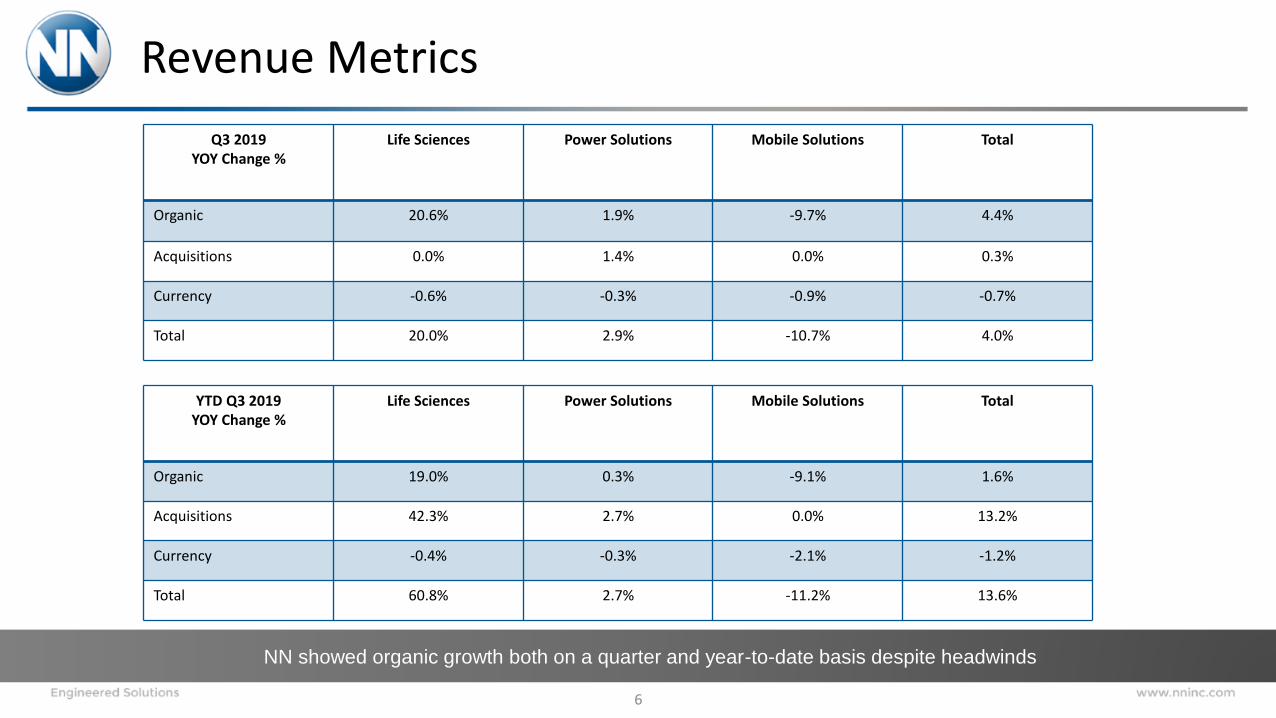
NN showed organic growth both on a quarter and year-to-date basis despite headwinds
Revenue Metrics
Q3 2019 YOY Change %
Life Sciences Power Solutions Mobile Solutions Total
Organic 20.6% 1.9% -9.7% 4.4%
Acquisitions 0.0% 1.4% 0.0% 0.3%
Currency -0.6% -0.3% -0.9% -0.7%
Total 20.0% 2.9% -10.7% 4.0%
YTD Q3 2019 YOY Change %
Life Sciences Power Solutions Mobile Solutions Total
Organic 19.0% 0.3% -9.1% 1.6%
Acquisitions 42.3% 2.7% 0.0% 13.2%
Currency -0.4% -0.3% -2.1% -1.2%
Total 60.8% 2.7% -11.2% 13.6%
6

3rd Quarter Profit and Loss
7
GAAP Operating Income +70 bps, Non-GAAP Operating Income Excl Special +90bps, Non-GAAP Operating income +10bpsReported EBITDA +110 BPS, Non-GAAP EBITDA Excl Special +120bps, Non-GAAP EBITDA +60 bps
GAAP Special Non-GAAP Integration Total Adj GAAP Special Non-GAAP Integration Total Adj GAAP Non-GAAP Total Adj
(In millions, except per share data) Reported Items* Excl Special Non-Ops** Non-GAAP Reported Items* Excl Special Non-Ops** Non-GAAP Reported Excl Special Non-GAAP
Net Revenues 213.9$ 213.9$ 213.9$ 205.7$ 205.7$ 205.7$ 8.2$ 8.2$ 8.2$
% Change 4.0% 4.0% 4.0%
Gross Profit 53.1 - 53.1 3.6 56.7 49.3 0.5 49.7 3.3 53.1 3.8$ 3.3$ 3.7$
% 24.8% 24.8% 26.5% 24.0% 24.2% 25.8% 90 bps 60 bps 70 bps
Operating Income 7.7 1.2 8.9 18.6 27.5 5.9 0.9 6.7 19.6 26.4 30.4% 11.0% 4.3%
% 3.6% 4.2% 12.9% 2.9% 3.3% 12.8% 70 bps 90 bps 10 bps
Net Interest (Expense) (14.7) - (14.7) 1.2 (13.6) (25.2) 6.6 (18.6) 1.4 (17.2)
Other Income (Expense) (0.1) - (0.1) 0.4 0.3 (0.3) - (0.3) 0.7 0.4
Pre-Tax Income (7.2) 1.2 (5.9) 20.2 14.3 (19.7) 7.5 (12.2) 21.7 9.5 63.6% 51.3% 49.9%
Provision for Income Taxes 1.3 (0.3) 1.0 (4.2) (3.1) 5.6 (1.3) 4.3 (5.4) (1.1)
Share of net income (loss) from joint venture 0.3 - 0.3 - 0.3 0.3 - 0.3 - 0.3
Net Income Continuing Operations (5.6)$ 1.0 (4.6)$ 16.1 11.4$ (13.8)$ 6.2 (7.6)$ 16.3 8.7$ 8.2$ 3.0$ 2.8$
% -2.6% -2.2% 5.3% -6.7% -3.7% 4.2% 410 bps 150 bps 110 bps
Diluted EPS (0.13)$ (0.11)$ 0.27$ (0.48)$ (0.26)$ 0.30$ 72.3% 58.5% -10.0%
Weighted Avg Diluted Shares 42.0 42.0 42.0 28.7 28.7 28.7
Special Non-GAAP Integration Total Adj Special Non-GAAP Integration Total Adj Non-GAAP Total Adj
Non-GAAP Measures Reported Items* Excl Special Non-Ops** Non-GAAP Reported Items* Excl Special Non-Ops** Non-GAAP Reported Excl Special Non-GAAP
EBITDA 30.5$ 1.2 31.7$ 8.5 40.2$ 27.1$ 0.9 28.0$ 9.5 37.4$ 3.4$ 3.7$ 2.8$
% 14.2% 14.8% 18.8% 13.2% 13.6% 18.2% 110 bps 120 bps 60 bps
EBITA 19.1$ 1.2 20.4$ 8.5 28.9$ 17.0$ 0.9 17.8$ 9.5 27.3$ 2.2$ 2.5$ 1.6$
% 8.9% 9.5% 13.5% 8.2% 8.7% 13.3% 70 bps 90 bps 20 bps
*Special Items are one time discrete adjustments
** Integration Non-Ops represent additional discrete transition and acquisition, foreign currency and amortization expense adjustments
Q3 FY19 Q3 FY18 YOY Change

3rd Quarter Bridge
8
Pre-tax Net Pre-tax Net Pre-tax Net
(In millions, except per share data) Income Tax China JV Income EPS Income Tax China JV Income EPS Income Income EPS
Reported - GAAP (7.2)$ 1.3$ 0.3$ (5.6)$ (0.13)$ (19.7)$ 5.6$ 0.3$ (13.8)$ (0.48)$ 63.6% 59.4% 72.3%
Special Items*
Add:
CEO Transition 0.9 (0.2) - 0.7 0.02 - - - - -
Asset Impairment 0.3 (0.1) - 0.3 0.01 - - - - -
Tech Arts Purch Accounting - - - - - 0.5 (0.1) - 0.3 0.01
Acquisition Transaction Costs - - - - - 0.6 (0.1) - 0.4 0.02
Write-off of unamortized debt issuance costs - - - - - 6.6 (1.7) - 5.0 0.17
Less:
Restructuring and integration expense - - - - - (0.2) 0.1 - (0.2) (0.01)
Discrete Tax Items - - - - - - 0.6 - 0.6 0.02
Total Non-GAAP Excluding Special Items (5.9)$ 1.0$ 0.3$ (4.6)$ (0.11)$ (12.2)$ 4.3$ 0.3$ (7.6)$ (0.26)$ 51.3% 39.1% 58.5%
Integration Non-Ops**
Transition and Acquisition:
Capacity and Capabilities Development 1.8 (0.4) - 1.5 0.03 2.4 (0.6) - 1.8 0.06
Professional Fees 0.5 (0.1) - 0.4 0.01 1.6 (0.4) - 1.2 0.04
Integration & Transformation 5.0 (1.0) - 4.0 0.10 4.5 (1.1) - 3.4 0.12
Foreign exchange (gain) loss on inter-company loans 0.4 (0.1) - 0.3 0.01 0.7 (0.2) - 0.5 0.02
Amortization of intangibles and deferred financing costs 12.5 (2.6) - 9.9 0.24 12.6 (3.1) - 9.4 0.33
Total Non-Operations Adjustments 20.2$ (4.2)$ -$ 16.1$ 0.38$ 21.7$ (5.4)$ -$ 16.3$ 0.57$ 6.9% 1.2% 32.6%
Total Adjusted Non-GAAP 14.3$ (3.1)$ 0.3$ 11.4$ 0.27$ 9.5$ (1.1)$ 0.3$ 8.7$ 0.30$ 49.9% 31.9% -10.0%
Diluted Shares 42.038 28.688
*Special Items are one time discrete adjustments
** Integration Non-Ops represent additional discrete transition and acquisition, foreign currency and amortization expense adjustments
Q3 FY19 Q3 FY18 % Change

Working Capital Trends improving as business mix moves toward higher sales concentration in Life Sciences
Working Capital
4.3
3.8
4.0
4.2 4.2
4.1
4.2
3.5
3.6
3.7
3.8
3.9
4.0
4.1
4.2
4.3
4.4
$125
$135
$145
$155
$165
$175
$185
$195
$205
$215
$225
Q1 18 Q2 18 Q3 18 Q4 18 Q1 19 Q2 19 Q3 19
Wo
rkin
g C
apit
al T
urn
s
Wo
rkin
g C
apit
al
Working Capital WC Turns Linear (WC Turns)
(Total Consolidated)
Q3 Q3
$000's 9/30/19 9/30/18
A/R 141,583$ 149,982$
DSO 60.4 66.5
Inventory 126,832$ 124,109$
Days Inventory 72.0 72.4
Inventory Turns 5.1 5.0
A/P (65,534)$ (66,302)$
DPO (37.2) (38.7)
Net Working Capital 202,881$ 207,789$
Cash Conversion Cycle 95.2 100.3
W/Cap Turns 4.2 4.0
Working Capital Metrics
Total NN, Inc
9

Key focus of management is to reduce overall leverage of the company
Debt
5.7
5.9
5.0
4.7
5.1 5.1 5.1
3.5
4.0
4.5
5.0
5.5
6.0
6.5
$125
$325
$525
$725
$925
$1,125
Q1 18 Q2 18 Q3 18 Q4 18 Q1 19 Q2 19 Q3 19
Leve
rage
Rat
io
Deb
t
Net Debt Per Credit Agreement Leverage Ratio Per Debt Agreement
10
Q3 Q3
$000's 9/30/2019 9/30/2018
Short Term Debt 28,440$ 34,199$
Long Term Debt 851,016 847,835
Funded Debt 879,455 882,034
Cash 24,409 17,988
Net Debt 855,047 864,046
Shareholders Equity 359,797$ 641,034$
EBITDA per Credit Agreement 171,652$ 177,118$
Cash allowed for Purposes of Leverage Calculation (4,144)$ (4,183)$
EBITDA to Funded Debt 5.10 x 4.96 x
Maximum Leverage Per Credit Agreement 5.75 x 5.75 x
Debt Metrics
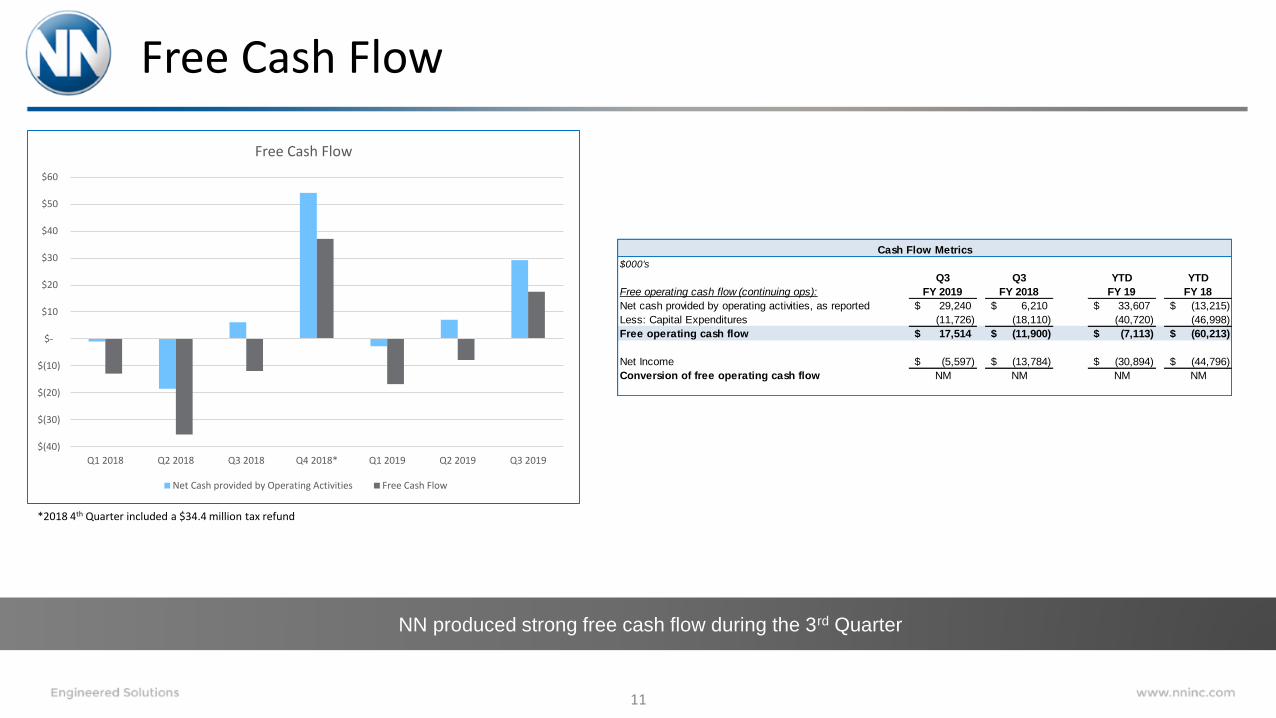
NN produced strong free cash flow during the 3rd Quarter
Free Cash Flow
$(40)
$(30)
$(20)
$(10)
$-
$10
$20
$30
$40
$50
$60
Q1 2018 Q2 2018 Q3 2018 Q4 2018* Q1 2019 Q2 2019 Q3 2019
Free Cash Flow
Net Cash provided by Operating Activities Free Cash Flow
*2018 4th Quarter included a $34.4 million tax refund
11
$000's
Free operating cash flow (continuing ops):
Q3
FY 2019
Q3
FY 2018
YTD
FY 19
YTD
FY 18
Net cash provided by operating activities, as reported 29,240$ 6,210$ 33,607$ (13,215)$
Less: Capital Expenditures (11,726) (18,110) (40,720) (46,998)
Free operating cash flow 17,514$ (11,900)$ (7,113)$ (60,213)$
Net Income (5,597)$ (13,784)$ (30,894)$ (44,796)$
Conversion of free operating cash flow NM NM NM NM
Cash Flow Metrics

Capital Spending to return to a more normalized one to one ratio with depreciation in 2020
Capital Spending
$0
$10
$20
$30
$40
$50
$60
$70
2016 2017 2018 2019F YTD 2018 YTD 2019
CAPEX Depreciation Amortization
12
Sep 2019 Sept 2018 Sep 2019 Sept 2018
$000's QTD QTD YTD YTD
Life Sciences 3,617$ 5,504$ 15,324$ 9,283$
Power Solutions 2,471 4,240 4,020 5,555
Mobile Solutions 5,820 8,696 18,530 27,591
Corporate HQ 1,042 2,399 1,728 6,166
Total CAPEX including AP 12,950$ 20,839$ 39,602$ 48,595$
Sales 213,897$ 205,683$ 648,819$ 571,180$
CAPEX % of Sales 6.1% 10.1% 6.1% 8.5%
Capex liability movements 1,224$ 2,729$ (1,118)$ 1,597$
Cash CAPEX 11,726$ 18,110$ 40,720$ 46,998$
Cash CAPEX % of Sales 5.5% 8.8% 6.3% 8.2%
Capital Spending Metrics

Segment Highlights

Life Sciences
14
Q3 Summary• Sales: Continued overperformance driven primarily by our orthopedic & delivery systems
businesses
• Major program launches related to large joint systems continued to drive growth
• Backlog: Backlog remained consistent on a YoY basis at $186M
• Compared to Q2 2019 backlog reduced ~$20M as we continue to reduce lead times and
meet customers demand expectations
• Improvements driven by operational improvements and the implementation or our new
S&OP initiative
• Margin Expansion:• Continued realization of the Paragon acquisition synergy plan
• Increased automation and productivity related to existing product lines
• Improved profit realization in our international sites compared to 2018
• Current Focus & Looking Forward:• Q4 to finish consistent with recent trends, sales increasing >10% year over year
• 2020 growth expected to return to growth rate range of 5%-9%
• Macro back drop remains strong within Med Device as OEM’s continue to look for
strategic partners with scale and a broad base of engineering and technical capabilities
within their portfolios
• Growth in 2020 and beyond will balance between our Ortho and Medsurg divisions.
• We continue to expect margin expansion in 2020 and beyond as we complete the
Paragon integration and realize synergies
• Tariffs to date have had little to no direct impact, however raw material cost are
increasing as suppliers adjust prices to match foreign supply cost
Delivering engineered solutions across a broad medical device platform
*Excludes Special Items and Integration Non-Ops Expenses
Life Sciences
Q3
FY19
% of
Sales
Q3
FY18
% of
Sales
%
Change
Margin
Change
(In millions)
Sales 94.0$ 78.4$ 20.0%
Operating Profit - GAAP 9.4$ 10.0% 6.7$ 8.6% 40.0% 140 bps
Operating Profit - Adjusted* 20.5$ 21.8% 16.2$ 20.7% 26.3% 110 bps
Reported EBITDA 21.0$ 22.4% 17.3$ 22.1% 21.6% 30 bps
Adjusted EBITDA* 24.4$ 26.0% 19.6$ 25.0% 24.9% 100 bps

Mobile Solutions
15
Q3 Summary• Sales – Dollar decrease driven by:
• Program lives ended in 2019 as expected, coupled with unexpected delays in
replacement business launches
• Market declines in North America
• US and foreign retaliatory tariffs have negatively impacted demand from dual- or multi-
source customers
• UAW strike against GM’s NA operations (~ 1 week of lost sales)
• Operating Profit – Dollar decrease driven by the offsetting impacts of the following:
• Variable margin reductions associated with Sales declines (-$3.4M)
• Increased depreciation expense commensurate with capital investments (-$0.6M)
• Fixed cost reductions – Indirect labor, benefits and T&E (+$1.0M)
• Litigation settlement income (+$1.4M)
Current Focus & Looking Forward:• Q4 2019:
• China/Asia volumes have temporarily increased; however, customer demand may be
negatively impacted by year-end inventory adjustments
• UAW NA strike volume loss likely to be recovered in Q1 2020, not Q4 2019
• Continued fixed cost reductions in response to lower sales
• 2020:
• Moderate sales growth (~3%)
• Free cash flow generation through: (1) targeted variable cost improvement actions; (2)
further fixed cost right-sizing; (3) limiting capital expenditures; and (4) reducing inventory
levels
Mobile Solutions expanding in components serving the growing electric motor marketplace
*Excludes Special Items and Integration Non-Ops Expenses
Mobile Solutions
Q3
FY19
% of
Sales
Q3
FY18
% of
Sales
%
Change
Margin
Change
(In millions)
Sales 73.1$ 81.8$ -10.7%
Operating Profit - GAAP 3.7$ 5.0% 4.7$ 5.7% -21.0% -70 bps
Operating Profit - Adjusted* 5.0$ 6.9% 6.6$ 8.0% -23.1% -110 bps
Reported EBITDA 10.6$ 14.5% 11.3$ 13.8% -6.1% 70 bps
Adjusted EBITDA* 11.3$ 15.5% 12.3$ 15.0% -7.7% 50 bps
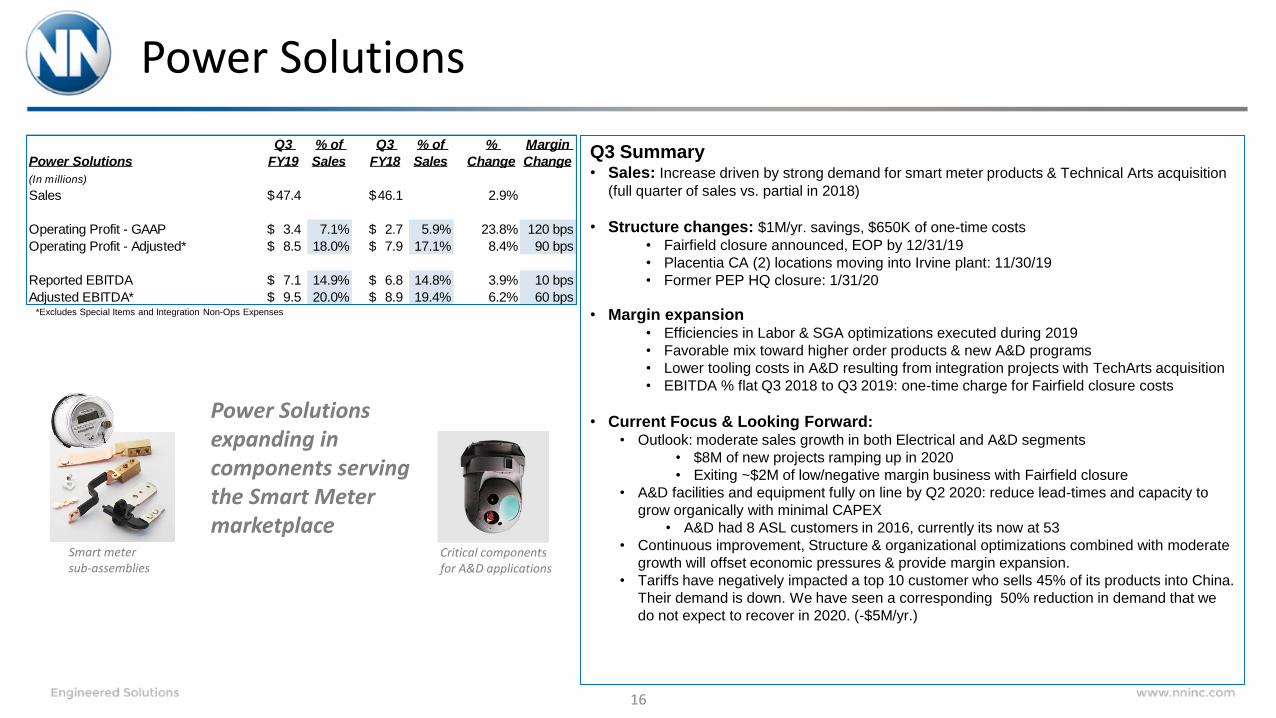
Power Solutions
16
Q3 Summary• Sales: Increase driven by strong demand for smart meter products & Technical Arts acquisition
(full quarter of sales vs. partial in 2018)
• Structure changes: $1M/yr. savings, $650K of one-time costs
• Fairfield closure announced, EOP by 12/31/19
• Placentia CA (2) locations moving into Irvine plant: 11/30/19
• Former PEP HQ closure: 1/31/20
• Margin expansion• Efficiencies in Labor & SGA optimizations executed during 2019
• Favorable mix toward higher order products & new A&D programs
• Lower tooling costs in A&D resulting from integration projects with TechArts acquisition
• EBITDA % flat Q3 2018 to Q3 2019: one-time charge for Fairfield closure costs
• Current Focus & Looking Forward:• Outlook: moderate sales growth in both Electrical and A&D segments
• $8M of new projects ramping up in 2020
• Exiting ~$2M of low/negative margin business with Fairfield closure
• A&D facilities and equipment fully on line by Q2 2020: reduce lead-times and capacity to
grow organically with minimal CAPEX
• A&D had 8 ASL customers in 2016, currently its now at 53
• Continuous improvement, Structure & organizational optimizations combined with moderate
growth will offset economic pressures & provide margin expansion.
• Tariffs have negatively impacted a top 10 customer who sells 45% of its products into China.
Their demand is down. We have seen a corresponding 50% reduction in demand that we
do not expect to recover in 2020. (-$5M/yr.)
Power Solutions expanding in components serving the Smart Meter marketplace
Smart meter sub-assemblies
Critical components for A&D applications
*Excludes Special Items and Integration Non-Ops Expenses
Power Solutions
Q3
FY19
% of
Sales
Q3
FY18
% of
Sales
%
Change
Margin
Change
(In millions)
Sales 47.4$ 46.1$ 2.9%
Operating Profit - GAAP 3.4$ 7.1% 2.7$ 5.9% 23.8% 120 bps
Operating Profit - Adjusted* 8.5$ 18.0% 7.9$ 17.1% 8.4% 90 bps
Reported EBITDA 7.1$ 14.9% 6.8$ 14.8% 3.9% 10 bps
Adjusted EBITDA* 9.5$ 20.0% 8.9$ 19.4% 6.2% 60 bps

Guidance

2019 Guidance
1: Operating Cash Flow - Capex18
Q4 2019 Guidance
2019 Guidance
Net Sales $196M - $203M $845M - $852M
Adj. Operating Margin 9.0% - 11.0% 11.3% - 11.8%
Adj. EBITDA(b) $31M - $36M $145M - $150M
Adj. Diluted EPS $0.12 - $0.18 $0.84 - $0.90
Free Cash Flow(1) $12M - $22M $5M - $15M

Reconciliation Tables

Reconciliation of GAAP Income from Operations to Non-GAAP Adjusted Income from Operations and Non-GAAP Adjusted EBITDA
20
$000s $000s
NN, Inc. Consolidated 2019 2018 Power Solutions 2019 2018
GAAP income from operations 7,672$ 5,881$ GAAP income from operations 3,351$ 2,706$
Restructuring and integration expense - (209) Restructuring and integration expense - -
Acquisition and transition expense* 8,559 9,569 Acquisition and transition expense 2,430 2,139
Amortization of intangibles 11,284 11,129 Amortization of intangibles 2,748 3,021
Non-GAAP adjusted income from operations (a) 27,516$ 26,370$ Non-GAAP adjusted income from operations (a) 8,529$ 7,866$
Non-GAAP adjusted operating margin (1) 12.9% 12.8% Non-GAAP adjusted operating margin (1) 18.0% 17.1%
Depreciation 11,154$ 10,130$ Depreciation 1,032$ 1,008$
Other income/expense (99) (308) Other income/expense (59) 74
Non-cash foreign exchange (gain) loss on inter-company loans 420 658 Non-cash foreign exchange (gain) loss on inter-company loans - -
Share of net income from joint venture 279 266 Share of net income from joint venture - -
Non-cash stock compensation 943 289 Non-cash stock compensation - -
Non-GAAP adjusted EBITDA (b) 40,213$ 37,405$ Non-GAAP adjusted EBITDA (b) 9,502$ 8,948$
Non-GAAP adjusted EBITDA margin (2) 18.8% 18.2% Non-GAAP adjusted EBITDA margin (2) 20.0% 19.4%
GAAP net sales 213,897$ 205,683$ GAAP net sales 47,430$ 46,082$
$000s $000s
Mobile Solutions 2019 2018 Life Sciences 2019 2018
GAAP income from operations 3,681$ 4,657$ GAAP income from operations 9,402$ 6,717$
Restructuring and integration expense - 51 Restructuring and integration expense - (260)
Acquisition and transition expense 499 974 Acquisition and transition expense 3,407 2,532
Amortization of intangibles 869 885 Amortization of intangibles 7,666 7,223
Non-GAAP adjusted income from operations (a) 5,049$ 6,567$ Non-GAAP adjusted income from operations (a) 20,475$ 16,212$
Share of net income from joint venture 279 266 Non-GAAP adjusted operating margin (1) 21.8% 20.7%
Impairment of joint venture - -
Non-GAAP adjusted income from operations with JV 5,328 6,833 Depreciation 3,659$ 3,096$
Other income/expense 287 246
Non-GAAP adjusted operating margin (1) 7.3% 8.4% Non-cash foreign exchange (gain) loss on inter-company loans - -
Share of net income from joint venture - -
Depreciation 5,949$ 5,598$ Non-cash stock compensation - -
Other income/expense (200) (135) Non-GAAP adjusted EBITDA (b) 24,421$ 19,554$
Non-cash foreign exchange (gain) loss on inter-company loans 266 -
Share of net income from joint venture 279 266 Non-GAAP adjusted EBITDA margin (2) 26.0% 25.0%
Non-cash stock compensation - -
Non-GAAP adjusted EBITDA (b) 11,343$ 12,296$ GAAP net sales 94,011$ 78,363$
Non-GAAP adjusted EBITDA margin (2) 15.5% 15.0%
GAAP net sales 73,071$ 81,805$
$000s
Elimination 2019 2018
GAAP net sales (615)$ (567)$
(1) Non-GAAP adjusted operating margin = Non-GAAP adjusted income from operations/ GAAP net sales
(2) Non-GAAP adjusted EBITDA margin = Non-GAAP adjusted EBITDA / GAAP net sales
* 2019 Includes Capacity & Capabilities Dev - $1.9 / Prof Fees - $0.5 / Integration & Transformation - $5.9 / Acq Transaction Costs - $0.0 / Asset Write-Downs/Inventory Step-Up - $0.3
2018 Includes Capacity & Capabilities Dev - $2.4 / Prof Fees - $1.6 / Integration & Transformation - $4.5 / Acq Transaction Costs - $0.6 / Asset Write-Downs/Inventory Step-Up - $0.5
Three Months Ended Three Months Ended
September 30,
September 30, September 30,
Three Months Ended
Three Months Ended Three Months Ended
September 30, September 30,

Reconciliation of Net Income (Loss) to Non-GAAP Adjusted Net Income (Loss) and Net Income (Loss) per Diluted Share to Non-GAAP Adjusted Net Income (Loss) per Diluted Share
21
$000s 2019 2018
GAAP net income (loss) (5,597)$ (13,784)$
Pre-tax acquisition and transition expense 8,559 9,569
Pre-tax foreign exchange (gain) loss on inter-company loans 420 658
Pre-tax restructuring and integration expense - (209)
Pre-tax write-off of unamortized debt issuance costs - 6,624
Pre-tax amortization of intangibles and deferred financing costs 12,468 12,550
Tax effect of adjustments reflected above (c) (4,408) (7,327)
Non-GAAP discrete tax adjustments - 590
Non-GAAP adjusted net income (loss) (d) 11,442$ 8,671$
Amounts per share, diluted 2019 2018
GAAP net income (loss) per diluted share (0.13)$ (0.48)$
Pre-tax acquisition and transition expense 0.20 0.33
Pre-tax foreign exchange (gain) loss on inter-company loans 0.01 0.02
Pre-tax restructuring and integration expense - (0.01)
Pre-tax write-off of unamortized debt issuance costs - 0.23
Pre-tax amortization of intangibles and deferred financing costs 0.30 0.44
Tax effect of adjustments reflected above (c) (0.10) (0.26)
Non-GAAP discrete tax adjustments - 0.02
Non-GAAP adjusted net income (loss) per diluted share (d) 0.27$ 0.30$
Weighted average shares outstanding, diluted 42,038 28,688
Three Months Ended
September 30,
Three Months Ended
September 30,

Non-GAAP Financial Measures Footnotes
The Company discloses in this presentation the non-GAAP financial measures of adjusted income from operations, adjusted EBITDA, adjusted net income (loss), adjusted net income per diluted share, free cash flow and net debt. Each of these non-GAAP financial measures provides supplementary information about the impacts of acquisition, divestiture and integration related expenses, foreign-exchange impacts on inter-company loans, reorganizational and impairment charges. Over the past five years, we have completed seven acquisitions, two of which were transformative for the Company, and sold two of our businesses. The costs we incurred in completing such acquisitions, including the amortization of intangibles and deferred financing costs, and these divestitures have been excluded from these measures because their size and inconsistent frequency are unrelated to our commercial performance during the period, and which we believe are not indicative of our ongoing operating costs. We exclude the impact of currency translation from these measures because foreign exchange rates are not under management’s control and are subject to volatility. Other non-operating charges are excluded as the charges are not indicative of our ongoing operating cost. We believe the presentation of adjusted income from operations, adjusted EBITDA, adjusted net income (loss), adjusted net income per diluted share, free cash flow and net debt provides useful information in assessing our underlying business trends and facilitates comparison of our long-term performance over given periods.
The non-GAAP financial measures provided herein may not provide information that is directly comparable to that provided by other companies in the Company's industry, as other companies may calculate such financial results differently. The Company's non-GAAP financial measures are not measurements of financial performance under GAAP and should not be considered as alternatives to actual income growth derived from income amounts presented in accordance with GAAP. The Company does not consider these non-GAAP financial measures to be a substitute for, or superior to, the information provided by GAAP financial results.
(a) Non-GAAP Adjusted income from operations represents GAAP income from operations, adjusted to exclude the effects of restructuring and integration expense; non-operational charges related to acquisition and transition expense, intangible amortization costs for fair value step-up in values related to acquisitions, non-cash impairment charges, and when applicable, our share of income from joint venture operations. We believe this presentation is commonly used by investors and professional research analysts in the valuation, comparison, rating and investment recommendations of companies in the industrial industry. We use this information for comparative purposes within the industry. Non-GAAP adjusted income from operations is not a measure of financial performance under GAAP and should not be considered as a measure of liquidity or as an alternative to GAAP income from operations.
(b) Non-GAAP adjusted EBITDA represents GAAP net income (loss), adjusted to include income taxes, interest expense, Interest rate swaps and write-offs, depreciation and amortization, charges related to acquisition and transition costs,
non-cash stock compensation expense, foreign exchange gain (loss) on inter-company loans, restructuring and integration expense, income from discontinued operations, and non-cash impairment charges, to the extent applicable. We
believe this presentation is commonly used by investors and professional research analysts in the valuation, comparison, rating and investment recommendations of companies in the industrial industry. We use this information for
comparative purposes within the industry. Non-GAAP adjusted EBITDA is not a measure of financial performance under GAAP and should not be considered as a measure of liquidity or as an alternative to GAAP income (loss) from continuing
operations.
(c) This line item reflects the aggregate tax effect of all nontax adjustments reflected in the respective table. NN, Inc. estimates the tax effect of the adjustment items identified in the reconciliation schedule above by applying the applicable statutory rates by tax jurisdiction unless the nature of the item and/or the tax jurisdiction in which the item has been recorded requires application of a specific tax rate or tax treatment.
(d) Non-GAAP adjusted net income (loss) represents GAAP net income (loss) adjusted to exclude the tax-affected effects of restructuring and integration charges (related to plant closures and other charges incurred to implement our strategic goals that do not necessarily represent a major strategic shift in operations), charges related to acquisition and transition costs, amortization of intangibles costs for fair value step-up in values related to acquisitions and amortization of deferred financing costs, foreign exchange gain (loss) on inter-company loans, estimated interest expense on cash held from divestiture, non-cash impairment charges, the impact of enactment of the Tax Cut and Jobs Act and income from discontinued operations. We believe this presentation is commonly used by investors and professional research analysts in the valuation, comparison, rating and investment recommendations of companies in the industrial industry. We use this information for comparative purposes within the industry. Non-GAAP adjusted income (loss) from segment operations is not a measure of financial performance under GAAP and should not be considered as a measure of liquidity or as an alternative to GAAP income (loss) from continuing operations.
22