Embed Size (px)
Citation preview

Q3FY2022
Financialpresentationtoaccompanymanagementcommentary

Thispresentationcontainsstatementsormayincludeormayincorporatebyreference,statementsthatmaybedeemedtobe"forward-lookingstatements"withinthemeaningofSection21EoftheSecuritiesExchangeActof1934,asamended(the"Act"),thatareintendedtoenjoytheprotectionofthesafeharborforforward-lookingstatementsprovidedbytheActaswellasprotectionsaffordedbyotherfederalsecuritieslaws.Assumptionsonwhichsuchforward-lookingstatementsarebasedarealsoforward-lookingstatements.Suchforward-lookingstatementsarenotstatementsofhistoricalfacts,butinsteadexpressourestimatesorexpectationsforourconsolidated,oroneofoursegment'sorbusiness’,economicperformanceorresultsofoperationsforfutureperiodsorasoffuturedatesoreventsordevelopmentsthatmayoccurinthefutureordiscussourplans,objectivesorgoals.Ouractualresultsmaydiffermateriallyfromthoseexpressedinorimpliedbyanyoftheseforward-lookingstatementsasaresultofchangesincircumstances,assumptionsnotbeingrealizedorotherrisks,uncertaintiesandfactorsincluding:theimpactoftheCOVID-19pandemiconourbusinessandtheglobaleconomy;economic,capitalmarketsandbusinessconditions;trendsandeventsaroundtheworldandinthemarketsinwhichweoperate;currencyexchangeratefluctuations,changesinmarketinterestratesandmarketlevelsofwages;changesinthesizeofvariousmarkets,includingeCommercemarkets;unemploymentlevels;inflationordeflation,generallyandinparticularproductcategories;consumerconfidence,disposableincome,creditavailability,spendinglevels,shoppingpatterns,debtlevelsanddemandforcertainmerchandise;theeffectivenessoftheimplementationandoperationofourstrategies,plans,programsandinitiatives;unexpectedchangesinourobjectivesandplans;theimpactofacquisitions,investments,divestitures,andotherstrategicdecisions;ourabilitytosuccessfullyintegrateacquiredbusinesses;changesinthetradingpricesofcertainequityinvestmentswehold;initiativesofcompetitors,competitors'entryintoandexpansioninourmarkets,andcompetitivepressures;customertrafficandaveragetransactionsinourstoresandclubsandonoureCommercewebsites;themixofmerchandisewesell,thecostofgoodswesellandtheshrinkageweexperience;ourgrossprofitmargins;thefinancialperformanceofWalmartandeachofitssegments,includingtheamountsofourcashflowduringvariousperiods;theamountofournetsalesandoperatingexpensesdenominatedintheU.S.dollarandvariousforeigncurrencies;commoditypricesandthepriceofgasolineanddieselfuel;supplychaindisruptionsanddisruptionsinseasonalbuyingpatterns;theavailabilityofgoodsfromsuppliersandthecostofgoodsacquiredfromsuppliers;ourabilitytorespondtochangingtrendsinconsumershoppinghabits;consumeracceptanceofandresponsetoourstores,clubs,eCommerceplatforms,programs,merchandiseofferingsanddeliverymethods;cybersecurityeventsaffectingusandrelatedcostsandimpacttothebusiness;developmentsin,outcomesof,andcostsincurredinlegalorregulatoryproceedingstowhichweareapartyoraresubject,andtheliabilities,obligationsandexpenses,ifany,thatwemayincurinconnectiontherewith;casualtyandaccident-relatedcostsandinsurancecosts;theturnoverinourworkforceandlaborcosts,includinghealthcareandotherbenefitcosts;oureffectivetaxrateandthefactorsaffectingoureffectivetaxrate,includingassessmentsofcertaintaxcontingencies,valuationallowances,changesinlaw,administrativeauditoutcomes,impactofdiscreteitemsandthemixofearningsbetweentheU.S.andWalmart'sinternationaloperations;changesinexistingtax,laborandotherlawsandregulationsandchangesintaxratesincludingtheenactmentoflawsandtheadoptionandinterpretationofadministrativerulesandregulations;theimpositionofnewtaxesonimports,newtariffsandchangesinexistingtariffrates;theimpositionofnewtraderestrictionsandchangesinexistingtraderestrictions;adoptionorcreationofnew,andmodificationofexisting,governmentalpolicies,programs,initiativesandactionsinthemarketsinwhichWalmartoperatesandelsewhereandactionswithrespecttosuchpolicies,programsandinitiatives;changesinaccountingestimatesorjudgments;thelevelofpublicassistancepayments;naturaldisasters,changesinclimate,geopoliticalevents,globalhealthepidemicsorpandemicsandcatastrophicevents;andchangesingenerallyacceptedaccountingprinciplesintheUnitedStates.
OurmostrecentannualreportonForm10-KandsubsequentquarterlyreportonForm10-QfiledwiththeSECdiscussotherrisksandfactorsthatcouldcauseactualresultstodiffermateriallyfromthoseexpressedorimpliedbyanyforward-lookingstatementinthepresentation.Weurgeyoutoconsideralloftherisks,uncertaintiesandfactorsidentifiedaboveordiscussedinsuchreportscarefullyinevaluatingtheforward-lookingstatementsinthispresentation.Walmartcannotassureyouthattheresultsreflectedinorimpliedbyanyforward-lookingstatementwillberealizedor,evenifsubstantiallyrealized,thatthoseresultswillhavetheforecastedorexpectedconsequencesandeffectsfororonouroperationsorfinancialperformance.Theforward-lookingstatementsmadetodayareasofthedateofthispresentation.Walmartundertakesnoobligationtoupdatetheseforward-lookingstatementstoreflectsubsequenteventsorcircumstances.
Thispresentationincludescertainnon-GAAPmeasuresasdefinedunderSECrules,includingnetsales,revenue,andoperatingincomeonaconstantcurrencybasis,adjustedoperatingincome,adjustedoperatingincomeinconstantcurrency,adjustedEPS,freecashflowandreturnoninvestment.Refertoinformationaboutthenon-GAAPmeasurescontainedinthispresentation.AdditionalinformationasrequiredbyRegulationGandItem10(e)ofRegulationS-Kregardingnon-GAAPmeasurescanbefoundinourmostrecentForm10-KandourForm8-KfurnishedasofthedateofthispresentationwiththeSEC,whichareavailableatwww.stock.walmart.com.
2
Safeharborandnon-GAAPmeasures

3
Fiscal2022Q4andfull-yearguidanceThefollowingguidancereflectsthecompany’supdatedexpectationsforQ4andfiscalyear2022andisprovidedonanon-GAAPbasisasthecompanycannotpredictcertainelementswhichareincludedinreportedGAAPresults,includingtheimpactofforeignexchangetranslationandexternallyadjusteditems.Prioryearresultsareonanadjustedbasis.Thecompany’supdatedguidanceassumescontinuedstrengthintheU.S.economyandnosignificantadditionalgovernmentstimulusfortheremainderoftheyear.
Q4FY22Guidance• WalmartU.S.compsales:around5%,excludingfuel
FiscalYear2022Guidance• WalmartU.S.compsales:above6%,excludingfuel• GAAPEPS:around$5.00;AdjustedEPS:around$6.40versuspriorguidanceof$6.20-$6.35• Capitalexpenditures:around$13billion

4
Totalrevenue
$140.5+4.3%
Totalrevenue,constantcurrency1,2
$139.2+3.3%
MembershipandOtherIncome
$1.3+37.9%
Netsales
$139.2+4.1%
Netsales,constantcurrency1,2
$137.9+3.1%
Grossprofitrate2
24.6%-42bps
Operatingexpenseasapercentageofnetsales2
21.3%-4bps
Operatingincome2
$5.8+0.2%
Operatingincome,constantcurrency1,2
$5.7-1.1%
Effectivetaxrate
24.5%-242bps
EPS
$1.11-38.3%
AdjustedEPS1
$1.45+8.2%
WalmartInc.-Q3FY22Dollarsinbillions,exceptpershare.Changeiscalculatedasthechangeversustheprioryearcomparableperiod
1Seepressreleaselocatedatwww.stock.walmart.comandreconciliationsattheendofpresentationregardingnon-GAAPfinancialmeasures.2WhenremovingthedivestituresofU.K.,JapanandArgentina:
• Totalrevenueinconstantcurrencywouldhaveincreased11.1%,excluding$9.4billioninQ3fiscal2021.• Netsalesinconstantcurrencywouldhaveincreased10.8%,excluding$9.4billioninQ3fiscal2021.• Walmart International eCommerce net sales in constant currencywould have increased 33%, excluding $1.2 billion in Q3 fiscal 2021, and on a two-year stack basis would have
increased91%,excluding$680millioninQ3fiscal2020.• Grossprofitratewouldhavedecreased51bps,excludinga9bpsimpactduetodivestitures.• Grossmargindollarswouldhaveincreased9.6%,excluding$2.2billioninQ3fiscal2021duetothedivestitures.• Operatingexpenseasapercentageofnetsaleswouldhavedecreased13bps,excludinga9bpsimpactduetothedivestitures.• Operatingincomeinconstantcurrencywouldhaveincreased6.3%,excluding$404millioninQ3fiscal2021.
Adj.operatingincome,constantcurrency1,2
$5.7-1.1%

1DebttototalcapitalizationcalculatedasofOctober31,2021.Debtincludesshort-termborrowings,long-termdebtduewithinoneyear,financeleaseobligationsduewithinoneyear,long-termdebtandlong-termfinanceleaseobligations.TotalcapitalizationincludesdebtandtotalWalmartshareholders'equity.
2Calculatedforthetrailing12monthsendedOctober31,2021.ForROI,seereconciliationsattheendofpresentationregardingnon-GAAPfinancialmeasures.5
Receivables,net Debttocapitalization1
$7.3 34.3%+27.4% -410bps
Inventories Returnonassets2
$57.5 3.3%+10.9% -490bps
Accountspayable Returnoninvestment2
$57.2 14.5%+5.5% +80bps
WalmartInc.-Q3FY22Dollarsinbillions.Changeiscalculatedasthechangeversustheprioryearcomparableperiod

1Seepressreleaselocatedatwww.stock.walmart.comandreconciliationsattheendofthispresentationregardingnon-GAAPfinancialmeasures.2$13.1billionremainingof$20billionauthorizationapprovedinFebruary2021.Thecompanyrepurchasedapproximately15millionsharesinQ3fiscal2022. 6
Operatingcashflow Dividends
$16.3 $4.6-$6.6 ($1.5in3Q22)
Capitalexpenditures Sharerepurchases2
$8.6 $7.4+$2.2 ($2.2in3Q22)
Freecashflow1 Totalshareholderreturns
$7.7 $12.0-$8.7 ($3.7in3Q22)
WalmartInc.-YTDQ3FY22Dollarsinbillions.Dollarchangesmaynotrecalculateduetorounding.Changeiscalculatedasthechangeversustheprioryearcomparableperiod

7
NetSales
$96.6+9.3%
eCommercenetsalesgrowth
+8%
eCommercecontributiontocomp1,2
<10bps
Inventory
Total:+11.5%
Comparablesales1,2
9.2%Comparabletransactions
5.7%Comparableaverageticket
3.3%
• Salesreflectstrongmarketsharegainsingrocery;unitsharegainsonatwo-yearstack
• eCommercesalesincreased87%onatwo-yearstack
• WalmartConnectadvertisingsalesincreasednearly240%onatwo-yearstack;rampingnewadvertisers
• eCommercemarketplaceadded~21MitemstoassortmentinQ3
• Compsalesreflectstrongunderlyingtrends,ledbyin-storetraffic,andaidedbyrobustconsumerspending,dueinparttostimulusandinflation
• Compsalesup15.6%ontwo-yearstack
• Compsalesincreasedsequentiallyonbothaone-yearandtwo-yearbasis
• Compticketincreased~27%ontwo-yearstack
Remodels:174stores
Pickup:~4,300locations
Same-daydelivery:>3,300stores
• Increasereflectspreparationforanexpectedstrongholidayseason
• Onatwo-yearstack,inventoryup~17%oncompsalesgrowthof15.6%
1Compsalesforthe13-weekperiodendedOctober29,2021comparedtothe13-weekperiodendedOctober30,2020,andexcludesfuel.2Theresultsofnewacquisitionsareincludedinourcompsalesmetricsinthe13thmonthafteracquisition.
WalmartU.S.-Q3FY22Dollarsinbillions.Changeiscalculatedasthechangeversustheprioryearcomparableperiod
• TheSparkdriverplatformcontinuestogrow;nowactivein900cities,providingaccesstomorethan50%ofU.S.households
• LaunchedWalmartGoLocaldeliveryasaserviceplatform;stronginterestfrombothnationalandlocalmerchantpartners

8
Grossprofitrate
-12bps
Operatingincome
$4.9+5.9%
Operatingexpenserate
+20bps
• Reflectsincreasedcostsinthesupplychain
• LowermarkdownsandincreasedcontributionsfromWalmartConnectadvertisingrevenuehavehelpedoffsetcostpressures
• Merchantscontinueworkingwithsuppliersandmonitoringpricegapstomanagemarginsappropriately
• ExpensesdeleverageddueprimarilytoinvestmentsinwagespartlyoffsetbystrongsalesandlowerCOVIDcosts
• COVIDcostswerelowerby~$0.1billion;benefitedleverageby~20bps
Adj.operatingincome1
$4.9+5.9%
WalmartU.S.-Q3FY22Dollarsinbillions.Changeiscalculatedasthechangeversustheprioryearcomparableperiod

WalmartU.S.-quarterlymerchandisehighlights
9
Category Compsales Details
Grocery +highsingle-digits
• Salesgrowthofnearly10%reflectedstrongmarketsharegains(accordingtoNielsen)andlow-to-midsingledigitticketinflation;onatwo-yearstackedbasis,salesincreasedbyamid-teenspercentage;strongpricepositioningandomniofferingsareresonatingwithcustomers
• Foodcategoriesincreased$3.6billion,thestrongestquarterlygrowthinsixquarters,withbroad-basedstrength,includingstronggrowthinfreshcategories
• Consumablesreflectedstrengthinpets,babyproductsandbeauty
Health&wellness +mid-teens • Strongsalesprimarilyreflectedincreasedscripts,includingCOVIDvaccineadministration,andbrandeddruginflation
Generalmerchandise +midsingle-digits
• Categorystrengthinapparel,back-to-school,automotiveandseasonalitemslikeholidaydécor
• Automotivecategoriesbenefitedfromlappinglastyear'sCOVID-relatedclosuresofAutoCareCenters
• Generalmerchandisesalesincreasedmid-teenspercentageonatwo-yearstackedbasis

• Negativelyaffectedby14bpsfromdivestitures
• Retainedmarketoperatingexpenserateleveraged24bpsduetoashifttolowermarginformats,offsetbyhigherexpensesheadingintofestiveseason
• RetainedmarketCOVID-relatedcostswerelowerby~$30mil.andbenefitedleverageby~16bps
• Divestituresaccountedforareductionof$1.7billionYoY
• Increaseprimarilyduetolowinventorylevelsintheprioryearandearlypreparationforfestiveseasons
101Seepressreleaselocatedatwww.stock.walmart.comandreconciliationsattheendofpresentationregardingnon-GAAPfinancialmeasures.
Inventory
$11.9+10.4%
Grossprofitrate
-86bpsOperatingincome
$0.9-19.2%
Netsales,constantcurrency1
$22.3-24.6%
Operatingexpenserate
-10bps
Operatingincome,constantcurrency1
$0.8-26.5%
• Negativelyaffectedby36bpsfromdivestitures
• Retainedmarketgrossprofitratedecreased50bpsduetomixshifttolowermarginformats
Netsales
$23.6-20.1%
WalmartInternational-Q3FY22Dollarsinbillions.Dollarchangesmaynotrecalculateduetorounding.Changeiscalculatedasthechangeversustheprioryearcomparableperiod
• Divestituresaccountedforareductionof$9.4billionYoY
• Retainedmarketgrowthof17.0%
• Divestituresaccountedforareductionof$404millionYoY
• Retainedmarketgrowthof29.2%
• Divestituresaccountedforareductionof$404millionYoY
• Retainedmarketgrowthof17.5%
Adj.operatingincome1
$0.9-19.2%
Adj.operatingincome,constantcurrency1
$0.8-26.5%
• Divestituresaccountedforareductionof$9.4billionYoY
• Retainedmarketgrowthof10.3%:◦ StrongsalesgrowthinChina,
Mexico,andFlipkart◦ eCommercenetsalescontributed
19%oftotalnetsales
• Retainedmarketgrowthof12.3%

• Broadbasedstrengthacrosscategories,particularlyingrocery
• Improvedperformanceinseasonalsalesevents
• eCommercenetsales+31%
1WalmexincludestheconsolidatedresultsofMexicoandCentralAmerica2ANTAD-AsociacionNacionaldeTiendasdeAutoservicioyDepartamentales;TheNationalAssociationofSupermarketsandDepartmentStores
11
Walmex1 China Canada
Netsalesgrowth +8.7% +18.8% +5.3%
Comparablesales +7.2% +16.5% +6.0%
Comparabletransactions +8.2% -1.0% +7.4%
Comparableticket -0.9% +17.7% -1.3%
• Broadbasedstrengthacrosscategories,particularlyingrocery
• InMexico,compsalesincreased+6.0%
• CompsalesoutpacedANTAD2self-serviceandclubby60bpsand420bpsonatwo-yrstack
• MexicoeCommercenetsales+27%
• StrongsalesinSam'sClub,partiallyoffsetbysofterstoretrafficinHypermarkets
• Sam'sClubdelivereddouble-digitcompsalesandmembershipgrowth
• OpenedthreenewSam'sClubsinQ3
• eCommercenetsales+96%
WalmartInternational-Q3FY22Resultsarepresentedonaconstantcurrencybasis.Netsalesandcompsalesarepresentedonanominal,calendarbasisandincludeeCommerceresults.Changeiscalculatedasthechangeversustheprioryearcomparableperiod.

• StrongsalesandlappinghigherCOVID-relatedcosts,partiallyoffsetbyinvestmentsinremodels
• HigherpenetrationofSam'sClubloweroperatingexpenseformat
• Changeinmixtohighermargincategories
1WalmexincludestheconsolidatedresultsofMexicoandCentralAmerica.
12
Walmex1 China Canada
Grossprofitrate SlightDecrease Decrease RelativelyFlat
• InvestmentsinpriceandmixshifttolowermargincategoriesinCentralAmerica
x
• WalmartConnectgrowingmiddouble-digits
• ChangeinmixtolowermarginformatsofSam'sClubandeCommerce
Operatingexpenserate RelativelyFlat Decrease SlightDecrease
Operatingincome$ Increase Increase Increase
WalmartInternational-Q3FY22Resultsarepresentedonaconstantcurrencybasis.Changeiscalculatedasthechangeversustheprioryearcomparableperiod
• InvestmentsineCommerceandtechnology,offsetbyproductivityinitiativesinCentralAmerica

13
+13.9%Comparablesales
+11.1%Comparabletransactions
+2.6%Averagecomparableticket
~170bpseCommercecontribution
$16,614+14%
Netsales
+11.3%Membershipincome
-89.9999999999999bps
Grossprofitrate
-63.9999999999999bps
Operatingexpenserate
$3682.8%
Operatingincome
WithFuel WithoutFuel
Comparablesales1
+19.8%
Netsales
$19.0+19.7%
eCommercenetsalesgrowth
+32%
Comparablesales
+19.8%
Membershipincome
+11.3%
Grossprofitrate
-127bps
Operatingexpenserate
-117bps
Inventory
$5.4+7.3%
Operatingincome
$0.5+10.2%
• Strongmembershiptrendswithrecordtotalmembercount
• RenewalratesimprovedwithPlusmemberrenewalrateincreasingover185bps
• Pluspenetrationincreasedover660bps,reachinganall-timehigh
• Firstyearmemberrenewalsremainstrong
• Increasedsalesinconjunctionwithlaborproductivityimprovementspositivelyaffectedoperatingexpenseleverage
• COVID-relatedcostswerelowerby~$70mil.andbenefitedexpenseleverageby~45bps
• Unfavorablefuelmixandlowerfuelratenegativelyaffectedgrossprofit
• Excludingfuel,highersupplychainexpense,costinflationandhigherFreshwastewerepartiallyoffsetbylowershrink
• Strongcontributionfrombothdirect-to-homeandcurbside
• Strongcompsalesgrowthdrivenbydouble-digittransactionandsolidticketgrowth,aswellasabenefitfromstimulusspendingandinflation
• Onatwo-yearstack,compsalesincreased27.7%
• Broadstrengthacrosscategories,ledbyfood
• Tobacconegativelyaffectedcompsales
1Compsalesforthe13-weekperiodendedOctober29,2021comparedtothe13-weekperiodendedOctober30,2020.
• Increasereflectsinventorybuildtosupporthighersalestrendsandlappinglastyear'sCOVID-relatedeffectsoninventory
Sam'sClub-Q3FY22Dollarsinbillions.Changeiscalculatedasthechangeversustheprioryearcomparableperiod

14
$18,971+19.7%NetSales
+33%eCommercenetsalesgrowth
+19.8%Comparablesales
-127bpsGrossprofitrate
-117bpsOperatingexpenserate
$47510.2%
Operatingincome
WithoutFuel
Netsales
$16.6+13.8%
Operatingexpenserate
-64bps
Grossprofitrate
-90bps
Operatingincome
$0.4+2.8%
Comparabletransactions
+11.1%
Comparablesales1,2
+13.9%
eCommercecontribution
~170bps
Averagecomparableticket
+2.6%
1Compsalesforthe13-weekperiodendedOctober29,2021comparedtothe13-weekperiodendedOctober30,2020,andexcludesfuel.2Tobacconegativelyaffectedcompsalesforthe13-weekperiodendedOctober29,2021by160basispoints.Onatwo-yearstack,tobacconegativelyaffectedcompsalesby580basispoints.
Sam'sClub-Q3FY22Dollarsinbillions.Changeiscalculatedasthechangeversustheprioryearcomparableperiod
• Onatwo-yearstack,averagecompticketincreased6.6%
• Onatwo-yearstack,compsalesincreased25.0%
• Onatwo-yearstack,comptransactionsincreased17.9%
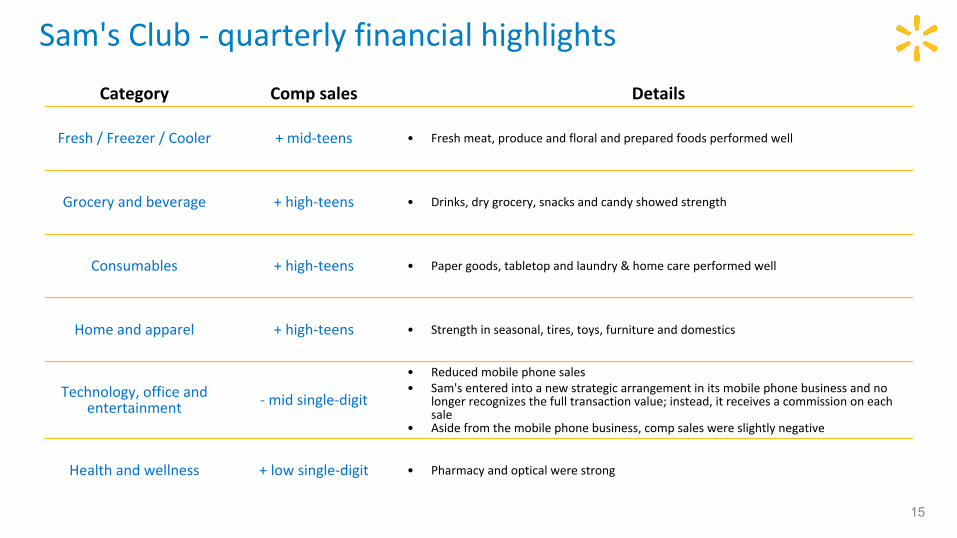
15
Category Compsales Details
Fresh/Freezer/Cooler +mid-teens • Freshmeat,produceandfloralandpreparedfoodsperformedwell
Groceryandbeverage +high-teens • Drinks,drygrocery,snacksandcandyshowedstrength
Consumables +high-teens • Papergoods,tabletopandlaundry&homecareperformedwell
Homeandapparel +high-teens • Strengthinseasonal,tires,toys,furnitureanddomestics
Technology,officeandentertainment -midsingle-digit
• Reducedmobilephonesales• Sam'senteredintoanewstrategicarrangementinitsmobilephonebusinessandno
longerrecognizesthefulltransactionvalue;instead,itreceivesacommissiononeachsale
• Asidefromthemobilephonebusiness,compsaleswereslightlynegative
Healthandwellness +lowsingle-digit • Pharmacyandopticalwerestrong
Sam'sClub-quarterlyfinancialhighlights

WeincludeReturnonAssets("ROA"),whichiscalculatedinaccordancewithU.S.generallyacceptedaccountingprinciples("GAAP")aswellasReturnonInvestment("ROI")asmeasurestoassessreturnsonassets.ManagementbelievesROIisameaningfulmeasuretosharewithinvestorsbecauseithelpsinvestorsassesshoweffectivelyWalmartisdeployingitsassets.TrendsinROIcanfluctuateovertimeasmanagementbalanceslong-termstrategicinitiativeswithpossibleshort-termimpacts.WeconsiderROAtobethefinancialmeasurecomputedinaccordancewithGAAPthatisthemostdirectlycomparablefinancialmeasuretoourcalculationofROI.
ROAwas3.3percentand8.2percentforthetrailing12monthsendedOctober31,2021and2020,respectively.ThedecreaseinROAwasprimarilyduetonetfairvaluechangesinourequityinstrumentsaswellasthelossesondivestitureofouroperationsintheU.K.andJapan,partiallyoffsetbytheincreaseinoperatingincome.ROIwas14.5percentand13.7percentforthetrailingtwelvemonthsendedOctober31,2021and2020.TheincreaseinROIwasprimarilyduetotheincreaseinoperatingincome.
WedefineROIasadjustedoperatingincome(operatingincomeplusinterestincome,depreciationandamortization,andrentexpense)forthetrailingtwelvemonthsdividedbyaverageinvestedcapitalduringthatperiod.Weconsideraverageinvestedcapitaltobetheaverageofourbeginningandendingtotalassets,plusaverageaccumulateddepreciationandaverageamortization,lessaverageaccountspayableandaverageaccruedliabilitiesforthatperiod.
OurcalculationofROIisconsideredanon-GAAPfinancialmeasurebecausewecalculateROIusingfinancialmeasuresthatexcludeandincludeamountsthatareincludedandexcludedinthemostdirectlycomparableGAAPfinancialmeasure.Forexample,weexcludetheimpactofdepreciationandamortizationfromourreportedoperatingincomeincalculatingthenumeratorofourcalculationofROI.Asmentionedabove,weconsiderROAtobethefinancialmeasurecomputedinaccordancewithgenerallyacceptedaccountingprinciplesmostdirectlycomparabletoourcalculationofROI.ROIdiffersfromROA(whichisconsolidatednetincomefortheperioddividedbyaveragetotalassetsfortheperiod)becauseROI:adjustsoperatingincometoexcludecertainexpenseitemsandaddsinterestincome;adjuststotalassetsfortheimpactofaccumulateddepreciationandamortization,accountspayableandaccruedliabilitiestoarriveattotalinvestedcapital.Becauseoftheadjustmentsmentionedabove,webelieveROImoreaccuratelymeasureshowwearedeployingourkeyassetsandismoremeaningfultoinvestorsthanROA.AlthoughROIisastandardfinancialmeasure,numerousmethodsexistforcalculatingacompany'sROI.Asaresult,themethodusedbymanagementtocalculateourROImaydifferfromthemethodsusedbyothercompaniestocalculatetheirROI.
16
Non-GAAPmeasures-ROI

ThecalculationofROAandROI,alongwithareconciliationofROItothecalculationofROA,isasfollows:
17
3 Upon adoption of ASU 2016-02, Leases, a factor of eight times rent is no longer included in the calculation of ROI on a prospective basis as operating lease assets are now recorded on the Consolidated Balance Sheet.
1 The average is based on the addition of the account balance at the end of the current period to the account balance at the end of the prior period and dividing by 2.
2 The average is based on the addition of 'total assets without leased assets, net' at the end of the current period to 'total assets without leased assets, net' at the end of the prior period and dividing by 2, plus 'leased assets, net' at the end of the current period.
3 The average is based on the addition of 'accumulated depreciation and amortization, without leased assets' at the end of the current period to 'accumulated depreciation and amortization, without leased assets' at the end of the prior period and dividing by 2, plus 'accumulated amortization on leased assets' at the end of the current period.
NP = not provided
CALCULATIONOFRETURNONASSETS CALCULATIONOFRETURNONINVESTMENT
TrailingTwelveMonths TrailingTwelveMonths
Ended October31, Ended October31,(Dollarsinmillions) 2021 2020 (Dollarsinmillions) 2021 2020Numerator NumeratorConsolidatednetincome $ 8,299 $ 20,008 Operatingincome $ 25,542 $ 22,383Denominator +Interestincome 141 132Averagetotalassets1 $ 247,857 $ 245,347 +Depreciationandamortization 10,771 11,161Returnonassets(ROA) 3.3% 8.2% +Rent 2,360 2,646
ROIoperatingincome $ 38,814 $ 36,322
October31, DenominatorCertainBalanceSheetData 2021 2020 2019 Averagetotalassets1 $ 247,857 $ 245,347
Totalassets $ 244,851 $ 250,863 $ 239,830'+Averageaccumulateddepreciationandamortization1 99,872 95,637
Accumulateddepreciationandamortization 100,168 99,576 91,697 '-Averageaccountspayable1 55,654 51,951Accountspayable 57,156 54,152 49,750 '-Averageaccruedliabilities1 24,735 22,984
Accruedliabilities 24,474 24,995 20,973 Averageinvestedcapital $ 267,340 $ 266,049
Returnoninvestment(ROI) 14.5% 13.7%
1Theaverageisbasedontheadditionoftheaccountbalanceattheendofthecurrentperiodtotheaccountbalanceattheendofthepriorperiodanddividingby2.
Non-GAAPmeasures-ROI(cont.)

1"Netcashusedininvestingactivities"includespaymentsforpropertyandequipment,whichisalsoincludedinourcomputationoffreecashflow.
18
Wedefinefreecashflowasnetcashprovidedbyoperatingactivitiesinaperiodminuspaymentsforpropertyandequipmentmadeinthatperiod.Wehadnetcashprovidedbyoperatingactivitiesof$16.3billionfortheninemonthsendedOctober31,2021,whichdecreasedwhencomparedto$22.9billionfortheninemonthsendedOctober31,2020primarilyduetoanincreaseininventorypurchasestosupportstrongsalesandlappingtheimpactofacceleratedinventorysell-throughinfiscal2021,aswellastimingandpaymentofwages.Wegeneratedfreecashflowof$7.7billionfortheninemonthsendedOctober31,2021,whichdecreasedwhencomparedto$16.4billionfortheninemonthsendedOctober31,2020duetothesamereasonsasthedecreaseinnetcashprovidedbyoperatingactivities,aswellas$2.2billioninincreasedcapitalexpenditures.
Freecashflowisconsideredanon-GAAPfinancialmeasure.Managementbelieves,however,thatfreecashflow,whichmeasuresourabilitytogenerateadditionalcashfromourbusinessoperations,isanimportantfinancialmeasureforuseinevaluatingthecompany’sfinancialperformance.Freecashflowshouldbeconsideredinadditionto,ratherthanasasubstitutefor,consolidatednetincomeasameasureofourperformanceandnetcashprovidedbyoperatingactivitiesasameasureofourliquidity.Additionally,Walmart’sdefinitionoffreecashflowislimited,inthatitdoesnotrepresentresidualcashflowsavailablefordiscretionaryexpenditures,duetothefactthatthemeasuredoesnotdeductthepaymentsrequiredfordebtserviceandothercontractualobligationsorpaymentsmadeforbusinessacquisitions.Therefore,webelieveitisimportanttoviewfreecashflowasameasurethatprovidessupplementalinformationtoourConsolidatedStatementsofCashFlows.Althoughothercompaniesreporttheirfreecashflow,numerousmethodsmayexistforcalculatingacompany’sfreecashflow.Asaresult,themethodusedbyWalmart’smanagementtocalculateourfreecashflowmaydifferfromthemethodsusedbyothercompaniestocalculatetheirfreecashflow.
Thefollowingtablesetsforthareconciliationoffreecashflow,anon-GAAPfinancialmeasure,tonetcashprovidedbyoperatingactivities,whichwebelievetobetheGAAPfinancialmeasuremostdirectlycomparabletofreecashflow,aswellasinformationregardingnetcashusedininvestingactivitiesandnetcashusedinfinancingactivities.
NineMonthsEndedOctober31,
(Dollarsinmillions) 2021 2020
Netcashprovidedbyoperatingactivities $ 16,291 $ 22,880
Paymentsforpropertyandequipment(capitalexpenditures) (8,588) (6,438)
Freecashflow $ 7,703 $ 16,442
Netcashusedininvestingactivities1 $ (1,530) $ (6,507)
Netcashusedinprovidedbyfinancingactivities (18,113) (11,340)
Non-GAAPmeasures-freecashflow

1Changeversusprioryearcomparableperiod.2WalmartInternationaleCommercenetsaleswere$4.3billionand$12.7billionforthethreeandninemonthsendedOctober31,2021,andwerepositivelyimpactedby$126millionand$501
millionofcurrencyexchangeratefluctuations,respectively.WalmartInternationaleCommercenetsaleswere$4.3billionand$10.5billionforthethreeandninemonthsendedOctober31,2020,respectively.
3WalmartInternationaleCommercenetsalesdecreased1%onareportedbasisand4%inconstantcurrencyandincreased21%onareportedbasisand16%inconstantcurrencyforthethreeandninemonthsendingOctober31,2021,respectively.
19
Indiscussingouroperatingresults,thetermcurrencyexchangeratesreferstothecurrencyexchangeratesweusetoconverttheoperatingresultsforcountrieswherethefunctionalcurrencyisnottheU.S.dollarintoU.S.dollars.Wecalculatetheeffectofchangesincurrencyexchangeratesasthedifferencebetweencurrentperiodactivitytranslatedusingthecurrentperiod’scurrencyexchangeratesandthecomparableprioryearperiod’scurrencyexchangerates.Additionally,nocurrencyexchangeratefluctuationsarecalculatedfornon-USDacquisitionsuntilownedfor12months.Throughoutourdiscussion,werefertotheresultsofthiscalculationastheimpactofcurrencyexchangeratefluctuations.Whenwerefertoconstantcurrencyoperatingresults,thismeansoperatingresultswithouttheimpactofthecurrencyexchangeratefluctuations.ThedisclosureofconstantcurrencyamountsorresultspermitsinvestorstobetterunderstandWalmart’sunderlyingperformancewithouttheeffectsofcurrencyexchangeratefluctuations.Thetablebelowreflectsthecalculationofconstantcurrencyfortotalrevenues,netsalesandoperatingincomeforthethreeandninemonthsendedOctober31,2021.
ThreeMonthsEndedOctober31,2021 NineMonthsEndedOctober31,2021
2021PercentChange1 2021
PercentChange1 2021
PercentChange1 2021
PercentChange1
(Dollarsinmillions) WalmartInternational Consolidated WalmartInternational ConsolidatedTotalrevenues:Asreported $ 24,040 -19.4% $ 140,525 4.3% $ 75,098 -14.0% $ 419,883 3.1%Currencyexchangeratefluctuations (1,367) N/A (1,367) N/A (4,720) N/A (4,720) N/AConstantcurrencytotalrevenues $ 22,673 -24.0% $ 139,158 3.3% $ 70,378 -19.4% $ 415,163 2.0%
Netsales2,3:Asreported $ 23,627 -20.1% $ 139,207 4.1% $ 73,962 -14.5% $ 416,237 3.0%Currencyexchangeratefluctuations (1,347) N/A (1,347) N/A (4,657) N/A (4,657) N/AConstantcurrencynetsales $ 22,280 -24.6% $ 137,860 3.1% $ 69,305 -19.9% $ 411,580 1.8%
Operatingincome:Asreported $ 871 -19.2% $ 5,792 0.2% $ 2,926 8.5% $ 20,055 17.5%Currencyexchangeratefluctuations (79) N/A (79) N/A (280) N/A (280) N/AConstantcurrencyoperatingincome $ 792 -26.5% $ 5,713 -1.1% $ 2,646 -1.9% $ 19,775 15.9%
Non-GAAPmeasures-constantcurrency

20
AdjusteddilutedearningspershareattributabletoWalmart(AdjustedEPS)isconsideredanon-GAAPfinancialmeasureundertheSEC’srulesbecauseitexcludescertainamountsincludedinthedilutedearningspershareattributabletoWalmartcalculatedinaccordancewithGAAP(EPS),themostdirectlycomparablefinancialmeasurecalculatedinaccordancewithGAAP.ManagementbelievesthatAdjustedEPSisameaningfulmeasuretosharewithinvestorsbecauseitbestallowscomparisonoftheperformancewiththatofthecomparableperiod.Inaddition,AdjustedEPSaffordsinvestorsaviewofwhatmanagementconsidersWalmart’scoreearningsperformanceandtheabilitytomakeamoreinformedassessmentofsuchcoreearningsperformancewiththatoftheprioryear.
Weadjustfortheunrealizedandrealizedgainsandlossesonourequityinvestmentseachquarterbecausealthoughtheinvestmentsarestrategicdecisionsforthecompany’sretailoperations,management’smeasurementofeachstrategyisprimarilyfocusedontheoperationalresultsratherthanthefairvalueofsuchinvestments.Additionally,managementdoesnotforecastchangesinthefairvalueofitsequityinvestments.Accordingly,managementadjustsEPSeachquarterfortherealizedandunrealizedgainsandlossesrelatedtothoseequityinvestments.
WehavecalculatedAdjustedEPSforthethreeandninemonthsendedOctober31,2021byadjustingEPSforthefollowing:
1. unrealizedandrealizedgainsandlossesonthecompany’sequityinvestments,
2. lossonextinguishmentofdebt;and
3. theincrementallossonsaleofouroperationsintheU.KandJapanrecordedduringthefirstquarteroffiscal2022.
Non-GAAPmeasures-adjustedEPS

21
1Changeversusprioryearcomparableperiod.2Calculatedbasedonnatureofitem,includinganyrealizabledeductions,andstatutoryrateineffectforrelevantjurisdictions.Minimalrealizabletaxbenefitwasprovidedinconnectionwiththeincrementallossonsale.
3Thereportedeffectivetaxratewas24.5%and25.9%forthethreeandninemonthsendedOctober31,2021,respectively.Adjustedfortheaboveitems,theeffectivetaxratewas24.3%and24.5%forthethreeandninemonthsendedOctober31,2021,respectively.
4QuarterlyadjustmentsoradjustedEPSmaynotsumtoYTDadjustmentsorYTDadjustedEPSduetorounding.
ThreeMonthsEndedOctober31,2021PercentChange1 NineMonthsEndedOctober31,20214
PercentChange1
Dilutedearningspershare:
ReportedEPS $ 1.11 -38.3% $ 3.59 -34.5%
Adjustments:Pre-TaxImpact
TaxImpact2,3 NetImpact
Pre-TaxImpact
TaxImpact2,3 NetImpact
Unrealizedandrealized(gains)andlossesonequityinvestments $ (0.42) $ 0.09 $ (0.33) $ 0.65 $ (0.13) $ 0.52
Lossonextinguishmentofdebt 0.86 (0.19) 0.67 0.86 (0.19) 0.67
IncrementallossonsaleofouroperationsintheU.K.andJapan — — — 0.15 — 0.15
Netadjustments $ 0.34 $ 1.34
AdjustedEPS $ 1.45 8.2% $ 4.93 20.8%
Non-GAAPmeasures-adjustedEPS(cont.)

22
AspreviouslydisclosedinourthirdquarterendedOctober31,2020pressrelease,wehavecalculatedAdjustedEPSforthethreeandninemonthsendedOctober31,2020byadjustingEPSforthefollowing:(1)unrealizedgainsandlossesontheCompany’sequityinvestmentsand(2)thelossonsaleofWalmartArgentinaclassifiedasheldforsaleasofOctober31,2020.FortheninemonthsendedOctober31,2020wealsoadjustedEPSfor(3)abusinessrestructuringchargeresultingfromchangestocorporatesupportteamstobettersupporttheWalmartU.S.omnichannelstrategyand(4)adiscretetaxitem.
ThreeMonthsEndedOctober31,2020 NineMonthsEndedOctober31,20204
Dilutedearningspershare:
ReportedEPS $ 1.80 $ 5.48
Adjustments:Pre-TaxImpact
TaxImpact1,2 NCIImpact3 NetImpact
Pre-TaxImpact
TaxImpact1,2 NCIImpact3 NetImpact
Unrealized(gains)andlossesonequityinvestments $ (1.01) $ 0.21 $ — $ (0.80) $ (2.42) $ 0.50 $ — $ (1.92)
LossonsaleofWalmartArgentina 0.34 — — 0.34 0.34 — — 0.34
Businessrestructuringcharge — — — — 0.13 (0.03) — 0.10
Discretetaxitem — — — — 0.06 0.05 (0.03) 0.08
Netadjustments $ (0.46) $ (1.40)
AdjustedEPS $ 1.34 $ 4.08
Non-GAAPmeasures-adjustedEPS(cont.)
1Calculatedbasedonnatureofitem,includinganyrealizabledeductions,andstatutoryrateineffectforrelevantjurisdictions.ThelossonsaleofWalmartArgentinaprovidedminimalrealizabletaxbenefit.
2Thereportedeffectivetaxratewas26.9%%and25.7%forthethreeandninemonthsendedOctober31,2020,respectively.Whenadjustedfortheaboveitems,theeffectivetaxratewas25.2%and25.0%forthethreeandninemonthsendedOctober31,2020,respectively.3Calculatedbasedontheownershippercentagesofournoncontrollinginterests.4QuarterlyadjustmentsoradjustedEPSmaynotsumtoYTDadjustmentsorYTDadjustedEPSduetorounding.

• Unitcounts&squarefootage• Comparablestoresales,includingandexcludingfuel• Terminology
23
Additionalresourcesatstock.walmart.com