Embed Size (px)
Citation preview

Q3 2016 results presentation
2016-10-20

Group summary, Q3 2016
2
• Continued trend of improved performance in Q3 driven by
operational improvements
– Operating income up 6% to SEK 431m
– Operating margin increased 0.4 p.p. to 5.9%
• Higher year-to-date EBIT despite SEK ~450m of
unfavorable currency impact and additional costs for
profitable growth activities
• Strong season for prioritized growth areas such as robotic
mowers, other battery powered products and the Smart
Garden concept
• New financial targets reflecting increased focus
on profitable growth

Group results development rolling 12
3Figures refer to excluding items affecting comparability
5,0%
5,5%
6,0%
6,5%
7,0%
7,5%
8,0%
8,5%
9,0%
9,5%
10,0%
1 000
1 500
2 000
2 500
3 000
3 500Q
3 2
01
3
Q4
201
3
Q1
201
4
Q2
201
4
Q3
201
4
Q4
201
4
Q1
201
5
Q2
201
5
Q3
201
5
Q4
201
5
Q1
201
6
Q2
201
6
Q3
201
6
Operating incomerolling 12 months
Operating marginrolling 12 months
SEKm

Financial highlights Q3 2016, Group
• Divisions in profitable growth mode* grew 2.1% Q3
and 4.7% YTD
• Higher operating income
− Favorable mix and efficiency improvements
− Costs for profitable growth initiatives
− Unfavorable FX impact
• Gross and EBIT margin improvement
4
SEKm
Q3
2016
Q3
2015
As
reported Adjusted1
Jan-Sep
2016
Jan-Sep
2015
As
reported Adjusted1 LTM2
FY
2015
Net sales 7 349 7 307 1 -1 30 214 30 498 -1 0 35 886 36 170
Gross margin, % 31,2 28,4 - - 31,1 29,1 - - 29,8 28,1
Operating income 431 405 6 2 3 326 3 192 4 5 2 961 2 827
Excl. items affecting comparability 431 405 6 2 3 326 3 192 4 5 3 114 2 980
Operating margin, % 5,9 5,5 - - 11,0 10,5 - - 8,3 7,8
Excl. items affecting comparability, % 5,9 5,5 - - 11,0 10,5 - - 8,7 8,25,51 Adjusted for currency translation effects. 2 Last tw elve months rolling
% change, Q % change, 9M
*Excluding Consumer Brands Division

Husqvarna Division Q3 2016
• Growth driven by European market
• Launch of X-cut saw-chain in select markets
• Higher EBIT and margin coming from the higher sales
volume and efficiency improvements
− Higher cost level due to profitable growth initiatives
• Currency impact remains unfavorable
5
SEKm
Q3
2016
Q3
2015
As
reported Adjusted1
Jan-Sep
2016
Jan-Sep
2015
As
reported Adjusted1 LTM2
FY
2015
Net sales 3 752 3 519 7 5 14 930 14 588 2 4 17 966 17 624
Operating income 368 321 14 11 2 243 2 219 1 1 2 257 2 233
Excl. items affecting comparability 368 321 14 11 2 243 2 219 1 1 2 308 2 284
Operating margin, % 9,8 9,1 - - 15,0 15,2 - - 12,6 12,7
Excl. items affecting comparability, % 9,8 9,1 - - 15,0 15,2 - - 12,8 13,01 Adjusted for currency translation effects. 2 Last tw elve months rolling
% change, Q % change, 9M
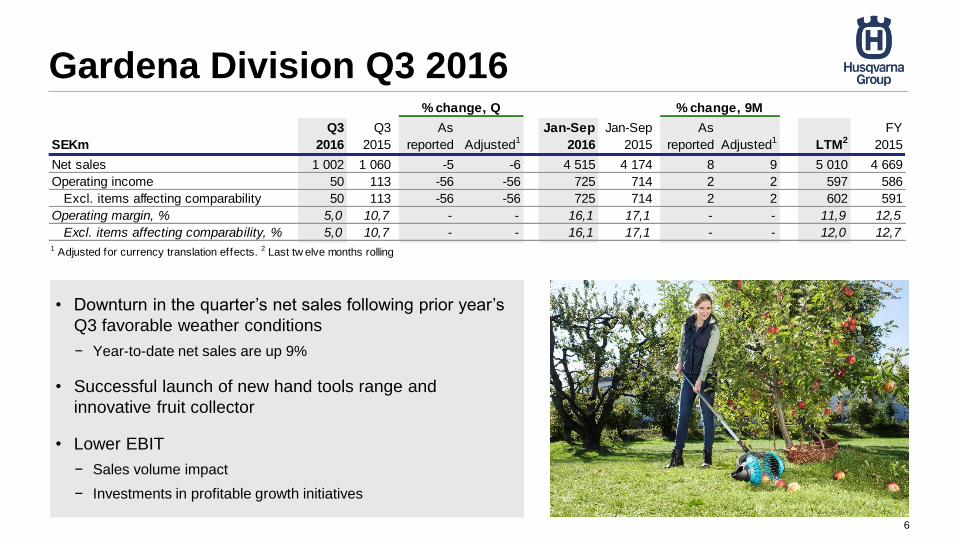
Gardena Division Q3 2016
6
• Downturn in the quarter’s net sales following prior year’s
Q3 favorable weather conditions
− Year-to-date net sales are up 9%
• Successful launch of new hand tools range and
innovative fruit collector
• Lower EBIT
− Sales volume impact
− Investments in profitable growth initiatives
SEKm
Q3
2016
Q3
2015
As
reported Adjusted1
Jan-Sep
2016
Jan-Sep
2015
As
reported Adjusted1 LTM2
FY
2015
Net sales 1 002 1 060 -5 -6 4 515 4 174 8 9 5 010 4 669
Operating income 50 113 -56 -56 725 714 2 2 597 586
Excl. items affecting comparability 50 113 -56 -56 725 714 2 2 602 591
Operating margin, % 5,0 10,7 - - 16,1 17,1 - - 11,9 12,5
Excl. items affecting comparability, % 5,0 10,7 - - 16,1 17,1 - - 12,0 12,71 Adjusted for currency translation effects. 2 Last tw elve months rolling
% change, Q % change, 9M

Consumer Brands Q3 2016
7
• Initial weak demand somewhat balanced by late rebound
• Improvements in EBIT and margin
− Despite unfavorable currency impact and sales decline
• Turn-around progressing according to plan
− Value before volume priority
− Wide range of cost and efficiency measures
SEKm
Q3
2016
Q3
2015
As
reported Adjusted1
Jan-Sep
2016
Jan-Sep
2015
As
reported Adjusted1 LTM2
FY
2015
Net sales 1 553 1 708 -9 -10 7 654 8 694 -12 -11 8 896 9 936
Operating income -80 -119 33 32 131 48 n/a n/a -64 -147
Excl. items affecting comparability -80 -119 33 32 131 48 n/a n/a -37 -120
Operating margin, % -5,2 -7,0 - - 1,7 0,6 - - -0,7 -1,5
Excl. items affecting comparability, % -5,2 -7,0 - - 1,7 0,6 - - -0,4 -1,21 Adjusted for currency translation effects. 2 Last tw elve months rolling
% change, Q % change, 9M

Construction Division Q3 2016
8
• North American construction market remains the
growth driver, however somewhat slower pace
• Continued weak global stone industry
• Surface preparation gaining further momentum through
DTS acquisition
• Higher operating income and margin
− Efficiency improvements
− Profitable growth initiatives
SEKm
Q3
2016
Q3
2015
As
reported Adjusted1
Jan-Sep
2016
Jan-Sep
2015
As
reported Adjusted1 LTM2
FY
2015
Net sales 1 042 1 020 2 1 3 115 3 042 2 3 4 014 3 941
Operating income 155 144 8 6 423 378 12 13 440 395
Excl. items affecting comparability 155 144 8 6 423 378 12 13 510 465
Operating margin, % 14,9 14,1 - - 13,6 12,4 - - 11,0 10,0
Excl. items affecting comparability, % 14,9 14,1 - - 13,6 12,4 - - 12,7 11,81 Adjusted for currency translation effects. 2 Last tw elve months rolling
% change, Q % change, 9M

Consolidated income statement
9
SEKm
Q3
2016
Q3
2015
Jan-Sep
2016
Jan-Sep
2015
FY
2015
Net sales 7 349 7 307 30 214 30 498 36 170
Cost of goods sold -5 058 -5 232 -20 824 -21 630 -25 996
Gross income 2 291 2 075 9 390 8 868 10 174
Gross margin, % 31,2 28,4 31,1 29,1 28,1
Selling expenses -1 438 -1 333 -4 787 -4 518 -5 833
Administrative expenses -415 -350 -1 270 -1 171 -1 532
Other operating income/expense -7 13 -7 13 18
Operating income1
431 405 3 326 3 192 2 827
Operating margin, % 5,9 5,5 11,0 10,5 7,8
Whereof items affecting comparability - - - - -153
Operating income1, excl. items affecting comparability 431 405 3 326 3 192 2 980
Operating margin, % excl. items affecting comparability 5,9 5,5 11,0 10,5 8,2
Financial items, net -124 -83 -338 -277 -344
Income after financial items 307 322 2 988 2 915 2 483
Margin, % 4,2 4,4 9,9 9,6 6,9
Income tax -102 -126 -763 -788 -595
Income for the period 205 196 2 225 2 127 1 888
Diluted earnings per share, SEK 0,36 0,34 3,87 3,69 3,28
1Of which depreciation, amortization and impairment -305 -285 -860 -823 -1 153
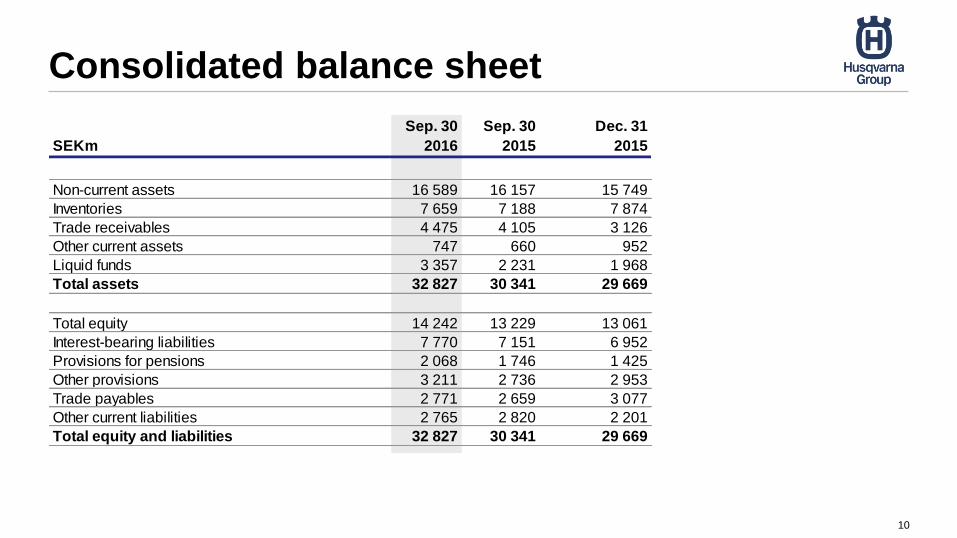
Consolidated balance sheet
10
SEKm
Sep. 30
2016
Sep. 30
2015
Dec. 31
2015
Non-current assets 16 589 16 157 15 749
Inventories 7 659 7 188 7 874
Trade receivables 4 475 4 105 3 126
Other current assets 747 660 952
Liquid funds 3 357 2 231 1 968
Total assets 32 827 30 341 29 669
Total equity 14 242 13 229 13 061
Interest-bearing liabilities 7 770 7 151 6 952
Provisions for pensions 2 068 1 746 1 425
Other provisions 3 211 2 736 2 953
Trade payables 2 771 2 659 3 077
Other current liabilities 2 765 2 820 2 201
Total equity and liabilities 32 827 30 341 29 669

Operating cash flow
-2 500
-2 000
-1 500
-1 000
-500
0
500
1 000
1 500
2 000
2 500
Q1 Q2 Q3 Q4
2014
2015
2016
11
SEKm

Net debt / EBITDA rolling 12 months
12
0,0
0,5
1,0
1,5
2,0
2,5
3,0
3,5
4,02
01
3 Q
1
201
3 Q
2
201
3 Q
3
201
3 Q
4
2014 Q
1
201
4 Q
2
201
4 Q
3
201
4 Q
4
201
5 Q
1
201
5 Q
2
201
5 Q
3
201
5 Q
4
201
6 Q
1
201
6 Q
2
201
6 Q
3
Average rolling 12 months net debt / rolling 12 months EBITDA
Times

Key data, Group
13
Q3
2016
Q3
2015
Jan-Sep
2016
Jan-Sep
2015
Full-year
2015
Net sales, SEKm 7 349 7 307 30 214 30 498 36 170
Net sales growth, % 0,6 7,7 -1,0 10,8 10,1
Gross margin, % 31,2 28,4 31,1 29,1 28,1
Operating income, SEKm 431 405 3 326 3 192 2 827
Excl. items affecting comparability 431 405 3 326 3 192 2 980
Operating margin, % 5,9 5,5 11,0 10,5 7,8
Excl. items affecting comparability 5,9 5,5 11,0 10,5 8,2
Operating working capital, SEKm - - 9 363 8 634 7 923
Return on capital employed, % - - 13,0 9,6 12,4
Excl. items affecting comparability - - 14,8 12,8 13,1
Return on equity, % - - 14,6 9,1 14,6
Excl. items affecting comparability - - 15,4 14,4 15,5
Earnings per share after dilution, SEK 0,36 0,34 3,87 3,69 3,28
Capital turn-over rate, times - - 1,7 1,7 1,7
Operating cash flow, SEKm 1 323 1 443 2 030 1 569 1 732
Net debt/equity ratio - - 0,45 0,50 0,49
Capital expenditure, SEKm 419 339 1 051 947 1 388
Average number of employees 11 668 12 473 12 961 13 886 13 572
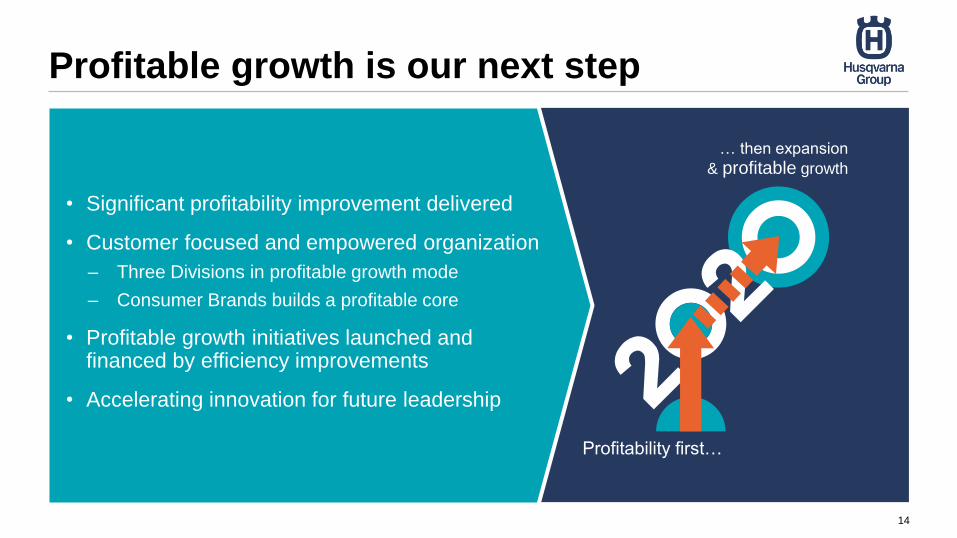
Profitable growth is our next step
14
… then expansion
& profitable growth
Profitability first…
• Significant profitability improvement delivered
• Customer focused and empowered organization
– Three Divisions in profitable growth mode
– Consumer Brands builds a profitable core
• Profitable growth initiatives launched and financed by efficiency improvements
• Accelerating innovation for future leadership

ProfitableGrowth
Our definition of profitable growth
15
Outgrowing the
market with 1-2
p.p. per year
Continuous
improvement
of EBIT margin

New financial targetsAverage over the coming years from 2017
16
Growth* CAGR Net Sales 3 – 5%
Capital efficiencyOperating Working
Capital / Net Sales ≤ 25%
Margin EBIT Margin ≥ 10%
Profitable
growth
* Excluding Consumer Brands Division

www.husqvarnagroup.com