Embed Size (px)
Citation preview
July 2021
For professional clients only. Not to be distributed to retail clients.
Legal & General Investment Management
CAPITAL AT RISK
Q2 2021Thematic ETFs Performance

Confidential
[This page is intentionally left blank]
Confidential
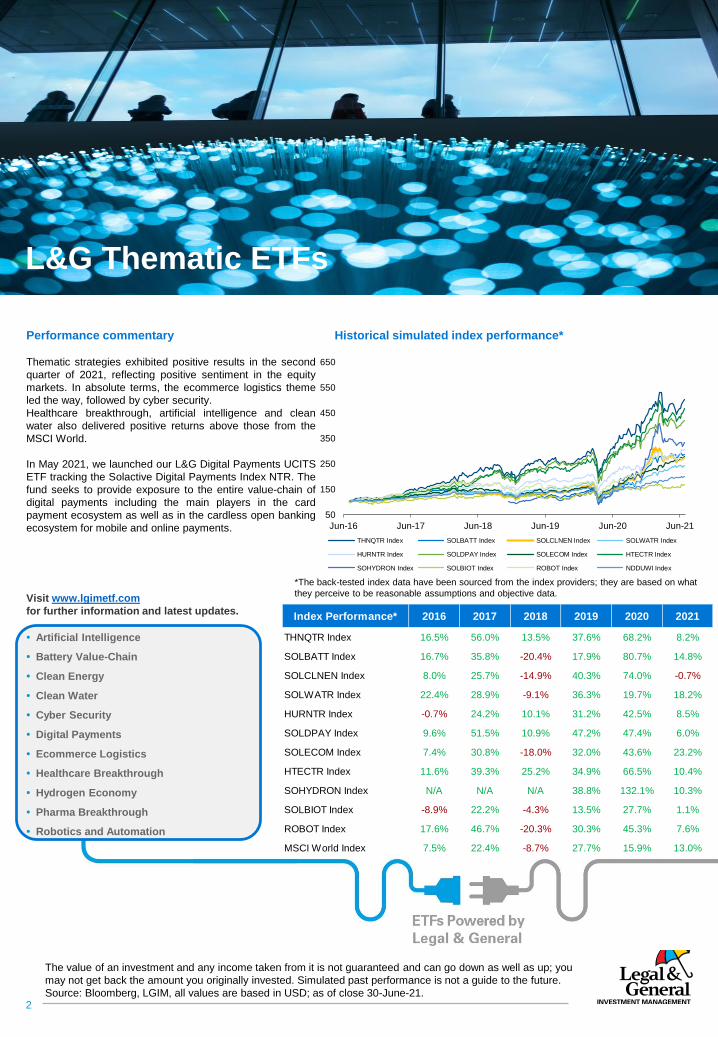
• Artificial Intelligence
• Battery Value-Chain
• Clean Energy
• Clean Water
• Cyber Security
• Digital Payments
• Ecommerce Logistics
• Healthcare Breakthrough
• Hydrogen Economy
• Pharma Breakthrough
• Robotics and Automation
2
Thematic strategies exhibited positive results in the second
quarter of 2021, reflecting positive sentiment in the equity
markets. In absolute terms, the ecommerce logistics theme
led the way, followed by cyber security.
Healthcare breakthrough, artificial intelligence and clean
water also delivered positive returns above those from the
MSCI World.
In May 2021, we launched our L&G Digital Payments UCITS
ETF tracking the Solactive Digital Payments Index NTR. The
fund seeks to provide exposure to the entire value-chain of
digital payments including the main players in the card
payment ecosystem as well as in the cardless open banking
ecosystem for mobile and online payments.
Visit www.lgimetf.com
for further information and latest updates.
Performance commentary Historical simulated index performance*
L&G Thematic ETFs
*The back-tested index data have been sourced from the index providers; they are based on what
they perceive to be reasonable assumptions and objective data.
The value of an investment and any income taken from it is not guaranteed and can go down as well as up; you
may not get back the amount you originally invested. Simulated past performance is not a guide to the future.
Source: Bloomberg, LGIM, all values are based in USD; as of close 30-June-21.
50
150
250
350
450
550
650
Jun-16 Jun-17 Jun-18 Jun-19 Jun-20 Jun-21
THNQTR Index SOLBATT Index SOLCLNEN Index SOLWATR Index
HURNTR Index SOLDPAY Index SOLECOM Index HTECTR Index
SOHYDRON Index SOLBIOT Index ROBOT Index NDDUWI Index
Index Performance* 2016 2017 2018 2019 2020 2021
THNQTR Index 16.5% 56.0% 13.5% 37.6% 68.2% 8.2%
SOLBATT Index 16.7% 35.8% -20.4% 17.9% 80.7% 14.8%
SOLCLNEN Index 8.0% 25.7% -14.9% 40.3% 74.0% -0.7%
SOLWATR Index 22.4% 28.9% -9.1% 36.3% 19.7% 18.2%
HURNTR Index -0.7% 24.2% 10.1% 31.2% 42.5% 8.5%
SOLDPAY Index 9.6% 51.5% 10.9% 47.2% 47.4% 6.0%
SOLECOM Index 7.4% 30.8% -18.0% 32.0% 43.6% 23.2%
HTECTR Index 11.6% 39.3% 25.2% 34.9% 66.5% 10.4%
SOHYDRON Index N/A N/A N/A 38.8% 132.1% 10.3%
SOLBIOT Index -8.9% 22.2% -4.3% 13.5% 27.7% 1.1%
ROBOT Index 17.6% 46.7% -20.3% 30.3% 45.3% 7.6%
MSCI World Index 7.5% 22.4% -8.7% 27.7% 15.9% 13.0%

Confidential
ECONOMY AND POLICY
The second quarter’s buoyant market was driven by widespread
optimism about global growth, continued monetary and fiscal support
and a pickup in demand and economic activity. Central banks
alleviated concerns about rising inflation, attributing the spikes to
temporary consumption patterns and spending on sectors such as
hospitality and transportation, which were largely depressed during
the past year. The equity market might also keep its momentum as
rising earnings estimates start to catch up with high P/Es.
Commodity prices rallied, pushed higher by the increase in industrial
activity and investors’ preference for inflation-hedging assets.
Volatility reverted to pre-pandemic levels and credit spreads
remained tight. The US dollar weakened on the back of other
countries catching up with successful vaccine rollouts and reopening
plans.
Fiscal and monetary stimulus: US President Biden unveiled a $1.8tn
Families Plan and a $2.25tn Jobs Plan, as part of a larger $6tn
proposal to tackle inequality, improve education and infrastructure
and invest more in the fight against climate change. Whilst the Fed
signalled a couple of rate hikes by 2023, both the US central bank
and the ECB maintained interest rates unchanged and will continue
their bond purchasing programmes. The sustained expansionary
stimulus kept benefitting credit and equity markets. G7 leaders
agreed on a global corporate minimum tax rate of 15%, mainly
targeting large tech companies which have thus far avoided large
amounts of tax through tax havens.
Commitments towards Climate: This year’s G7 annual summit
marked another milestone in the race against climate change. G7
leaders reinforced their intention to integrate environmental
considerations in policy making and to improve the consistency of
ESG reporting. A Dutch court mandated that Royal Dutch Shell cut
greenhouse emissions by 45% by 2030 from 2019 levels, another
example of mounting pressure on energy companies to ramp up
their efforts in cutting CO2 emissions.
Global CO2 emissions per major emitting sector (GtCO2),
including AFOLU
Source: Emission Database for Global Atmospheric Research (EDGAR) release version
5.0, FAO, Goldman Sachs Global Investment Research
INVESTMENT THEMES
Hydrogen is playing a key role in the reduction of CO2 emissions
and the transition to renewable resources. The use of hydrogen
could be particularly instrumental in economies like China, which is
the largest CO2 producer and whose energy capacity is largely
dominated by coal (approx. 60%). The Chinese government has
embarked on the ambitious goal of hitting its peak of CO2 emissions
by 2030 and achieving carbon neutrality by 2060. As a result, the
China Hydrogen Alliance has estimated that annual hydrogen
demand will rise at a 10% CAGR from 2025 to 2030 and at a 4%
CAGR from 2030 to 2050.Source: National Energy Agency, J.P. Morgan
YouTube views on BEVs (battery electric vehicles) videos have
reached an all-time high, 14x higher than last year, and the sale of
passenger EVs is forecast to rise to 28m in 2030 and 56m in 2040.
However, the global chip shortage triggered at the end of 2020 by
the heavy reliance on semiconductors is still underway and could
persist into 2022. This has started to affect auto manufacturers, with
some being forced to give up particular features or downgrade
specifications, in order to keep up production.
Source: BofA Global Research
Whilst restrictions ease across many countries, trends such as online
shopping and consumers’ preference for cashless payment methods
are outlasting the pandemic. The global digital payment market size
is expected to expand at a 19.4% CAGR from 2021 to 2028.Source: Grand View Research, Market Analysis Report
Did you know?
Global GDP could rise by 8% in 2040 if opportunities from active
ageing are fully exploited. To achieve this goal, it is critical to invest
in healthcare and the preventative treatment of diseases, to reduce
early deaths and health conditions, as well as promote re-skilling,
extended periods of productivity and expanded participation for the
elderly.Source: Barclays Research
VIRUS DEVELOPMENTS
Despite successful vaccine rollout campaigns in developed
countries, uncertainties remain around the spread of new variants,
the ability to travel, and the speedy spread of the virus in some
emerging markets, such as India, which support the case for a K-
shaped recovery.
3
For illustrative purposes only. The above information does not constitute a recommendation to buy or sell any security.
Source: LGIM, Goldman Sachs, JP Morgan, BofA, Grand View, Barclays.
Q2 Macro Update

Confidential
4
Artificial Intelligence
COMPANY SPOTLIGHT
Nuance Communications, a US-based company, is a pioneer in
speech recognition and artificial intelligence technology,
specifically in natural language processing (NLP). Nuance, over
the past several years, has unveiled many new advancements in
its core technology, enabling more intelligent and autonomous
interactions in conversational AI to become a category leader.
Nuance has leveraged deep neural networks to help customers
rapidly design intelligent dialogue across communication networks,
virtual assistants on the web, messaging channels and voice-
powered smart devices. Amongst other index members for AIAI,
Nuance has one of the highest revenue purities in artificial
intelligence as an infrastructure software company.
With over 2,350 patents, 1,600 software engineers, and 77% of US
hospitals using Nuance’s conversational AI platform, it was not
surprising that Microsoft was very keen on acquiring its assets.
During the quarter, Microsoft announced its intent to purchase
Nuance for $16 billion in a cash transaction. With Nuance,
Microsoft is expanding into a high-growth healthcare industry as
the growing demand for AI continues to accelerate. Even before
the acquisition announcement, shares of Nuance rose almost
100% in the past 12 months as it was one of the key AI players in
healthcare. Nuance’s Healthcare Cloud revenue experienced 37%
YoY growth in 2020. The Nuance deal reflects a growing demand
for technology applications in healthcare, in particular the use of AI
in clinical documentation for doctor visits. The deal is expected to
close by year end.
LAST QUARTER PERFORMANCE COMMENTARY
The ROBO Global Artificial Intelligence Index gained +9.45% in
2Q21, slightly outperforming the broader market indices, the MSCI
World at +7.4% and S&P 500’s +8.6% gain. After a sharp pullback
in 1Q21, the index companies bounced back during the quarter
spurred by M&A activity and strong earnings results. Artificial
intelligence capabilities are currently highly sought out by many
enterprise leaders looking to enhance their cost structure by
improving efficiencies, and to grow their revenues for the next
decade. Adoption and deployment around cloud and AI systems is
not an option but a must have for the majority of the companies
that are leaders in their respective areas.
By subsector, Network & Security (+18%), Cognitive Computing
(+17%) and Cloud Providers (+13%) delivered strong double-digit
returns, while Consumer (-4%) declined in Q2. Semiconductor also
extended its momentum from Q1, posting a gain of +13%.
M&A activity remained strong during the quarter with three index
member takeouts at a significant premium. Nuance Systems
(+25%), a pioneer in conversational AI, agreed to a $16 billion all-
cash offer from Microsoft while cybersecurity provider Proofpoint
Systems announced it will be acquired by Thoma Bravo for $12.3
billion. The Proofpoint deal is the largest cloud-enabled software
acquisition by a private-equity company. Nuance was Microsoft’s
second-largest acquisition. Cloudera, an enterprise AI company,
was sold to a group of private-equity firms for $5.3 billion.
Since inception of the index, 9 index members have been
acquired. We expect M&A activity, both strategic and financial, to
remain high for the rest of 2021 as large companies look to acquire
AI technology and capabilities.
For illustrative purposes only. Reference to a particular security is on a historic basis and does not mean that the securityis currently held or will be held within an LGIM portfolio. The above information does not constitute a recommendation to buy or sell any security.

Confidential
Source: Bloomberg, LGIM; All values are based in USD; As of close of 30-June-21. Please refer to the end of this report for all definitions.
**Analyst recommendation is based on median recommendations for each company.
The value of an investment and any income taken from it is not guaranteed and can go down as well as up;
You may not get back the amount you originally invested. Simulated past performance is not a guide to the future.5
Artificial Intelligence
Historical simulated performance (1y) Historical simulated performance (5y)
Index Performance* QtD 1 year 3 years 5 years
Cumulative Return 9.5% 48.3% 126.7% 402.5%By Domicile Annualized Return 31.3% 38.1%
Volatility 18.7% 24.7% 28.1% 23.9%
Information Ratio 234.09% 195.96% 111.52% 159.37%
Max Drawdown -12.7% -18.6% -34.7% -34.7%
Nvidia Corp 0.82% Blue Prism Group -0.6%By Revenue Source Cloudflare Inc-A 0.78% Irobot Corp -0.4%
Proofpoint Inc 0.60% Veracyte Inc -0.4%
Nuance Communica 0.42% Appen Ltd -0.2%
Shopify Inc - A 0.40% Fiserv Inc -0.1%
Key ratios
Current Q2 2020
EPS 0.97 0.44 BUTTERFLY NETWORK INC CLOUDERA INC
Price/Sales 10.24 8.16 LEMONADE INC NUANCE COMMUNICATIONS INC
BPS 10.58 7.98 MCAFEE CORP PROOFPOINT INC
P/E Positive 54.02 61.20 NORTONLIFELOCK INC TALEND SA
ROE 14.95 8.76
Price/Book 10.34 11.21
Ticker AIAI LN ISIN IE00BK5BCD43
P/E (1y fwd) 72.49 56.56 S&P 500 13.1% TER 0.49% Inception date 02/07/2019
P/E (3y fwd) 37.44 37.78 MSCI World 11.0% Currency USD Index inception date 14-Dec-18
Sales (1y fwd) 19,349 16,512 Nasdaq 100 18.5% Securities lending No Replication method Physical
Sales (3y fwd) 28,503 22,158
*Source: Bloomberg. The backtested index data has been sourced from the index provider and is based on what they perceive to be reasonable
assumptions and objective data; The index data is gross of fees/costs but is net of withholding taxes. Shaded area indicates live period of the index.
Geographical Breakdown Market Cap Breakdown
Index total return contribution (QtD)
Top 5 Bottom 5
Total stocks = 74
Portfolio composition
Analyst recommendation** Latest Additions Latest Deletions
Constituents overlap Fund Information
50
70
90
110
130
150
170
Jun-20 Sep-20 Dec-20 Mar-21 Jun-21
ROBO Global Artificial Intelligence Index TR
MSCI World Net Total Return USD Index
50
150
250
350
450
550
650
Jun-16 Jun-17 Jun-18 Jun-19 Jun-20 Jun-21
ROBO Global Artificial Intelligence Index TR
MSCI World Net Total Return USD Index
29% 38% 11% 23%
APAC North America EMEA Other
U.S.
China
IsraelTaiwan
Others
0% 50% 100%
Small
Mid
Large
HoldBuy
0%100%
Confidential
6
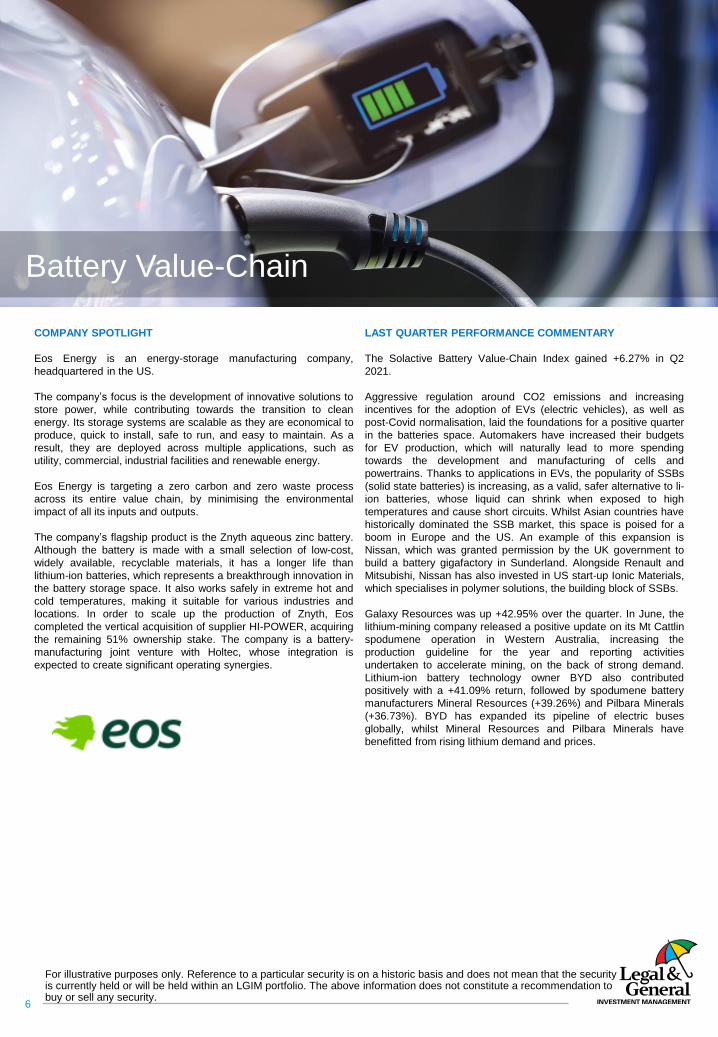
Battery Value-Chain
COMPANY SPOTLIGHT
Eos Energy is an energy-storage manufacturing company,
headquartered in the US.
The company’s focus is the development of innovative solutions to
store power, while contributing towards the transition to clean
energy. Its storage systems are scalable as they are economical to
produce, quick to install, safe to run, and easy to maintain. As a
result, they are deployed across multiple applications, such as
utility, commercial, industrial facilities and renewable energy.
Eos Energy is targeting a zero carbon and zero waste process
across its entire value chain, by minimising the environmental
impact of all its inputs and outputs.
The company’s flagship product is the Znyth aqueous zinc battery.
Although the battery is made with a small selection of low-cost,
widely available, recyclable materials, it has a longer life than
lithium-ion batteries, which represents a breakthrough innovation in
the battery storage space. It also works safely in extreme hot and
cold temperatures, making it suitable for various industries and
locations. In order to scale up the production of Znyth, Eos
completed the vertical acquisition of supplier HI-POWER, acquiring
the remaining 51% ownership stake. The company is a battery-
manufacturing joint venture with Holtec, whose integration is
expected to create significant operating synergies.
LAST QUARTER PERFORMANCE COMMENTARY
The Solactive Battery Value-Chain Index gained +6.27% in Q2
2021.
Aggressive regulation around CO2 emissions and increasing
incentives for the adoption of EVs (electric vehicles), as well as
post-Covid normalisation, laid the foundations for a positive quarter
in the batteries space. Automakers have increased their budgets
for EV production, which will naturally lead to more spending
towards the development and manufacturing of cells and
powertrains. Thanks to applications in EVs, the popularity of SSBs
(solid state batteries) is increasing, as a valid, safer alternative to li-
ion batteries, whose liquid can shrink when exposed to high
temperatures and cause short circuits. Whilst Asian countries have
historically dominated the SSB market, this space is poised for a
boom in Europe and the US. An example of this expansion is
Nissan, which was granted permission by the UK government to
build a battery gigafactory in Sunderland. Alongside Renault and
Mitsubishi, Nissan has also invested in US start-up Ionic Materials,
which specialises in polymer solutions, the building block of SSBs.
Galaxy Resources was up +42.95% over the quarter. In June, the
lithium-mining company released a positive update on its Mt Cattlin
spodumene operation in Western Australia, increasing the
production guideline for the year and reporting activities
undertaken to accelerate mining, on the back of strong demand.
Lithium-ion battery technology owner BYD also contributed
positively with a +41.09% return, followed by spodumene battery
manufacturers Mineral Resources (+39.26%) and Pilbara Minerals
(+36.73%). BYD has expanded its pipeline of electric buses
globally, whilst Mineral Resources and Pilbara Minerals have
benefitted from rising lithium demand and prices.
For illustrative purposes only. Reference to a particular security is on a historic basis and does not mean that the security is currently held or will be held within an LGIM portfolio. The above information does not constitute a recommendation to buy or sell any security.
Confidential
7
Battery Value-Chain
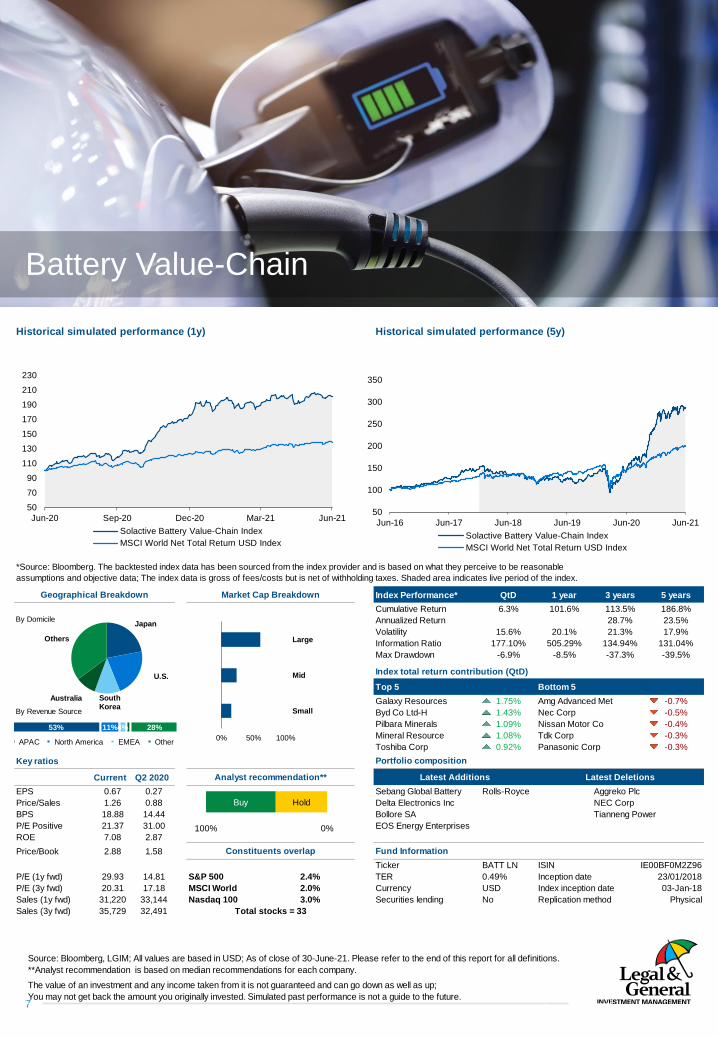
Historical simulated performance (1y) Historical simulated performance (5y)
Index Performance* QtD 1 year 3 years 5 years
Cumulative Return 6.3% 101.6% 113.5% 186.8%By Domicile Annualized Return 28.7% 23.5%
Volatility 15.6% 20.1% 21.3% 17.9%
Information Ratio 177.10% 505.29% 134.94% 131.04%
Max Drawdown -6.9% -8.5% -37.3% -39.5%
Galaxy Resources 1.75% Amg Advanced Met -0.7%By Revenue Source Byd Co Ltd-H 1.43% Nec Corp -0.5%
Pilbara Minerals 1.09% Nissan Motor Co -0.4%
Mineral Resource 1.08% Tdk Corp -0.3%
Toshiba Corp 0.92% Panasonic Corp -0.3%
Key ratios
Current Q2 2020
EPS 0.67 0.27 Sebang Global Battery Rolls-Royce Aggreko Plc
Price/Sales 1.26 0.88 Delta Electronics Inc NEC Corp
BPS 18.88 14.44 Bollore SA Tianneng Power
P/E Positive 21.37 31.00 EOS Energy Enterprises
ROE 7.08 2.87
Price/Book 2.88 1.58
Ticker BATT LN ISIN IE00BF0M2Z96
P/E (1y fwd) 29.93 14.81 S&P 500 2.4% TER 0.49% Inception date 23/01/2018
P/E (3y fwd) 20.31 17.18 MSCI World 2.0% Currency USD Index inception date 03-Jan-18
Sales (1y fwd) 31,220 33,144 Nasdaq 100 3.0% Securities lending No Replication method Physical
Sales (3y fwd) 35,729 32,491
*Source: Bloomberg. The backtested index data has been sourced from the index provider and is based on what they perceive to be reasonable
assumptions and objective data; The index data is gross of fees/costs but is net of withholding taxes. Shaded area indicates live period of the index.
Total stocks = 33
Index total return contribution (QtD)
Geographical Breakdown Market Cap Breakdown
Constituents overlap Fund Information
Top 5 Bottom 5
Portfolio composition
Analyst recommendation** Latest Additions Latest Deletions
50
70
90
110
130
150
170
190
210
230
Jun-20 Sep-20 Dec-20 Mar-21 Jun-21
Solactive Battery Value-Chain Index
MSCI World Net Total Return USD Index
50
100
150
200
250
300
350
Jun-16 Jun-17 Jun-18 Jun-19 Jun-20 Jun-21
Solactive Battery Value-Chain Index
MSCI World Net Total Return USD Index
53% 11%4% 28%
APAC North America EMEA Other
Japan
U.S.
South Korea
Australia
Others
0% 50% 100%
Small
Mid
Large
HoldBuy
0%100%
Source: Bloomberg, LGIM; All values are based in USD; As of close of 30-June-21. Please refer to the end of this report for all definitions.
**Analyst recommendation is based on median recommendations for each company.
The value of an investment and any income taken from it is not guaranteed and can go down as well as up;
You may not get back the amount you originally invested. Simulated past performance is not a guide to the future.
Confidential
8
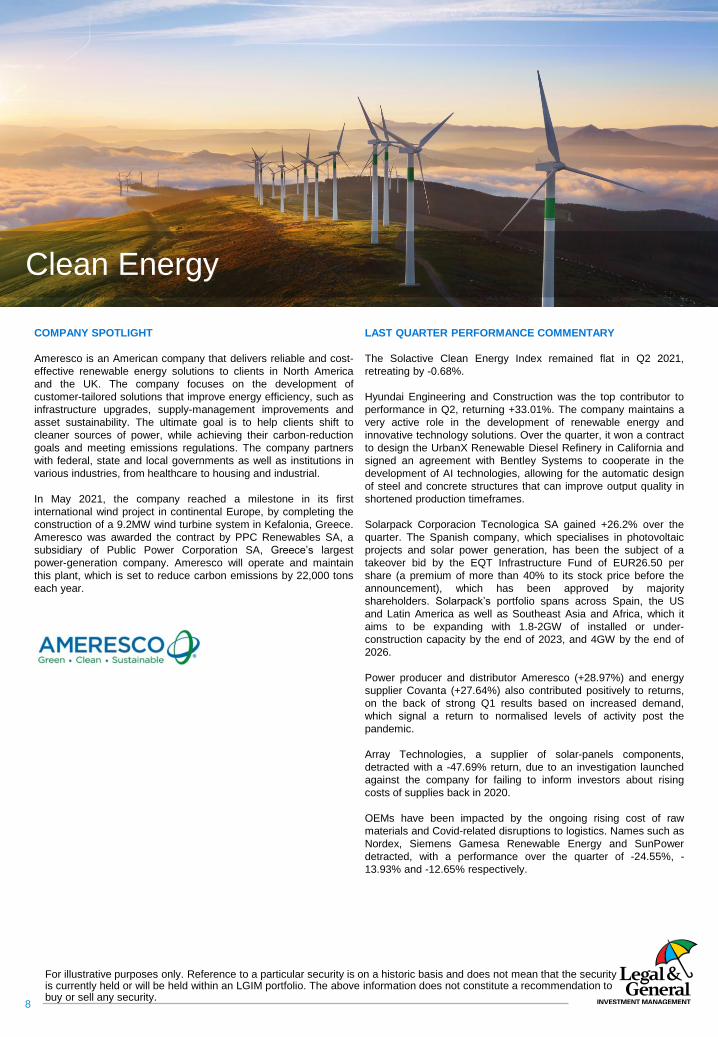
Clean Energy
COMPANY SPOTLIGHT
Ameresco is an American company that delivers reliable and cost-
effective renewable energy solutions to clients in North America
and the UK. The company focuses on the development of
customer-tailored solutions that improve energy efficiency, such as
infrastructure upgrades, supply-management improvements and
asset sustainability. The ultimate goal is to help clients shift to
cleaner sources of power, while achieving their carbon-reduction
goals and meeting emissions regulations. The company partners
with federal, state and local governments as well as institutions in
various industries, from healthcare to housing and industrial.
In May 2021, the company reached a milestone in its first
international wind project in continental Europe, by completing the
construction of a 9.2MW wind turbine system in Kefalonia, Greece.
Ameresco was awarded the contract by PPC Renewables SA, a
subsidiary of Public Power Corporation SA, Greece’s largest
power-generation company. Ameresco will operate and maintain
this plant, which is set to reduce carbon emissions by 22,000 tons
each year.
LAST QUARTER PERFORMANCE COMMENTARY
The Solactive Clean Energy Index remained flat in Q2 2021,
retreating by -0.68%.
Hyundai Engineering and Construction was the top contributor to
performance in Q2, returning +33.01%. The company maintains a
very active role in the development of renewable energy and
innovative technology solutions. Over the quarter, it won a contract
to design the UrbanX Renewable Diesel Refinery in California and
signed an agreement with Bentley Systems to cooperate in the
development of AI technologies, allowing for the automatic design
of steel and concrete structures that can improve output quality in
shortened production timeframes.
Solarpack Corporacion Tecnologica SA gained +26.2% over the
quarter. The Spanish company, which specialises in photovoltaic
projects and solar power generation, has been the subject of a
takeover bid by the EQT Infrastructure Fund of EUR26.50 per
share (a premium of more than 40% to its stock price before the
announcement), which has been approved by majority
shareholders. Solarpack’s portfolio spans across Spain, the US
and Latin America as well as Southeast Asia and Africa, which it
aims to be expanding with 1.8-2GW of installed or under-
construction capacity by the end of 2023, and 4GW by the end of
2026.
Power producer and distributor Ameresco (+28.97%) and energy
supplier Covanta (+27.64%) also contributed positively to returns,
on the back of strong Q1 results based on increased demand,
which signal a return to normalised levels of activity post the
pandemic.
Array Technologies, a supplier of solar-panels components,
detracted with a -47.69% return, due to an investigation launched
against the company for failing to inform investors about rising
costs of supplies back in 2020.
OEMs have been impacted by the ongoing rising cost of raw
materials and Covid-related disruptions to logistics. Names such as
Nordex, Siemens Gamesa Renewable Energy and SunPower
detracted, with a performance over the quarter of -24.55%, -
13.93% and -12.65% respectively.
For illustrative purposes only. Reference to a particular security is on a historic basis and does not mean that the security is currently held or will be held within an LGIM portfolio. The above information does not constitute a recommendation to buy or sell any security.

Confidential
Historical simulated performance (1y) Historical simulated performance (5y)
Index Performance* QtD 1 year 3 years 5 years
Cumulative Return -0.7% 76.8% 112.9% 174.5%By Domicile Annualized Return 28.6% 22.4%
Volatility 18.6% 22.7% 22.8% 18.8%
Information Ratio -14.46% 339.09% 125.59% 118.94%
Max Drawdown -12.2% -20.3% -40.7% -40.7%
Hyundai Eng&Cons 0.62% Array Technologi -0.7%By Revenue Source Ameresco Inc-A 0.56% Sunworks Inc -0.7%
Solarpack Corp T 0.53% Nordex Se -0.6%
Covanta Holding 0.46% Hitachi Zosen -0.4%
Wsp Global Inc 0.41% Yokogawa Elec -0.3%
Key ratios
Current Q2 2020
EPS 0.66 0.49 no rebalancing in Q2 no rebalancing in Q2
Price/Sales 1.96 0.97
BPS 8.01 7.19
P/E Positive 43.07 28.80
ROE 6.26 5.56
Price/Book 3.69 2.32
Ticker RENW LN ISIN IE00BK5BCH80
P/E (1y fwd) 29.90 19.53 S&P 500 1.9% TER 0.49% Inception date 11/11/2020
P/E (3y fwd) 26.27 18.84 MSCI World 1.6% Currency USD Index inception date 26-Jun-20
Sales (1y fwd) 10,079 8,891 Nasdaq 100 1.9% Securities lending No Replication method Physical
Sales (3y fwd) 10,829 9,901
*Source: Bloomberg. The backtested index data has been sourced from the index provider and is based on what they perceive to be reasonable
assumptions and objective data; The index data is gross of fees/costs but is net of withholding taxes. Shaded area indicates live period of the index.
Geographical Breakdown Market Cap Breakdown
Index total return contribution (QtD)
Top 5 Bottom 5
Total stocks = 57
Portfolio composition
Analyst recommendation** Latest Additions Latest Deletions
Constituents overlap Fund Information
50
70
90
110
130
150
170
190
210
Jun-20 Sep-20 Dec-20 Mar-21 Jun-21
Solactive Clean Energy Index NTR
MSCI World Net Total Return USD Index
50
100
150
200
250
300
350
Jun-16 Jun-17 Jun-18 Jun-19 Jun-20 Jun-21
Solactive Clean Energy Index NTR
MSCI World Net Total Return USD Index
31% 24% 33% 10%
APAC North America EMEA Other
U.S.
Japan
GermanyCanada
Others
0% 50% 100%
Small
Mid
Large
HoldBuy
0%100%
9
Clean Energy
Source: Bloomberg, LGIM; All values are based in USD; As of close of 30-June-21. Please refer to the end of this report for all definitions.
**Analyst recommendation is based on median recommendations for each company.
The value of an investment and any income taken from it is not guaranteed and can go down as well as up;
You may not get back the amount you originally invested. Simulated past performance is not a guide to the future.

Confidential
10
Clean Water
COMPANY SPOTLIGHT
Sulzer is a Swiss company active in fluid engineering. It specialises
in pumping, agitation, mixing, separation and application
technologies for fluids, with production and service locations based
in 180 locations globally, including emerging markets.
The Pumps Equipment division is one of the many business areas
of the company, which specialises in pumping solutions for water
amongst others.
Sulzer’s pumps and related equipment have many applications in
the water and wastewater space, including desalinisation, water
intake, transportation and irrigation, municipal clean water and
wastewater, flood control, industrial water treatment, domestic and
commercial wastewater and dewatering.
The acquisition of Nordic Water, completed in February 2021,
strengthened Sulzer’s positioning within the water treatment sector.
Nordic Water is a key player in the municipal and industrial clean-
water business. Sulzer will be able to leverage its established
technologies and equipment such as pumps, grinders, mixers and
compressors used to clean drinking water and wastewater.
More recently, the company has contributed to the transformation
of a large wastewater treatment plant in Vienna into a self-
sufficient, sustainable facility which produces 78GWh of electricity
and 82GWh of heat from biogas, as well as processing up to 1,000
cubic meters of wastewater per minute, reducing the city’s carbon
emissions by 40,000 tonnes annually.
LAST QUARTER PERFORMANCE COMMENTARY
The Solactive Clean Water Index gained +9.35% in Q2 2021.
The water technologies / digital solutions segment was the best-
performing one over the quarter, with Tetra Technologies and
Uponor, two players in this space, contributing the most to
performance.
Tetra Technologies entered the index in Q1 2021 and was the top
contributor to performance in Q2, delivering a return of +80.83%.
The company released positive financial results for the first quarter,
with the Water & Flowback Services and Completion Fluids &
Products segments gaining momentum. In the first quarter, its
TETRA BlueLinx digitised control system solution continued to be a
key driver of profitability, achieving a record-high 47 integrated
water management projects with 22 different customers. The
significant growth of the company led to its recent inclusion in the
Russell 3000 Index. Uponor also enjoyed good performance,
benefitting from its innovative pipeline solutions being adopted
across the construction sector and returning +30.29% over the
quarter. Evoqua, a player in the water engineering segment
specialising in water and wastewater treatment, also posted
positive returns at +28.44%.
Companies in the utilities and engineering sectors performed less
well, with names such as Guangdong Investment, Organo and
Consolidated Water falling -8.55%, -6.59% and -12.16%
respectively.
For illustrative purposes only. Reference to a particular security is on a historic basis and does not mean that the security is currently held or will be held within an LGIM portfolio. The above information does not constitute a recommendation to buy or sell any security.
Confidential
11
Clean Water
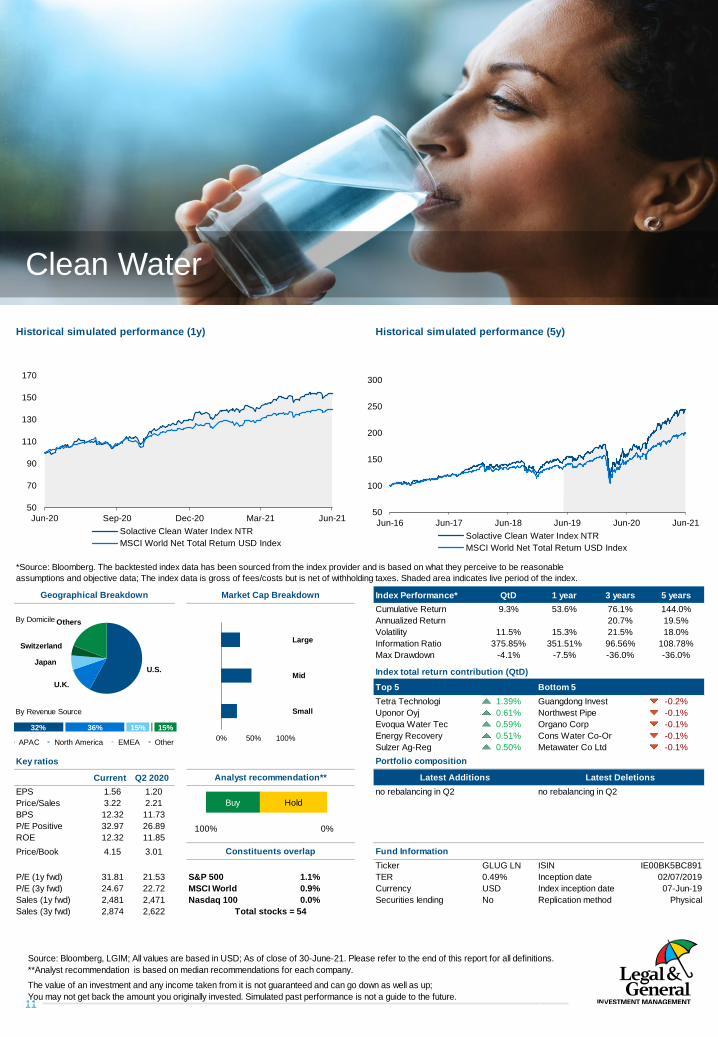
Historical simulated performance (1y) Historical simulated performance (5y)
Index Performance* QtD 1 year 3 years 5 years
Cumulative Return 9.3% 53.6% 76.1% 144.0%By Domicile Annualized Return 20.7% 19.5%
Volatility 11.5% 15.3% 21.5% 18.0%
Information Ratio 375.85% 351.51% 96.56% 108.78%
Max Drawdown -4.1% -7.5% -36.0% -36.0%
Tetra Technologi 1.39% Guangdong Invest -0.2%By Revenue Source Uponor Oyj 0.61% Northwest Pipe -0.1%
Evoqua Water Tec 0.59% Organo Corp -0.1%
Energy Recovery 0.51% Cons Water Co-Or -0.1%
Sulzer Ag-Reg 0.50% Metawater Co Ltd -0.1%
Key ratios
Current Q2 2020
EPS 1.56 1.20 no rebalancing in Q2 no rebalancing in Q2
Price/Sales 3.22 2.21
BPS 12.32 11.73
P/E Positive 32.97 26.89
ROE 12.32 11.85
Price/Book 4.15 3.01
Ticker GLUG LN ISIN IE00BK5BC891
P/E (1y fwd) 31.81 21.53 S&P 500 1.1% TER 0.49% Inception date 02/07/2019
P/E (3y fwd) 24.67 22.72 MSCI World 0.9% Currency USD Index inception date 07-Jun-19
Sales (1y fwd) 2,481 2,471 Nasdaq 100 0.0% Securities lending No Replication method Physical
Sales (3y fwd) 2,874 2,622
*Source: Bloomberg. The backtested index data has been sourced from the index provider and is based on what they perceive to be reasonable
assumptions and objective data; The index data is gross of fees/costs but is net of withholding taxes. Shaded area indicates live period of the index.
Geographical Breakdown Market Cap Breakdown
Index total return contribution (QtD)
Top 5 Bottom 5
Total stocks = 54
Portfolio composition
Analyst recommendation** Latest Additions Latest Deletions
Constituents overlap Fund Information
50
70
90
110
130
150
170
Jun-20 Sep-20 Dec-20 Mar-21 Jun-21
Solactive Clean Water Index NTR
MSCI World Net Total Return USD Index
50
100
150
200
250
300
Jun-16 Jun-17 Jun-18 Jun-19 Jun-20 Jun-21
Solactive Clean Water Index NTR
MSCI World Net Total Return USD Index
32% 36% 15% 15%
APAC North America EMEA Other
U.S.
U.K.
Japan
Switzerland
Others
0% 50% 100%
Small
Mid
Large
HoldBuy
0%100%
Source: Bloomberg, LGIM; All values are based in USD; As of close of 30-June-21. Please refer to the end of this report for all definitions.
**Analyst recommendation is based on median recommendations for each company.
The value of an investment and any income taken from it is not guaranteed and can go down as well as up;
You may not get back the amount you originally invested. Simulated past performance is not a guide to the future.

Confidential
12
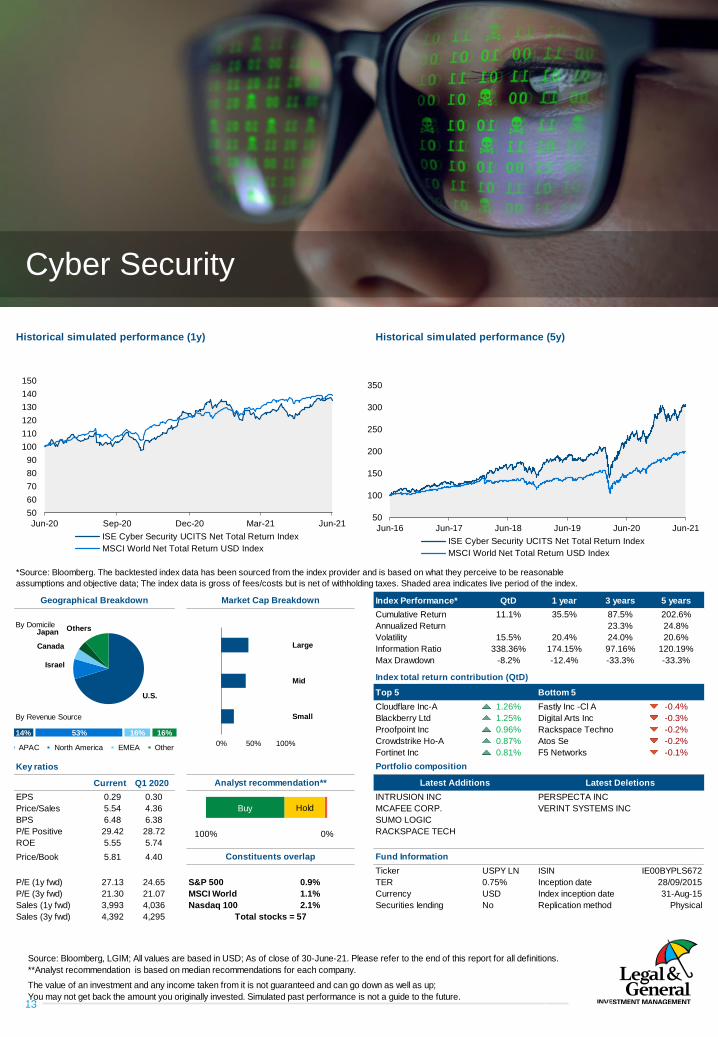
Cyber Security
COMPANY SPOTLIGHT
NortonLifeLock is a global leader in consumer cybersecurity that
provides services and solutions for device security, identity threat
protection and privacy software to consumers and small
businesses. In late 2020, NortonLifeLock acquired the German
cybersecurity firm Avira, a leading provider of antivirus software,
helping to strengthen NortonLifeLock as a major player in the
cybersecurity theme and, more importantly, a global leader in
consumer cybersecurity.
Norton 360 is the company’s flagship product. It provides a
platform for consumer endpoint security and can be used across all
major computer and mobile operating systems. Other products
from NortonLifeLock include Norton Antivirus Plus, Secure VPN,
Norton Family (parental control and online protection), and Identify
Protection.
NortonLifeLock continues to innovate by introducing new features
and solutions to the changing security marketplace and the rapidly
advancing digitised world. It recently released a new feature on the
Norton 360 Platform to allow users to safely mine cryptocurrency. It
also added new security offerings to its Norton Secure VPN
product, such as Kill Switch, which protects users’ devices if the
VPN connection is lost, and Split Tunneling, which allows them to
encrypt their details whilst they’re online, all to enhance their
security. The company also recently unveiled a Game Optimizer
product that provides gamers with a new tool to help improve their
computer performance when gaming, while also maintaining a
layer of security.
According to NortonLifeLock, the consumer segment is
underpenetrated as less than 5% of internet users are paying for
cyber safety products. Having over 1,000 patents across cyber
security, privacy, and identity, the company is well positioned to be
an innovative leader in consumer cybersecurity solutions.
LAST QUARTER PERFORMANCE COMMENTARY
The ISE Cyber Security UCITS Net Total Return Index returned
+11.07% in Q2 2021.
The quarter was marked by several cyber attacks. Amongst the
victims were the Colonial Pipeline, one of the largest oil pipelines in
the US, JBS, the world’s largest meat processing company,
Belgium’s parliament and universities, South African VirginActive
and Electronic Arts, a US video-game maker.
In the wake of such events, institutions kept steaming ahead with
cybersecurity initiatives. President Biden’s administration signed
the Executive Order on Improving the Nation’s Cybersecurity.
Some notable objectives are to remove barriers to threat
information sharing between the government and the private
sector, improve software supply-chain security, and improve
detection of cyber security incidents on federal government
networks. The European Council approved the establishment of
the Cybersecurity Competence Centre, to pool investments in
research, technology and industrial development. The UK has
added an extra £16.5 billion in defensive funding, much of which
will be dedicated to cybersecurity. The UK is also looking to
revamp its national cyber strategy later in 2021.
Strong M&A activity during the quarter highlighted the importance
of having enhanced cybersecurity solutions. Cisco Systems, Inc.
announced plans to acquire software company Kenna Security,
Ping Identity acquired bot-detection firm SecuredTouch, and
Splunk announced its intent to acquire TruSTAR Technology, a
cloud-native security company.
There were some bright spots within the index and the cyber
security theme this past quarter. Cloudflare returned +50.64%
while BlackBerry rose +45.9% on a total-return basis. Other
outperformers were Proofpoint (+38.1%), which recently
announced it has entered into a definitive agreement to be
acquired by private-equity firm, Thoma Bravo, and CrowdStrike
Holdings (+37.7%).
There were some index constituents that struggled in Q2 2021.
Two additions to the index during the April reconstitution, Intrusion
and RackSpace Technology, returned -34.1% and -17.5%
respectively. That said, since the April reconstitution of the index,
Intrusion is only down -2.0% while RackSpace Technology is down
-22.6%. Another name that struggled was Atos SE, as it returned -
20.8% in Q2 2021.
For illustrative purposes only. Reference to a particular security is on a historic basis and does not mean that the security is currently held or will be held within an LGIM portfolio. The above information does not constitute a recommendation to buy or sell any security.
Confidential
13
Cyber Security
Historical simulated performance (1y) Historical simulated performance (5y)
Index Performance* QtD 1 year 3 years 5 years
Cumulative Return 11.1% 35.5% 87.5% 202.6%By Domicile Annualized Return 23.3% 24.8%
Volatility 15.5% 20.4% 24.0% 20.6%
Information Ratio 338.36% 174.15% 97.16% 120.19%
Max Drawdown -8.2% -12.4% -33.3% -33.3%
Cloudflare Inc-A 1.26% Fastly Inc -Cl A -0.4%By Revenue Source Blackberry Ltd 1.25% Digital Arts Inc -0.3%
Proofpoint Inc 0.96% Rackspace Techno -0.2%
Crowdstrike Ho-A 0.87% Atos Se -0.2%
Fortinet Inc 0.81% F5 Networks -0.1%
Key ratios
Current Q1 2020
EPS 0.29 0.30 INTRUSION INC PERSPECTA INC
Price/Sales 5.54 4.36 MCAFEE CORP. VERINT SYSTEMS INC
BPS 6.48 6.38 SUMO LOGIC
P/E Positive 29.42 28.72 RACKSPACE TECH
ROE 5.55 5.74
Price/Book 5.81 4.40
Ticker USPY LN ISIN IE00BYPLS672
P/E (1y fwd) 27.13 24.65 S&P 500 0.9% TER 0.75% Inception date 28/09/2015
P/E (3y fwd) 21.30 21.07 MSCI World 1.1% Currency USD Index inception date 31-Aug-15
Sales (1y fwd) 3,993 4,036 Nasdaq 100 2.1% Securities lending No Replication method Physical
Sales (3y fwd) 4,392 4,295
*Source: Bloomberg. The backtested index data has been sourced from the index provider and is based on what they perceive to be reasonable
assumptions and objective data; The index data is gross of fees/costs but is net of withholding taxes. Shaded area indicates live period of the index.
Geographical Breakdown Market Cap Breakdown
Index total return contribution (QtD)
Top 5 Bottom 5
Total stocks = 57
Portfolio composition
Analyst recommendation** Latest Additions Latest Deletions
Constituents overlap Fund Information
50
60
70
80
90
100
110
120
130
140
150
Jun-20 Sep-20 Dec-20 Mar-21 Jun-21
ISE Cyber Security UCITS Net Total Return Index
MSCI World Net Total Return USD Index
50
100
150
200
250
300
350
Jun-16 Jun-17 Jun-18 Jun-19 Jun-20 Jun-21
ISE Cyber Security UCITS Net Total Return Index
MSCI World Net Total Return USD Index
14% 53% 16% 16%
APAC North America EMEA Other
U.S.
Israel
Canada
JapanOthers
0% 50% 100%
Small
Mid
Large
HoldBuy
0%100%
Source: Bloomberg, LGIM; All values are based in USD; As of close of 30-June-21. Please refer to the end of this report for all definitions.
**Analyst recommendation is based on median recommendations for each company.
The value of an investment and any income taken from it is not guaranteed and can go down as well as up;
You may not get back the amount you originally invested. Simulated past performance is not a guide to the future.
Confidential
14
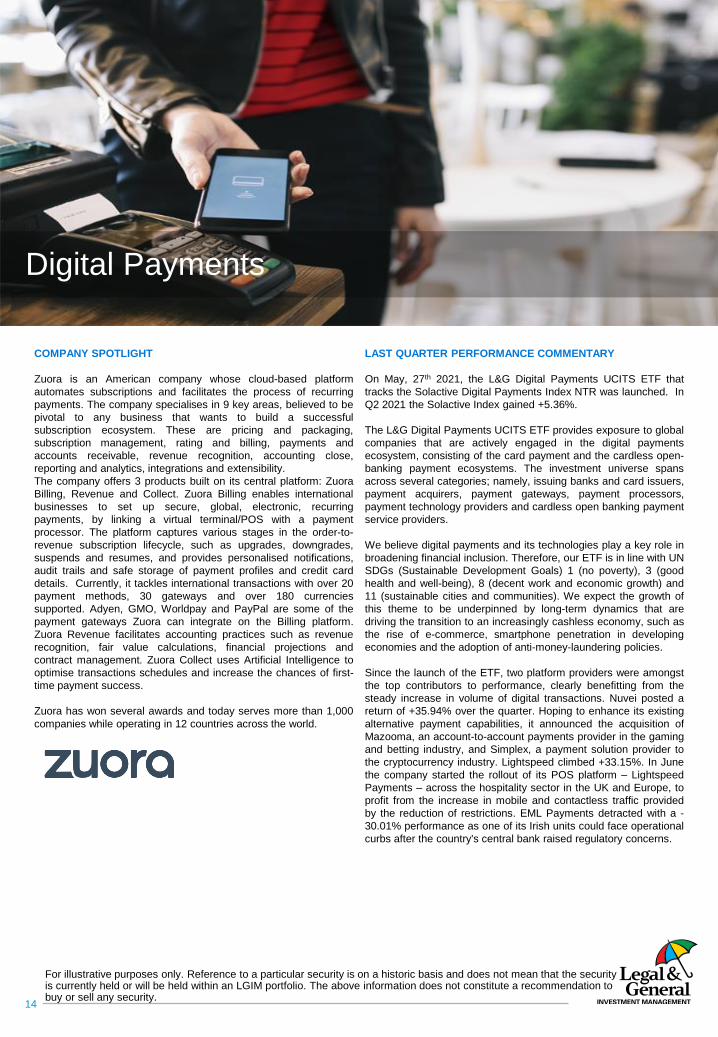
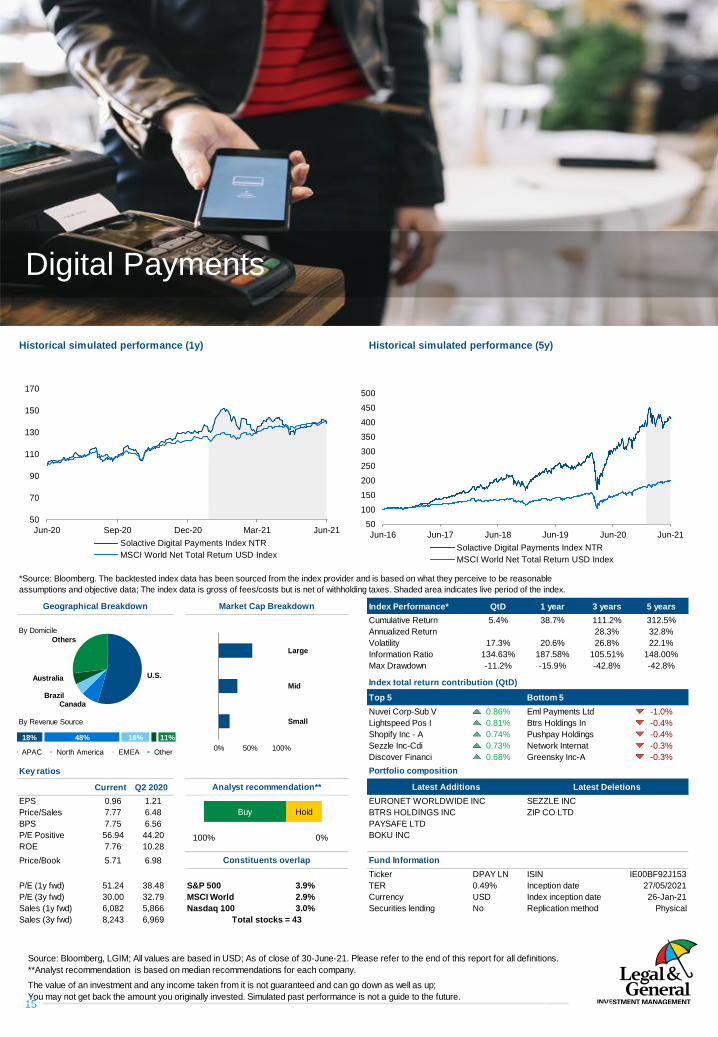
Digital Payments
COMPANY SPOTLIGHT
Zuora is an American company whose cloud-based platform
automates subscriptions and facilitates the process of recurring
payments. The company specialises in 9 key areas, believed to be
pivotal to any business that wants to build a successful
subscription ecosystem. These are pricing and packaging,
subscription management, rating and billing, payments and
accounts receivable, revenue recognition, accounting close,
reporting and analytics, integrations and extensibility.
The company offers 3 products built on its central platform: Zuora
Billing, Revenue and Collect. Zuora Billing enables international
businesses to set up secure, global, electronic, recurring
payments, by linking a virtual terminal/POS with a payment
processor. The platform captures various stages in the order-to-
revenue subscription lifecycle, such as upgrades, downgrades,
suspends and resumes, and provides personalised notifications,
audit trails and safe storage of payment profiles and credit card
details. Currently, it tackles international transactions with over 20
payment methods, 30 gateways and over 180 currencies
supported. Adyen, GMO, Worldpay and PayPal are some of the
payment gateways Zuora can integrate on the Billing platform.
Zuora Revenue facilitates accounting practices such as revenue
recognition, fair value calculations, financial projections and
contract management. Zuora Collect uses Artificial Intelligence to
optimise transactions schedules and increase the chances of first-
time payment success.
Zuora has won several awards and today serves more than 1,000
companies while operating in 12 countries across the world.
LAST QUARTER PERFORMANCE COMMENTARY
On May, 27th 2021, the L&G Digital Payments UCITS ETF that
tracks the Solactive Digital Payments Index NTR was launched. In
Q2 2021 the Solactive Index gained +5.36%.
The L&G Digital Payments UCITS ETF provides exposure to global
companies that are actively engaged in the digital payments
ecosystem, consisting of the card payment and the cardless open-
banking payment ecosystems. The investment universe spans
across several categories; namely, issuing banks and card issuers,
payment acquirers, payment gateways, payment processors,
payment technology providers and cardless open banking payment
service providers.
We believe digital payments and its technologies play a key role in
broadening financial inclusion. Therefore, our ETF is in line with UN
SDGs (Sustainable Development Goals) 1 (no poverty), 3 (good
health and well-being), 8 (decent work and economic growth) and
11 (sustainable cities and communities). We expect the growth of
this theme to be underpinned by long-term dynamics that are
driving the transition to an increasingly cashless economy, such as
the rise of e-commerce, smartphone penetration in developing
economies and the adoption of anti-money-laundering policies.
Since the launch of the ETF, two platform providers were amongst
the top contributors to performance, clearly benefitting from the
steady increase in volume of digital transactions. Nuvei posted a
return of +35.94% over the quarter. Hoping to enhance its existing
alternative payment capabilities, it announced the acquisition of
Mazooma, an account-to-account payments provider in the gaming
and betting industry, and Simplex, a payment solution provider to
the cryptocurrency industry. Lightspeed climbed +33.15%. In June
the company started the rollout of its POS platform – Lightspeed
Payments – across the hospitality sector in the UK and Europe, to
profit from the increase in mobile and contactless traffic provided
by the reduction of restrictions. EML Payments detracted with a -
30.01% performance as one of its Irish units could face operational
curbs after the country's central bank raised regulatory concerns.
For illustrative purposes only. Reference to a particular security is on a historic basis and does not mean that the security is currently held or will be held within an LGIM portfolio. The above information does not constitute a recommendation to buy or sell any security.
Confidential
15
Digital Payments
Source: Bloomberg, LGIM; All values are based in USD; As of close of 30-June-21. Please refer to the end of this report for all definitions.
**Analyst recommendation is based on median recommendations for each company.
The value of an investment and any income taken from it is not guaranteed and can go down as well as up;
You may not get back the amount you originally invested. Simulated past performance is not a guide to the future.
Historical simulated performance (1y) Historical simulated performance (5y)
Index Performance* QtD 1 year 3 years 5 years
Cumulative Return 5.4% 38.7% 111.2% 312.5%By Domicile Annualized Return 28.3% 32.8%
Volatility 17.3% 20.6% 26.8% 22.1%
Information Ratio 134.63% 187.58% 105.51% 148.00%
Max Drawdown -11.2% -15.9% -42.8% -42.8%
Nuvei Corp-Sub V 0.86% Eml Payments Ltd -1.0%By Revenue Source Lightspeed Pos I 0.81% Btrs Holdings In -0.4%
Shopify Inc - A 0.74% Pushpay Holdings -0.4%
Sezzle Inc-Cdi 0.73% Network Internat -0.3%
Discover Financi 0.68% Greensky Inc-A -0.3%
Key ratios
Current Q2 2020
EPS 0.96 1.21 EURONET WORLDWIDE INC SEZZLE INC
Price/Sales 7.77 6.48 BTRS HOLDINGS INC ZIP CO LTD
BPS 7.75 6.56 PAYSAFE LTD
P/E Positive 56.94 44.20 BOKU INC
ROE 7.76 10.28
Price/Book 5.71 6.98
Ticker DPAY LN ISIN IE00BF92J153
P/E (1y fwd) 51.24 38.48 S&P 500 3.9% TER 0.49% Inception date 27/05/2021
P/E (3y fwd) 30.00 32.79 MSCI World 2.9% Currency USD Index inception date 26-Jan-21
Sales (1y fwd) 6,082 5,866 Nasdaq 100 3.0% Securities lending No Replication method Physical
Sales (3y fwd) 8,243 6,969
*Source: Bloomberg. The backtested index data has been sourced from the index provider and is based on what they perceive to be reasonable
assumptions and objective data; The index data is gross of fees/costs but is net of withholding taxes. Shaded area indicates live period of the index.
Geographical Breakdown Market Cap Breakdown
Index total return contribution (QtD)
Top 5 Bottom 5
Total stocks = 43
Portfolio composition
Analyst recommendation** Latest Additions Latest Deletions
Constituents overlap Fund Information
50
70
90
110
130
150
170
Jun-20 Sep-20 Dec-20 Mar-21 Jun-21
Solactive Digital Payments Index NTR
MSCI World Net Total Return USD Index
50
100
150
200
250
300
350
400
450
500
Jun-16 Jun-17 Jun-18 Jun-19 Jun-20 Jun-21
Solactive Digital Payments Index NTR
MSCI World Net Total Return USD Index
18% 48% 18% 11%
APAC North America EMEA Other
U.S.
CanadaBrazil
Australia
Others
0% 50% 100%
Small
Mid
Large
HoldBuy
0%100%

Confidential
16
Ecommerce Logistics
COMPANY SPOTLIGHT
Nippon Yusen Kabushiki Kaisha (NYK Line) is one of the world's
largest marine transportation providers. The company operates
global logistics container transportation, specialised carriers, and
cruise lines in over 45 countries. The NYK Line fleet, made up of
700 vessels, includes bulk carriers, containerships, tankers, and a
variety of specialised vessels, including car carriers and liquefied
natural gas (LNG) carriers, with a capacity of more than 65,000k
deadweight tons (DWT).
NYK Line’s subsidiary Yusen Logistics offers various logistics
solutions such as equipment and information systems for
warehousing and distribution, consulting services, leasing of
containers and transportation technologies. The company operates
across multiple industries, focusing on South Asian locations. Over
the quarter, Yusen Logistics improved its online shipping process
with the launch of an IT platform called “Yusen Vantage Focus
Quote and Book”, which allows customers to obtain instant
quotation, booking and cargo tracking information. The company
also expanded its business in Vietnam, with the creation of a
logistics centre. The facility covers 21,000sqm, 10,000 of which are
dedicated to warehousing space, equipped with sophisticated
technology and located in a strategic site, close to Ho Chi Minh’s
main port and an existing and an upcoming international airport.
The expansion in Vietnam follows the company’s vision of
expanding in fast-growing markets and improving the supply-chain
mechanisms of the region, while leveraging the new transport
infrastructure of the area. A similar project in July 2020 saw NYK
Line (Vietnam), another subsidiary, acquire 15% of the total issued
shares of Thoresen Vinama Tug, to enter the tugboat business in
Vietnam.
NYK Line is demonstrating a proactive approach towards ESG
issues. As stated in its medium-term management plan “Staying
Ahead 2022 with Digitalization and Green”, the company is looking
to expand its business in growing and emerging markets, promote
LNG marine fuel sales and enter new businesses in the global
energy transition landscape. The company is also taking on the
challenge of achieving zero emissions in its ship operations by
converting ship fuels, trialling the use of biofuels, participating in
the hydrogen and ammonia business, and developing technologies
for ship operations and manned autonomous ships.
LAST QUARTER PERFORMANCE COMMENTARY
The Solactive Ecommerce Logistics Index rose +11.50% in Q2
2021.
Over the quarter, in the logistics segment, efforts to reduce carbon
emissions and investment in technology have supported growth in
the industry.
The retail ecommerce space kept growing as online spending
habits have become increasingly more engrained, due to the
prolonged impact from lockdowns. Some apparel retailers kept
facing a somewhat larger disruption than other sectors, having to
manage out-of-season stock and deal with changing customer
preferences caused by the unpredictable nature of intermittent
lockdown restrictions. Ecommerce players can use investment and
adaptation to customer needs around transport, fulfilment, last-
mile delivery, return and additional value-add services across
global markets, as opportunities for growth.
Digitalisation is an important factor of differentiation, allowing for
greater operational efficiency throughout the entire order life cycle.
Sustainability is another key element that companies are having to
embed in their processes to remain competitive. Over the quarter,
the top contributors were Dimerco Express (+73.34%), Nippon
Yusen (+48.47%), and Clipper Logistics (+26.17%). Dimerco
Express and Nippon Yusen are key players in the sea-freight
forwarding and logistics market, which have clearly enjoyed the
comeback of the sector in conjunction with increased economic
activity. Clipper Logistics operates in the retail space offering
services such as click & collect and returns management. Vipshop,
a discounted branded products retailer, and Kintetsu World
Express, also a freight-forwarding company involved in logistics,
detracted from performance (-32.75% and -18.98%), still under
some pressure from the rising costs of transport and deliveries and
logistics disruptions caused by Covid.
For illustrative purposes only. Reference to a particular security is on a historic basis and does not mean that the security is currently held or will be held within an LGIM portfolio. The above information does not constitute a recommendation to buy or sell any security.

Confidential
17
Ecommerce Logistics
Historical simulated performance (1y) Historical simulated performance (5y)
Index Performance* QtD 1 year 3 years 5 years
Cumulative Return 11.5% 69.6% 87.8% 177.2%By Domicile Annualized Return 23.4% 22.6%
Volatility 9.9% 13.2% 16.6% 14.2%
Information Ratio 551.86% 526.82% 140.97% 159.68%
Max Drawdown -3.3% -5.2% -28.7% -28.7%
Dimerco Express 1.74% Vipshop Hold-Adr -0.9%By Revenue Source Nippon Yusen Kk 1.25% Kintetsu World -0.5%
Clipper Logis 0.68% Japan Post Holdi -0.2%
Deutsche Post-Rg 0.67% Jd.Com Inc-Adr -0.1%
Ap Moller-B 0.62% Sps Commerce Inc -0.1%
Key ratios
Current Q2 2020
EPS 2.00 1.29 CLIPPER LOGISTICS PLC NTG NORDIC TRANSPORT GROUP
Price/Sales 0.93 0.63 SHOPIFY INC
BPS 16.35 12.96 SPS COMMERCE INC
P/E Positive 23.34 21.26 WINCANTON PLC
ROE 17.53 10.26
Price/Book 4.31 3.89
Ticker ECOM LN ISIN IE00BF0M6N54
P/E (1y fwd) 27.99 20.49 S&P 500 4.1% TER 0.49% Inception date 23/01/2018
P/E (3y fwd) 18.52 16.96 MSCI World 4.5% Currency USD Index inception date 03-Jan-18
Sales (1y fwd) 45,545 40,597 Nasdaq 100 3.2% Securities lending No Replication method Physical
Sales (3y fwd) 55,881 47,035
*Source: Bloomberg. The backtested index data has been sourced from the index provider and is based on what they perceive to be reasonable
assumptions and objective data; The index data is gross of fees/costs but is net of withholding taxes. Shaded area indicates live period of the index.
Geographical Breakdown Market Cap Breakdown
Index total return contribution (QtD)
Top 5 Bottom 5
Total stocks = 42
Portfolio composition
Analyst recommendation** Latest Additions Latest Deletions
Constituents overlap Fund Information
50
70
90
110
130
150
170
190
Jun-20 Sep-20 Dec-20 Mar-21 Jun-21
Solactive eCommerce Logistics Index
MSCI World Net Total Return USD Index
50
100
150
200
250
300
Jun-16 Jun-17 Jun-18 Jun-19 Jun-20 Jun-21
Solactive eCommerce Logistics Index
MSCI World Net Total Return USD Index
37% 25% 26% 13%
APAC North America EMEA Other
U.S.
Japan
GermanyChina
Others
0% 50% 100%
Small
Mid
Large
HoldBuy
0%100%
Source: Bloomberg, LGIM; All values are based in USD; As of close of 30-June-21. Please refer to the end of this report for all definitions.
**Analyst recommendation is based on median recommendations for each company.
The value of an investment and any income taken from it is not guaranteed and can go down as well as up;
You may not get back the amount you originally invested. Simulated past performance is not a guide to the future.
Confidential
18
Healthcare Technology
COMPANY SPOTLIGHT
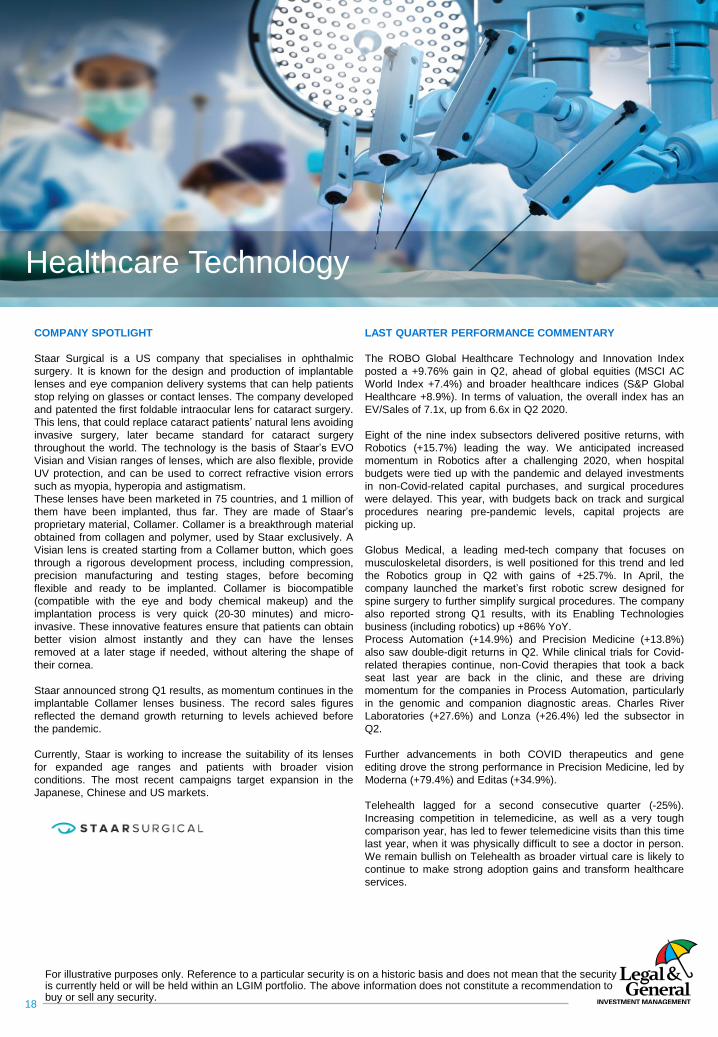
Staar Surgical is a US company that specialises in ophthalmic
surgery. It is known for the design and production of implantable
lenses and eye companion delivery systems that can help patients
stop relying on glasses or contact lenses. The company developed
and patented the first foldable intraocular lens for cataract surgery.
This lens, that could replace cataract patients’ natural lens avoiding
invasive surgery, later became standard for cataract surgery
throughout the world. The technology is the basis of Staar’s EVO
Visian and Visian ranges of lenses, which are also flexible, provide
UV protection, and can be used to correct refractive vision errors
such as myopia, hyperopia and astigmatism.
These lenses have been marketed in 75 countries, and 1 million of
them have been implanted, thus far. They are made of Staar’s
proprietary material, Collamer. Collamer is a breakthrough material
obtained from collagen and polymer, used by Staar exclusively. A
Visian lens is created starting from a Collamer button, which goes
through a rigorous development process, including compression,
precision manufacturing and testing stages, before becoming
flexible and ready to be implanted. Collamer is biocompatible
(compatible with the eye and body chemical makeup) and the
implantation process is very quick (20-30 minutes) and micro-
invasive. These innovative features ensure that patients can obtain
better vision almost instantly and they can have the lenses
removed at a later stage if needed, without altering the shape of
their cornea.
Staar announced strong Q1 results, as momentum continues in the
implantable Collamer lenses business. The record sales figures
reflected the demand growth returning to levels achieved before
the pandemic.
Currently, Staar is working to increase the suitability of its lenses
for expanded age ranges and patients with broader vision
conditions. The most recent campaigns target expansion in the
Japanese, Chinese and US markets.
LAST QUARTER PERFORMANCE COMMENTARY
The ROBO Global Healthcare Technology and Innovation Index
posted a +9.76% gain in Q2, ahead of global equities (MSCI AC
World Index +7.4%) and broader healthcare indices (S&P Global
Healthcare +8.9%). In terms of valuation, the overall index has an
EV/Sales of 7.1x, up from 6.6x in Q2 2020.
Eight of the nine index subsectors delivered positive returns, with
Robotics (+15.7%) leading the way. We anticipated increased
momentum in Robotics after a challenging 2020, when hospital
budgets were tied up with the pandemic and delayed investments
in non-Covid-related capital purchases, and surgical procedures
were delayed. This year, with budgets back on track and surgical
procedures nearing pre-pandemic levels, capital projects are
picking up.
Globus Medical, a leading med-tech company that focuses on
musculoskeletal disorders, is well positioned for this trend and led
the Robotics group in Q2 with gains of +25.7%. In April, the
company launched the market’s first robotic screw designed for
spine surgery to further simplify surgical procedures. The company
also reported strong Q1 results, with its Enabling Technologies
business (including robotics) up +86% YoY.
Process Automation (+14.9%) and Precision Medicine (+13.8%)
also saw double-digit returns in Q2. While clinical trials for Covid-
related therapies continue, non-Covid therapies that took a back
seat last year are back in the clinic, and these are driving
momentum for the companies in Process Automation, particularly
in the genomic and companion diagnostic areas. Charles River
Laboratories (+27.6%) and Lonza (+26.4%) led the subsector in
Q2.
Further advancements in both COVID therapeutics and gene
editing drove the strong performance in Precision Medicine, led by
Moderna (+79.4%) and Editas (+34.9%).
Telehealth lagged for a second consecutive quarter (-25%).
Increasing competition in telemedicine, as well as a very tough
comparison year, has led to fewer telemedicine visits than this time
last year, when it was physically difficult to see a doctor in person.
We remain bullish on Telehealth as broader virtual care is likely to
continue to make strong adoption gains and transform healthcare
services.
For illustrative purposes only. Reference to a particular security is on a historic basis and does not mean that the security is currently held or will be held within an LGIM portfolio. The above information does not constitute a recommendation to buy or sell any security.

Confidential
19
Healthcare Technology
Historical simulated performance (1y) Historical simulated performance (5y)
Index Performance* QtD 1 year 3 years 5 years
Cumulative Return 9.8% 57.6% 137.9% 364.8%By Domicile Annualized Return 33.5% 36.0%
Volatility 16.8% 21.8% 24.6% 20.9%
Information Ratio 269.63% 264.31% 135.90% 171.82%
Max Drawdown -11.0% -19.7% -30.3% -30.3%
Editas Medicine 0.67% Irhythm Technolo -0.7%By Revenue Source Staar Surgical 0.66% Cellectis - Adr -0.4%
Moderna Inc 0.51% Materialise-Adr -0.3%
Novocure Ltd 0.51% 1Life Healthcare -0.2%
Caredx Inc 0.51% Avanos Medical I -0.2%
Key ratios
Current Q1 2020
EPS 1.42 0.62 ALIBABA HEALTH INF TECHNOLOGY GRIFOLS SA
Price/Sales 7.65 6.66 JD HEALTH INTERNATIONAL INC NUANCE COMMUNICATIONS INC
BPS 15.63 13.68 INVITAE CORP
P/E Positive 53.49 49.14
ROE 8.60 3.66
Price/Book 7.38 6.29
Ticker DOCT LN ISIN IE00BK5BC677
P/E (1y fwd) 48.51 39.39 S&P 500 4.5% TER 0.49% Inception date 02/07/2019
P/E (3y fwd) 36.17 32.49 MSCI World 4.2% Currency USD Index inception date 01-May-19
Sales (1y fwd) 5,032 4,462 Nasdaq 100 3.6% Securities lending No Replication method Physical
Sales (3y fwd) 6,135 5,308
*Source: Bloomberg. The backtested index data has been sourced from the index provider and is based on what they perceive to be reasonable
assumptions and objective data; The index data is gross of fees/costs but is net of withholding taxes. Shaded area indicates live period of the index.
Geographical Breakdown Market Cap Breakdown
Index total return contribution (QtD)
Top 5 Bottom 5
Total stocks = 84
Portfolio composition
Analyst recommendation** Latest Additions Latest Deletions
Constituents overlap Fund Information
50
70
90
110
130
150
170
190
Jun-20 Sep-20 Dec-20 Mar-21 Jun-21
ROBO Global Healthcare Technology and Innovation Index TR
MSCI World Net Total Return USD Index
50
100
150
200
250
300
350
400
450
500
550
Jun-16 Jun-17 Jun-18 Jun-19 Jun-20 Jun-21
ROBO Global Healthcare Technology and Innovation Index TR
MSCI World Net Total Return USD Index
8% 61% 10% 20%
APAC North America EMEA Other
U.S.
Switz…China
U.K.
Others
0% 50% 100%
Small
Mid
Large
HoldBuy
0%100%
Source: Bloomberg, LGIM; All values are based in USD; As of close of 30-June-21. Please refer to the end of this report for all definitions.
**Analyst recommendation is based on median recommendations for each company.
The value of an investment and any income taken from it is not guaranteed and can go down as well as up;
You may not get back the amount you originally invested. Simulated past performance is not a guide to the future.

Confidential
20
Hydrogen Economy
COMPANY SPOTLIGHT
Toyota Motor Corporation is a Japanese car manufacturer with 52
overseas manufacturing companies across 27 countries worldwide.
It designs, manufactures, assembles and sells passenger cars,
minivans, recreational and sport-utility vehicles, commercial
vehicles such as trucks, and related parts and accessories.
With a goal to reduce CO2 emissions and contribute to the creation
of a sustainable society, Toyota is a major FCEV (fuel cell electric
vehicle) player. The company announced a target of 30,000
FCEVs annually after 2020, from more than 3,000 currently.
Toyota has been particularly active in the deployment of hydrogen
technology and it is now moving ahead with Mirai, its hydrogen-
powered, fuel-cell 100% electric car. The first generation of Mirai
was unveiled in 2014. Improvements in supply capacity and
cruising range led to the launch in 2020 of the next-generation
model. The vehicle doesn’t have to be recharged, because its fuel
cell stack generates the electricity it needs to power its motor,
mixing hydrogen with oxygen and emitting just water. The
innovative battery system recovers on its own and reuses energy
during acceleration and braking. The car also has a hydrogen fuel
control computer, which communicates with refuelling pumps via
infrared technology and monitors the level of hydrogen. Toyota has
sold over 10,000 Mirais globally, thus far. Mirai’s fuel cell system is
also being used in the hydrogen-powered fuel cell industrial vehicle
that Toyota has created in partnership with Denyo, a manufacturer
of engine-driven generators, welders and other specialist
equipment, which provided the power supply unit and equipment.
The companies started verification tests for the truck in September
2020.
Toyota has not been greatly affected by the current chip shortage
thanks to the strong supply-chain management and monitoring
model it has developed over the past 10 years, which gives access
to very granular information about each supplier and allows it to
spot the warning signs of a component shortage very early on.
LAST QUARTER PERFORMANCE COMMENTARY
The Solactive Hydrogen Economy Index retreated by -2.32% in Q2
2021.
Hydrogen keeps maintaining its pivotal role as a major technology
in the transition towards sustainable resources. An example of this
is London’s first hydrogen-powered double-decker bus fleet, which
came into action in June. Air Liquide is providing the fuel,
harnessing waste hydrogen from an industrial plant and is aiming
to shift to green hydrogen by 2023, using electrolysis powered by
an offshore wind farm. This project has not been free from criticism,
given the £6 million investment for only 20 buses. Currently, the
cost of hydrogen is indeed a major hurdle for its adoption.
Interestingly, on the other side of the planet, steps are being taken
to make the adoption of clean hydrogen more economically viable.
The US Department of Energy launched the Energy Earthshots
Initiative, which seeks to cut the price of clean hydrogen by 80% to
$1 per kg over the next decade. As hydrogen from renewable
resources becomes more accessible, we expect adoption to
increase, a big step forward in the journey to a net-zero economy.
Performance was hurt by some stocks retreating from the record
highs seen in Q1 2021. We note McPhy Energy (-33.91%),
Hexagon Composites (-30.38%) and FuelCell Energy (-38.24%) as
the main detractors. Chemours was amongst the best performers,
delivering a +25.61% return. The company, which produces
membranes and materials for hydrogen-powered fuel cells, last
year supported a workforce development initiative by the Electric
Power Research Institute (EPRI), the Gas Technology Institute
(GTI) and various universities, to accelerate Hydrogen Education
for a Decarbonized Global Economy (H2EDGE). Other positive
contributors were fuel cell components manufacturers Kolon
Industries (+35.79%) and Cell Impact (+21.22%).
For illustrative purposes only. Reference to a particular security is on a historic basis and does not mean that the security is currently held or will be held within an LGIM portfolio. The above information does not constitute a recommendation to buy or sell any security.

Confidential
21
Hydrogen Economy
Source: Bloomberg, LGIM; All values are based in USD; As of close of 30-June-21. Please refer to the end of this report for all definitions.
**Analyst recommendation is based on median recommendations for each company.
The value of an investment and any income taken from it is not guaranteed and can go down as well as up;
You may not get back the amount you originally invested. Simulated past performance is not a guide to the future.
Historical simulated performance (1y) Historical simulated performance (5y)
Index Performance* QtD 1 year
Cumulative Return -2.3% 103.1%By Domicile Annualized Return
Volatility 20.3% 33.7%
Information Ratio -44.23% 306.53%
Max Drawdown -11.0% -24.8%
Chemours Co 1.03% Mcphy Energy Sa -1.2%By Revenue Source Kolon Industries 0.97% Hexagon Purus As -1.0%
Cell Impact Ab 0.74% Fuelcell Energy -0.9%
Toyota Motor 0.42% Xebec Adsorption -0.8%
Sfc Energy Ag-Br 0.42% Hexagon Composit -0.7%
Key ratios
Current Q2 2020
EPS 0.11 0.09 ADVENT TECHNOLOGIESXEBEC ADSORPTION HEXAGON COMPOSITES
Price/Sales 5.18 3.03 AFC ENERGY PLC SFC ENERGY AG HEXAGON PURUS
BPS 6.86 3.11 CELL IMPACT AB SIEMENS AG
P/E Positive 26.67 21.68 SIEMENS ENERGY AG
ROE 3.59 2.71 POWERHOUSE ENERGY GROUP
Price/Book 3.76 4.59
Ticker HTWO LN ISIN IE00BMYDM794
P/E (1y fwd) 20.51 19.71 S&P 500 0.3% TER 0.49% Inception date 10/02/2021
P/E (3y fwd) 19.21 16.26 MSCI World 0.9% Currency USD Index inception date 26-Jan-21
Sales (1y fwd) 30,822 30,006 Nasdaq 100 0.0% Securities lending No Replication method Physical
Sales (3y fwd) 29,758 27,587
*Source: Bloomberg. The backtested index data has been sourced from the index provider and is based on what they perceive to be reasonable
assumptions and objective data; The index data is gross of fees/costs but is net of withholding taxes. Shaded area indicates live period of the index.
Geographical Breakdown Market Cap Breakdown
Index total return contribution (QtD)
Top 5 Bottom 5
Total stocks = 32
Portfolio composition
Analyst recommendation** Latest Additions Latest Deletions
Constituents overlap Fund Information
50
100
150
200
250
300
Jun-20 Sep-20 Dec-20 Mar-21 Jun-21
Solactive Hydrogen Economy Index NTR
MSCI World Net Total Return USD Index
50
100
150
200
250
300
350
400
450
Nov-18 May-19 Nov-19 May-20 Nov-20 May-21
Solactive Hydrogen Economy Index NTR
MSCI World Net Total Return USD Index
23% 31% 31% 15%
APAC North America EMEA Other
U.S.
U.K.
GermanySouth Korea
Others
0% 50% 100%
Small
Mid
Large
HoldBuy
0%100%

Confidential
22
Pharma Breakthrough
COMPANY SPOTLIGHT
Genmab is an international biotechnology company, founded in
Denmark. The company specialises in the creation and
development of human antibody therapeutics for the treatment of
cancer, autoimmune, infectious and central nervous system
diseases.
Genmab owns 4 platforms that allow it to discover and develop
antibodies and create therapeutics. So far, it has marketed 4
products for the treatment of multiple myeloma, relapsing multiple
sclerosis, thyroid eye disease and non-small cell lung cancer. In
addition to this, it holds a product pipeline of proprietary products
ranging from pre-clinical to late-phase trials, researching and
developing treatment for cervical and ovarian cancer, solid
tumours, lymphomas, leukaemia and various haematological
malignancies. Genmab also has development partnerships with
other pharmaceutical and biotech companies, which are using its
proprietary technologies and innovation to develop other
treatments.
With its range of innovative and differentiated human antibody
products, Genmab hopes to have transformed cancer treatment by
2025.
LAST QUARTER PERFORMANCE COMMENTARY
The Solactive Pharmaceutical Breakthrough Index gained +6.81%
in Q2 2021.
The successful development of Covid vaccines and the increasing
attention that governments and society have given to life sciences
in recent months have built more conviction on the biotech sector
amongst investors. According to research from Evaluate Pharma
on venture capital investment, over the past 5 years, biotech
investment has attracted much more investor interest and has
seen valuations rise at a greater rate compared to the conventional
field of small molecules, reflecting the evolution of medicine both
as a discipline and as an investment idea. Over the period,
oncology and immunology have attracted particularly large sums of
investment. Companies working on cancer therapeutics raised
almost 3 times more venture capital from 2016 to 2020. Their
proportion in investment rounds and venture cash increased from
27% to 30% and from 30% to 46% over the period. Interestingly,
despite the pandemic outbreak, infectious disease developers
have seen little growth in investment interest so far, although this
trend might start emerging in the coming months.
Eisai, Genmab and Biogen were the top contributors (+46.60%,
+24.04% and +23.78%) whilst Emergent BioSolutions and
PharmaMar hurt performance (-32.20% and -22.17%). Biogen and
Eisai research innovative solutions in the neurological space and
their share price was boosted by the FDA’s accelerated approval of
a drug to treat Alzheimer’s disease, which the two companies
developed in collaboration. Genmab continues to research
antibody technologies and has initiated a collaboration with Bolt
Biotherapeutics to research oncology treatments, with the potential
to develop and market 3 additional products.
Emergent BioSolutions is involved in the production of vaccines
(including for Covid-19), contract manufacturing, drugs and devices
and its share price was hurt by a contamination fault. PharmaMar
researches cancer drugs with marine origin and, due to a
downward revision of sales of its Covid-19 detection kits and
worsened prospects for this financial year, it hurt performance.
For illustrative purposes only. Reference to a particular security is on a historic basis and does not mean that the securityis currently held or will be held within an LGIM portfolio. The above information does not constitute a recommendation to buy or sell any security.

Confidential
23
Pharma Breakthrough
Historical simulated performance (1y) Historical simulated performance (5y)
Index Performance* QtD 1 year 3 years 5 years
Cumulative Return 6.8% 11.3% 35.7% 65.3%By Domicile Annualized Return 10.7% 10.6%
Volatility 12.6% 17.1% 21.1% 18.5%
Information Ratio 239.92% 66.28% 50.68% 57.10%
Max Drawdown -3.8% -11.7% -27.3% -27.3%
Eisai Co Ltd 1.35% Emergent Biosolu -1.0%By Revenue Source Genmab A/S 0.78% Pharma Mar Sa -0.6%
Biogen Inc 0.76% Ultragenyx Pharm -0.5%
Ipsen 0.70% Ligand Pharm -0.5%
Oxford Biomedica 0.69% Ionis Pharmaceut -0.3%
Key ratios
Current Q2 2020
EPS 2.90 1.19 no rebalancing in Q2 no rebalancing in Q2
Price/Sales 6.47 6.94
BPS 17.92 14.38
P/E Positive 26.52 25.09
ROE 15.18 10.48
Price/Book 5.41 5.28
Ticker BIOT LN ISIN IE00BF0H7608
P/E (1y fwd) 19.01 26.08 S&P 500 1.4% TER 0.49% Inception date 23/01/2018
P/E (3y fwd) 17.78 21.76 MSCI World 2.4% Currency USD Index inception date 03-Jan-18
Sales (1y fwd) 9,814 8,344 Nasdaq 100 1.4% Securities lending No Replication method Physical
Sales (3y fwd) 10,956 10,397
*Source: Bloomberg. The backtested index data has been sourced from the index provider and is based on what they perceive to be reasonable
assumptions and objective data; The index data is gross of fees/costs but is net of withholding taxes. Shaded area indicates live period of the index.
Geographical Breakdown Market Cap Breakdown
Index total return contribution (QtD)
Top 5 Bottom 5
Total stocks = 34
Portfolio composition
Analyst recommendation** Latest Additions Latest Deletions
Constituents overlap Fund Information
50
60
70
80
90
100
110
120
130
140
150
Jun-20 Sep-20 Dec-20 Mar-21 Jun-21
Solactive Pharma Breakthrough Value Index
MSCI World Net Total Return USD Index
50
70
90
110
130
150
170
190
210
Jun-16 Jun-17 Jun-18 Jun-19 Jun-20 Jun-21
Solactive Pharma Breakthrough Value Index
MSCI World Net Total Return USD Index
17% 45% 13% 24%
APAC North America EMEA Other
U.S.
Japan
France
Switzerland
Others
0% 50% 100%
Small
Mid
Large
HoldBuy
0%100%
Source: Bloomberg, LGIM; All values are based in USD; As of close of 30-June-21. Please refer to the end of this report for all definitions.
**Analyst recommendation is based on median recommendations for each company.
The value of an investment and any income taken from it is not guaranteed and can go down as well as up;
You may not get back the amount you originally invested. Simulated past performance is not a guide to the future.
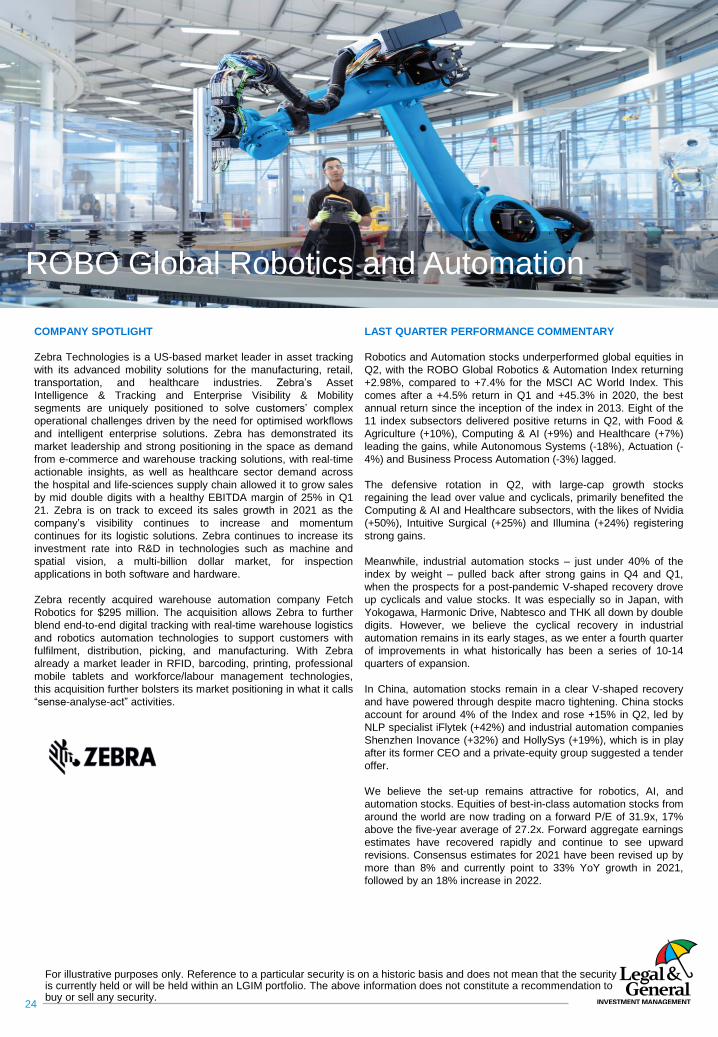
Confidential
24
ROBO Global Robotics and Automation
COMPANY SPOTLIGHT
Zebra Technologies is a US-based market leader in asset tracking
with its advanced mobility solutions for the manufacturing, retail,
transportation, and healthcare industries. Zebra’s Asset
Intelligence & Tracking and Enterprise Visibility & Mobility
segments are uniquely positioned to solve customers’ complex
operational challenges driven by the need for optimised workflows
and intelligent enterprise solutions. Zebra has demonstrated its
market leadership and strong positioning in the space as demand
from e-commerce and warehouse tracking solutions, with real-time
actionable insights, as well as healthcare sector demand across
the hospital and life-sciences supply chain allowed it to grow sales
by mid double digits with a healthy EBITDA margin of 25% in Q1
21. Zebra is on track to exceed its sales growth in 2021 as the
company’s visibility continues to increase and momentum
continues for its logistic solutions. Zebra continues to increase its
investment rate into R&D in technologies such as machine and
spatial vision, a multi-billion dollar market, for inspection
applications in both software and hardware.
Zebra recently acquired warehouse automation company Fetch
Robotics for $295 million. The acquisition allows Zebra to further
blend end-to-end digital tracking with real-time warehouse logistics
and robotics automation technologies to support customers with
fulfilment, distribution, picking, and manufacturing. With Zebra
already a market leader in RFID, barcoding, printing, professional
mobile tablets and workforce/labour management technologies,
this acquisition further bolsters its market positioning in what it calls
“sense-analyse-act” activities.
LAST QUARTER PERFORMANCE COMMENTARY
Robotics and Automation stocks underperformed global equities in
Q2, with the ROBO Global Robotics & Automation Index returning
+2.98%, compared to +7.4% for the MSCI AC World Index. This
comes after a +4.5% return in Q1 and +45.3% in 2020, the best
annual return since the inception of the index in 2013. Eight of the
11 index subsectors delivered positive returns in Q2, with Food &
Agriculture (+10%), Computing & AI (+9%) and Healthcare (+7%)
leading the gains, while Autonomous Systems (-18%), Actuation (-
4%) and Business Process Automation (-3%) lagged.
The defensive rotation in Q2, with large-cap growth stocks
regaining the lead over value and cyclicals, primarily benefited the
Computing & AI and Healthcare subsectors, with the likes of Nvidia
(+50%), Intuitive Surgical (+25%) and Illumina (+24%) registering
strong gains.
Meanwhile, industrial automation stocks – just under 40% of the
index by weight – pulled back after strong gains in Q4 and Q1,
when the prospects for a post-pandemic V-shaped recovery drove
up cyclicals and value stocks. It was especially so in Japan, with
Yokogawa, Harmonic Drive, Nabtesco and THK all down by double
digits. However, we believe the cyclical recovery in industrial
automation remains in its early stages, as we enter a fourth quarter
of improvements in what historically has been a series of 10-14
quarters of expansion.
In China, automation stocks remain in a clear V-shaped recovery
and have powered through despite macro tightening. China stocks
account for around 4% of the Index and rose +15% in Q2, led by
NLP specialist iFlytek (+42%) and industrial automation companies
Shenzhen Inovance (+32%) and HollySys (+19%), which is in play
after its former CEO and a private-equity group suggested a tender
offer.
We believe the set-up remains attractive for robotics, AI, and
automation stocks. Equities of best-in-class automation stocks from
around the world are now trading on a forward P/E of 31.9x, 17%
above the five-year average of 27.2x. Forward aggregate earnings
estimates have recovered rapidly and continue to see upward
revisions. Consensus estimates for 2021 have been revised up by
more than 8% and currently point to 33% YoY growth in 2021,
followed by an 18% increase in 2022.
For illustrative purposes only. Reference to a particular security is on a historic basis and does not mean that the security is currently held or will be held within an LGIM portfolio. The above information does not constitute a recommendation to buy or sell any security.
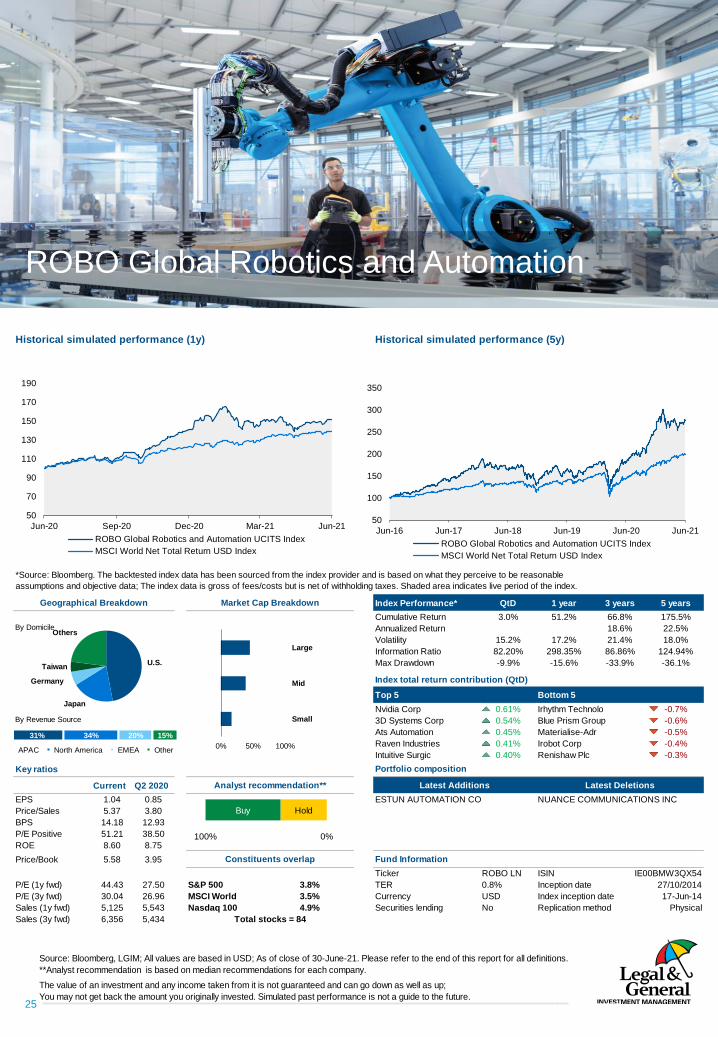
Confidential
25
ROBO Global Robotics and Automation
Historical simulated performance (1y) Historical simulated performance (5y)
Index Performance* QtD 1 year 3 years 5 years
Cumulative Return 3.0% 51.2% 66.8% 175.5%By Domicile Annualized Return 18.6% 22.5%
Volatility 15.2% 17.2% 21.4% 18.0%
Information Ratio 82.20% 298.35% 86.86% 124.94%
Max Drawdown -9.9% -15.6% -33.9% -36.1%
Nvidia Corp 0.61% Irhythm Technolo -0.7%By Revenue Source 3D Systems Corp 0.54% Blue Prism Group -0.6%
Ats Automation 0.45% Materialise-Adr -0.5%
Raven Industries 0.41% Irobot Corp -0.4%
Intuitive Surgic 0.40% Renishaw Plc -0.3%
Key ratios
Current Q2 2020
EPS 1.04 0.85 ESTUN AUTOMATION CO NUANCE COMMUNICATIONS INC
Price/Sales 5.37 3.80
BPS 14.18 12.93
P/E Positive 51.21 38.50
ROE 8.60 8.75
Price/Book 5.58 3.95
Ticker ROBO LN ISIN IE00BMW3QX54
P/E (1y fwd) 44.43 27.50 S&P 500 3.8% TER 0.8% Inception date 27/10/2014
P/E (3y fwd) 30.04 26.96 MSCI World 3.5% Currency USD Index inception date 17-Jun-14
Sales (1y fwd) 5,125 5,543 Nasdaq 100 4.9% Securities lending No Replication method Physical
Sales (3y fwd) 6,356 5,434
*Source: Bloomberg. The backtested index data has been sourced from the index provider and is based on what they perceive to be reasonable
assumptions and objective data; The index data is gross of fees/costs but is net of withholding taxes. Shaded area indicates live period of the index.
Geographical Breakdown Market Cap Breakdown
Index total return contribution (QtD)
Top 5 Bottom 5
Total stocks = 84
Portfolio composition
Analyst recommendation** Latest Additions Latest Deletions
Constituents overlap Fund Information
50
70
90
110
130
150
170
190
Jun-20 Sep-20 Dec-20 Mar-21 Jun-21
ROBO Global Robotics and Automation UCITS Index
MSCI World Net Total Return USD Index
50
100
150
200
250
300
350
Jun-16 Jun-17 Jun-18 Jun-19 Jun-20 Jun-21
ROBO Global Robotics and Automation UCITS Index
MSCI World Net Total Return USD Index
31% 34% 20% 15%
APAC North America EMEA Other
U.S.
Japan
Germany
Taiwan
Others
0% 50% 100%
Small
Mid
Large
HoldBuy
0%100%
Source: Bloomberg, LGIM; All values are based in USD; As of close of 30-June-21. Please refer to the end of this report for all definitions.
**Analyst recommendation is based on median recommendations for each company.
The value of an investment and any income taken from it is not guaranteed and can go down as well as up;
You may not get back the amount you originally invested. Simulated past performance is not a guide to the future.

Confidential
26
CALCULATION METHODOLOGY FOR
PERFORMANCE STATISTICS:
Cumulative Return: Total return of the index net of withholding
taxes over the given period.
Annualized Return: Annualized total return of the index net of
withholding taxes over the given period.
Volatility: Annualized standard deviation of daily returns over the
given period.
Information Ratio: Annualized return divided by annualized
volatility.
Max Drawdown: Maximum % loss from the peak to the trough in
the given period.
Large Cap: Companies whose market cap is larger than $5bn.
Mid Cap: Companies whose market cap is comprised between $2bn
and $5bn.
Small Cap: Companies whose market cap is lower than $2bn.
CALCULATION METHODOLOGY FOR
KEY RATIOS STATISTICS:
EPS: Median of last 12 months earnings per share for each index
components.
Price/Sales: Median of stock prices divided by sales per share of all
index components.
BPS: Median of total equity divided by the number of shares of all
index components.
P/E positive: Median of net income divided by the average total
common equity for each index components.
ROE: Median of estimated dividend amount divided by the current
stock price for each index components.
Price/Book: Median of stock prices divided by the total equity per
share for each index components.
P/E (1y fwd): Median of stock price divided by index estimated
earnings next year for each index components.
P/E(3y fwd): Median of stock price divided by index estimated
earning in three years for each index components.
Sales (1y fwd): Average of estimated sales next year for each index
components.
Sales (3y fwd): Average of estimated sales in three years for each
index components.
ETF Investment Strategies
Howie Li
Aanand Venkatramanan
Aude Martin
Tobias Merfeld
Elisa Piscopiello
Contact us:
For any questions on this report, please
contact your usual LGIM representative or
email [email protected]. All calls are
recorded. Call charges will vary.
Glossary
+44 345 070 8684 [email protected] lgimetf.com

Confidential
Legal & General Investment Management
27
LGIM Europe Disclaimer and important legal noticeThe information contained in this document (the ‘Information’) has been prepared by LGIM Managers Europe Limited (‘LGIM Europe’), or by its affiliates (‘Legal & General’, ‘we’ or ‘us’). Such Information is the property and/or confidential information of Legal & General and may not be disclosed by you to any other person without the prior written consent of Legal & General.
No party shall have any right of action against Legal & General in relation to the accuracy or completeness of the Information, or any other written or oral information made available in connection with this publication. Any investment advice that we provide to you is based solely on the limited initial information which you have provided to us. No part of this or any other document or presentation provided by us shall be deemed to constitute ‘proper advice’ for the purposes of the Investment Intermediaries Act 1995 (as amended). Any limited initial advice given relating to professional services will be further discussed and negotiated in order to agree formal investment guidelines which will form part of written contractual terms between the parties.
Past performance is no guarantee of future results. The value of an investment and any income taken from it is not guaranteed and can go down as well as up, you may not get back the amount you originally invested. The Information has been produced for use by a professional investor and their advisors only. It should not be distributed without our permission.
The risks associated with each fund or investment strategy are set out in this publication, the relevant prospectus or investment management agreement (as applicable) and these should be read and understood before making any investment decisions. A copy of the relevant documentation can be obtained from your Client Relationship Manager.
Confidentiality and Limitations:Unless otherwise agreed by Legal & General in writing, the Information in this document (a) is for information purposes only and we are not soliciting any action based on it, and (b) is not a recommendation to buy or sell securities or pursue a particular investment strategy; and (c) is not investment, legal, regulatory or tax advice. Any trading or investment decisions taken by you should be based on your own analysis and judgment (and/or that of your professional advisors) and not in reliance on us or the Information. To the fullest extent permitted by law, we exclude all representations, warranties, conditions, undertakings and all other terms of any kind, implied by statute or common law, with respect to the Information including (without limitation) any representations as to the quality, suitability, accuracy or completeness of the Information.
Any projections, estimates or forecasts included in the Information (a) shall not constitute a guarantee of future events, (b) may not consider or reflect all possible future events or conditions relevant to you (for example, market disruption events); and (c) may be based on assumptions or simplifications that may not be relevant to you.
The Information is provided ‘as is' and 'as available’. To the fullest extent permitted by law, Legal & General accepts no liability to you or any other recipient of the Information for any loss, damage or cost arising from, or in connection with, any use or reliance on the Information. Without limiting the generality of the foregoing, Legal & General does not accept any liability for any indirect, special or consequential loss howsoever caused and, on any theory, or liability, whether in contract or tort (including negligence) or otherwise, even if Legal & General has been advised of the possibility of such loss.
Third Party Data:Where this document contains third party data ('Third Party Data’), we cannot guarantee the accuracy, completeness or reliability of such Third-Party Data and accept no responsibility or liability whatsoever in respect of such Third-Party Data.
Publication, Amendments and Updates:We are under no obligation to update or amend the Information or correct any errors in the Information following the date it was delivered to you. Legal & General reserves the right to update this document and/or the Information at any time and without notice.
Although the Information contained in this document is believed to be correct as at the time of printing or publication, no assurance can be given to you that this document is complete or accurate in the light of information that may become available after its publication. The Information may not take into account any relevant events, facts or conditions that have occurred after the publication or printing of this document.
Telephone Recording:As required under applicable laws Legal & General will record all telephone and electronic communications and conversations with you that result or may result in the undertaking of transactions in financial instruments on your behalf. Such records will be kept for a period of five years (or up to seven years upon request from the Central Bank of Ireland (or such successor from time to time)) and will be provided to you upon request.
In the United Kingdom and outside the European Economic Area, it is issued by Legal & General Investment Management Limited, authorised and regulated by the Financial Conduct Authority, No. 119272. Registered in England and Wales No. 02091894 with registered office at One Coleman Street, London, EC2R 5AA.
In the European Economic Area, it is issued by LGIM Managers (Europe) Limited, authorised by the Central Bank of Ireland as a UCITS management company (pursuant to European Communities (Undertakings for Collective Investment in Transferable Securities) Regulations, 2011 (S.I. No. 352 of 2011), as amended) and as an alternative investment fund manager with “top up” permissions which enable the firm to carry out certain additional MiFID investment services (pursuant to the European Union (Alternative Investment Fund Managers) Regulations 2013 (S.I. No. 257 of 2013), as amended). Registered in Ireland with the Companies Registration Office (No. 609677). Registered Office: 70 Sir John Rogerson’s Quay, Dublin, 2, Ireland. Regulated by the Central Bank of Ireland (No. C173733).
LGIM Managers (Europe) Limited operates a branch network in the European Economic Area, which is subject to supervision by the Central Bank of Ireland. In Italy, the branch office of LGIM Managers (Europe) Limited is subject to limited supervision by the Commissione Nazionale per le società e la Borsa (“CONSOB”) and is registered with Banca d’Italia (no. 23978.0) with registered office at Via Uberto Visconti di Modrone, 15, 20122 Milan, (Companies’ Register no. MI - 2557936). In Germany, the branch office of LGIM Managers (Europe) Limited is subject to limited supervision by the German Federal Financial Supervisory Authority (“BaFin”). In the Netherlands, the branch office of LGIM Managers (Europe) Limited is subject to limited supervision by the Dutch Authority for the Financial Markets (“AFM“) and it is included in the register held by the AFM and registered with the trade register of the Chamber of Commerce under number 74481231.Details about the full extent of our relevant authorisations and permissions are available from us upon request. For further information on our products (including the product prospectuses), please visit our website.
Important Information