Embed Size (px)
Citation preview
Indexes and ETFs
Rohtas HandaJuly 2010
© FTSE LIMITED 2010. ALL RIGHTS RESERVED. ANY INFORMATION PRODUCED MUST BE DONE WITH PRIOR AGREEMENT WITH FTSE.
• Understanding investor objectives
• Evolution of indices for ETFs
• Benchmarking has evolved from roots in academia
• ETF case studies
• How will indices change the landscape for ETFs in the future?
Outline
Page 1
© FTSE LIMITED 2010. ALL RIGHTS RESERVED. ANY INFORMATION PRODUCED MUST BE DONE WITH PRIOR AGREEMENT WITH FTSE.
Page 2
Understanding Investor Objectives
© FTSE LIMITED 2010. ALL RIGHTS RESERVED. ANY INFORMATION PRODUCED MUST BE DONE WITH PRIOR AGREEMENT WITH FTSE.
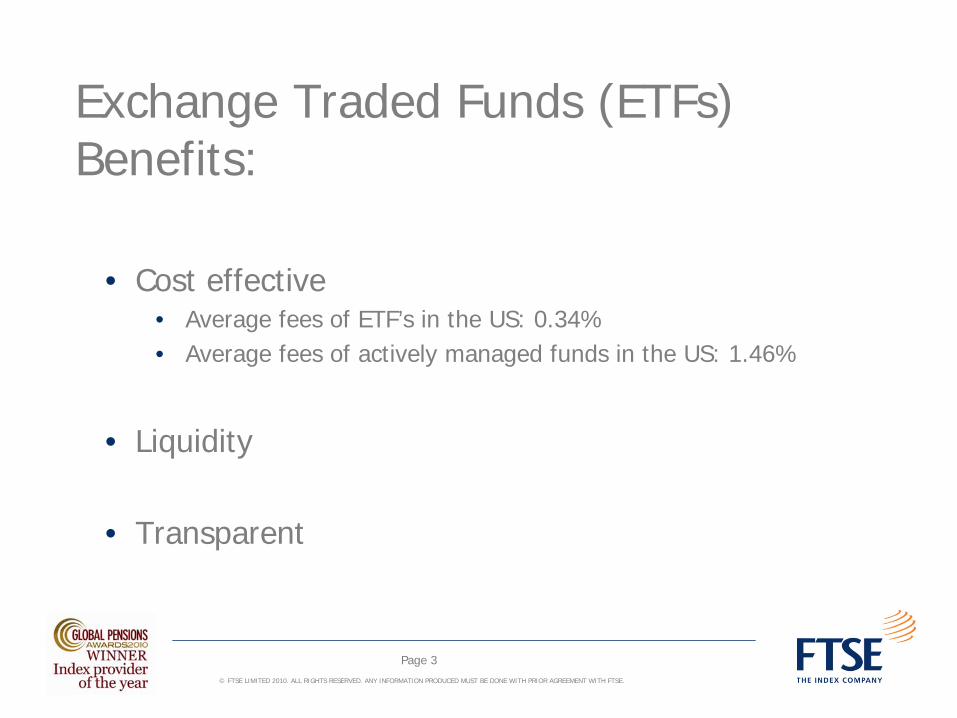
Exchange Traded Funds (ETFs) Benefits:
• Cost effective• Average fees of ETF’s in the US: 0.34%• Average fees of actively managed funds in the US: 1.46%
• Liquidity
• Transparent
Page 3
© FTSE LIMITED 2010. ALL RIGHTS RESERVED. ANY INFORMATION PRODUCED MUST BE DONE WITH PRIOR AGREEMENT WITH FTSE.
Size of the Global ETF Market
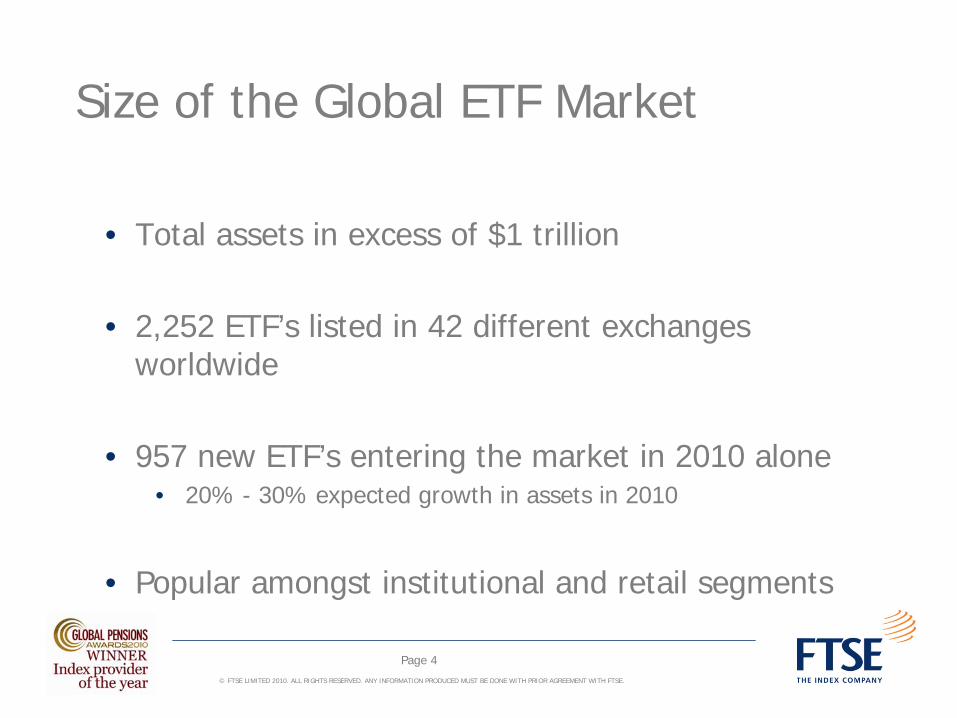
• Total assets in excess of $1 trillion
• 2,252 ETF’s listed in 42 different exchanges worldwide
• 957 new ETF’s entering the market in 2010 alone• 20% - 30% expected growth in assets in 2010
• Popular amongst institutional and retail segments
Page 4

© FTSE LIMITED 2010. ALL RIGHTS RESERVED. ANY INFORMATION PRODUCED MUST BE DONE WITH PRIOR AGREEMENT WITH FTSE.
Size of the Indian ETF Market
• Total of 14 ETF’s
• Total ETF assets of $0.3b
• Total assets of Indian Mutual Fund Industry is approx. $135b
Page 5
© FTSE LIMITED 2010. ALL RIGHTS RESERVED. ANY INFORMATION PRODUCED MUST BE DONE WITH PRIOR AGREEMENT WITH FTSE.
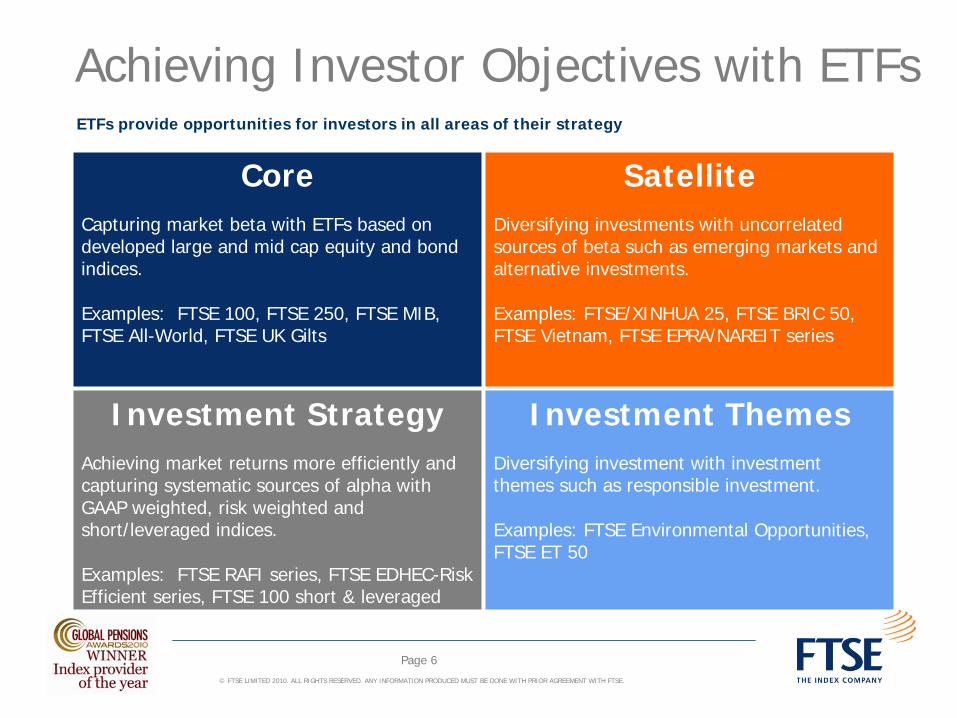
Achieving Investor Objectives with ETFs
CoreCapturing market beta with ETFs based on developed large and mid cap equity and bond indices.
Examples: FTSE 100, FTSE 250, FTSE MIB, FTSE All-World, FTSE UK Gilts
SatelliteDiversifying investments with uncorrelated sources of beta such as emerging markets and alternative investments.
Examples: FTSE/XINHUA 25, FTSE BRIC 50, FTSE Vietnam, FTSE EPRA/NAREIT series
Investment StrategyAchieving market returns more efficiently and capturing systematic sources of alpha with GAAP weighted, risk weighted and short/leveraged indices.
Examples: FTSE RAFI series, FTSE EDHEC-Risk Efficient series, FTSE 100 short & leveraged
Investment ThemesDiversifying investment with investment themes such as responsible investment.
Examples: FTSE Environmental Opportunities, FTSE ET 50
ETFs provide opportunities for investors in all areas of their strategy
Page 6
© FTSE LIMITED 2010. ALL RIGHTS RESERVED. ANY INFORMATION PRODUCED MUST BE DONE WITH PRIOR AGREEMENT WITH FTSE.
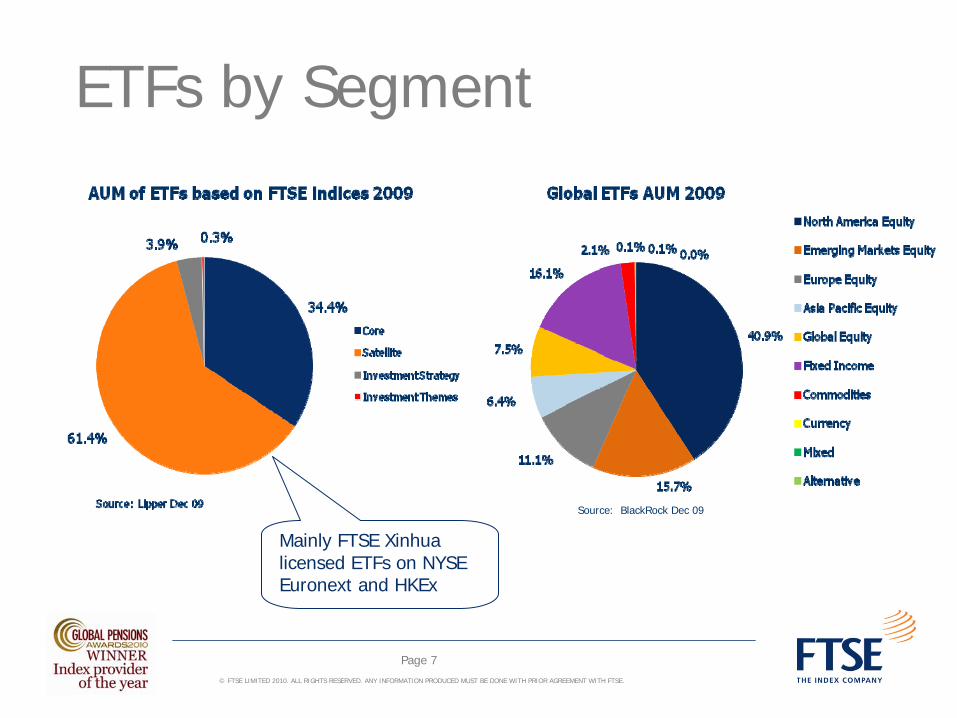
ETFs by Segment
Source: BlackRock Dec 09
Page 7
Mainly FTSE Xinhua licensed ETFs on NYSE Euronext and HKEx
© FTSE LIMITED 2010. ALL RIGHTS RESERVED. ANY INFORMATION PRODUCED MUST BE DONE WITH PRIOR AGREEMENT WITH FTSE.
Who Uses ETFs and How?Who?• Active managers use ETFs to gain broad exposure to a
market or sector represented by an index – in the US, hedge funds are now the largest single category of ETF users
• 401K and passive investors use them as part of their core strategy
• Mostly institutional but increasing retail interest in passive index investment
• A growing interest from European private banks - attracted by low costs, and encouraged by the UCITS III directive
Page 8
© FTSE LIMITED 2010. ALL RIGHTS RESERVED. ANY INFORMATION PRODUCED MUST BE DONE WITH PRIOR AGREEMENT WITH FTSE.
Who uses ETFs and how?How?ETFs allow investors to achieve a range of objectives:
• Investing strategically or tactically in asset classes defined by indices
• To gain fast exposure to a market with tradable indices
• For going long or short with new indices for leveraged and short ETFs
• For implementing an asset allocation strategy using a variety of market indices
• For short-term timing of a particular market because of the tradability of ETFs
Page 9
© FTSE LIMITED 2010. ALL RIGHTS RESERVED. ANY INFORMATION PRODUCED MUST BE DONE WITH PRIOR AGREEMENT WITH FTSE.
Page 10
Evolution of Indices for ETFs
© FTSE LIMITED 2010. ALL RIGHTS RESERVED. ANY INFORMATION PRODUCED MUST BE DONE WITH PRIOR AGREEMENT WITH FTSE.
The Role of Indexing in ETF Creation• ETFs are created to track an underlying index, allowing the ETF
performance to mirror a broader stock universe
• Often based on an accepted benchmark, the index contributes to the market acceptance and understanding of the investment opportunity
• Independent rules-based index design provides the market with transparency and confidence
• Index liquidity rules stipulating a minimum percentage turnover of constituents’ free-float adjusted shares in issue ensure ETF liquidity
Page 11
© FTSE LIMITED 2010. ALL RIGHTS RESERVED. ANY INFORMATION PRODUCED MUST BE DONE WITH PRIOR AGREEMENT WITH FTSE.
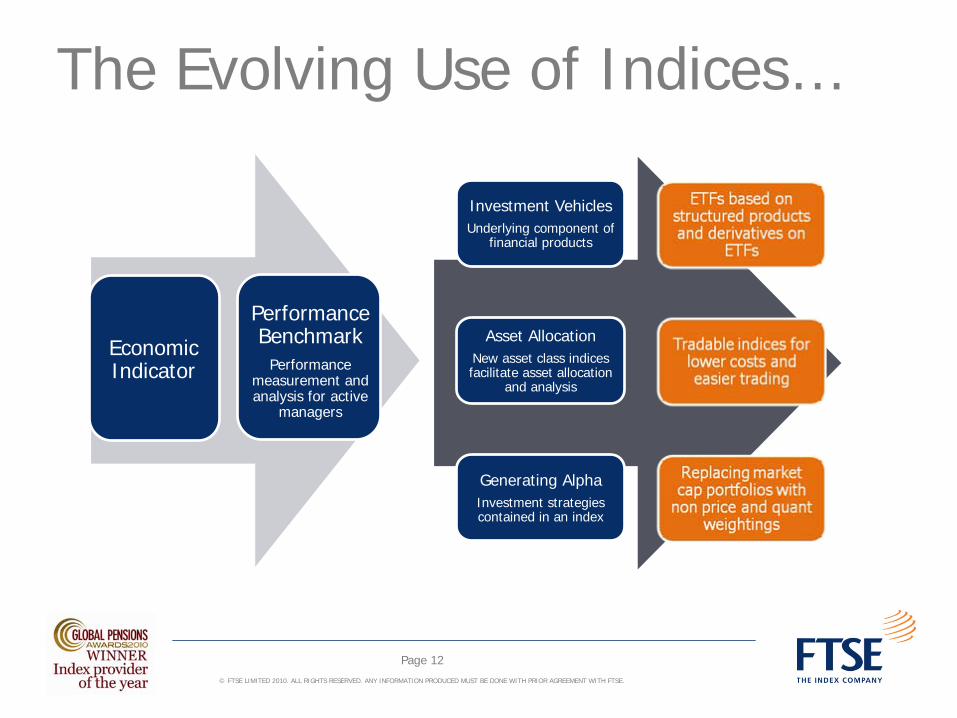
The Evolving Use of Indices…
Investment VehiclesUnderlying component of
financial products
Asset AllocationNew asset class indices facilitate asset allocation
and analysis
Generating AlphaInvestment strategies contained in an index
Economic Indicator
Performance Benchmark
Performance measurement and analysis for active
managers
Page 12
© FTSE LIMITED 2010. ALL RIGHTS RESERVED. ANY INFORMATION PRODUCED MUST BE DONE WITH PRIOR AGREEMENT WITH FTSE.
Page 13
Benchmarking has Evolved from Roots in Academia
© FTSE LIMITED 2010. ALL RIGHTS RESERVED. ANY INFORMATION PRODUCED MUST BE DONE WITH PRIOR AGREEMENT WITH FTSE.
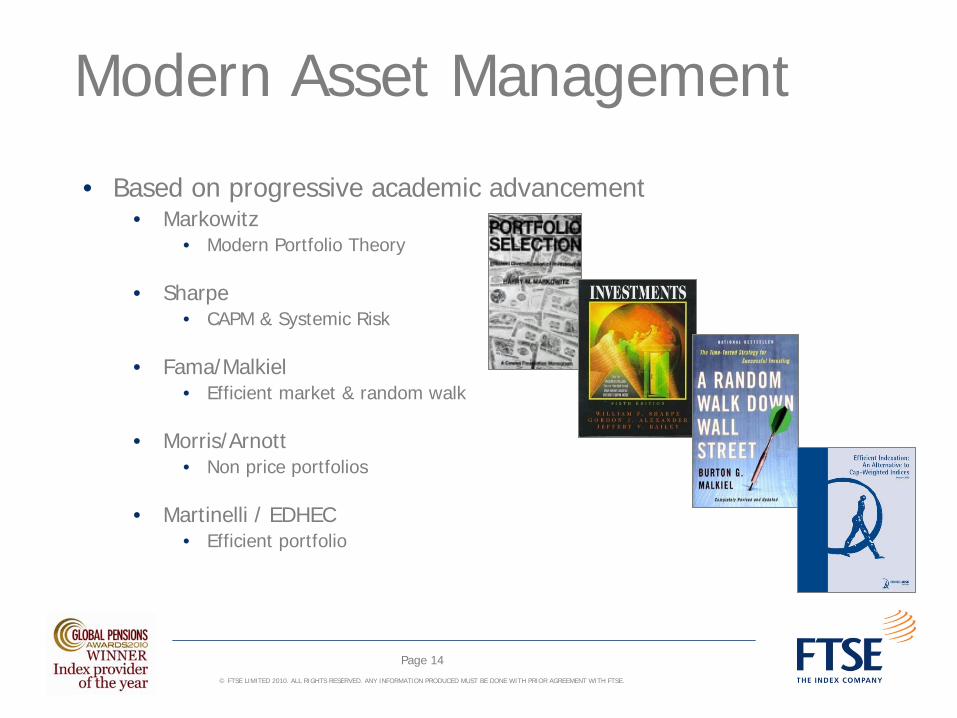
Modern Asset Management
• Based on progressive academic advancement• Markowitz
• Modern Portfolio Theory
• Sharpe• CAPM & Systemic Risk
• Fama/Malkiel• Efficient market & random walk
• Morris/Arnott• Non price portfolios
• Martinelli / EDHEC• Efficient portfolio
Page 14

© FTSE LIMITED 2010. ALL RIGHTS RESERVED. ANY INFORMATION PRODUCED MUST BE DONE WITH PRIOR AGREEMENT WITH FTSE.
Modern Asset Management
• Sophisticated investors build portfolios combining • Indexing• Enhanced Indexing• Risk controlled active • Traditional active
Page 15
Indexing and enhanced indexing enable investors to precisely determine risk exposure.
•Rigorous attention to asset class definition and benchmarks•Aim for small but consistent out performance•Control risk to minimize tracking error
© FTSE LIMITED 2010. ALL RIGHTS RESERVED. ANY INFORMATION PRODUCED MUST BE DONE WITH PRIOR AGREEMENT WITH FTSE.
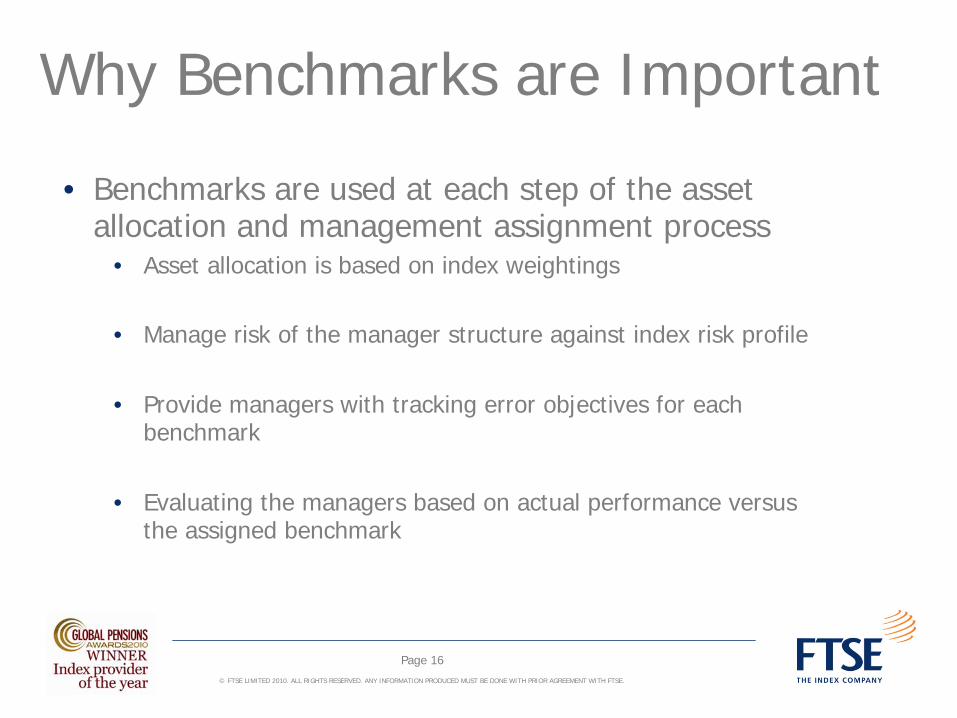
Why Benchmarks are Important
• Benchmarks are used at each step of the asset allocation and management assignment process
• Asset allocation is based on index weightings
• Manage risk of the manager structure against index risk profile
• Provide managers with tracking error objectives for each benchmark
• Evaluating the managers based on actual performance versus the assigned benchmark
Page 16
© FTSE LIMITED 2010. ALL RIGHTS RESERVED. ANY INFORMATION PRODUCED MUST BE DONE WITH PRIOR AGREEMENT WITH FTSE.
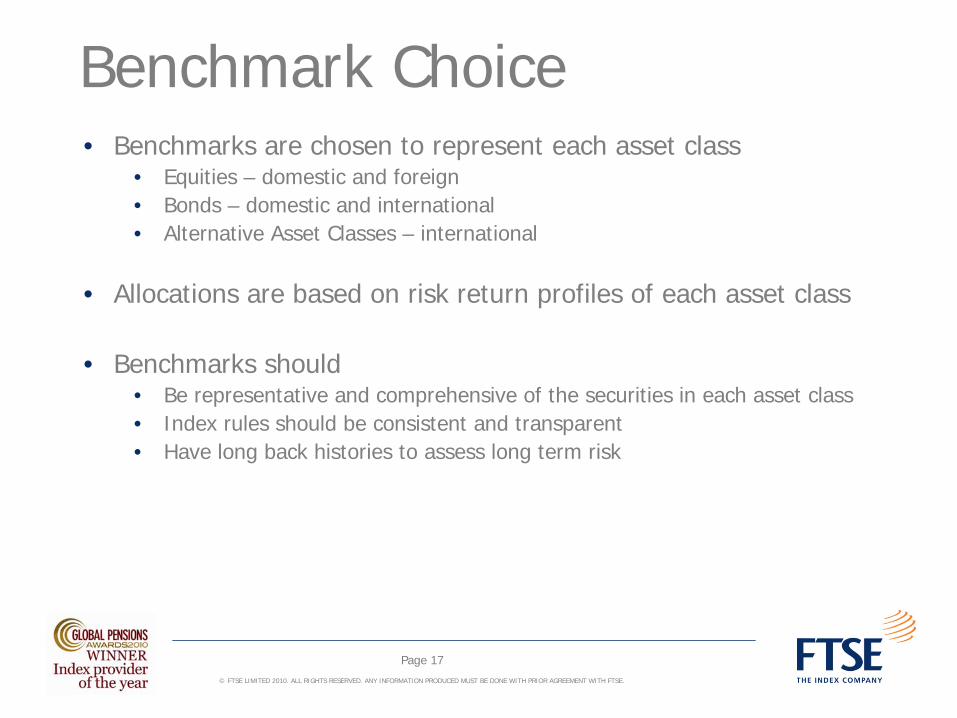
Benchmark Choice• Benchmarks are chosen to represent each asset class
• Equities – domestic and foreign• Bonds – domestic and international • Alternative Asset Classes – international
• Allocations are based on risk return profiles of each asset class
• Benchmarks should • Be representative and comprehensive of the securities in each asset class• Index rules should be consistent and transparent• Have long back histories to assess long term risk
Page 17
© FTSE LIMITED 2010. ALL RIGHTS RESERVED. ANY INFORMATION PRODUCED MUST BE DONE WITH PRIOR AGREEMENT WITH FTSE.
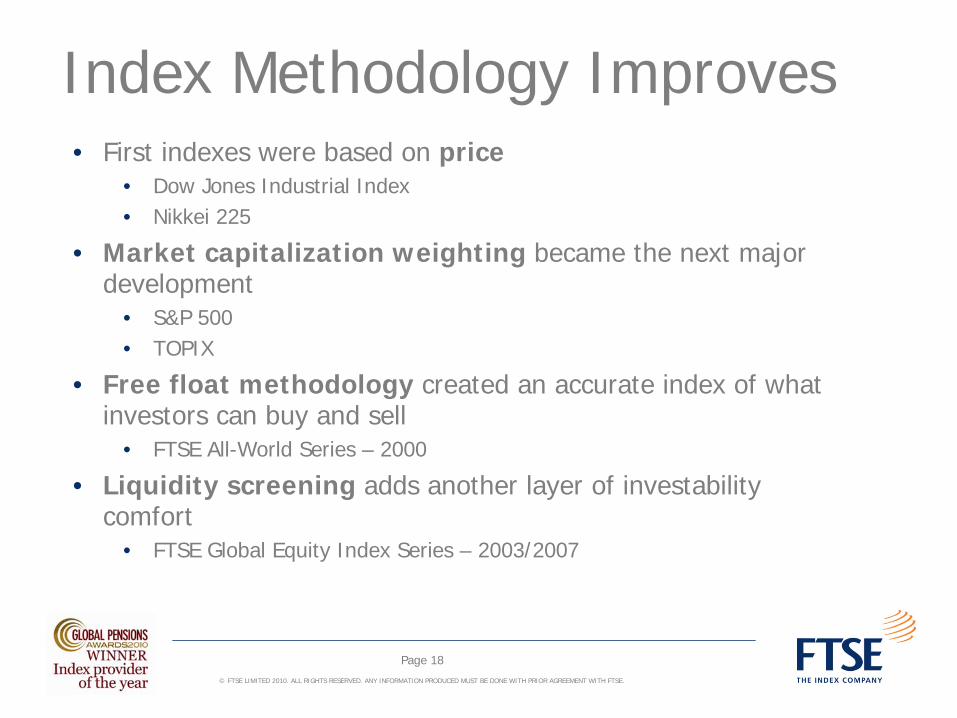
Index Methodology Improves• First indexes were based on price
• Dow Jones Industrial Index• Nikkei 225
• Market capitalization weighting became the next major development
• S&P 500• TOPIX
• Free float methodology created an accurate index of what investors can buy and sell
• FTSE All-World Series – 2000
• Liquidity screening adds another layer of investability comfort
• FTSE Global Equity Index Series – 2003/2007
Page 18
© FTSE LIMITED 2010. ALL RIGHTS RESERVED. ANY INFORMATION PRODUCED MUST BE DONE WITH PRIOR AGREEMENT WITH FTSE.
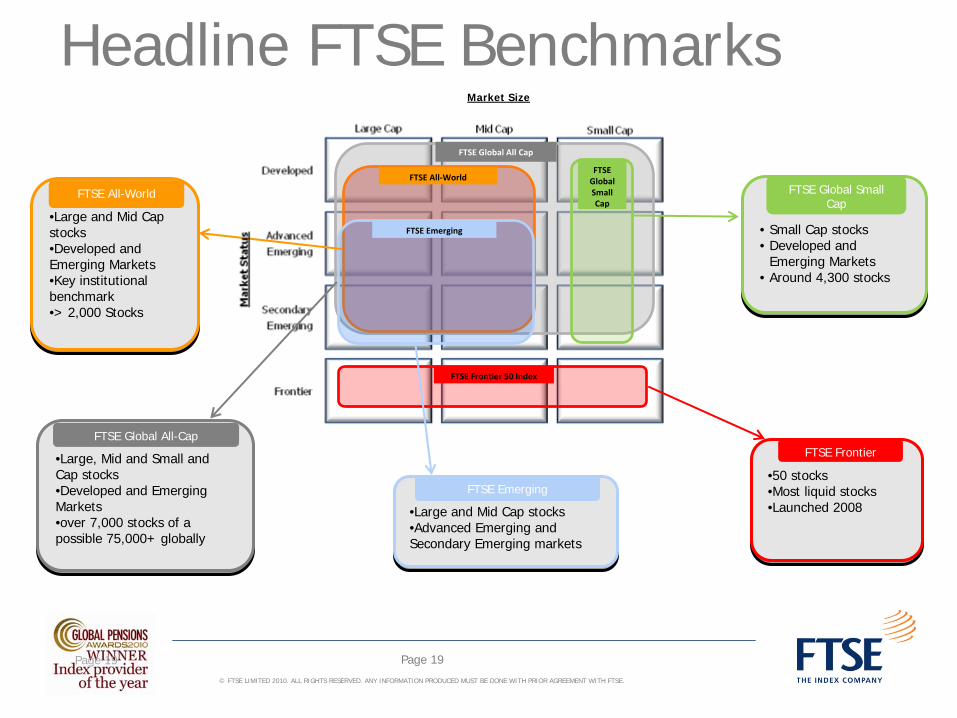
Headline FTSE Benchmarks
• Small Cap stocks• Developed and
Emerging Markets • Around 4,300 stocks
• Small Cap stocks• Developed and
Emerging Markets• Around 4,300 stocks
FTSE
Global
Small
Cap
•50 stocks•Most liquid stocks•Launched 2008
•50 stocks•Most liquid stocks•Launched 2008
•Large, Mid and Small and Cap stocks •Developed and Emerging Markets •over 7,000 stocks of a possible 75,000+ globally
•Large, Mid and Small and Cap stocks•Developed and Emerging Markets•over 7,000 stocks of a possible 75,000+ globally
•Large and Mid Cap stocks •Developed and Emerging Markets •Key institutional benchmark •> 2,000 Stocks
•Large and Mid Cap stocks•Developed and Emerging Markets•Key institutional benchmark•> 2,000 Stocks
•Large and Mid Cap stocks•Advanced Emerging and Secondary Emerging markets
•Large and Mid Cap stocks•Advanced Emerging and Secondary Emerging markets
FTSE All‐World
FTSE Frontier 50 Index
FTSE Global All Cap
FTSE Emerging
FTSE All-World
FTSE Global All-Cap
FTSE Emerging
FTSE Frontier
FTSE Global Small Cap
Market Size
Page 19 Page 19
© FTSE LIMITED 2010. ALL RIGHTS RESERVED. ANY INFORMATION PRODUCED MUST BE DONE WITH PRIOR AGREEMENT WITH FTSE.
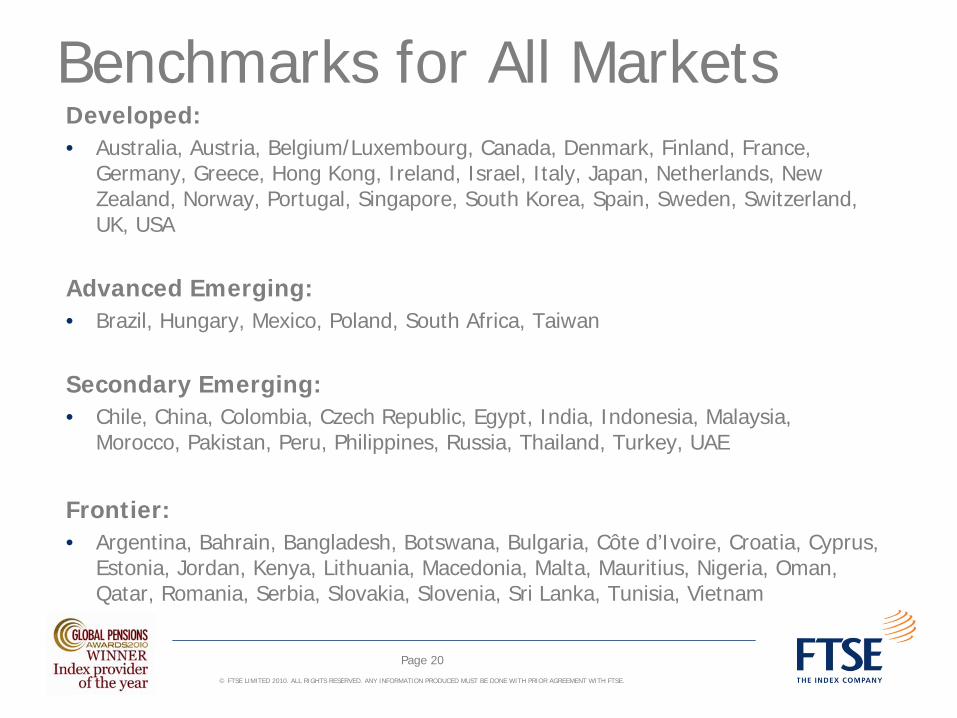
Benchmarks for All MarketsDeveloped:• Australia, Austria, Belgium/Luxembourg, Canada, Denmark, Finland, France,
Germany, Greece, Hong Kong, Ireland, Israel, Italy, Japan, Netherlands, New Zealand, Norway, Portugal, Singapore, South Korea, Spain, Sweden, Switzerland, UK, USA
Advanced Emerging:• Brazil, Hungary, Mexico, Poland, South Africa, Taiwan
Secondary Emerging:• Chile, China, Colombia, Czech Republic, Egypt, India, Indonesia, Malaysia,
Morocco, Pakistan, Peru, Philippines, Russia, Thailand, Turkey, UAE
Frontier:• Argentina, Bahrain, Bangladesh, Botswana, Bulgaria, Côte d’Ivoire, Croatia, Cyprus,
Estonia, Jordan, Kenya, Lithuania, Macedonia, Malta, Mauritius, Nigeria, Oman, Qatar, Romania, Serbia, Slovakia, Slovenia, Sri Lanka, Tunisia, Vietnam
Page 20
© FTSE LIMITED 2010. ALL RIGHTS RESERVED. ANY INFORMATION PRODUCED MUST BE DONE WITH PRIOR AGREEMENT WITH FTSE.
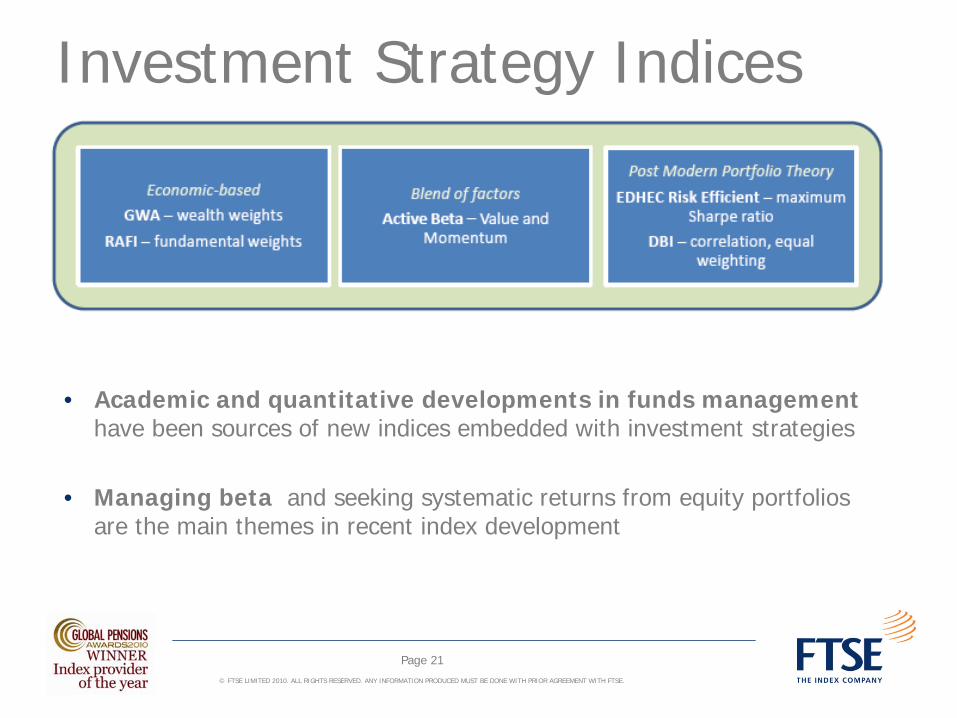
Investment Strategy Indices
Page 21
• Academic and quantitative developments in funds management have been sources of new indices embedded with investment strategies
• Managing beta and seeking systematic returns from equity portfolios are the main themes in recent index development

© FTSE LIMITED 2010. ALL RIGHTS RESERVED. ANY INFORMATION PRODUCED MUST BE DONE WITH PRIOR AGREEMENT WITH FTSE.
Country Classification
Page 22
© FTSE LIMITED 2010. ALL RIGHTS RESERVED. ANY INFORMATION PRODUCED MUST BE DONE WITH PRIOR AGREEMENT WITH FTSE.
Industry Classification
Page 23
© FTSE LIMITED 2010. ALL RIGHTS RESERVED. ANY INFORMATION PRODUCED MUST BE DONE WITH PRIOR AGREEMENT WITH FTSE.
Page 24
ETF Case Studies
© FTSE LIMITED 2010. ALL RIGHTS RESERVED. ANY INFORMATION PRODUCED MUST BE DONE WITH PRIOR AGREEMENT WITH FTSE.
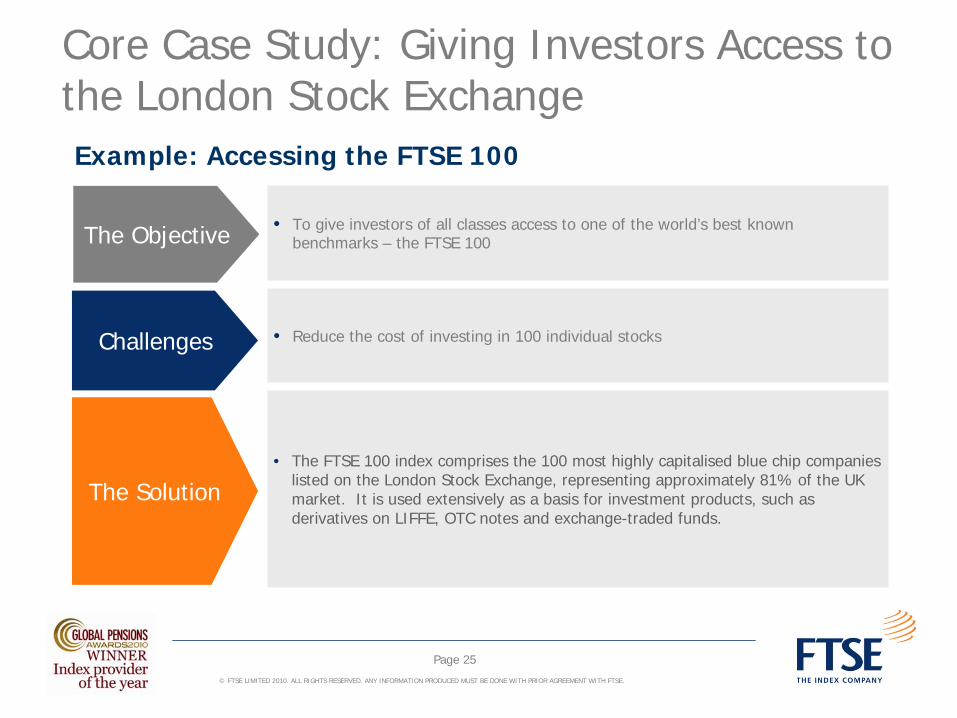
Core Case Study: Giving Investors Access to the London Stock ExchangeExample: Accessing the FTSE 100
The Objective • To give investors of all classes access to one of the world’s best known benchmarks – the FTSE 100
• Reduce the cost of investing in 100 individual stocks
• The FTSE 100 index comprises the 100 most highly capitalised blue chip companies listed on the London Stock Exchange, representing approximately 81% of the UK market. It is used extensively as a basis for investment products, such as derivatives on LIFFE, OTC notes and exchange-traded funds.
Challenges
The Solution
Page 25
© FTSE LIMITED 2010. ALL RIGHTS RESERVED. ANY INFORMATION PRODUCED MUST BE DONE WITH PRIOR AGREEMENT WITH FTSE.
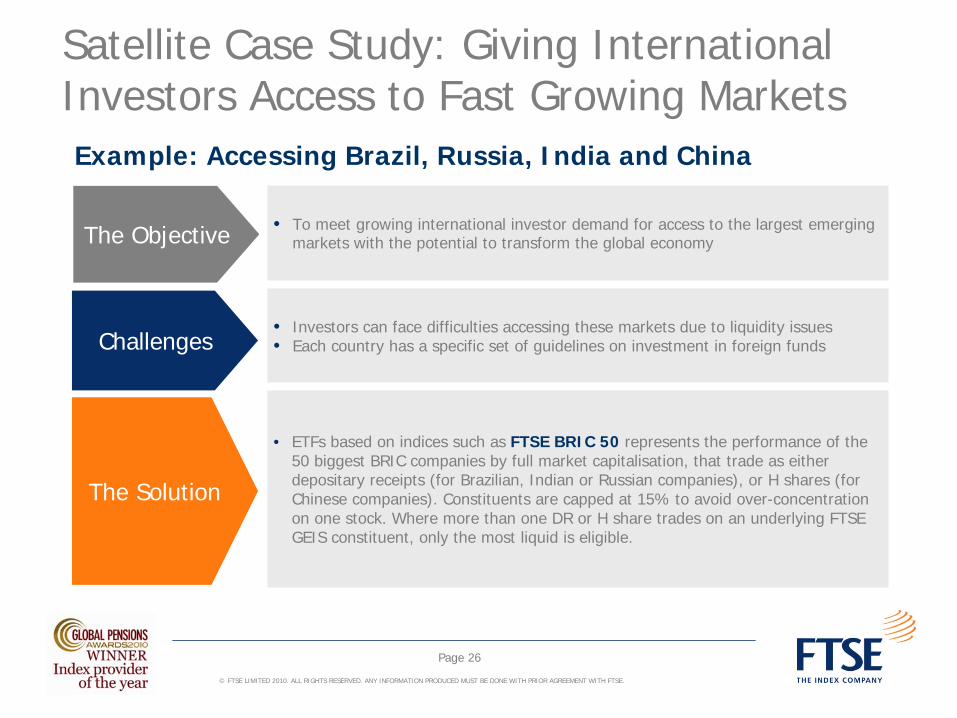
Satellite Case Study: Giving International Investors Access to Fast Growing MarketsExample: Accessing Brazil, Russia, India and China
The Objective • To meet growing international investor demand for access to the largest emerging markets with the potential to transform the global economy
• Investors can face difficulties accessing these markets due to liquidity issues• Each country has a specific set of guidelines on investment in foreign funds
• ETFs based on indices such as FTSE BRIC 50 represents the performance of the 50 biggest BRIC companies by full market capitalisation, that trade as either depositary receipts (for Brazilian, Indian or Russian companies), or H shares (for Chinese companies). Constituents are capped at 15% to avoid over-concentration on one stock. Where more than one DR or H share trades on an underlying FTSE GEIS constituent, only the most liquid is eligible.
Challenges
The Solution
Page 26
© FTSE LIMITED 2010. ALL RIGHTS RESERVED. ANY INFORMATION PRODUCED MUST BE DONE WITH PRIOR AGREEMENT WITH FTSE.
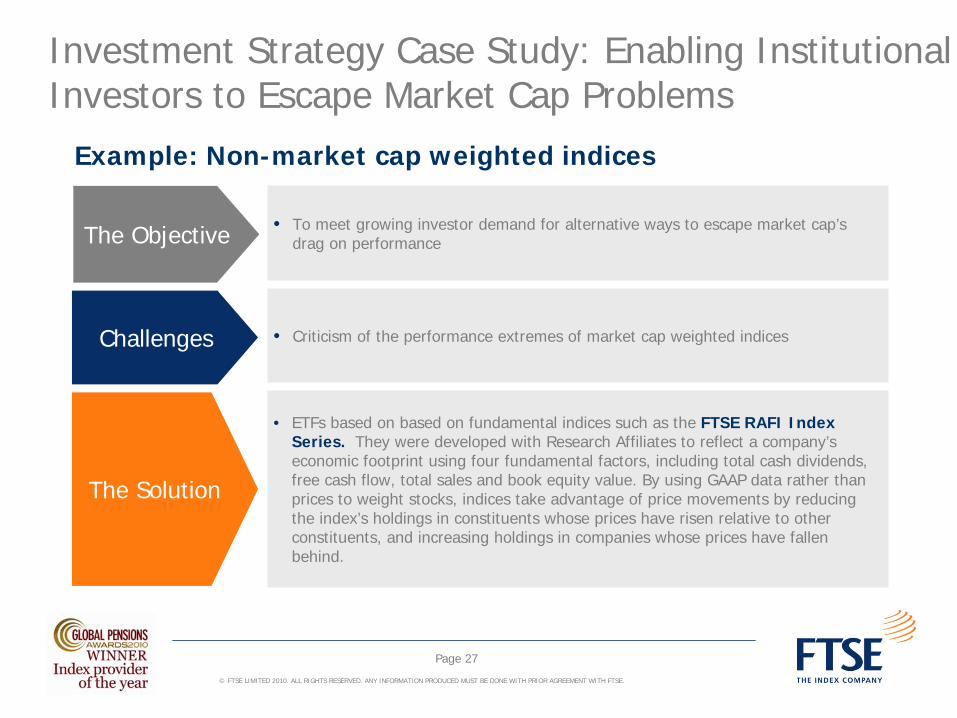
Investment Strategy Case Study: Enabling Institutional Investors to Escape Market Cap Problems
Example: Non-market cap weighted indices
The Objective • To meet growing investor demand for alternative ways to escape market cap’s drag on performance
• Criticism of the performance extremes of market cap weighted indices
• ETFs based on based on fundamental indices such as the FTSE RAFI Index Series. They were developed with Research Affiliates to reflect a company’s economic footprint using four fundamental factors, including total cash dividends, free cash flow, total sales and book equity value. By using GAAP data rather than prices to weight stocks, indices take advantage of price movements by reducing the index’s holdings in constituents whose prices have risen relative to other constituents, and increasing holdings in companies whose prices have fallen behind.
Challenges
The Solution
Page 27
© FTSE LIMITED 2010. ALL RIGHTS RESERVED. ANY INFORMATION PRODUCED MUST BE DONE WITH PRIOR AGREEMENT WITH FTSE.
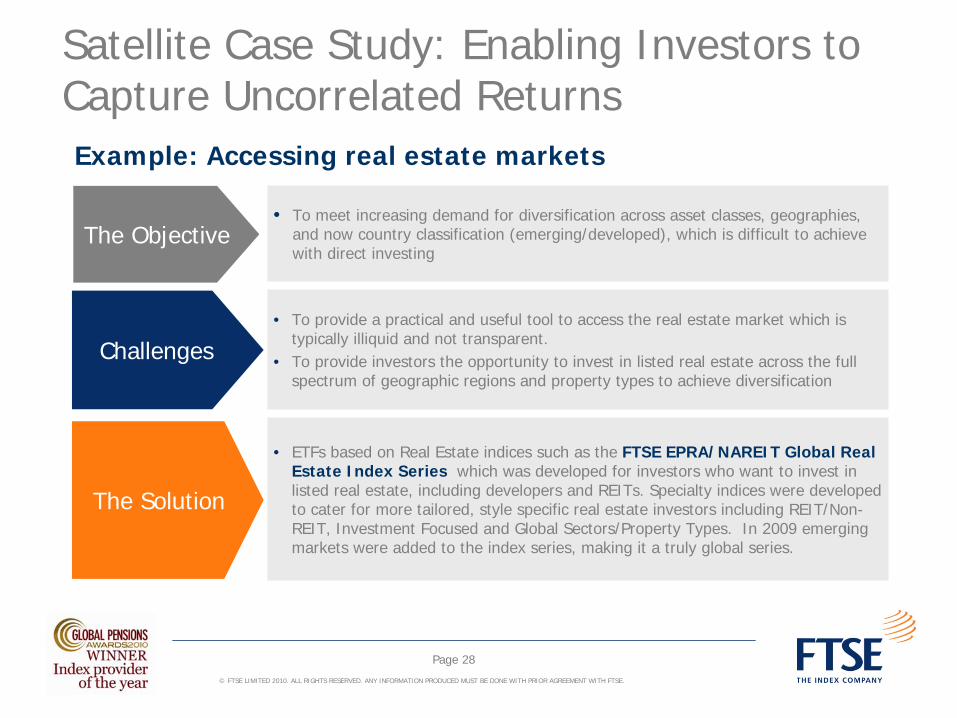
Satellite Case Study: Enabling Investors to Capture Uncorrelated ReturnsExample: Accessing real estate markets
The Objective• To meet increasing demand for diversification across asset classes, geographies,
and now country classification (emerging/developed), which is difficult to achieve with direct investing
• To provide a practical and useful tool to access the real estate market which is typically illiquid and not transparent.
• To provide investors the opportunity to invest in listed real estate across the full spectrum of geographic regions and property types to achieve diversification
• ETFs based on Real Estate indices such as the FTSE EPRA/NAREIT Global Real Estate Index Series which was developed for investors who want to invest in listed real estate, including developers and REITs. Specialty indices were developed to cater for more tailored, style specific real estate investors including REIT/Non- REIT, Investment Focused and Global Sectors/Property Types. In 2009 emerging markets were added to the index series, making it a truly global series.
Challenges
The Solution
Page 28
© FTSE LIMITED 2010. ALL RIGHTS RESERVED. ANY INFORMATION PRODUCED MUST BE DONE WITH PRIOR AGREEMENT WITH FTSE.
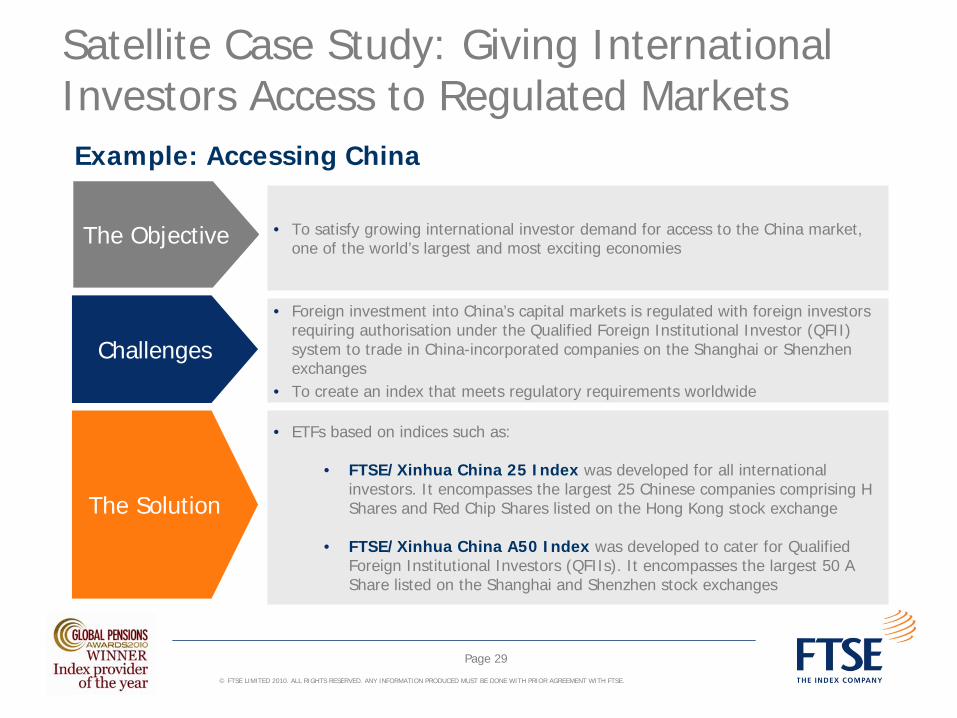
Satellite Case Study: Giving International Investors Access to Regulated MarketsExample: Accessing China
The Objective • To satisfy growing international investor demand for access to the China market, one of the world’s largest and most exciting economies
• Foreign investment into China’s capital markets is regulated with foreign investors requiring authorisation under the Qualified Foreign Institutional Investor (QFII) system to trade in China-incorporated companies on the Shanghai or Shenzhen exchanges
• To create an index that meets regulatory requirements worldwide
• ETFs based on indices such as:
• FTSE/Xinhua China 25 Index was developed for all international investors. It encompasses the largest 25 Chinese companies comprising H Shares and Red Chip Shares listed on the Hong Kong stock exchange
• FTSE/Xinhua China A50 Index was developed to cater for Qualified Foreign Institutional Investors (QFIIs). It encompasses the largest 50 A Share listed on the Shanghai and Shenzhen stock exchanges
Challenges
The Solution
Page 29
© FTSE LIMITED 2010. ALL RIGHTS RESERVED. ANY INFORMATION PRODUCED MUST BE DONE WITH PRIOR AGREEMENT WITH FTSE.
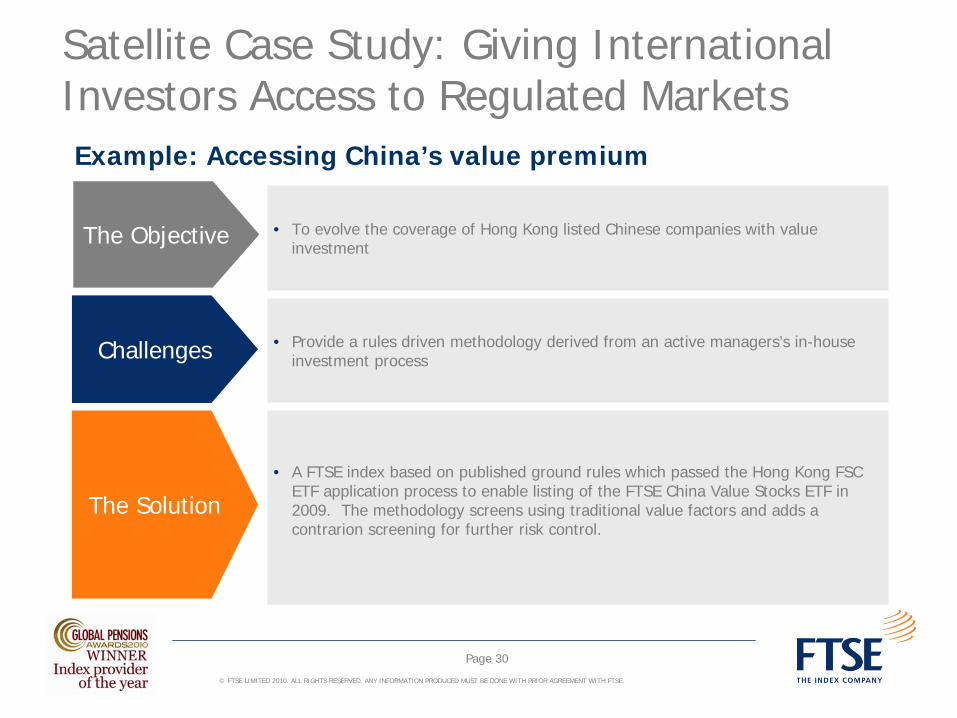
Satellite Case Study: Giving International Investors Access to Regulated MarketsExample: Accessing China’s value premium
The Objective • To evolve the coverage of Hong Kong listed Chinese companies with value investment
• Provide a rules driven methodology derived from an active managers’s in-house investment process
• A FTSE index based on published ground rules which passed the Hong Kong FSC ETF application process to enable listing of the FTSE China Value Stocks ETF in 2009. The methodology screens using traditional value factors and adds a contrarion screening for further risk control.
Challenges
The Solution
Page 30
© FTSE LIMITED 2010. ALL RIGHTS RESERVED. ANY INFORMATION PRODUCED MUST BE DONE WITH PRIOR AGREEMENT WITH FTSE.
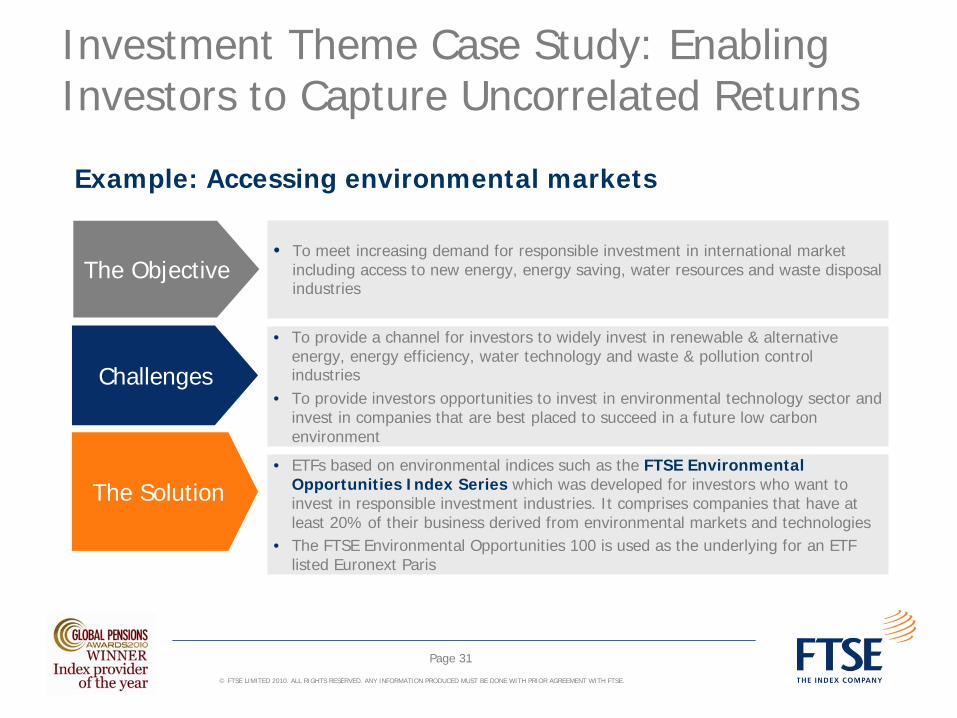
Investment Theme Case Study: Enabling Investors to Capture Uncorrelated Returns
Example: Accessing environmental markets
The Objective• To meet increasing demand for responsible investment in international market
including access to new energy, energy saving, water resources and waste disposal industries
• To provide a channel for investors to widely invest in renewable & alternative energy, energy efficiency, water technology and waste & pollution control industries
• To provide investors opportunities to invest in environmental technology sector and invest in companies that are best placed to succeed in a future low carbon environment
• ETFs based on environmental indices such as the FTSE Environmental Opportunities Index Series which was developed for investors who want to invest in responsible investment industries. It comprises companies that have at least 20% of their business derived from environmental markets and technologies
• The FTSE Environmental Opportunities 100 is used as the underlying for an ETF listed Euronext Paris
Challenges
The Solution
Page 31
© FTSE LIMITED 2010. ALL RIGHTS RESERVED. ANY INFORMATION PRODUCED MUST BE DONE WITH PRIOR AGREEMENT WITH FTSE.
Page 32
How Will Indices Change the Landscape for ETFs in the Future?
© FTSE LIMITED 2010. ALL RIGHTS RESERVED. ANY INFORMATION PRODUCED MUST BE DONE WITH PRIOR AGREEMENT WITH FTSE.
Page 33
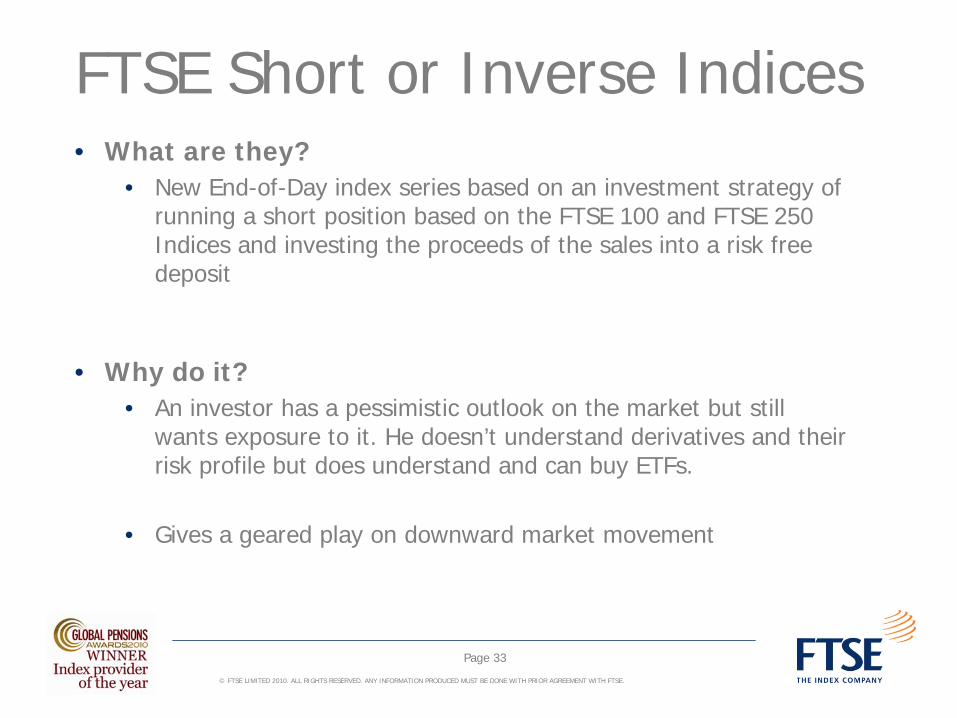
FTSE Short or Inverse Indices• What are they?
• New End-of-Day index series based on an investment strategy of running a short position based on the FTSE 100 and FTSE 250 Indices and investing the proceeds of the sales into a risk free deposit
• Why do it?• An investor has a pessimistic outlook on the market but still
wants exposure to it. He doesn’t understand derivatives and their risk profile but does understand and can buy ETFs.
• Gives a geared play on downward market movement
© FTSE LIMITED 2010. ALL RIGHTS RESERVED. ANY INFORMATION PRODUCED MUST BE DONE WITH PRIOR AGREEMENT WITH FTSE.
Page 34
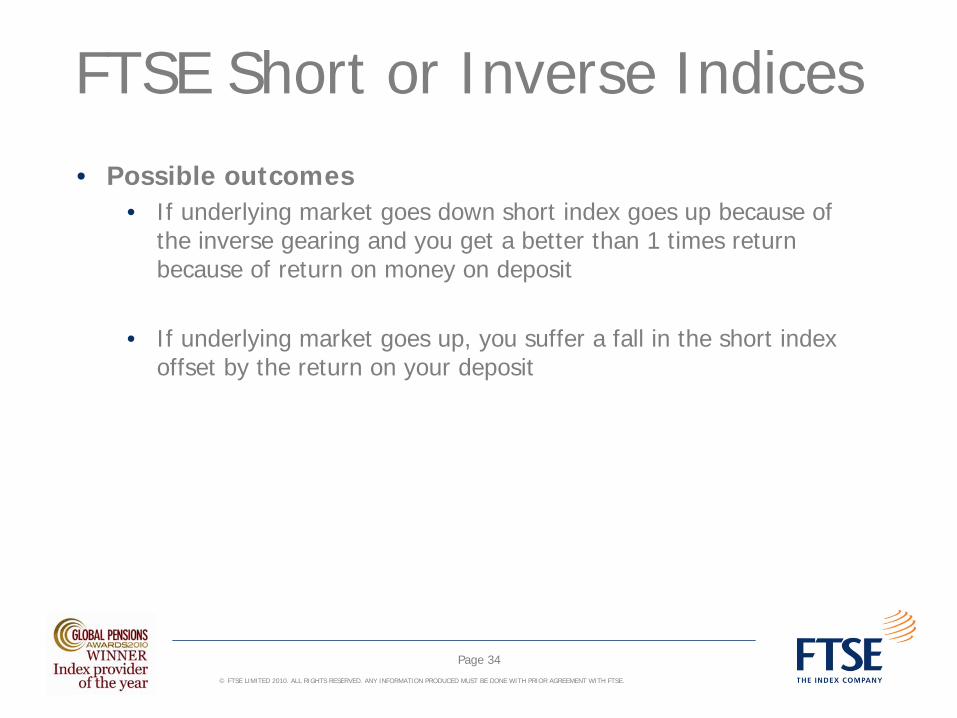
FTSE Short or Inverse Indices• Possible outcomes
• If underlying market goes down short index goes up because of the inverse gearing and you get a better than 1 times return because of return on money on deposit
• If underlying market goes up, you suffer a fall in the short index offset by the return on your deposit
© FTSE LIMITED 2010. ALL RIGHTS RESERVED. ANY INFORMATION PRODUCED MUST BE DONE WITH PRIOR AGREEMENT WITH FTSE.
Page 35
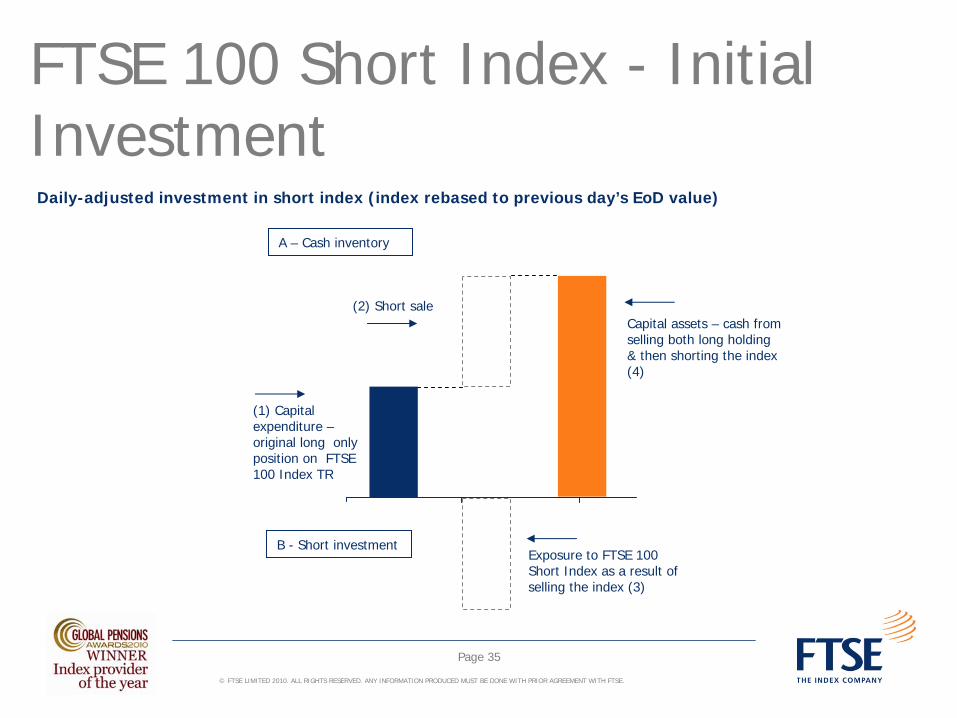
FTSE 100 Short Index - Initial Investment
(2) Short saleCapital assets – cash from selling both long holding & then shorting the index (4)
(1) Capital expenditure – original long only position on FTSE 100 Index TR
Exposure to FTSE 100 Short Index as a result of selling the index (3)
A – Cash inventory
B - Short investment
Daily-adjusted investment in short index (index rebased to previous day’s EoD value)
© FTSE LIMITED 2010. ALL RIGHTS RESERVED. ANY INFORMATION PRODUCED MUST BE DONE WITH PRIOR AGREEMENT WITH FTSE.
Page 36
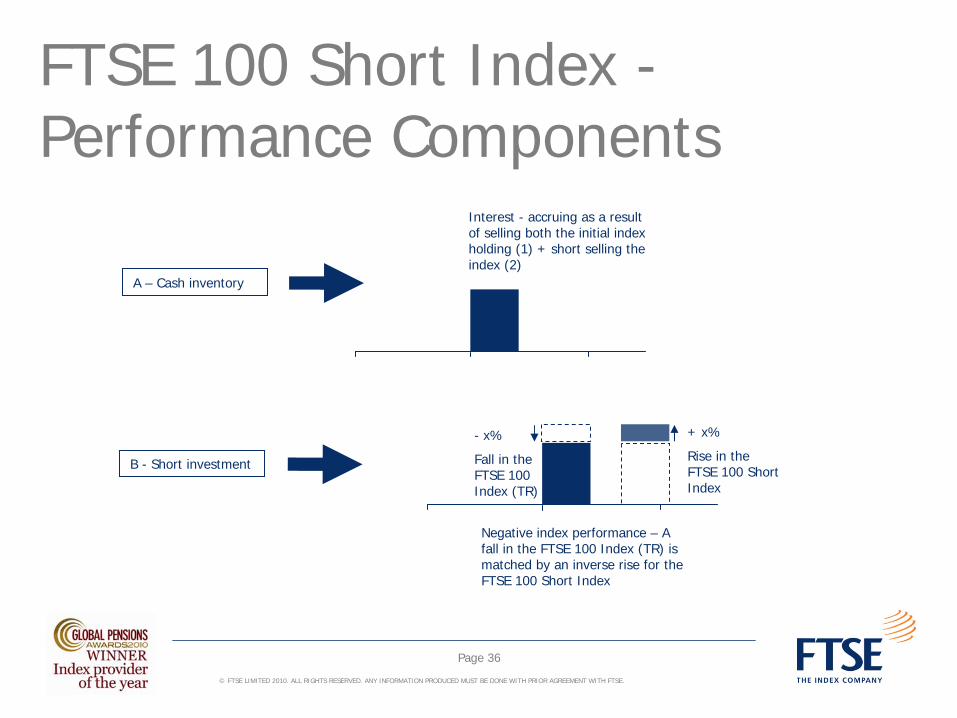
- x%
Fall in the FTSE 100 Index (TR)
FTSE 100 Short Index - Performance Components
Interest - accruing as a result of selling both the initial index holding (1) + short selling the index (2)
A – Cash inventory
+ x%
Rise in the FTSE 100 Short Index
Negative index performance – A fall in the FTSE 100 Index (TR) is matched by an inverse rise for the FTSE 100 Short Index
B - Short investment
© FTSE LIMITED 2010. ALL RIGHTS RESERVED. ANY INFORMATION PRODUCED MUST BE DONE WITH PRIOR AGREEMENT WITH FTSE.
Page 37
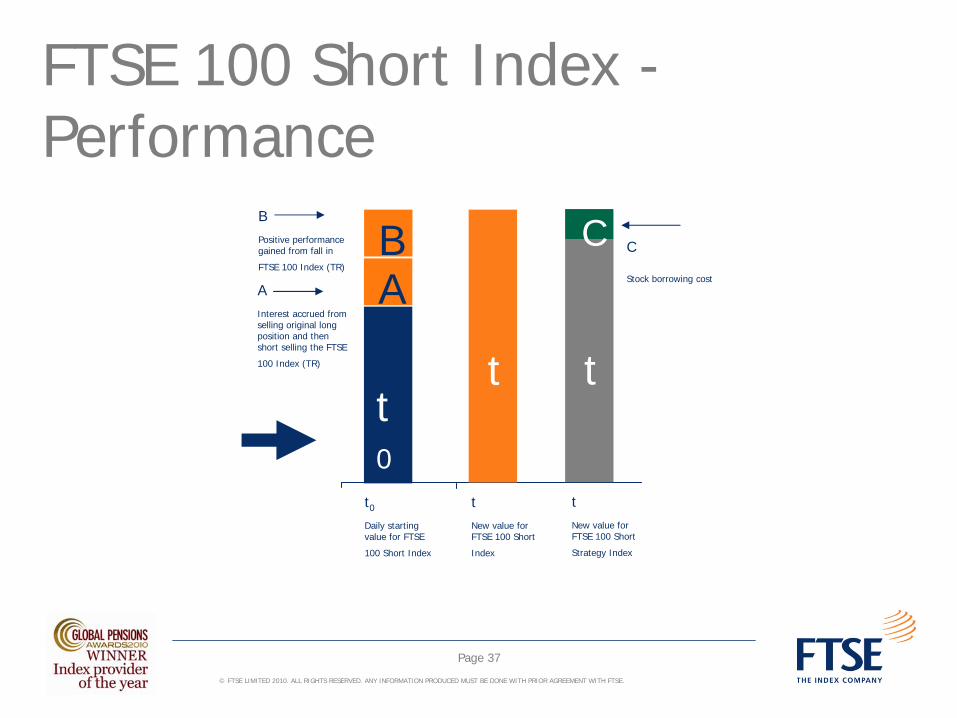
FTSE 100 Short Index - Performance
t0
Daily starting value for FTSE
100 Short Index
A
t0
t
tNew value for FTSE 100 Short
Index
BBPositive performance gained from fall in
FTSE 100 Index (TR)
AInterest accrued from selling original long position and then short selling the FTSE
100 Index (TR) t
C
tNew value for FTSE 100 Short
Strategy Index
C
Stock borrowing cost
© FTSE LIMITED 2010. ALL RIGHTS RESERVED. ANY INFORMATION PRODUCED MUST BE DONE WITH PRIOR AGREEMENT WITH FTSE.
Page 38
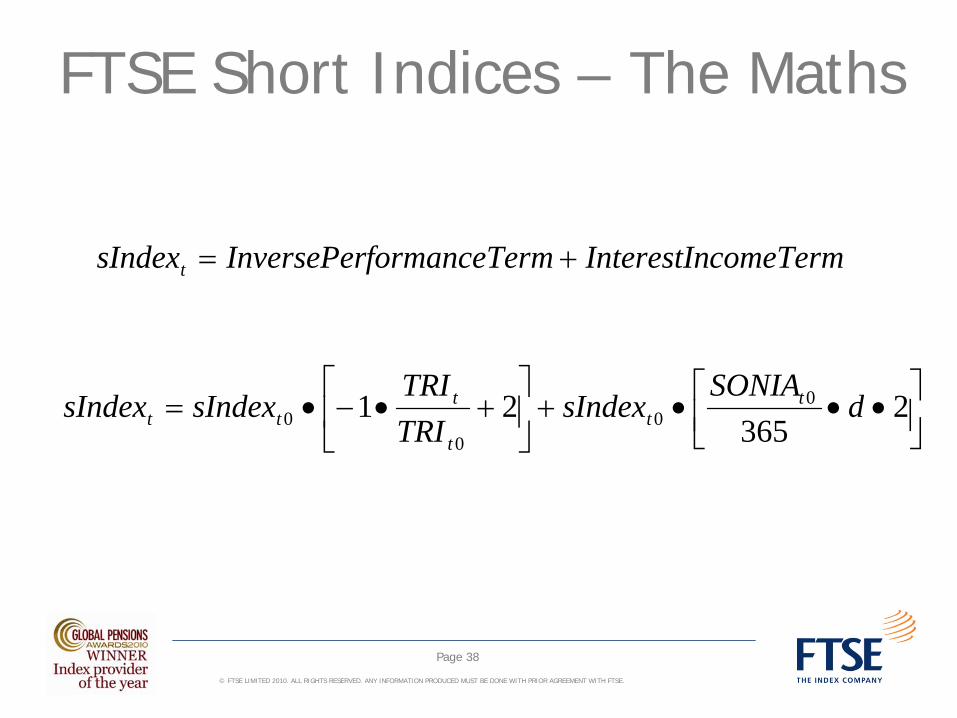
FTSE Short Indices – The Maths
⎥⎦⎤
⎢⎣⎡ •••+⎥
⎦
⎤⎢⎣
⎡+•−•= 2
36521 0
00
0 dSONIA
sIndexTRITRI
sIndexsIndex tt
t
ttt
comeTermInterestInrmformanceTeInversePersIndext +=
© FTSE LIMITED 2010. ALL RIGHTS RESERVED. ANY INFORMATION PRODUCED MUST BE DONE WITH PRIOR AGREEMENT WITH FTSE.
Page 39
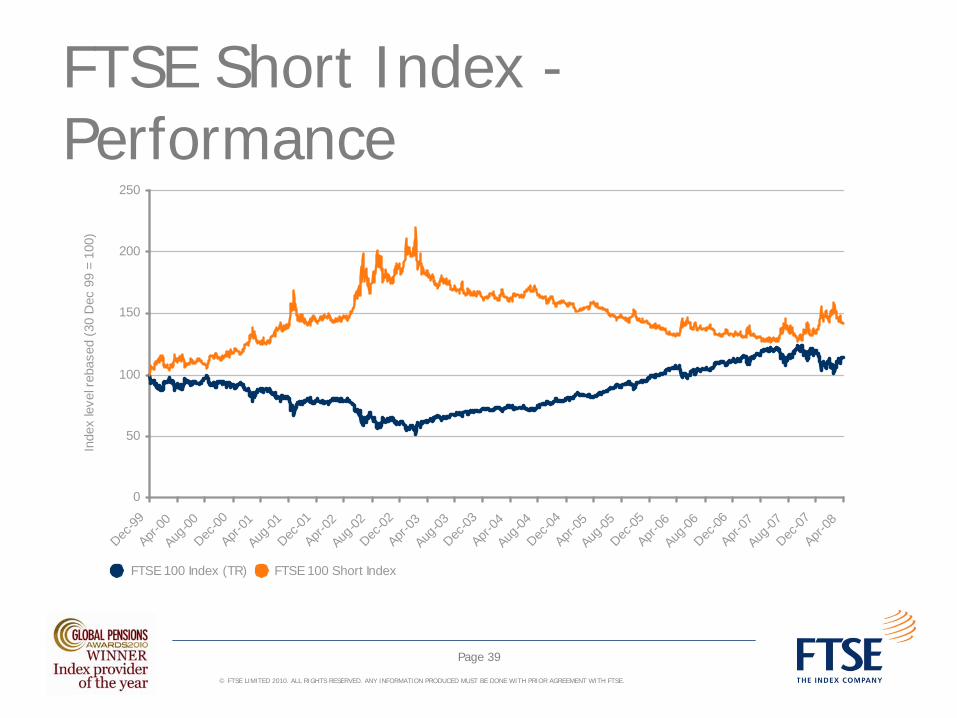
FTSE Short Index - Performance
0
50
100
150
200
250
Dec-99
Apr-00
Aug-00
Dec-00
Apr-01
Aug-01
Dec-01
Apr-02
Aug-02
Dec-02
Apr-03
Aug-03
Dec-03
Apr-04
Aug-04
Dec-04
Apr-05
Aug-05
Dec-05
Apr-06
Aug-06
Dec-06
Apr-07
Aug-07
Dec-07
Apr-08
Inde
x le
vel r
ebas
ed (3
0 D
ec 9
9 =
100)
FTSE 100 Index (TR) FTSE 100 Short Index
© FTSE LIMITED 2010. ALL RIGHTS RESERVED. ANY INFORMATION PRODUCED MUST BE DONE WITH PRIOR AGREEMENT WITH FTSE.
Page 40
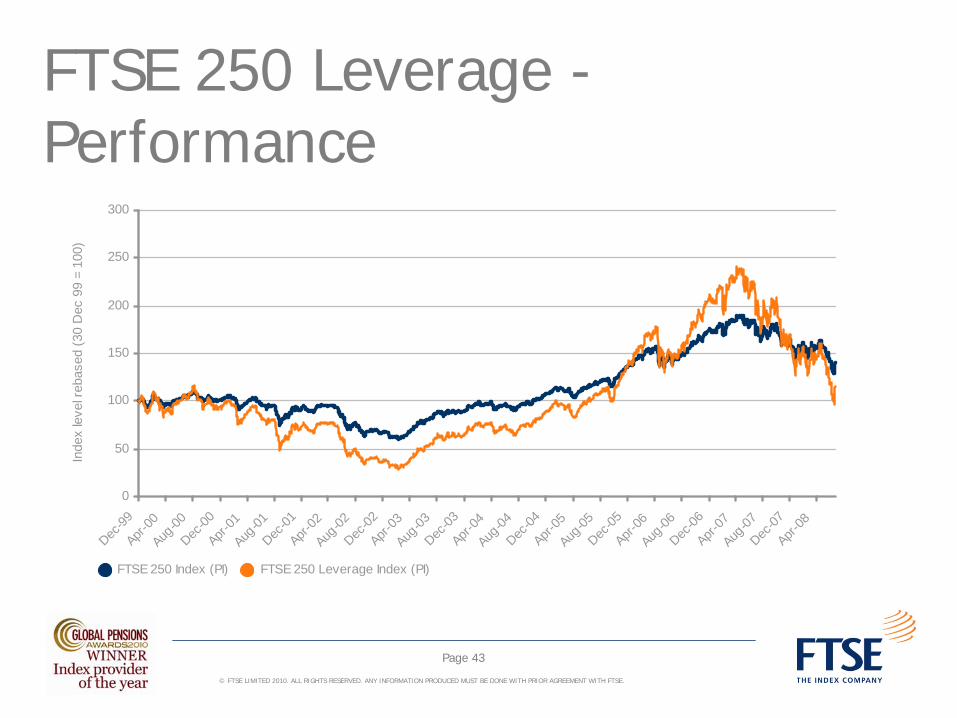
FTSE Leveraged Indices• What are they?
• Index that replicates the performance of an investor leveraging the performance of the underlying index
• How does it work?• Borrow n times money at the risk free rate to gear up n times
into the index portfolio• Investor is bullish but can’t use futures but would buy ETFs• Leverage factors of 2, 3 or 4 times• Large potential returns but higher downside risk because of
gearing

© FTSE LIMITED 2010. ALL RIGHTS RESERVED. ANY INFORMATION PRODUCED MUST BE DONE WITH PRIOR AGREEMENT WITH FTSE.
Page 41
FTSE Leveraged Indices• Outcomes
• If the market goes up your leveraged index rises geared times the change from your leveraged position less the cost of financing those leveraged positions
• If the market goes down your leveraged index falls geared times the change from your leveraged position plus the cost of financing those leveraged positions
© FTSE LIMITED 2010. ALL RIGHTS RESERVED. ANY INFORMATION PRODUCED MUST BE DONE WITH PRIOR AGREEMENT WITH FTSE.
Page 42
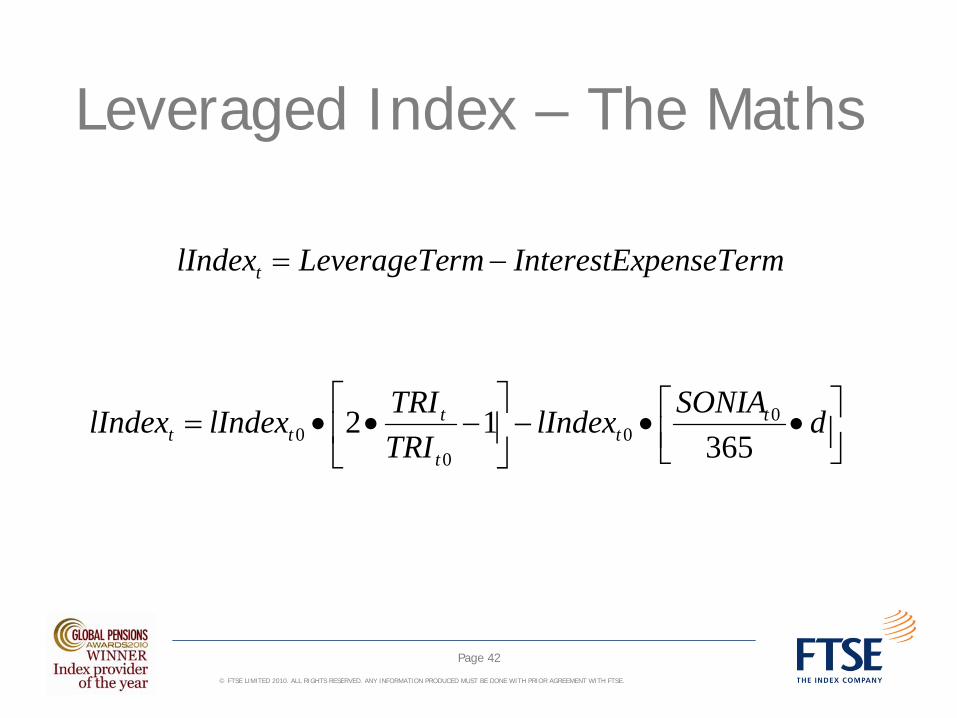
Leveraged Index – The Maths
penseTermInterestExrmLeverageTelIndext −=
⎥⎦⎤
⎢⎣⎡ ••−⎥
⎦
⎤⎢⎣
⎡−••= dSONIAlIndex
TRITRIlIndexlIndex t
tt
ttt 365
12 00
00
© FTSE LIMITED 2010. ALL RIGHTS RESERVED. ANY INFORMATION PRODUCED MUST BE DONE WITH PRIOR AGREEMENT WITH FTSE.
Page 43
FTSE 250 Leverage - Performance
0
50
100
150
200
250
300
Dec-99
Apr-00
Aug-00
Dec-00
Apr-01
Aug-01
Dec-01
Apr-02
Aug-02
Dec-02
Apr-03
Aug-03
Dec-03
Apr-04
Aug-04
Dec-04
Apr-05
Aug-05
Dec-05
Apr-06
Aug-06
Dec-06
Apr-07
Aug-07
Dec-07
Apr-08
Inde
x le
vel r
ebas
ed (3
0 D
ec 9
9 =
100)
FTSE 250 Index (PI) FTSE 250 Leverage Index (PI)
© FTSE LIMITED 2010. ALL RIGHTS RESERVED. ANY INFORMATION PRODUCED MUST BE DONE WITH PRIOR AGREEMENT WITH FTSE.
The Best Way to Invest in Equities….
“Most investors, both institutional and individual, will find that the best way to own common stocks … is through an index fund that charges minimal fees. Those following this path are sure to beat the net results (after fees and expenses) of the great majority of investment professionals.”
Warren Buffet – Berkshire Hathaway Annual Report, 1996
Page 44
Paul HoffDirector, Asia Pacific Business DevelopmentFTSE Group
Phone: +81 3 3581 2811Email: [email protected]
Contact Details
© FTSE LIMITED 2010. ALL RIGHTS RESERVED. ANY INFORMATION PRODUCED MUST BE DONE WITH PRIOR AGREEMENT WITH FTSE.
DISCLAIMER
The information and opinions contained in this document which has been prepared by FTSE is not intended to provide any advice and should not be relied on or treated as a substitute for specific advice. All information is provided for information purposes only. This document does not constitute an offer or form part of an invitation to buy or sell or a solicitation in relation to any financial product or strategy. No reliance may be placed for any purposes whatsoever in the information contained in this document or its completeness. No representation or warranty is given by FTSE or its partners, any of its directors, officers or employees as to the accuracy or completeness of the information or opinions contained in this document and no liability is accepted for any such information or opinions. Whilst every effort is made to ensure that all information given by FTSE in this publication is accurate, no responsibility or liability can be accepted by FTSE and/or its relevant partners for any errors or for any loss arising from use of this publication. This document and its contents may not be reproduced, redistributed, stored in retrieval system, or passed on, directly or indirectly, to any other person or published, or transmitted by any other form or means whether electronic, mechanical, photocopying, recording or otherwise in whole or in part, for any purpose without the prior written consent of FTSE.
Page 47


![Introduction - QUANTITATIVE RESEARCH AND TRADINGjonathankinlay.com › wp-content › uploads › Canonical...ETFs = TemporalData[ETFs] DateListPlot[ETFs] TemporalData 2008 2010 2012](https://img.dokumen.tips/doc/110x75/60be3b7b4d2c2d25820ec04a/introduction-quantitative-research-and-t-a-wp-content-a-uploads-a-canonical.jpg)