Embed Size (px)
Citation preview

Q2 2014 results
July 31, 2014
FORENOTE
All 2013 data are restated for comparison purposes for the Group’s application of IFRS 11 effective January 1st 2014.
Furthermore, Solvay presents Adjusted Income Statement performance indicators that exclude non-cash Purchase Price Allocation (PPA) accounting impacts related to the Rhodia acquisition.

Strong set of results • REBITDA
+10% YoY • Margin
+140bp to 18.4%
31/07/2014
Q2 2014 results 2
Sustained Earnings growth momentum
Solid demand dynamics Particularly at innovation-driven Growth engines Strong Chemlogics contribution
Strong operating leverage offset forex headwinds and CER phase out
Excellence programs momentum continued Sustained pricing power Fixed cost inflation offset
All operating segments contributing to profit expansion

Organic volume growth, despite CER phase-out Strong Chemlogics contribution Stable pricing Forex headwinds
Lower non-recurring costs Debt optimization led to lower cost of carry but
offset by one-off HSE discounting charges Impairment related to Inovyn™ € (422) m
(mainly non-cash)
Solid demand dynamics further strengthened by excellence momentum Sustained pricing power Inflation of fixed costs offset
Forex headwinds
In line with seasonal patterns
31/07/2014
Q2 2014 results 3
Strong set of results
+10% yoy
+2% yoy
€ (292) m Net Income Adjusted, Group share
€ 148 m in 2013
€ 89 m FCF
€ 2.6 bn Net Sales
€ 485 m REBITDA
+40% yoy
Q2 2014 financial highlights

• Sold to OpenGate in June 2014
• Conditional approval received from EU anti-trust authorities
• Binding deal reached with JV partner Ineos • Simplified terms • Large part of targeted cash proceeds secured
upfront • Exit after 3 years
• JV creation expected by YE 2014
• Awaiting approval from Brazilian anti-trust authorities before YE 2014
• Sulphuric acid virgin production and regeneration business in US
• Binding agreement reached with CCMP Capital
• EV of US$ 890 m • EV/EBITDA* just over 8.0x
31/07/2014
Q2 2014 results 4
Strategic portfolio management pursued Initiated divestitures nearing completion
Chlorovinyls exit Eco Services exit Inovyn™ JV creation by YE 2014
Indupa sale to Braskem progressing
Sale to CCMP Capital
Redeployment for Value
Benvic sale closed
* LTM as of June 2014

17.0% margin
18.4% margin
Q2 2013
Scope
Volume Conversion forex
Price Variable costs
Fixed costs
Others (including
equity earnings)
Q2 2014
440
24 19 (16)
(4) 9 5 9 485
Net pricing € 4 m
10%
31/07/2014
Q2 2014 results 5
Demand and excellence momentum underpinning solid REBITDA growth despite headwinds
Operating results underpinned by demand and Excellence programs • Sustained pricing power • Inflation of fixed costs offset
Organic volume growth despite CER phase-out. Sales of € 44 m in Q2 2013
REBITDA margin increased by 140 bp
Forex headwinds primarily from USD, BRL, THB, CNY and JPY
REBITDA in € m
Net Sales in € m
Q2 2013
Scope
Volume Conversion forex
Price
Q2 2014
2,582
81
84 (101)
(4) 2,640
2%
Strong Chemlogics contribution

Record performance underpinned by innova-tion-driven volume growth and operational efficiency
Strong Chemlogics and volume growth largely offset forex and weak
performance in Coatis
Pricing power and volume growth offset by fixed cost inflation and forex
Improved demand and strong manufacturing
excellence program delivery
31/07/2014
Q2 2014 results 6
Broad performance delivery across businesses
Advanced Formulations
Performance Chemicals
Advanced Materials
Functional Polymers
* Excluding Corporate & Business Services
in € m
92 119
Q2 2013 Q2 2014
29% 161
187
Q2 2013 Q2 2014
16%
191 189
Q2 2013 Q2 2014
-1%
27 38
Q2 2013 Q2 2014
40%
22% 35%
36%
7%
REBITDA Q2 2014*

31/07/2014
Q2 2014 results 7
Result form continued operations increased by 31%
* Adjusted: Excluding non-cash PPA accounting impacts related to the Rhodia acquisition
Other elements • € 13 m impact of Ruble evaluation on debt Rusvinyl
• € (2) m holdback payments at Chemlogics
Non-recurring costs • Restructuring costs of € (13) m, significantly down on Q2 2013
Net financial charges • Net debt charges fell € (11) m thanks to debt optimization
• Discounting costs for environmental provisions up € (30) m as rates down 50 bp in Eurozone, compared to upward move in Q2 2013 in Nafta and Mercosur.
Income taxes • Nominal tax rate of 33% (34% underlying)
• Taxes Q2 2013 at low level due to non-recurring elements
Discontinued operations • € (422) m impairment, Solvay share, related to Inovyn™
Adjusted Profit & Loss statement
in € m Q2 2014 Q2 2013
Net sales 2,640 2,582
REBITDA 485 440
Other elements 11 (1)
Depreciation & Amortization (160) (155)
REBIT 337 284
Non-recurring items (46) (97)
EBIT 291 187
Net financial charges (75) (51)
Income taxes (65) (20)
Result from continuing operations 150 115
Result from discontinued operations (481) 48
Net income Solvay share (292) 148

31/07/2014
Q2 2014 results 8
Net debt increase in line with seasonal dividend and interest payment patterns
* Net debt excludes hybrid bonds of € 1.2 bn booked as equity
Net debt* evolution in € m
31/03/2014
REBITDA, provisions
& other operating cash flow
Capex
Change in industrial working capital
FCF of disc ops
Aquisitions & divest-
ments
Net financial charges
Dividends Other
changes in net debt
Changes in net debt
attributable to assets
held for sale
30/06/2014
(1,459) 359
(181) (81) (9) (43)
(158)
(171) 91 8 (1,644)
FCF € 89 m
Working capital uptake in a context of demand dynamics and planned maintenance turn-arounds
Concentration of interest payments in Q2. Includes € (50) m of one-offs related to early HY bond repayment
Payment of dividend balance and 1st hybrid coupon of € (15) m

Target 12.5% - 13.5%
Average 2013 14.6%
Average 2014 15.2%
15.1% 15.6%
14.9%
12.8%
15.0% 15.4%
Q1 2013 Q2 2013 Q3 2013 Q4 2013 Q1 2014 Q2 201410%
11%
12%
13%
14%
15%
16%
31/07/2014
Q2 2014 results 9
Working Capital needs in line with demand dynamics and industrial cycle
Uplift in demand Industrial cycle
Industrial working capital % of gross sales
Historical figures restated for consolidation changes (including IFRS 11)

31/07/2014
Q2 2014 results 10
Selective investments for value
2/3
1/3
€ 700 m – € 800 m
Advanced Formulations
Advanced Materials
Performance Chemicals
Selective investments focused on
superior growth areas
Capex (continuing operations) In € m
Growth engines
Resilient & cyclical businesses
765 ~850
133 166
154 181 158
320
2013 2014 Guidance2014-2016
700-800
Q4
Q3
Q2
Q1 Alkoxylation
HDS Silica
HPPO
Alkoxylation
Bicarbonate
Fluoro-polymers
Specialty surfactants Vanillin
PVC

Large-scale alkoxylation plant in Texas, USA Large-scale alkoxylation plant in Singapore
Specialty Surfactants plant in Germany
Vanillin plant in China
31/07/2014
Q2 2014 results 11
Larger on-going investment projects
Bicarbonate plant in Thailand 100 ktonnes/year
Fluoro-polymers JV with 3F
HDS plant in Poland 85 ktonnes/year
Fluoro-polymers plant in China
HPPO plant in Saudi Arabia 300 ktonnes/year
2014
2015 Expected commissioning
Expected commissioning
PVC plant in Russia (in JV with Sibur) 330 ktonnes/year
Novecare
Specialty Polymers
Silica
Aroma Performance
Specialty Polymers
Peroxide
Soda Ash & Derivatives
Rusvinyl*
* Reported as equity investment
Novecare

Cash & cash
equivalents 1.1
Net debt (1.6)
Major LT debt
(1.8)
Other (1.0)
Equity 5.7
Hybrid bond 1.2
Assets Liabilities Equity
Gross debt (2.8)
Total equity 6.9
Capital structure (30/06/2014) in € bn
31/07/2014
Q2 2014 results 12
A sound and more efficient balance sheet
Strong credit ratios (30/06/2014)
Gearing (Net debt / Equity)
24%
Leverage (Net debt / REBITDA)
0.74x 63% 1.93x Including pension
provisions
Optimising Balance Sheet efficiency in € bn
Repayments in 2014-2015 → € 1.8 bn
Early redemption of high-yield (HY) bonds
⇒ Average interest rate reduced by 40 bp to 4.9%
⇒ Cost of carry halved to € (50) m by 2015
Major LT debt
(2.3)
(0.5)
Major LT debt
(1.8)
(0.5)
HY bonds (0.8)
(0.8)
Other (0.5)
Other (1.0)
(3.6)
(1.3)
(2.8)
(0.5)
Gross debt31/12/2013
Paidin 2014
Gross debt31/06/2013
Payablein 2015

31/07/2014
Q2 2014 results 13
2014 outlook re-iterated
Solvay expects high single-digit REBITDA growth
at current perimeter* & prevailing forex exchange rates
Encouraging H1 underpins confidence
* Reflects eventual restatement in 2013 and 2014 reference periods for the discontinuation of Eco Services

31/07/2014
Q2 2014 results 14
Transformation continues
Asking more from chemistry
• Complete initiated portfolio upgrades
• Grow with our customers
• Sustain focus on excellence
• Deliver profit growth
2014 Priorities

Take-aways
31/07/2014
Q2 2014 results 15
REBITDA to reach € 2.3 – 2.5 bn*
REBITDA margin to reach 18% 2016
CFROI to increase by > 100 bp vs 2013**
2/3 of businesses in value-creation zone
Poised for growth
** Prior to discontinued operations
Inflection point in demand
On track towards
Progress on all fronts
* At constant perimeter

Safe harbour
31/07/2014
Q2 2014 results 16
To the extent that any statements made in this presentation contain information that is not historical, these statements are essentially forward-looking. The achievement of forward-looking statements contained in this presentation is subject to risks and uncertainties because of a number of factors, including general economic factors, interest rate and foreign currency exchange rate fluctuations; changing market conditions, product competition, the nature of product development, impact of acquisitions and divestitures, restructurings, products withdrawals; regulatory approval processes, all-in scenario of R&D projects and other unusual items.
Consequently, actual results may differ materially from those expressed or implied by such forward-looking statements. Forward-looking statements can be identified by the use of words such as "expects," "plans," "will," "believes," "may," "could" "estimates," "intends", "goals", "targets", "objectives", "potential", and other words of similar meaning. Should known or unknown risks or uncertainties materialize, or should our assumptions prove inaccurate, actual results could vary materially from those anticipated. The Company undertakes no obligation to publicly update any forward-looking statements.

Annexes
• Additional Q2 and H1 2014 financial data
• Additional FY 2014 considerations
• 2016 ambitions
• Segment presentation
31/07/2014 Q2 2014 results 17

31/07/2014
Q2 2014 results 18
Balance sheet Q2 Cash flow statement
in € m 30/06/2014 31/12/2013
Fixed assets 9,780 9,732
Investment & shares 825 735 Loans & other non current financial receivables / payables
23 84
Assets held for sale 1,195 1,621 Taxes payable/receivable + Others 89 44
Working capital 1,578 1,259
Total invested capital 13,490 13,475
Equity 6,884 7,453
Provisions 4,018 3,820
Dividends (2) 112
Net financial debt 1,644 1,142 Liabilities related to assets held for sale 946 949
Total financing 13,490 13,475
in € m Q2 2014 Q2 2013
Cash flow from operating activities 293 212
Cash flow from investing activities (289) (163)
Cash flow from financing activities (85) (359)
Net change in cash & cash equivalents (81) (311)
Currency translation differences (1) (46)
Opening cash balance 1,193 1,614
Ending cash balance 1,111 1,258
Free Cash Flow 89 64
From continuing operations 98 10
From discontinued operations (9) 54

31/07/2014
Q2 2014 results 19
H1 Income statement (adjusted)
H1 Cash flow statement
in € m H1 2014 H1 2013
Net sales 5,192 5,098
REBITDA 953 862
Other elements (5) -
Depreciation & Amortization (321) (310)
REBIT 626 552
Non-recurring items (76) (137)
EBIT 551 415
Net financial charges (173) (135)
Income taxes (118) (76)
Result from continuing operations 260 204
Result from discontinued operations (470) 60
Net income Solvay share (186) 235
in € m H1 2014 H1 2013
Cash flow from operating activities 390 357
Cash flow from investing activities (511) (332)
Cash flow from financing activities (738) (526)
Net change in cash & cash equivalents (859) (501)
Currency translation differences (3) (28)
Opening cash balance 1,972 1,787
Ending cash balance 1,111 1,258
Free Cash Flow (8) 53
From continuing operations (61) (122)
From discontinued operations 53 175

31/07/2014
Q2 2014 results 20
Demand and excellence momentum underpinning REBITDA growth
REBITDA in € m
Net Sales in € m
H1 2013
Scope Volume Conversion
forex Price
H1 2014
5,098 176
149 (209) (22) 5,192
2%
H1 2013
Scope
Volume Conversion
forex Price Variable costs
Fixed costs
Others (including
equity earnings)
H1 2014
862
52
56 (31) (22) 31 - 6 953
Net pricing € 9 m
11%
16.9% margin
18.3% margin
Operating results underpinned by demand and Excellence programs • Sustained pricing power • Inflation of fixed costs offset
Organic volume growth despite CER phase-out. Sales of € 58 m in H1 2013
REBITDA margin increased by 140 bp
Forex headwinds primarily from USD, BRL, THB, CNY and JPY
Strong Chemlogics contribution

31/07/2014
Q2 2014 results 21
Net debt increase in line with seasonal patterns
* Net debt excludes hybrid bonds of € 1.2 bn booked as equity
Net debt* evolution in € m
31/12/2013
REBITDA, provisions
& other operating cash flow
Capex
Change in industrial working capital
FCF of disc ops
Aquisitions & divest-
ments
Net financial charges
Dividends
Other changes
in net debt
Changes in net debt
attributable to assets
held for sale
30/06/2014
(1,141) 625
(347)
(338) 53 (46)
(211)
(282) 51 (5) (1,644)
FCF € (8) m
Working capital uptake in a context of demand dynamics and planned maintenance turn-arounds
Concentration of interest payments in H1. Includes € (50) m of one-offs related to early HY bond repayment
Payment of dividend balance and 1st hybrid coupon of € (15) m

Pension assets
2.0
Pension liabilities
(4.7)
Net pension liabilities
(2.7)
Assets Liabilities
68%
6% 16% 7%
3%
France & Germany (unfunded)
Belgium
United kingdom North America
Other countries
Net pension liability denominated for 76% in EUR
Discount rates* decreased
Pension assets of € 2,022 m by 30/06/2014 • 50% Equities / Diversified alternative funds
• 50% Bonds / Real estate
Cash contribution in H1 2014 of € (86) m, vs € (81) m in H1 2013
31/12/2013 30/06/2014 change
EUR 3.25% 2.75% -0.50%
GBP 4.50% 4.25% -0.25%
USD 4.75% 4.25% -0.50%
Weighted average
3.88% 3.50% -0.38%
31/07/2014
Q2 2014 results 22
Lower rates led to slight pension liability increase
Net pension liabilities (30/06/2014) in € bn
Pensions (30/06/2014) in € bn
All presented figures are for continued operations only
(2.7)
* Average discount rate on post employment benefit related liabilities applicable to high quality corporate bonds in EUR, GBP and USD zones

Annexes
• Additional Q2 and H1 2014 financial data
• Additional FY 2014 considerations
• 2016 ambitions
• Segment presentation
31/07/2014 Q2 2014 results 23

FY YoY impact expected of € (60) – (65) m at prevailing rates
H1 YoY impact of € (53) m
More than half conversion, rest transactional
Mainly linked to USD, JPY and BRL
31/07/2014
Q2 2014 results 24
REBIT(DA) considerations for 2014
Forex impact
CERs (Carbon Emission Rights)
Rusvinyl ramp-up
Chemlogics effects
PVC JV in Russia
Pre-operational charges linked to impact on JV debt of ruble/euro fluctuation with H1 impact of € 2 m
Planned commissioning and subsequent ramp-up in H2
Scheme phased out in H1 2013
FY YoY sales impact of €(58)m, taken in H1
Acquisition consolidated since 01/11/2013
H1 PPA inventory impact + holdback payments for € (7) m
Going forward only holdback payments of ~ € (2) m per quarter until 2016
Eco Services
Sale closing expected before YE 2014
31/07/2014
Q2 2014 results 25
Financials considerations for 2014
Debt repayments € 1,300 m in H1 2014 (including HY bonds) € 500 m in June 2015
Lead to a reduction of net interest charges Average gross interest rate to reduce by 40 bp to
4.9% vs 2013 Cost of carry to halve FY P&L cost expected at ~ € 140 m
Nominal value of € 1.2 bn Initial average dividend yield
of 4.7% € 0.7 bn at 4.199% € 0.5 bn at 5.425%
Recurring FY cost of € (120) – (130) m, provided no change in discount rates* during year
Additional one-off charges in H1 of € (29) m from impact of discount rates decrease on environmental provisions
* Average discount rate on environmental provisions based on 10-year government bonds in EUR, GBP, USD and BRL zones
Dividend cash-out Q2 2014: € (15) m Q4 2014: € (27) m Q2 2015: € (29) m Q4 2015: € (27) m …
Accounting considerations Income statement No impact
Balance sheet Treated under Equity
Cash flow statement Dividends treated in CF from financing
Cost of net indebtedness Discounting cost on provisions
Hybrid bond

31/07/2014
Q2 2014 results 26
Other considerations for 2014
Recurring Depreciation & Amortization H1 cost of € (321) m
FY cost expected of ~ € (650) m
Rhodia PPA impact H1 impact of € 58 m
FY impact expected of ~ € 115 m
Restructuring costs HSE provisions on non-operational sites Portfolio management-related gains & losses Contingencies / litigations
Progressing from mid to low 30s over 2014-2016
Underlying tax rate excludes non-recurring elements
Expected to reach completion in 2014 Indupa sale to generate ~ € (60) m* currency
translation adjustments at deal closing Chlorovinyls JV with Ineos will be treated as
recurring equity investment upon JV effectiveness
* Situation as of 30/06/2014
Depreciation & amortization
Underlying tax rates Non-recurring elements
Discontinued operations

Annexes
• Additional Q2 and H1 2014 financial data
• Additional FY 2014 considerations
• 2016 ambitions
• Segment presentation
31/07/2014 Q2 2014 results 27

31/07/2014
Q2 2014 results 28
Solvay, a major global chemical player
€ 10.0 bn Net Sales
€ 1.7 bn REBITDA
17% REBITDA margin
€ 378 m Adjusted Net Income, Group share
Based on strengths 117 Industrial sites
15 Major R&I centers
29,400 Employees (EFTEs)
56 Country presence
And with ambition
Well-balanced geographical spread and end-user markets
Leading player in 90% of our businesses
Strong R&I portfolio
Non-financial figures exclude discontinued operations,
except for employees
Restated for IFRS 11 application as from 01/01/2014 Adjusted: Excluding non-cash PPA accounting impacts related to the Rhodia acquisition
2013 figures

31/07/2014
Q2 2014 results 29
Well-balanced geographical spread and end-user markets
Aeronautics & Automotive
17% Consumer Goods & Healthcare
25% Agro Food
12% Energy & Environment
11% Building & Construction
10% Electrical & Electronics
6% Industrial Applications
19%
Balanced geographic exposure*
North America
25%
Europe
33%
Latin America
11%
Asia Pacific & RoW
31%
Exposure to higher growth end-markets*
* Figures represent % of 2013 net sales (pro-forma Chemlogics)

31/07/2014
Q2 2014 results 30
90% of our business ranking among top 3 players
1 Phosphorus
chemistry
Diphenols
Specialty surfactants
ADVANCED FORMULATIONS
High-performance engineering
polymers & compounds
ADVANCED MATERIALS
Bicarbonate
Soda ash
Hydrogen peroxide
PERFORMANCE CHEMICALS
High-barrier polymers
Fluorinated polymers
High-dispersible silica
Rare earth formulations
FUNCTIONAL POLYMERS
PA 6.6 polymers & intermediates
PA 6.6 engineering plastics
3 PERFORMANCE CHEMICALS
Cellulose acetate fiber

31/07/2014
Q2 2014 results 31
Strong innovation portfolio aligned with global megatrends
Renewable chemistry
Climate change
Resource scarcity
Next billion consumers
Sustainable energy Organic
electronics
Eco- processes
Advanced formulations
Advanced materials
Health & well being
Focused innovation fields 2013
Major R&I sites worldwide 15
1,950
€ 280 m
22%
252
R&I staff
R&I efforts
New sales ratio
Patents filed
31/07/2014
Q2 2014 results 32
Converting vision into value
Our strategy Our 2016 ambition
REBITDA to reach € 2.3 – 2.5 bn*
CFROI to increase by >100 bp vs 2013**
2/3rd of businesses in value-creation zone
Being a model of sustainability
REBITDA margin to reach 18%
Reducing our impact on environment
Our vision
• Reinforcing business profile through strategic portfolio changes
• Striving for excellence across businesses
• Innovating to create sustainable solutions
• Transforming company culture with a focus on performance
• Build a strong global leader in the chemical industry
• Be a model of sustainable chemistry
• Become a high growth, less capital intensive & high return Group
* At constant perimeter ** Prior to discontinued operations

31/07/2014
Q2 2014 results 33
A business portfolio change
INTEGRATION
Executing our strategic action plan
Pharma divestiture 2010
Rhodia acquisition 2011
Integration & definition of new strategic priorities
2012
Alignment of corporate & business structure
Renew management And people model
TRANSFORMATION
2013
Chlorovinyls Europe JV announcement
Solvay Indupa divestiture
Chemlogics acquisition
LAUNCHING EXCELLENCE INITIATIVES
Soda Ash breakthrough performance improvement plan
Polyamide breakthrough performance improvement plan
To enhance our business profile
Solvay businesses
Chemlogics
GROW
ENHANCE
EXIT
RESTORE
Value creation potential of industry segment
Sol
vay’
s ab
ility
to
ext
ract
val
ue
Solvay YE 2013
Solvay YE 2012
Chemical industry

2013*
Chemlogics (10 months)
(0.3) 0.3
0.3
0.3
2016e**
1.7
2.3 – 2.5
(in € m)
31/07/2014
Q2 2014 results 34
REBITDA growth
REBITDA in € bn
supported by strong operational levers
REBITDA margin 17%
REBITDA margin 18%
Commercial Excellence
Overall Equipment Efficiency
Variable & fixed cost reductions
Purchasing, supply & other
efficiencies
Innovation Excellence
Manufacturing Excellence 0.3
Excellence programs
0.7
Market growth
> 10% CAGR
Portfolio Inflation Innovation Organic growth
Operational excellence
* Restated for IFRS 11 application as from 01/01/2014 Chemlogics consolidated for 2 months ** At constant perimeter
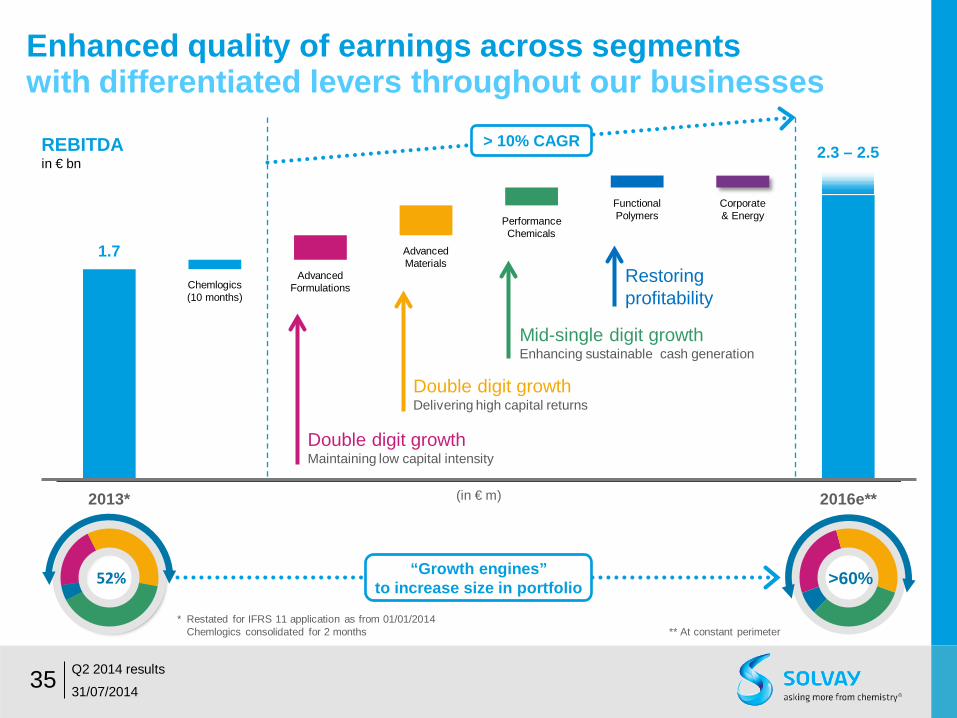
2013*
Chemlogics (10 months)
Advanced Formulations
Advanced Materials
Performance Chemicals
Functional Polymers
Corporate & Energy
2016e**
1.7
2.3 – 2.5
(in € m)
52%
31/07/2014
Q2 2014 results 35
Enhanced quality of earnings across segments
Double digit growth Delivering high capital returns
Double digit growth Maintaining low capital intensity
Mid-single digit growth Enhancing sustainable cash generation
Restoring profitability
REBITDA in € bn
with differentiated levers throughout our businesses
>60% “Growth engines” to increase size in portfolio
> 10% CAGR
* Restated for IFRS 11 application as from 01/01/2014 Chemlogics consolidated for 2 months ** At constant perimeter

31/07/2014
Q2 2014 results 36
Unlocking value by increasing CFROI and REBITDA margin
Bubble Size indicates REBITDA (in € bn) Premium return = WACC + 150bp
0%
10%
20%
30%
0% 6% 12% 18%
WACC Premium return
1/3rd of total assets
REBI
TDA
mar
gin
CFROI
0%
10%
20%
30%
0% 6% 12% 18%
2/3rd of total assets
WACC Premium return
REBI
TDA
mar
gin
CFROI
GBUs Solvay
2012 2016
REBITDA – Rec. Capex –Tax Gross assets + Working Capital CFROI =
CFROI to increase by
100bp
REBITDA margin to reach
18%

31/07/2014
Q2 2014 results 37
Focused on being a model of sustainability taking commitments
Investors
Communities
Employees
Suppliers
Planet
Customers
Energy consumption Greenhouse gas emissions Groundwater consumption Air emission*
Water emissions**
Sustainable water management***
Reach excellence in safety & health
Deploy unmatched sustainable portfolio management
Reduce our impact on environment by 2020
Providing sustainable solutions
Manage risk
Develop rich & balanced social dialogue

31/07/2014
Q2 2014 results 38
Executing a clear value creation strategy
Towards a higher growth, improved cash generation & enhanced returns Chemical Group
Targeting Sustainable Value Growth

Annexes
• Additional Q2 and H1 2014 financial data
• Additional FY 2014 considerations
• 2016 ambitions
• Segment presentation
31/07/2014 Q2 2014 results 39

31/07/2014
Q2 2014 results 40
Organization set-up
Advanced Formulations
Advanced Materials
Performance Chemicals
Functional Polymers
Corporate & Business
Services
Strategic priorities
REBITDA growth +++ +++ + +
REBITDA margin ++ +++ +++ + Capital
intensity + ++ +++ +++ R&D drive ++ +++ + +
Growth engines
Resilient cash flow generation
Restoring profitability
Efficient Support
Strengthened
Customer-centric Empowered Entrepreneurial Result-oriented
Executive Committee

31/07/2014
Q2 2014 results 41
Organized in Global Business Units
Soda Ash & Derivatives
Aroma Performance
Novecare
Silica
Rare Earth Systems
Specialty Polymers
Acetow
Eco-Services**
Peroxide P&I
Engineering Plastics
Polyamide Solvay Energy Services
Adva
nced
Mate
rials
Perfo
rman
ce C
hemi
cals
Func
tiona
l Poly
mers
Corp
orate
& B
usine
ss S
ervic
es
Adva
nced
For
mulat
ions
2013*
Coatis
Special Chemicals
Emerging Biochemicals
Fibras
Corporate Functions
* Restated for IFRS 11 application as from 01/01/2014
REBITDA € 369 m € 646 m € 766 m € 93 m € (169) m
REBITDA margin 15% 25% 24% 5% n.m.
REBITDA € 221 m € 362 m € 377 m € 78 m € (85) m
REBITDA margin 16% 27% 24% 9% n.m.
2014 H1
** To be exited by YE 2014

€ 2,432 m Net Sales
31/07/2014
Q2 2014 results 42
Advanced Formulations
As one of Solvay’s growth engines, the businesses grouped under Advanced Formulations stand out for their innovation capacity and low capital intensity. Their offerings address major societal trends, meeting ever stricter requirements to respect the environment, save energy and challenges of the mass consumer markets.
2013 Figures
€ 369 m REBITDA
Coatis Aroma Performance
65%
20% 15%
Novecare
Coatis
Aroma Performance
21%
28% 21%
30% Europe
Asia, Pacific & RoW
Latin America
North America
Net sales by region
Net sales by GBU
Novecare

31/07/2014
Q2 2014 results 43
Advanced Formulations 2014 Q2 performance Strong Chemlogics and volume growth largely offset forex and weak performance in Coatis
Novecare • Good dynamics in Oil & Gas market through customer
recognition of Solvay’s product portfolio and capabilities
• Chemlogics ramping up business and at record profitability
• Agro market suffered from short season in US
• Growth in HPC market offset by lower prices
• Forex impact weighs on yoy comparison
Coatis • Uncompetitive domestic LatAm market weighed on
performance
• Excellence measures mitigated increased cost level
Aroma Performance • Positive market trends overall in Aroma ingredients and
Inhibitors
• Gradual recovery from Force Majeure (in Q1)
92 119
Q2 2013 Q2 2014
in € m
margin 15% 16%
71%
17% 12% Novecare
Coatis
Aroma Performance
Net sales Net sales H1 2014
€ 1,388 m 15% yoy
Q2 2014
€ 725 m 21% yoy
REBITDA H1 2014
€ 221 m 8% yoy
Q2 2014
€ 119 m 29% yoy
Q2 2014

31/07/2014
Q2 2014 results 44
Novecare Cutting-edge technologies in diversified focused markets
SURFACTANTS
POLYMERS
PHOSPHOROUS DERIVATIVES
SPECIALTY AMINES
TECHNOLOGY
SELECTED MARKETS
50%
10%
10%
30%
% of Novecare sales in 2013 (pro forma Chemlogics)
Agro Industrial Home & Personal Care Coatings Oil & Gas

31/07/2014
Q2 2014 results 45
Advanced Materials
A leader in markets with high entry barriers and strong returns on investment, the Advanced Materials segment is a major contributor to the Group’s performance and growth. Innovation, its global presence feature and long-term partnerships with customers provide a compelling competitive edge with industries seeking increasingly energy efficiency and less polluting functionalities.
Specialty Polymers Silica
Rare Earth Systems
Special Chemicals
50%
16%
12% 22%
Specialty Polymers
Silica
Rare Earth Systems
Special Chemicals
39%
32%
5%
24% Europe
Asia, Pacific & RoW
Latin America
North America
€ 2,551 m Net Sales
2013 Figures
€ 646 m REBITDA
Net sales by region
Net sales by GBU

31/07/2014
Q2 2014 results 46
Advanced Materials 2014 Q2 performance Record performance beat underpinned by innovation-driven volume growth and operational efficiency
Specialty Polymers • Volume growth across all regions and most end markets
• Demand momentum in Automotive, Industrial and Electrical & Electronics markets continued
• New product launch boosted Smart devices market
Silica • Strong demand in Europe (both OEM and replacement)
Rare Earth Systems • Volumes and margins underpinned by new regulation in
catalyst business
Special Chemicals • Good business trends in most end-markets,
esp. automotive and (micro-)electronics
• Margin improvement thanks to business portfolio refocus
54%
17% 9%
20% Specialty PolymersSilicaRare Earth SystemsSpecial Chemicals
Q2 2014
161 187
Q2 2013 Q2 2014
in € m
margin 24% 28%
Net sales
REBITDA
Net sales H1 2014
€ 1,329 m 2% yoy
Q2 2014
€ 670 m 2% yoy
H1 2014
€ 362 m 15% yoy
Q2 2014
€ 187 m 16% yoy

31/07/2014
Q2 2014 results 47
Specialty Polymers Focused on the most advanced products
Temperature resistance Chemical inertness Weathering resistance Corrosion protection Water repellence Stain repellence Electrical inertness Non-flammability Fatigue resistance Biocompatibility Extractables Self-cleaning Transparency Heat transfer Processability Toughness Elasticity Barrier Tribology Release Colour Cost
Perf
orm
ance
Aromatics
Fluoropolymers
Pric
e
Built on 4 technology clusters
Cross-linkable compounds
High-barrier polymers

31/07/2014
Q2 2014 results 48
Specialty Polymers Industry leader with the broadest product portfolio
Broadest portfolio + Innovation leader = Best solution provider
Fluoropolymers
LCP HPPA PEEK PAI PSU PTFE PVDF PFA FKM PFPE PVDC XLCP
Cross-linkable
com-pounds
High-barrier polymers Aromatics

Silica Highly Dispersible Silica (HDS) delivers value to the tire industry
31/07/2014
Q2 2014 results 49
Enables a 5-7% improvement in efficiency
Carbon-Black w/o silica
with HDS
Rolling Resistance + 25%
Wet Grip + 10%
Wear no
change
70
110
120
90
80
100
125 In passenger car and light trucks • Energy-efficient tires
• Winter tires
• Sport tires
HDS, a significant enabler of performance, a minor portion of overall tire production cost (<3%)
Source: Smithers Rapra, Solvay estimates
Excellent technical performance … … growing across a number of applications
In heavy trucks • Commercial emergence of tires using
a majority of silica vs. carbon black

€ 3,189 m Net Sales
31/07/2014
Q2 2014 results 50
Performance Chemicals
Operating on mature resilient markets, this Segment’s success is based on economies of scale, competitiveness and quality of service. Solidly cash-generating, the Performance Chemicals businesses are engaged in new programs of excellence to create additional sustainable value.
Soda Ash & Derivatives Peroxides Acetow
Eco Services**
Emerging Bio-chemicals
34%
36%
7%
23% Europe
Asia, Pacific & RoW
Latin America
North America
Net sales by region
* Restated for IFRS 11 application as from 01/01/2014
53%
18%
26% 11%
17%
Soda Ash
Peroxides
Acetow
Eco-Services
Emerging Biochemicals
Net sales by GBU
2013 Figures*
€ 766 m REBITDA
** To be exited by YE 2014

31/07/2014
Q2 2014 results 51
Performance Chemicals 2014 Q2 performance Pricing power and volume growth offset by fixed cost inflation and forex
Soda Ash & Derivatives • Demand up in Europe and export market up
• US production affected by logistics disruption
• Prices up overall
• Adverse yoy effect from lower USD
Peroxide • Rising demand for peroxide in EU and US
• Fixed costs level up due to prolonged maintenance
Acetow • Higher sales prices and strong industrial performance
Eco Services • Volume growth offset by forex
Emerging Biochemicals • Tough conditions persist and heavy impact from lower
Thai Baht
42%
15%
21% 9%
12%
Soda Ash & DerivativesPeroxideAcetowEco ServicesEmerging Biochemicals
Q2 2014
191 189
Q2 2013 Q2 2014
in € m
margin 24% 24%
Net sales
REBITDA
Net sales H1 2014
€ 1,580 m 0% yoy
Q2 2014
€ 798 m (1)% yoy
H1 2014
€ 377 m 6% yoy
Q2 2014
€ 189 m (1)% yoy

Soda Ash & Derivatives Cost is a key success factor in the soda ash industry
31/07/2014
Q2 2014 results 52
Source, Solvay based on external databases
Afri
ca
Production costs
Chi
na
Freight & logistics costs
Turk
ey
Soda ash plants
Average FOB cash cost
Natural process
EU 1st tier India
CIS Baltics
North East Asia (“Solvay” and “Hou” processes)
Synthetic process
EU 2nd tier US “Green River”

Soda Ash & Derivatives European soda ash supply/demand to improve in next 3 years
31/07/2014
Q2 2014 results 53
Restructuration started with closure announcements
Solvay Povoa (0.2 mt/yr)
Tata Winnington (0.5 mt/yr)
Production capacity utilization rate to increase
Following restructuring at the supply side
Following slight expected growth in demand
Kazan project
Potentially adding 2.5 mt/yr production capacity
Based on natural production process
Cash cost expected at same level as best-in-class European synthetic assets
Further restructuring among least competitive assets in the European industry can be expected
2014-2016 2017-2019

31/07/2014
Q2 2014 results 54
Functional Polymers
The key success factors of this Segment, which primarily groups the Polyamide activities, are continuous manufacturing optimization and innovation. Solvay is one of the few players to operate across the entire polyamide 6-6 chain.
Polyamides & Intermediates Fibras
Engineering Plastics
PVC Compounds
88%
12%
Polyamide
Chlorovinyls
50%
29%
16% 6% Europe
Asia, Pacific & RoW
Latin America
North America
€ 1,763 m Net Sales
2013 Figures
€ 93 m REBITDA
Net sales by region
Net sales by GBU
31/07/2014
Q2 2014 results
55
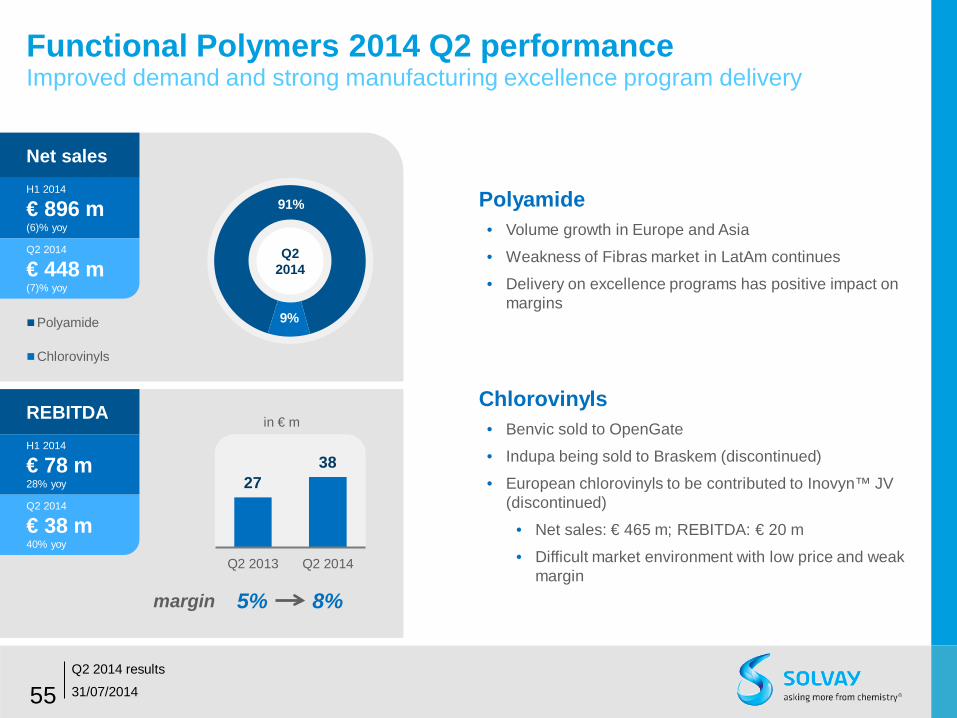
Functional Polymers 2014 Q2 performance Improved demand and strong manufacturing excellence program delivery
Polyamide • Volume growth in Europe and Asia
• Weakness of Fibras market in LatAm continues
• Delivery on excellence programs has positive impact on margins
Chlorovinyls • Benvic sold to OpenGate
• Indupa being sold to Braskem (discontinued)
• European chlorovinyls to be contributed to Inovyn™ JV (discontinued)
• Net sales: € 465 m; REBITDA: € 20 m
• Difficult market environment with low price and weak margin
91%
9% Polyamide
Chlorovinyls
Q2 2014
27 38
Q2 2013 Q2 2014
in € m
margin 5% 8%
Net sales
REBITDA
Net sales H1 2014
€ 896 m (6)% yoy
Q2 2014
€ 448 m (7)% yoy
H1 2014
€ 78 m 28% yoy
Q2 2014
€ 38 m 40% yoy

H1 2014
€ (85) m (12)% yoy
REBITDA
31/07/2014
Q2 2014 results
56
Corporate & Business Services
Energy Services • No material REBITDA contribution • CER phase-out in H1 2013 affecting comparables
Other Corporate & Business Services • Tight cost control on corporate structure and functions • Phasing of certain corporate programs • Positive forex impact
This Segment includes the Solvay Energy Services business which delivers energy optimization programs in the Group and for third parties. It also includes the corporate functions.
Energy Services Other Corporate & Business Services
2014 Q2 performance Tight cost control partially offset phased-out CER sales
€ 67 m Net Sales
2013 Figures
€ (169) m REBITDA
Q2 2014
€ (47) m (53)% yoy
(30) (47)
Q2 2013 Q2 2014
in € m

www.solvay.com