Embed Size (px)
Citation preview

Q 1 2 0 2 1
SHAREHOLDER LET TER

P E L O T O N Q 1 : 2 0 2 1 | 2
P E L O T O N I N T E R A C T I V E , I N C .
FIRST QUARTER F Y 2021 HIGHLIGHTSAll financial comparisons are on a year-over-year basis unless otherwise noted.
• Q1 ending Connected Fitness Subscriptions grew 137% to over 1.33 million and paid Digital Subscriptions grew 382% to over 510,000; total Members grew to over 3.6 million
• Q1 total revenue grew 232% to $757.9 million
• Q1 Connected Fitness Subscription Workouts grew 306% to 77.8 million, averaging 20.7 Monthly Workouts per Connected Fitness Subscription, versus 11.7 in the year-ago period
• Q1 Average Net Monthly Connected Fitness Churn was 0.65%; Q1 12-month retention rate was 92%
• Q1 Gross Margin was 43.4%; Connected Fitness Product Gross Margin was 39.4%, Subscription Gross Margin was 58.5%, and Subscription Contribution Margin was 64.1%
• Q1 Net Income was $69.3 million, $0.20 per diluted share; Q1 Adjusted EBITDA was $118.9 million, representing an Adjusted EBITDA Margin of 15.7%
• Q2 FY 2021 guidance:
– 1.63 million ending Connected Fitness Subscriptions
– Average Net Monthly Connected Fitness Churn under 0.85%
– $1.0 billion total revenue
– Gross profit margin of approximately 39%
– $70 million Adjusted EBITDA, 7.0% Adjusted EBITDA Margin
• Revised full year FY 2021 guidance:
– 2.17 million or more ending Connected Fitness Subscriptions
– Average Net Monthly Connected Fitness Churn under 0.90%
– $3.9 billion or more total revenue
– Gross profit margin of approximately 41%
– $300 million or more Adjusted EBITDA
C O N N E C T E D F I T N E S S S U B S C R I P T I O N S
0
300
600
900
1,200
1,500
Q1Q4Q3Q2Q1Q4Q3Q2
362457 511 563
712886
1,091
1,334
FY 2020 FY 2021FY 2019
(in $ millions)(in thousands)
(in thousands)
0
200
400
600
800
Q1Q4Q3Q2Q1Q4Q3Q2
262.9316.7
223.3 228.0
466.3524.6
607.1
757.9
FY 2020 FY 2021FY 2019
Q U A R T E R L Y T O T A L R E V E N U E
Q U A R T E R L Y W O R K O U T S
0
20,000
40,000
60,000
80,000
100,000
Q1Q4Q3Q2Q1Q4Q3Q2
9,33617,988 17,759 19,171 24,345
44,155
76,817 77,767
FY 2020 FY 2021FY 2019
5
10
15
20
25
Q1Q4Q3Q2Q1Q4Q3Q2
9.7
13.912.0 11.7
12.6
17.720.7
24.7
FY 2020 FY 2021FY 2019
A V G . M O N T H L Y W O R K O U T S P E R S U B

P E L O T O N Q 1 : 2 0 2 1 | 3
Peloton Shareholders,
Like all of you, our team continues to work through the many challenges associated with
the ongoing COVID-19 pandemic. We were incredibly proud to launch the Peloton Bike+
and to announce the new Peloton Tread, an exciting milestone in our history. However, it
drove call volumes and unacceptably long wait times, well beyond our expectations, to
reach our Sales and Support teams, which impacted our customer experience. Also, as
we rapidly scale our organization to meet the extraordinary demand for our products, we
realize that some of our Members have faced extended delays associated with receiving
our products or having support requests fulfilled.
We will continue to work diligently to address delivery and support issues, as we have
long prided ourselves on providing superior customer service. With an understanding
of what is required to return to our normal standards, we continue to invest in
technology, manufacturing capabilities, and people to help us scale and meet the
needs of all our customers.
It has truly been a challenging year for the world and our Member community. We know
that Peloton offers a service that many need during this time to sustain their physical and
mental heath and well-being and we are doing everything we can to get our products to
our prospective Members as quickly as possible. Our hearts go out to all those affected by
COVID-19 and we are so thankful for the continued and prolonged efforts of our front line
and essential workers.

P E L O T O N Q 1 : 2 0 2 1 | 4
Turning to our business and financial results for Q1 FY 2021, we launched Bike+, reduced
the price of our category-defining Peloton Bike, and announced the upcoming availability
of our new Peloton Tread. Ending Connected Fitness Subscriptions grew 137% year-over-
year to over 1.33 million and total revenue grew 232% to $757.9 million, driven by strong
demand for our Bike and Bike+, the full resumption of Tread+ sales, and sustained low
churn levels. Digital Subscriptions grew 382% to over 510,000. Though we continue to
invest aggressively in content, supply chain and operational systems initiatives, operating
leverage resulted in net income of $69.3 million and Adjusted EBITDA of $118.9 million, or
15.7% Adjusted EBITDA margin, comparing to a year-ago margin of (9.2)%.
Our Members, both Connected Fitness and Digital, completed over 90 million workouts
in the quarter across over 17,000 classes, up 332% year-over-year. We continue to ramp
content production and produced over 2,400 new classes in the quarter.
As we’ve said previously, our goal is to become the leading connected fitness and
wellness platform. In order to do that we have focused on complementing our incredibly
effective and immersive cardio offering with world-class strength and wellness content.
We are continuously investing in hardware, software, and content to maintain our
leadership position.
Strength training is a key pillar of fitness and is a top priority for our teams. In Q1, we
increased and improved our strength programming through the introduction of new
strength classes in our existing formats and introduced two new exciting strength
offerings: Bike Bootcamp and Barre. We also officially launched our U.K. and German
strength programming, leveraging the launch of our dedicated U.K. strength studio. And
our Members are responding: strength workouts increased nearly 500% year-over-year,
significantly outpacing Total Workout growth.

P E L O T O N Q 1 : 2 0 2 1 | 5
P R O D U C T S
On September 9th, we launched Peloton Bike+, a re-envisioning of our award-winning Peloton Bike that incorporates key features requested by our Members. Bike+ was designed to create a challenging total body workout program through the swivel screen, making it easier to complement an indoor cycling class with Peloton’s strength, yoga, stretching, and meditation classes. Key new features include a 24” rotating HD touchscreen, a high-fidelity four-speaker sound system, and Auto-Follow, a feature that automatically scales your resistance based on the instructor’s target metrics.
We anticipate that our new Peloton Tread will be available for purchase starting December 26th in the U.K. The U.S. and Canada markets are scheduled for early next calendar year and the Germany launch is scheduled for later in Calendar 2021. We expect to release details soon on our launch timing.
S O F T WA R E
Our frequent software updates are designed to drive easier navigation of our content, increase Member engagement, and deepen the connections within our Peloton community. Recent improvements have included “Skip Intro”— a feature allowing experienced Members to advance past class introductions — and an improved class exit experience to enhance rating and sharing of class content with social media connections. Pelothon, our four week long collaborative Member celebration and engagement campaign, made use of our #Tags software, enabling Members to join one of six workout teams in the friendly competition, driving nearly 10 million Pelothon Member workouts and our single largest day of live classes taken on July 21st.

P E L O T O N Q 1 : 2 0 2 1 | 6
C O N T E N T
In conjunction with the introduction of Bike+, we were pleased to debut our groundbreaking Bike Bootcamp classes featuring instruction by Robin Arzon, Cody Rigsby, and Jess Sims. Bike Bootcamp is a series of motivating total body workouts, integrating strength training into our cycling cardio programming for a dynamic workout on and off the Bike. Bike+ Members can challenge themselves using Bike+’s integrated rotating screen, while our Members riding our original Bike can experience Bike Bootcamp through our TV integrations on platforms such as Roku, Apple TV, and Amazon Fire TV. From launch through the end of the quarter, our Members logged over 350,000 Bike Bootcamp workouts.
On September 21, we further expanded our Strength offering with the launch of Peloton Barre classes. Barre had long been a Member requested addition to our programming, and the launch of classes led by Hannah Corbin and Ally Love were quickly embraced by our Member community. From launch through the end of the quarter, our 10 Barre classes were taken over 530,000 times. We’re excited to debut additional new fitness modalities in the future.

P E L O T O N Q 1 : 2 0 2 1 | 7
R E V E N U E
We generated total revenue of $757.9 million, representing 232% year-over-year growth. Connected Fitness segment revenue was $601.4 million, representing 274% year-over-year growth and 79% of Total revenue. Connected Fitness revenue benefited from a large backlog of Bike orders from Q4 of fiscal 2020 and continued strong global demand for our Bike product portfolio. The full resumption of Tread+ sales across the United States also materially contributed to our growth in the quarter.
Subscription revenue grew to $156.5 million, representing 133% year-over-year growth and 21% of total revenue, driven by strong Connected Fitness Product sales and continued low Average Net Monthly Connected Fitness Churn of 0.65%. Our Connected Fitness Subscription base climbed to over 1.33 million at the end of Q1, representing year-over-year growth of 137%. As of September 30, 96% of our Connected Fitness Subscriptions were on month-to-month payment plans.
Reflecting typical seasonality, Member engagement eased modestly from Q4 FY 2020, but remained well above year-ago levels. In Q1, Average Monthly Workouts per Connected Fitness Subscription was 20.7, compared to 11.7 in the year-ago period. Users with Connected Fitness Subscriptions worked out with us approximately 77.8 million times, up from 19.2 million workouts in the same period last year, representing 306% year-over-year growth.
P E L O T O N I N T E R A C T I V E , I N C .
FINANCIAL DISCUSSION
R E V E N U E
$757.9 million
232% Y/Y
C O N N C E C T E D F I T N E S S R E V E N U E
$601.4 million
274% Y/Y
S U B S C R I P T I O N R E V E N U E
$156.5 million
133% Y/Y
C O N N E C T E D F I T N E S S A C T I V I T Y
77.8 million workouts
306% Y/Y

P E L O T O N Q 1 : 2 0 2 1 | 8
G R O S S P R O F I T
Gross profit in Q1 was $328.7 million and 43.4% of revenue, representing 213% year-over-year growth. Connected Fitness Products Gross Profit was $237.2 million in Q1, representing 252% year-over-year growth. Our Connected Fitness Products Gross Margin was 39.4%, a 246 basis point decline versus last year. Compared to the year-ago period, our Connected Fitness gross profit margin was primarily impacted by the recent Peloton Bike price reduction.
Subscription Gross Profit was $91.5 million in Q1, representing 143% year-over-year growth. Subscription Gross Margin was 58.5%, up from 56.1% in the year-ago period. Subscription Contribution was $100.4 million in Q1, representing 137% year-over-year growth. Subscription Contribution Margin was 64%, versus the prior year period at 63%. Continued leverage against content production costs was partially offset by the impact of costs associated with higher Member engagement.
For a reconciliation of non-GAAP financial measures to their corresponding GAAP measures, please refer to the reconciliation tables in the section titled “Key Operating Metrics and Non-GAAP Financial Measures--Non-GAAP Financial Measures.”
P E L O T O N I N T E R A C T I V E , I N C .
FINANCIAL DISCUSSION
G R O S S P R O F I T
$328.7 million
213% Y/Y
C O N N E C T E D F I T N E S S G R O S S P R O F I T
$237.2 million
252% Y/Y
S U B S C R I P T I O N G R O S S P R O F I T
$91.5 million
143% Y/Y
S U B S C R I P T I O N C O N T R I B U T I O N
$100.4 million
137% Y/Y

P E L O T O N Q 1 : 2 0 2 1 | 9
P E L O T O N I N T E R A C T I V E , I N C .
FINANCIAL DISCUSSION
T O T A L O P E R A T I N G E X P E N S E S
$259.8 million
34.3% of revenue
S A L E S A N D M A R K E T I N G
$114.6 million
15.1% of revenue
G E N E R A L A N D A D M I N I S T R A T I V E
$108.6 million
14.3% of revenue
R E S E A R C H A N D D E V E L O P M E N T
$36.6 million
4.8% of revenue
O P E R A T I N G E X P E N S E S
Total operating expense was $259.8 million, and grew 67% year-over-year, representing 34.3% of total revenue versus the prior year period of 68.4%.
Sales and marketing expense was $114.6 million, and grew 48% year-over-year, representing 15.1% of total revenue, versus the prior year period of 34.0%. We resumed media spend behind our new brand campaign “We All Have Our Reasons” and the launch of Bike+.
General and administrative expense was $108.6 million, and grew 78% year-over-year, representing 14.3% of total revenue versus the prior year period of 26.7%. Year-over-year growth was driven by continued investment in our teams and systems to support our growth.
Research and development expense was $36.6 million and grew 110% year-over-year, representing 4.8% of total revenue, versus the prior year period of 7.7%. Expense growth reflects increased investments in new software features and our hardware development pipeline.

P E L O T O N Q 1 : 2 0 2 1 | 1 0
P E L O T O N I N T E R A C T I V E , I N C .
FINANCIAL DISCUSSION
N E T I N C O M E
$69.3 million
A D J U S T E D E B I T D A
$118.9 million
15.7% margin
C A S H , C A S H E Q U I VA L E N T S , A N D M A R K E T A B L E S E C U R I T I E S
$2.0 billion
P R O F I T A B I L I T Y
Net income for Q1 was $69.3 million versus a net loss of $(49.8) million in the same period last year. Q1 Adjusted EBITDA was $118.9 million representing an Adjusted EBITDA Margin of 15.7% versus (9.2)% in the same period last year. Basic and diluted earnings per share were $0.24 and $0.20, respectively.
B A L A N C E S H E E T
We ended Q1 with $2.0 billion in cash, cash equivalents, and investments in marketable securities. We also have a $250.0 million revolving credit facility, which remains undrawn to date.
First quarter operating cash flow was $312.1 million. Capital expenditures were $49.2 million, the majority of which was related to the build out of our New York City headquarters, London Studios, Taiwan manufacturing facilities, and showroom footprint expansion.

P E L O T O N Q 1 : 2 0 2 1 | 1 1
P E L O T O N I N T E R A C T I V E , I N C .
Q2 AND FULL FISCAL YEAR 2021 BUSINESS OUTLOOK
F Y 2 0 2 1 Q 2 G U I D A N C E
• 1.63 million ending Connected Fitness Subscriptions
• Average Net Monthly Connected Fitness Churn under 0.85%
• $1.0 billion total revenue
• Gross profit margin of approximately 39%
• $70 million Adjusted EBITDA, 7.0% Adjusted EBITDA Margin
R E V I S E D F U L L F Y 2 0 2 1 G U I D A N C E
• 2.17 million or more ending Connected Fitness Subscriptions
• Average Net Monthly Connected Fitness Churn under 0.90%
• $3.9 billion or more total revenue
• Gross profit margin of approximately 41%
• $300 million or more Adjusted EBITDA
Though we have made progress in narrowing our order-to-delivery windows, continued high global demand for our products resulted in a substantial backlog of deliveries at the end of the quarter. In addition to the strong sales we’ve seen since the early Spring due to COVID-19, our outlook also reflects the better-than-expected reception for Bike+ from both our existing and new Members. While we have significantly expanded our manufacturing capabilities and expect continued progress over the coming months with the opening of our new Shin Ji facility at Tonic, we will be operating under supply constraints for the foreseeable future.
We expect $1.0 billion of revenue in Q2 and modest sequential revenue growth as we progress through FY 2021 and add manufacturing capacity. For the full fiscal year, we now expect revenue of at least $3.9 billion. While we expect normalized order-to-delivery windows for the Bike by the end of the calendar year, Bike+ wait times will likely be elevated for the next couple of quarters.
The strong reception of Bike+, combined with challenges associated with port congestion and COVID-19-related warehouse closures, impacted Bike+ delivery dates for many of our customers and caused significant Member experience challenges. Therefore, we are incurring additional shipping-related expenses in Q2 to alleviate some of the delays ahead of the Holiday period. As a result, we expect Q2 gross margin to temporarily decline to about 39%, implying a Connected Fitness Product Gross Margin of 35% and Subscription Contribution Margin of 63%.
For FY 2021 our gross margin guidance remains unchanged at approximately 41%. We continue to expect Connected Fitness Product Gross Margin to decline year-over-year to approximately 36%, driven primarily by our recent Bike price reduction and continued mix shift to Tread. We continue to expect Subscription Contribution Margin in FY 2021 to be roughly flat year-over-year. We expect leverage in fixed costs of content production to be offset by elevated engagement levels, higher penetration of Digital Subscriptions, and continued fitness and wellness programming investments.
We anticipate that year-over-year declines in our gross margins will be offset by significant year-on-year leverage in sales and marketing expense and general and administrative expense. Therefore, we expect Q2 Adjusted EBITDA of $70 million, representing an Adjusted EBITDA Margin of 7.0%. As we move through the balance of the year and ramp marketing spend, we expect FY 2021 Adjusted EBITDA of at least $300 million.
A reconciliation of non-GAAP guidance measures to corresponding GAAP measures is not available on a forward-looking basis without unreasonable effort due to the uncertainty regarding, and the potential variability of, many of the costs and expenses that may be incurred in the future. We have provided a reconciliation of GAAP to non-GAAP financial measures for the first quarter in the reconciliation tables at the end of this letter.

P E L O T O N Q 1 : 2 0 2 1 | 1 2
P E L O T O N I N T E R A C T I V E , I N C .
Q2 AND FULL FISCAL YEAR 2021 BUSINESS OUTLOOK
risks and uncertainties. Accordingly, actual results could differ materially due to a variety of factors, including: our ability to attract and retain Connected Fitness and Digital Subscription base; our limited operating history; our ability to anticipate and satisfy consumer preferences; the effects of the highly competitive market in which we operate; market acceptance of our Connected Fitness Products, including our newly introduced products, Bike+ and Peloton Tread; our ability to successfully develop and timely introduce new products and services; our ability to accurately forecast consumer demand and adequately manage our inventory; our ability to maintain the value and reputation of the Peloton brand; a decrease in sales of our Bike; the continued growth of the connected fitness market; the loss of any one of our third-party suppliers, manufacturers, or logistics partners; our ability to achieve our objectives of strategic and operational initiatives; litigation and related costs; the impact of privacy and data security laws; and other general market, political, economic, and business conditions.
Additional risks and uncertainties that could affect our financial results and business are included under the caption “Risk Factors” in our Annual Report on Form 10-K for the fiscal year ended June 30, 2020, our most recent Quarterly Report on Form 10-Q, and our other Securities and Exchange Commission (SEC) filings, which are available on the Investor Relations page of our website at https://investor.onepeloton.com/investor-relations/ and on the SEC website at www.sec.gov.
All forward-looking statements contained herein are based on information available to us as of the date hereof and you should not rely upon forward-looking statements as predictions of future events. The events and circumstances reflected in the forward-looking statements may not be achieved or occur. Although we believe that the expectations reflected in the forward-looking statements are reasonable, we cannot guarantee future results, performance, or achievements. We undertake no obligation to update any of these forward-looking statements for any reason after the date of this shareholder letter or to conform these statements to actual results or revised expectations, except as required by law. Undue reliance should not be placed on forward-looking statements.
WEBCAST
We will host a Q&A session at 5:00pm ET on Thursday, November 5th, 2020 to discuss our financial results. To participate in the live call, please dial 1 (877) 667-0469 (US / Canada) or 1 (346) 406-0807 (international) and provide conference ID 3177399. A live webcast of the call will be available at https://investor.onepeloton.com/investor-relations/ and will be archived on our site following the call.
We want to thank our entire Peloton Family for all their hard work, especially our delivery, warehouse, and Member experience teams who continue to work under challenging circumstances to service our Members. We continue to be inspired by our growing Peloton community and remain committed to delivering the world’s leading connected fitness experience.
Stay safe and well,Team Peloton
SAFE HARBOR STATEMENT
This shareholder letter includes forward-looking statements, which are statements other than statements of historical facts and statements in the future tense. These statements include, but are not limited to, statements regarding our future performance and our market opportunity, including expected financial results for the second quarter of fiscal year 2021 and full fiscal year 2021, the potential impact of COVID-19 on the fitness and wellness industry in general as well as our business, our business strategy and plans, including the pace that we scale our organization to meet high global demand for our products, the effectiveness of our investments in technology, content, manufacturing capabilities, supply chain and operational systems and people initiatives, and our ability to narrow our order-to-delivery windows and decrease our substantial backlog of deliverables, our expectations regarding timing for the availability of our new Peloton Tread in various markets, and our objectives and future operations. Forward-looking statements are based upon various estimates and assumptions, as well as information known to us as of the date hereof, and are subject to

P E L O T O N Q 1 : 2 0 2 1 | 1 3
C O N N E C T E D F I T N E S S S U B S C R I P T I O N S
Our ability to expand the number of Connected Fitness Subscriptions is an indicator of our market penetration and growth. We define a Connected Fitness Subscription as a person, household, or commercial property, such as a hotel or residential building, who has either paid for a subscription to a Connected Fitness Product (a Connected Fitness Subscription with a successful credit card billing or with prepaid subscription credits or waivers) or requested a “pause” to their subscription for up to 3 months. We do not include canceled or unpaid Connected Fitness Subscriptions in the Connected Fitness Subscription count.
A V E R A G E N E T M O N T H L Y C O N N E C T E D F I T N E S S C H U R N
We use Average Net Monthly Connected Fitness Churn to measure the retention of our Connected Fitness Subscriptions. We define Average Net Monthly Connected Fitness Churn as Connected Fitness Subscription cancellations, net of reactivations, in the quarter, divided by the average number of beginning Connected Fitness Subscriptions in each month, divided by three months. This metric does not include data related to our Digital Subscriptions for Members who pay a monthly fee for access to our content library on their own devices.
P E L O T O N I N T E R A C T I V E , I N C .
KEY OPERATING METRICS AND NON-GAAP FINANCIAL MEASURES
In addition to the measures presented in our interim condensed consolidated financial statements, we use the following key operational and business metrics and non-GAAP financial measures to evaluate our business, measure our performance, develop financial forecasts, and make strategic decisions.
Three Months Ended September 30,
2020 2019
Ending Connected Fitness Subscriptions 1,334,400 562,774
Average Net Monthly Connected Fitness Churn 0.65% 0.90%
Total Workouts (in millions) 77.8 19.2
Average Monthly Workouts per Connected Fitness Subscription 20.7 11.7
Subscription Gross Profit (in millions) $ 91.5 $ 37.7
Subscription Contribution (in millions) (1) $ 100.4 $ 42.4
Subscription Gross Margin 58.5% 56.1%
Subscription Contribution Margin (1) 64.1% 63.0%
Net income (loss) (in millions) $ 69.3 $ (49.8)
Adjusted EBITDA (in millions) (2) $ 118.9 $ (21.0)
Adjusted EBITDA Margin (2) 15.7% (9.2)%
(1) Please see the section titled “Non-GAAP Financial Measures—Subscription Contribution and Subscription Contribution Margin” for a reconciliation of Subscription Gross Profit to Subscription Contribution and an explanation for why we consider Subscription Contribution and Subscription Contribution Margin to be a helpful metric for investors
(2) Please see the section titled “Non-GAAP Financial Measures—Adjusted EBITDA and Adjusted EBITDA Margin” for a reconciliation of net income (loss) to Adjusted EBITDA and an explanation for why we consider Adjusted EBITDA to be a helpful metric for investors.

P E L O T O N Q 1 : 2 0 2 1 | 1 4
P E L O T O N I N T E R A C T I V E , I N C .
KEY OPERATING METRICS AND NON-GAAP FINANCIAL MEASURES
T O T A L W O R K O U T S A N D A V E R A G E M O N T H L Y W O R K O U T S P E R C O N N E C T E D F I T N E S S S U B S C R I P T I O N
We review Total Workouts and Average Monthly Workouts per Connected Fitness Subscription to measure engagement, which is the leading indicator of retention for our Connected Fitness Subscriptions. We define Total Workouts as all workouts completed during a given period. We define a Workout as a Connected Fitness Subscription for Members either completing at least 50% of an instructor-led or scenic ride or run, or ten or more minutes of “Just Ride” or “Just Run” mode. We define Average Monthly Workouts per Connected Fitness Subscription as the Total Workouts completed in the quarter divided by the average number of Connected Fitness Subscriptions in each month, divided by three months.
N O N - G A A P F I N A N C I A L M E A S U R E S
In addition to our results determined in accordance with accounting principles generally accepted in the United States, or GAAP, we believe the following non-GAAP financial measures are useful in evaluating our operating performance.
These non-GAAP financial measures have limitations as analytical tools in that they do not reflect all of the amounts associated with our results of operations as determined in accordance with GAAP. Because of these limitations, Adjusted EBITDA, Adjusted EBITDA Margin, Subscription Contribution, and Subscription Contribution Margin should be considered along with other operating and financial performance measures presented in accordance with GAAP.
The presentation of these non-GAAP financial measures is not intended to be considered in isolation or as a substitute for, or superior to, financial information prepared and presented in accordance with GAAP. Investors are encouraged to review the reconciliation of these non-GAAP financial measures to their most directly comparable GAAP financial measures. A reconciliation of the non-GAAP financial measures to such GAAP measures can be found below.

P E L O T O N Q 1 : 2 0 2 1 | 1 5
Adjusted EBITDA and Adjusted EBITDA Margin are key performance measures that our management uses to assess our operating performance and the operating leverage in our business. Because Adjusted EBITDA and Adjusted EBITDA Margin facilitate internal comparisons of our historical operating performance on a more consistent basis, we use these measures for business planning purposes. We also believe this information will be useful for investors to facilitate comparisons of our operating performance and better identify trends in our business. We expect Adjusted EBITDA Margin to increase over the long-term as we continue to scale our business and achieve greater leverage in our operating expenses.We calculate Adjusted EBITDA as net income (loss)
P E L O T O N I N T E R A C T I V E , I N C .
ADJUSTED EBITDA AND ADJUSTED EBITDA MARGIN
adjusted to exclude: other (income), net; income tax expenses; depreciation and amortization expense; stock-based compensation expense; transaction costs; certain litigation expenses, consisting of legal settlements and related fees for specific proceedings that arise outside of the ordinary course of our business; and non-recurring incremental costs primarily consisting of hazard pay as a result of COVID-19. Adjusted EBITDA Margin is calculated by dividing Adjusted EBITDA by Total revenue.
The following table presents a reconciliation of Adjusted EBITDA to net income (loss), the most directly comparablefinancial measure prepared in accordance with GAAP, for each of the periods indicated:
Three Months Ended September 30,(in millions)
2020 2019
Net income (loss) $ 69.3 $ (49.8)
Adjusted to exclude the following:
Other income, net (1.7) (1.2)
Income tax expense 1.3 0.1
Depreciation and amortization expense 11.4 7.1
Stock-based compensation expense 29.6 18.7
Litigation and settlement expenses 3.1 3.9
Other adjustment items (1) 5.9 0.3
Adjusted EBITDA $ 118.9 $ (21.0)
Adjusted EBITDA margin 15.7% (9.2)%
(1) Includes incremental costs associated with COVID-19 of $5.9 million for the three months ended September 30, 2020 and $0.3 million of transaction costs for the three months ended September 30, 2019.

P E L O T O N Q 1 : 2 0 2 1 | 1 6
P E L O T O N I N T E R A C T I V E , I N C .
SUBSCRIPTION CONTRIBUTION AND SUBSCRIPTION CONTRIBUTION MARGIN
Three Months Ended September 30,
(dollars in millions)
2020 2019
Subscription Revenue $ 156.5 $ 67.2
Less: Cost of Subscription 65.0 29.5
Subscription Gross Profit $ 91.5 $ 37.7
Subscription Gross Margin 58.5% 56.1%
Add back:
Depreciation and amortization expense $ 4.4 $ 3.7
Stock-based compensation expense 4.5 1.0
Subscription Contribution $ 100.4 $ 42.4
Subscription Contribution Margin 64.1% 63.0%
We use Subscription Contribution and Subscription Contribution Margin to measure our ability to scale and leverage the costs of our Connected Fitness Subscriptions. The continued growth of our Connected Fitness Subscription base will allow us to improve our Subscription Contribution Margin. While there are variable costs, including music royalties, associated with our Connected Fitness Subscriptions, a significant portion of our content creation costs are fixed given that we operate with a limited number of production studios and instructors. The fixed nature of those expenses should scale over time as we grow our Connected Fitness Subscription base.
We believe that these non-GAAP financial measures are useful to investors for period-to-period comparisons of our business and in understanding and evaluating our operating results because our management uses
Subscription Contribution and Subscription Contribution Margin in conjunction with financial measures prepared in accordance with GAAP for planning purposes, including the preparation of our annual operating budget, as a measure of our core operating results and the effectiveness of our business strategy, and in evaluating our financial performance.
We define Subscription Contribution as subscription revenue less cost of subscription revenue, adjusted to exclude from cost of subscription revenue, depreciation and amortization expense and stock-based compensation expense. Subscription Contribution Margin is calculated by dividing Subscription Contribution by subscription revenue.
The following table presents a reconciliation of Subscription Contribution to Subscription Gross Profit, the most directly comparable financial measure prepared in accordance with GAAP, for each of the periods indicated:

P E L O T O N Q 1 : 2 0 2 1 | 1 7
P E L O T O N I N T E R A C T I V E , I N C .
CONDENSED CONSOLIDATED BAL ANCE SHEETS(in millions, except share and per share amounts)
A S S E T S 09/30/2020 06/30/2020
Current assets:UNAUDITED
Cash and cash equivalents $ 1,430.5 $ 1,035.5
Marketable securities 592.3 719.5
Accounts receivable, net 49.9 34.6
Inventories, net 364.0 244.5
Prepaid expenses and other current assets 146.3 124.5
Total current assets 2,583.0 2,158.6
Property and equipment, net 295.5 242.3
Intangible assets, net 14.7 16.0
Goodwill 39.7 39.1
Restricted cash 1.5 1.5
Right-of-use assets, net 516.7 492.5
Other assets 26.4 31.8
Total assets $ 3,477.5 $ 2,981.8
L I A B I L I T I E S A N D S T O C K H O L D E R S ’ E Q U I T Y
Current liabilities:
Accounts payable $ 275.0 $ 135.8
Accrued expenses 246.7 225.9
Customer deposits and deferred revenue 521.2 363.6
Current portion of lease liabilities and other current liabilities 50.8 46.9
Total current liabilities 1,093.7 772.2
Long term lease liabilities, net 553.7 508.2
Other non-current liabilities 29.1 23.4
Total liabilities 1,676.5 1,303.8
Commitments and contingencies
Stockholders’ equity
Common stock, $0.000025 par value; 2,500,000,000 and 2,500,000,000 Class A shares authorized, 255,036,221 and 237,518,574 shares issued and outstanding as of September 30, 2020 and June 30, 2020, respectively; 2,500,000,000 and 2,500,000,000 Class B shares authorized, 36,776,277 and 50,538,538 shares issued and outstanding as of September 30, 2020 and June 30, 2020, respectively.
— —
Additional paid-in capital 2,412.9 2,361.8
Accumulated other comprehensive income 12.7 10.1
Accumulated deficit (624.6) (693.9)
Total stockholders’ equity 1,801.0 1,678.0
Total liabilities and stockholders’ equity $ 3,477.5 $ 2,981.8

P E L O T O N Q 1 : 2 0 2 1 | 1 8
Three Months Ended September 30,
2020 2019
Revenue:
Connected Fitness Products $ 601.4 $ 160.8
Subscription 156.5 67.2
Total revenue 757.9 228.0
Cost of revenue: (1)(2)
Connected Fitness Products 364.2 93.4
Subscription 65.0 29.5
Total cost of revenue 429.2 122.9
Gross profit 328.7 105.1
Operating expenses:
Sales and marketing (1)(2) 114.6 77.6
General and administrative (1)(2) 108.6 60.9
Research and development (1)(2) 36.6 17.4
Total operating expenses 259.8 156.0
Income (loss) from operations 68.9 (50.9)
Other income, net:
Interest income, net 2.4 1.3
Other expense, net (0.7) (0.1)
Total other income, net 1.7 1.2
Income (loss) before provision for income taxes 70.6 (49.7)
Income tax expense 1.3 0.1
Net Income (loss) $ 69.3 $ (49.8)
Net income (loss) attributable to Class A and Class B common stockholders $ 69.3 $ (49.8)
Net income (loss) per share attributable to Class A and Class B common stockholders, basic $ 0.24 $ (1.29)
Net income (loss) per share attributable to Class A and Class B common stockholders, diluted $ 0.20 $ (1.29)
Weighted-average Class A and Class B common shares outstanding, basic 288,719,834 38,453,864
Weighted-average Class A and Class B common shares outstanding, diluted 342,101,984 38,453,864
Other comprehensive income (loss):
Net unrealized losses on marketable securities $ (1.3) $ —
Change in foreign currency translation adjustment 3.9 (1.3)
Total other comprehensive income (loss) 2.6 (1.3)
Comprehensive income (loss) $ 71.9 $ (51.1)
P E L O T O N I N T E R A C T I V E , I N C .
CONDENSED CONSOLIDATED STATEMENTS OF OPERATIONS AND COMPREHENSIVE INCOME (LOSS)U N A U D I T E D (in millions, except share and per share amounts)
P E L O T O N Q 1 : 2 0 2 1 | 1 9
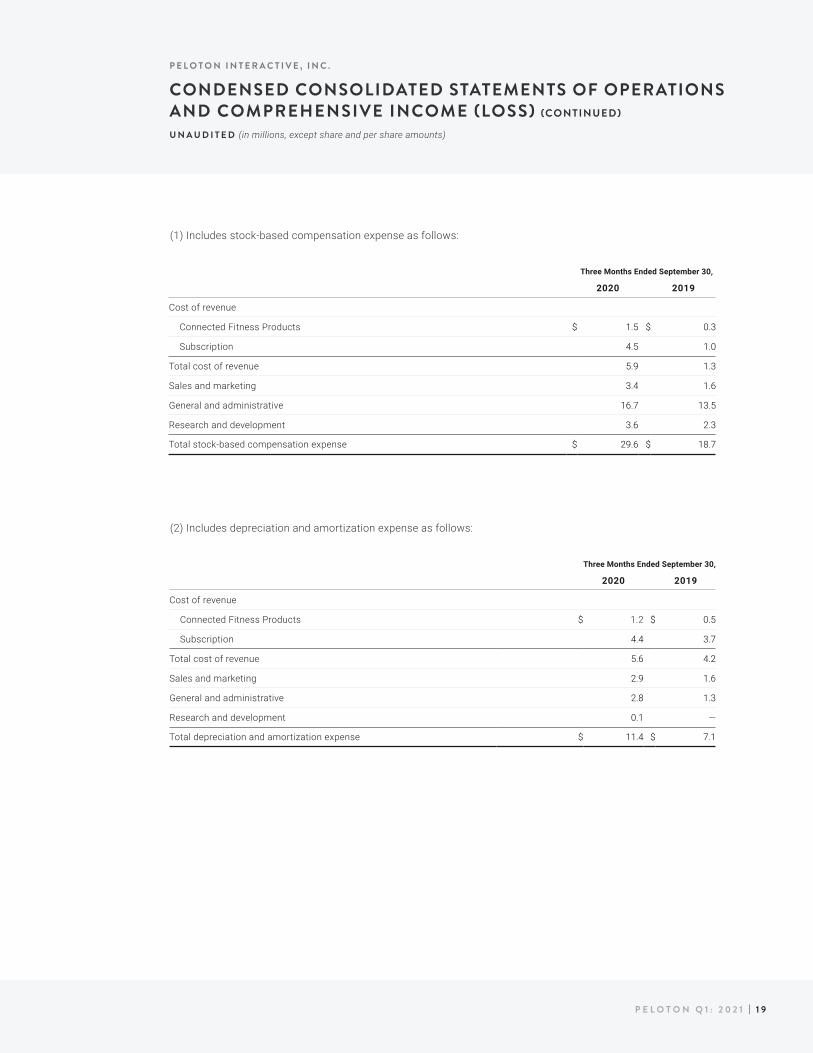
Three Months Ended September 30,
2020 2019
Cost of revenue
Connected Fitness Products $ 1.5 $ 0.3
Subscription 4.5 1.0
Total cost of revenue 5.9 1.3
Sales and marketing 3.4 1.6
General and administrative 16.7 13.5
Research and development 3.6 2.3
Total stock-based compensation expense $ 29.6 $ 18.7
(1) Includes stock-based compensation expense as follows:
Three Months Ended September 30,
2020 2019
Cost of revenue
Connected Fitness Products $ 1.2 $ 0.5
Subscription 4.4 3.7
Total cost of revenue 5.6 4.2
Sales and marketing 2.9 1.6
General and administrative 2.8 1.3
Research and development 0.1 —
Total depreciation and amortization expense $ 11.4 $ 7.1
(2) Includes depreciation and amortization expense as follows:
P E L O T O N I N T E R A C T I V E , I N C .
CONDENSED CONSOLIDATED STATEMENTS OF OPERATIONS AND COMPREHENSIVE INCOME (LOSS) (CONTINUED)
U N A U D I T E D (in millions, except share and per share amounts)

P E L O T O N Q 1 : 2 0 2 1 | 2 0
P E L O T O N I N T E R A C T I V E , I N C .
CONDENSED CONSOLIDATED STATEMENTS OF CASH FLOWSU N A U D I T E D (in millions)
Three Months Ended September 30,
2020 2019
Cash Flows from Operating Activities:
Net income (loss) $ 69.3 $ (49.8)
Adjustments to reconcile net income (loss) to net cash provided by (used in) operating activities:
Depreciation and amortization expense 11.4 7.1
Stock-based compensation expense 29.6 18.7
Non-cash operating lease expense 13.3 9.3
Amortization of premium from marketable securities 1.7 0.3
Other non-cash items 1.4 0.1
Changes in operating assets and liabilities:
Accounts receivable (15.0) (2.4)
Inventories (118.0) (69.1)
Prepaid expenses and other current assets (18.2) 1.9
Other assets 5.9 (1.4)
Accounts payable and accrued expenses 156.4 17.5
Customer deposits and deferred revenue 157.4 8.5
Operating lease liabilities, net 11.3 (16.7)
Other liabilities 5.5 (0.1)
Net cash provided by (used in) operating activities 312.1 (76.2)
Cash Flows from Investing Activities:
Maturities of marketable securities 124.5 115.3
Purchases of property and equipment (49.2) (19.1)
Capitalization of software costs (12.9) (3.4)
Net cash provided by investing activities 62.4 92.8
Cash Flows from Financing Activities:
Proceeds from issuance of common stock upon initial public offering, net of offering costs — 1,195.7
Proceeds from employee stock purchase plan withholdings 3.3 —
Proceeds from exercise of stock options 15.4 2.7
Net cash provided by financing activities 18.8 1,198.4
Effect of exchange rate changes 1.7 (1.3)
Net change in cash, cash equivalents, and restricted cash 395.0 1,213.7
Cash, cash equivalents and restricted cash — Beginning of period 1,037.0 163.0
Cash, cash equivalents and restricted cash — End of period $ 1,432.0 $ 1,376.7
Supplemental Disclosures of Cash Flow Information:
Cash paid for interest $ 0.3 $ —
Cash paid for income taxes $ 0.5 $ —
Supplemental Disclosures of Non-Cash Investing and Financing Information:
Conversion of convertible preferred stock to common stock $ — $ 941.1
Property and equipment accrued but unpaid $ 19.6 $ 8.9
Stock-based compensation capitalized for software development costs $ 0.7 $ 0.4