Embed Size (px)
Citation preview

Q1 2019 results26 April 2019
Deutsche Bank

Q1 2019 results 26 April 2019
Deutsche BankInvestor Relations
We remain committed to improving returns to shareholders
2
Resilient revenues in less market sensitive businesses
Volume growth and continued investments in key businesses
Continued discipline in cost reduction – well on track to meet 2019 target
Continued conservative balance sheet and risk management
Concluded that executing on own strategy provides superior returns with less execution risk

Q1 2019 results 26 April 2019
Deutsche BankInvestor Relations
Resilient revenues in less market sensitive areas€ bn, revenues(1) excluding specific items(2)
3
0.9
Q1 2018
Equities
0.5
0.6
1.8
0.5
2.5 2.5
0.5
1.5
0.5
0.5
1.0
Q1 2019
FIC
O&A
AM
GTB
PCB
6.76.3
(5)%
Note: Throughout this presentations totals may not sum due to rounding differences(1) Revenues in C&O (Q1 2018: € (54)m, Q1 2019: € (15)m) and CIB Others (Q1 2018: € (67)m, Q1 2019: € (36)m) are not shown on this chart but are included in DB Group totals(2) Specific items defined on slide 20
— Stable revenues despite continued low interest rate environment
— Underlying growth driven by higher lending volumes
Private & Commercial Bank (PCB)
Global Transaction Bank (GTB)
— Growth in volumes and net interest income across all businesses
— Improved balance sheet efficiency
Asset Management
(AM)
— AuM recovery to € 706bn— Net new assets of € 2bn in Q1 2019 (€ 7bn
excluding cash products)
Equities
S&T
— Impact of 2018 perimeter adjustments— Continued challenging market conditions
FIC
S&T
— Impacted by market environment and perimeter adjustments in 2018
— Credit and FX performed relatively well
Origination & Advisory
(O&A)
— Market share increases across products and geographies
— Revenues declined reflecting industry fee pool
Mor
e co
ntro
llabl
eM
arke
t sen
sitiv
e
(16)%
1%
Q1 2019 results 26 April 2019
Deutsche BankInvestor Relations
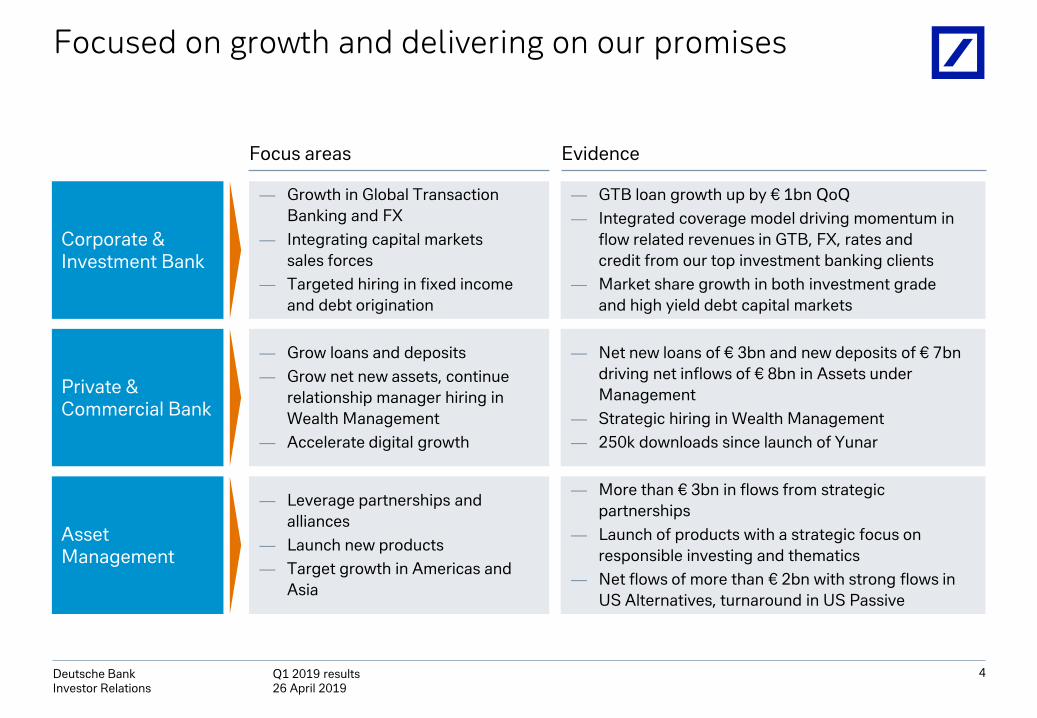
Focused on growth and delivering on our promises
4
Corporate & Investment Bank
Asset Management
Private & Commercial Bank
Evidence
— GTB loan growth up by € 1bn QoQ— Integrated coverage model driving momentum in
flow related revenues in GTB, FX, rates and credit from our top investment banking clients
— Market share growth in both investment grade and high yield debt capital markets
— More than € 3bn in flows from strategic partnerships
— Launch of products with a strategic focus on responsible investing and thematics
— Net flows of more than € 2bn with strong flows in US Alternatives, turnaround in US Passive
— Net new loans of € 3bn and new deposits of € 7bn driving net inflows of € 8bn in Assets under Management
— Strategic hiring in Wealth Management— 250k downloads since launch of Yunar
— Growth in Global Transaction Banking and FX
— Integrating capital markets sales forces
— Targeted hiring in fixed income and debt origination
— Grow loans and deposits — Grow net new assets, continue
relationship manager hiring in Wealth Management
— Accelerate digital growth
Focus areas
— Leverage partnerships and alliances
— Launch new products— Target growth in Americas and
Asia

Q1 2019 results 26 April 2019
Deutsche BankInvestor Relations
Well on track to achieve our adjusted cost target€ bn, adjusted costs(1)
5
6.3
17.6
2017 2018
16.5
5.96.3
15.9
2019 target
21.823.9
22.8
(0.4)
(1.1)(1.0)
Q4 2018
0.7
5.35.7
Q1 2018
5.6 5.4
Q2 2018
5.5
Q3 2018
0.6
Q1 2019
6.3
5.6 5.5 5.45.9
(0.4)
5th consecutive quarterly reduction (ex bank levy) On track to deliver 2019 cost target
Banklevy
Adjustedcostsexbank levy
Q1
Q2-Q4
(1) Throughout this presentation adjusted costs are defined as total noninterest expenses excluding impairment of goodwill and other intangible assets, litigation expenses, and restructuring and severance

Q1 2019 results 26 April 2019
Deutsche BankInvestor Relations
Maintained strong balance sheet with prudent risk management
6
(1) Requirement for Minimum Requirement for Eligible Liabilities (MREL) set at 9.14% of Total Liabilities and Own Funds of € 1,134bn(2) Gross loans at amortized cost as well as loans measured at fair value versus total deposits
As of 31 Mar 2019
Common Equity Tier 1 capital ratio 13.7% Prudent management of capital resources
Loss-absorbing capacity € 123bn Excess above MREL requirement: € 19bn(1)
Liquidity coverage ratio 141% Excess above LCR requirement of 100%: € 68bn
Loans as a % of deposits(2) 77% High quality loan portfolio against stable deposits
Average Value-at-Risk € 27m Tightly controlledmarket risk
Provision for credit losses as a % of loans 13bps Reflects strong underwriting standards and low risk portfolios
Comment

Q1 2019 results 26 April 2019
Deutsche BankInvestor Relations
0.5%
>1%
2018 RoTE
More controllable
~ 2.5%
Market/event sensitive 2019RoTE target
>4%
Focused on delivering improved returns to shareholders
7
Post-tax return on tangible equity, in %
— Assumes greater client activity and constructive market environment
~ Market share recovery ~ Potential increases in credit loss
provisions and non-operating items
/ ~ / : progress towards full year objective — Adjusted cost reductions (€ 1bn)— Balance sheet and liquidity optimization
(>€ 300m)— Growth in stable businesses — Tax rate normalization (to ~35%)

Q1 2019 results 26 April 2019
Deutsche BankInvestor Relations
Q1 2019 Group financial highlights€ m, unless stated otherwise
8
Higher / (lower) in %
Higher /(lower) in %
Q1 2019 vs. Q1 2018 vs. Q4 2018
Revenues Revenues 6,351. (9) 14(of which: Specific items(1) 31( (90) (84)
Costs
Noninterest expenses 5,919( (8) 5(
of which: Adjusted costs 5,930( (7) 9(
Cost/income ratio (in %) 93( 1( ppt (8) ppt
Profitability
Profit before tax 292( (32) n.m.
Net income(2) 178( 48) n.m.
Post-tax RoTE (in %) 1.3( 0.4) ppt 4.4( ppt
Per sharemetrics
Diluted earnings per share (in €) 0.08( 33( n.m.Tangible book value per share (in €) 25.86( 1( 1(
Risk and Capital
Provision for credit losses 140( 60( (45)
CET1 ratio (in %, fully loaded) 13.7( 37( bps 18( bps
Leverage ratio (in %, fully loaded) 3.9( 20( bps (20) bps
(1) Specific items defined on slide 20(2) Net income attributable to Deutsche Bank shareholders and additional equity components

Q1 2019 results 26 April 2019
Deutsche BankInvestor Relations
Adjusted costs€ m, FX adjusted
7
597
IT costsQ4 2018 ex FX
Q1 2019BankLevies
Professional Service Fees
5,930
(75)(8)
5,440(31)
OtherCompensation and benefits(1)
9%490
Q1 2019
(87)
BankLevies
6,474
OtherQ1 2018ex FX
(59)(130)
(90)
Compensation and benefits(1)
(178) 5,930
Professional Service Fees
IT costs
(8)%(544)
Note: For further information on adjusted costs and FX adjustments see slides 20 and 21(1) Excludes severance of Q1 2018: € 42m; Q1 2018 ex FX: € 42m; Q4 2018: € 79m; Q4 2018 ex FX: € 80m; Q1 2019: € 23m
(2)%(108)
Varianceexcl. bank levies
— Q1 2019 adjusted costs € 0.5bn below prior year
— Fifth consecutive quarterlyreduction of adjusted costs(excluding bank levies)
— Lower compensation and benefit costs reflected reductions in internal workforce
— Noncompensation expenses down across cost categories reflectingactive management of consumptionand vendor spend
— Further reduced internal workforceby ~300 in Q1 2019, primarilydriven by PCB in Germany andInfrastructure
Q1 2019 YoY comments
9

Q1 2019 results 26 April 2019
Deutsche BankInvestor Relations
Capital ratiosCRD4, fully loaded, € bn except movements (in basis points)
10
CET1 ratio
Leverage ratio
21
31 Dec2018
RWA change
(3)
FX Effect
0
Capital change
31 Mar2019
13.6%13.7%
CET1Capital 47.5 - 0.2 (0.0) 47.7
RWA 350 (5) 2 - 347
(1) EBA Q&A ID 2018_3756 published March 22, 2019
Tier 1Capital 52.1 - 0.2 (0.0) 52.3
LeverageExposure 1,273 57 15 - 1,345
31 Dec 2018
(18)
Leverage Exposure change
(3)
FX Effect
0
Capital change
31 Mar 2019
4.1%
3.9%
— CET1 capital change including € (0.1)bn from IFRS 16 adoption
— Lower risk-weighted assets (RWA) driven by:— Market Risk RWA movement of € (7)bn reversing
temporary increases recorded in Q4 2018— Credit Risk RWA increased € 9bn, including the
impact of IFRS 16 (€ 3bn), business growth and smaller methodology changes
— Operational Risk RWA lowered by favorable loss data development (€ (2)bn) and Advanced Measurement Approach model update (€ (5)bn)
— Leverage ratio declined in the quarter predominantly driven by higher leverage exposure:— € 22bn seasonal increase in pending settlement
balances— € 22bn secured financing transactions and trading
inventory in CIB supporting client activity— € 10bn loan growth— € 6bn technical impacts from IFRS 16 (€ 3bn) and
EBA Q&A(1) on cleared derivatives add-on calculation (€ 3bn)

Q1 2019 results 26 April 2019
Deutsche BankInvestor Relations
11
Segment results

Q1 2019 results 26 April 2019
Deutsche BankInvestor Relations
12
Higher / (lower) in %
Q1 2019vs.
Q1 2018vs.
Q4 2018
RevenuesRevenues 3,328 (13) 28)
— Q1 2019 revenues impacted by theweaker environment for Sales & Trading, especially in Rates and Equities, and perimeter adjustments
— Reduced adjusted costs by 5% principally reflecting strategic actions taken in 2018 and continued cost discipline
— Leading indicators are encouraging –€ 13bn loan growth YoY (€ 5bn QoQ) mainly in Credit and GTB to support future revenue growth
— YoY decline in leverage exposure reflects impact of perimeter adjustments; QoQincrease on seasonally higher pending settlements and business growth
— RWA decline reflects lower Market and Operational Risk
of which: Specific items(1) (12) n.m. n.m.
Costs
Noninterest expenses 3,393 (7) 22)
of which: Adjusted costs 3,367 (5) 23)
of which: Bank levy(2) 535 (7) n.m.
Cost/income ratio (in %) 102 7) ppt (5) ppt
ProfitabilityProfit before tax (88) n.m. (71)Post-tax RoTE (in %)(3) (0.6) (2.1) ppt 1.5( ppt
Balance sheet (€ bn)
Loans(4) 140 11( 4(Leverage exposure 959 (9) 8)
Risk
Risk-weighted assets (in € bn) 228 (5) (3)
Provision for credit losses 23 n.m. (79)
Average Value at Risk 27 (2) (10)
(1) Specific items defined on slide 20(2) Bank levy excludes deposit protection guarantee schemes (3) Post-tax return on tangible shareholders’ equity based on allocation of tangible shareholders’ equity of € 39.4bn for Q1 2019 (prior year period € 41.0bn for Q1 2018), applying a 28%
tax rate for 2019 and 28% tax rate for 2018(4) Loan amounts are gross of allowances for loan losses
Corporate & Investment Bank (CIB)€ m, unless stated otherwise
Q1 2019 YoY comments

Q1 2019 results 26 April 2019
Deutsche BankInvestor Relations
Q1 2019 CIB business unit performance € m, revenues
13
975
455
1,516
468
(84)
3,328
Global Transaction Banking
Sales & Trading (Equity)
Origination & Advisory
Sales & Trading (Fixed Income)
Other
Corporate & Investment Bank
X% Excluding specific items(1)
Q1 2019 YoY revenue drivers
6% 6%
(18)% (18)%
(5)% (5)%
(19)% (18)%
n.m. (46)%
(13)% (10)%
Change YoY
(1) Specific items defined on slide 20
Global Transaction Banking:
— Revenue growth driven by higher net interest income, particularly in Cash Management
Origination & Advisory:
— Significantly higher Advisory revenues, offset by lower revenues in Equity and Debt Origination on lower fee pools
— Market share gains across regions
Sales & Trading (Fixed Income):
— Significantly lower revenues in Rates due to perimeter adjustments, adverse market conditions and lower client activity
— Revenues in FX and Credit slightly lower; lower revenues in distressed debt, while flow credit was materially higher
Sales & Trading (Equity):
— Lower revenues across all products given challenging market conditions and perimeter adjustments

Q1 2019 results 26 April 2019
Deutsche BankInvestor Relations
Higher / (lower) in %
Q1 2019vs.
Q1 2018vs.
Q4 2018
Revenues
Revenues 2,513 (5) 2(— Revenues flat excluding specific items
as volume growth offset ongoing deposit margin compression
— Adjusted costs declined reflecting the disposal of Poland in Q4 2018 and headcount reductions (FTE down ~2,400 YoY)
— Excluding exited businesses(2), we grew loans € 13bn and deposits by € 20bn
— Net AuM inflows of € 8bn in Q1 2019, of which € 3bn in Wealth Management
— Provision for credit losses of 17bps of loans reflecting continued strong underwriting standards. Increase mainly due to impacts from model recalibrations
of which: Specific items(1) 43 (75) (43)of which: Exited businesses(2) 21 n.m. (34)
CostsNoninterest expenses 2,108 (5)) (8)
of which: Adjusted costs 2,149 (4)) (2)Cost/income ratio (in %) 84 (0)) ppt (9) ppt
ProfitabilityProfit before tax 287 (11) n.m.
of which: Exited businesses(2) (13) (84) (65)Post-tax RoTE (in %)(3) 6.4 (1.3) ppt 5.9) ppt
Business volume
(€ bn)
Loans(4) 273 3) 1)Deposits 341 5) 2)Assets under Management(5) 502 1( 6)
RiskRisk-weighted assets (in € bn) 90 3) 3)
Provision for credit losses 117 33) (19)
14
(1) Specific items defined on slide 20(2) Exited Businesses include results related to operations in Portugal and Poland; the majority of the operations in Poland was sold in Q4 2018; YoY loan / deposit growth was € 8bn /
€ 17bn including Exited Businesses and € 13bn / € 20bn excluding Exited Businesses(3) Post-tax return on tangible shareholders’ equity based on allocation of tangible shareholders’ equity of € 12.9bn for Q1 2019 (prior year period € 12.1bn for Q1 2018), applying a 28%
tax rate for 2019 and 28% tax rate for 2018(4) Loan amounts are gross of allowances for loan losses(5) Includes deposits if they serve investment purposes. Please refer to slide 33
Private & Commercial Bank (PCB)€ m, unless stated otherwise
Q1 2019 YoY comments

Q1 2019 results 26 April 2019
Deutsche BankInvestor Relations
Q1 2019 PCB business unit performance € m, revenues
15
1,707
359
427
21
2,513
Private and Commercial Business
Private and Commercial Business
Exited businesses(3)
Wealth Management (Global)
Private & Commercial Bank
(Germany)
(International)(2)
Q1 2019 YoY revenue drivers
(1) Specific items defined on slide 20(2) Includes operations in Belgium, India, Italy and Spain(3) Includes revenues related to operations in Poland and Portugal
(5)% 0%
n.m. n.m.
0% (7)%
(4)% (4)%
(7)% 2%
X% Excluding specific items(1) Change YoY
Private and Commercial Business (Germany): — Q1 2018 reported revenues included a
€ 156m gain on a property sale— Excluding this item revenues up 2% as growth
in volumes and re-pricing actions offset the continued deposit margin compression
— AuM net inflows of € 5bn in the quarter— Grew loans € 7bn YoY, driven by commercial
loans and mortgages
Private and Commercial Business (International):— Revenues declined reflecting absence of a
smaller asset sale in Q1 2018 and a change in the treatment of loan fees in Italy
— Growth in loan revenues and re-pricing measures offset the continued impact from the low interest rate environment
Wealth Management (Global):— Excluding Sal. Oppenheim workout activities,
revenues declined on AuM declines in Q4 2018 and smaller divestitures in 2018
— Revenues +7% QoQ ex Sal. Oppenheim workout activities with € 3bn AuM net inflows
— Grew loans € 5bn YoY, driven by Emerging Markets, including Asia Pacific

Q1 2019 results 26 April 2019
Deutsche BankInvestor Relations
16
Higher / (lower) in %
Q1 2019vs.
Q1 2018vs.
Q4 2018
Revenues Revenues 525) (4) 2( — Revenues declined on lower management fees following market declines and net outflows in 2018
— Management actions to reduce costs more than offset the decline in revenues
— Noninterest expenses declined reflecting the absence of litigation and ongoing reductions in non-compensation costs
— Profit before tax increased by 34%, 77% excluding the € 31m in noncontrolling interests following the IPO in Q1 2018
— Net flows of € 2bn in Q1 2019 (€ 7bn, excluding cash products) with strong inflows in Passive and Alternatives as well as in key flagship Equity and Multi-Asset funds
Costs
Noninterest expenses 398) (16) (7)
of which: Adjusted costs 395) (11) 3(
Cost/income ratio (in %) 76) (11) ppt (7) ppt
Profitability
Profit before tax 96) 34 64)
Post-tax RoTE (in %)(1) 15.2) (6.5) ppt 5.5) ppt
Mgmt fee margin (in bps)(2) 30.0) (1.0) bps (0.3) bps
AuM (€ bn)
Assets under Management 706) 4) 6)
Net flows 2) n.m. n.m.
(1) Post-tax return on tangible shareholders’ equity based on allocation of tangible shareholders’ equity of € 1.8bn for Q1 2019 (prior year period € 1.0bn for Q1 2018), applying a 28% tax rate for 2019 and 28% tax rate for 2018
(2) DWS disclosed margin. AM reported management margin of 30.1 bps for Q1 2019. Annualised management fees divided by average Assets under Management
Asset Management (AM)€ m, unless stated otherwise
Q1 2019 YoY comments

Q1 2019 results 26 April 2019
Deutsche BankInvestor Relations
17
Corporate & Other (C&O)€ m, unless stated otherwise
Profit before tax
Q1 2018 Q4 2018 Q1 2019
(1) Valuation and Timing (V&T) reflects the mismatch in revenue from instruments accounted on an accrual basis under IFRS that are economically hedged with derivatives that are accounted for on a mark-to-market basis
(2) Reversal of noncontrolling interests reported in operating business segments (mainly AM)
(167)
(98)
(4)
Higher / (lower)
Q1 2019 vs. Q1 2018
vs. Q4 2018
Profit before tax (4) 163) 94)
Funding & liquidity (13) 41) 44)
Valuation & Timing differences(1) 41) 6) (56)
Shareholder expenses (115) (18) (8)
Noncontrolling interest(2) 32) 29) 5)
Other 51) 106( 109)

Q1 2019 results 26 April 2019
Deutsche BankInvestor Relations
Outlook
18
Working towards near-term targets – focused on factors within our direct control
Well on track to reach adjusted cost target of € 21.8bn
Targeting continued growth in loans and AuM to drive revenue growth
Expect to maintain a CET1 ratio above 13% and a strong liquidity profile
Provisions for credit losses expected to remain in the mid-teens in terms of bps of loans

Q1 2019 results 26 April 2019
Deutsche BankInvestor Relations
19
Appendix

Q1 2019 results 26 April 2019
Deutsche BankInvestor Relations
Specific revenue items and adjusted costs€ m
20
Q1 2019 Q1 2018 Q4 2018
CIB PCB AM C&O Group CIB PCB AM C&O Group CIB PCB AM C&O Group
Revenues 3,328 2,513 525 (15) 6,351 3,845 2,640 545 (54) 6,976 2,597 2,458 514 6 5,575
DVA - CIB Other (49) - - - (49) 61 - - - 61 67 - - - 67
Change in valuation of an investment - Sales & Trading (FIC)
36 - - - 36 84 - - - 84 56 - - - 56
Sal. Oppenheim workout - Wealth Management
- 43 - - 43 - 14 - - 14 - 35 - - 35
Gain from property sale in Sal. Oppenheim- Wealth Management
- - - - - - - - - - - 40 - - 40
Gain from property sale - Private and Commercial Business (Germany)
- - - - - - 156 - - 156 - - - - -
Revenues excl. specific items 3,341 2,470 525 (15) 6,320 3,700 2,470 545 (54) 6,661 2,474 2,382 514 6 5,376
Noninterest expenses 3,393 2,108 398 20 5,919 3,643 2,227 473 114 6,457 2,789 2,292 427 133 5,642
Impairment of goodwill and other intangible assets - - - - - - - - - - - - - - -
Litigation provisions / (releases) 3 (23) (1) 3 (17) 58 (20) 27 2 66 (1) 23 16 1 39
Restructuring and severance 23 (18) 4 (3) 6 27 9 4 0 41 56 77 27 21 181
Adjusted costs 3,367 2,149 395 20 5,930 3,558 2,238 442 112 6,350 2,734 2,191 384 112 5,422

Q1 2019 results 26 April 2019
Deutsche BankInvestor Relations
Adjusted costs trends – Q1 2019€ m, unless stated otherwise
Q1 2019
Q1 2018 YoY
Q1 2018 ex
FX(1)
YoYex FX
Q42018 QoQ
Q4 2018 ex
FX(1)
QoQex FX
Compensation and benefits 2,842 2,960 (4)% 3,020 (6)% 2,824 1% 2,836 0%
IT costs 954 1,022 (7)% 1,044 (9)% 957 (0)% 962 (1)%
Professional service fees 316 392 (19)% 404 (22)% 389 (19)% 391 (19)%
Occupancy 414 435 (5)% 442 (6)% 411 1% 413 0%
Communication, data services, marketing 206 223 (7)% 228 (9)% 223 (7)% 223 (8)%
Other 592 654 (9)% 672 (12)% 611 (3)% 608 (3)%
Adjusted costs ex Bank levies 5,326 5,686 (6)% 5,810 (8)% 5,415 (2)% 5,433 (2)%
Bank levies 604 663 (9)% 663 (9)% 7 n.m. 7 n.m.
Adjusted costs 5,930 6,350 (7)% 6,474 (8)% 5,422 9% 5,440 9%
Impairment of goodwill and other intangible assets - - - - - - - - -
Litigation expenses / (releases) (17) 66 n.m. 72 n.m. 39 n.m. 39 n.m.
Restructuring & severance 6 41 (84)% 43 (85)% 181 (96)% 181 (96)%
Restructuring (17) (1) n.m. 0 n.m. 102 n.m. 102 n.m.
Severance 23 42 (44)% 42 (45)% 79 (71)% 80 (71)%
Noninterest expenses 5,919 6,457 (8)% 6,588 (10)% 5,642 5% 5,661 5%
(1) To exclude the FX effects the prior quarter figures were recalculated using the corresponding current quarter’s monthly FX rates
21
Rec
onci
liatio
nad
just
edco
sts
tono
nint
eres
texp
ense
s

Q1 2019 results 26 April 2019
Deutsche BankInvestor Relations
Litigation update€ bn, unless stated otherwise
22
Litigation provisions(1)
Contingent liabilities(1,2)
― Further progress has been made in resolving legacy matters throughout the quarter
― Decrease in provisions predominately due to payments for past settlements, releases for lower-than-expected settlements or agreements-in-principle to settle, partially offset by additions for matters in resolution stage
― Provisions include approximately € 0.1bn related to settlements already achieved or agreed in principle
― Contingent liabilities remained stable in Q1 2019 compared to Q4 2018
Note: Figures reflect current status of individual matters and are subject to potential further developments(1) Includes civil litigation and regulatory enforcement matters(2) Includes possible obligations where an estimate can be made and outflow is more than remote but less than probable for significant matters
7.6
2.01.2 1.1
31 Dec 201731 Dec 2016 31 Dec 2018 31 Mar 2019
2.32.7 2.7 2.7
31 Dec 2016 31 Dec 201831 Dec 2017 31 Mar 2019

Q1 2019 results 26 April 2019
Deutsche BankInvestor Relations
Indicative regional currency mix Q1 2019
AM
USD
GBP
EUR
Group
Other (1)
PCBCIB
45%
88%
63%55%
0%
0%
13%
1%31%
3%19%
29%
24%
8% 6%15%
AM
USD
GBP
EUR
Group
Other (1)
PCBCIB
18%
86%
50% 49%
35%
1%
16% 18%
30%
4%
28%21%
17%8% 6%
13%
Note: Classification is based primarily on the currency of DB’s Group office in which the Revenues and Noninterest expenses are recorded and therefore only provide an indicative approximation
(1) Primarily includes Singapore Dollar, Indian Rupee, and Hong Kong Dollar
23
Net revenues Total noninterest expenses

Q1 2019 results 26 April 2019
Deutsche BankInvestor Relations
24
Loan book€ bn
Note: Loan amounts are gross of allowances for loan losses (1) PCB Germany includes PCB Germany (DBfD) and Digital ventures business(2) Exited businesses includes operations in Poland for Q1 2019 and all quarters of 2018(3) Corporate & Other mainly comprise the Liquidity Deployment Program
190 191 193 195 196
31 31 31 32 32
127 128 132 135 140
0
37
Q1 2018
2
39
70Q2 2018
39
2
40
20
Q4 20180
398
PCB Germany(1)
2
Q1 2019
Corporate &Investment Banking
Wealth Management
PCB (International)
Q3 2018
PCB (Exited)(2)
7
395
Corporate & Other(3)
392405
415
42

Q1 2019 results 26 April 2019
Deutsche BankInvestor Relations
Loan book compositionIFRS loans at amortized cost, 31 March 2019
34%
10%
7%6%4%
6%
6%
16%
1%
Business Finance
Germanmortgages
Wealth Management
Consumer Finance
PCB other(1)
International mortgages
1%
PCB non-strategic(2)
CommercialReal Estate(3)
1%CIB non-strategic
CIB Other(4)
1%Leveraged Debt Capital Markets
Asset backed securities
Global Transaction Bank
Corporate & Investment BankPrivate & Commercial Bank
25
— Well diversified Loan Portfolio— 2/3rd of the loan portfolio is in PCB, mainly
including German retail mortgages and Wealth Management
— 1/3rd of the loan portfolio is in CIB, around half are loans to Global Transaction Banking counterparties predominantly investment grade rated
— The remainder comprises well-secured, mainly asset backed loans, commercial real estate loans and collateralized financing as well as relationship loans managed within a concentration risk framework
— Deutsche Bank has high underwriting standards and a defined risk appetite across PCB and CIB portfolios
7%
Note: Figures may not sum due to rounding off difference. Loan amounts are gross of allowances(1) PCB other predominantly includes Postbank recourse CRE business and financial securities(2) PCB non-strategic includes a FX-mortgage portfolio in Poland(3) Commercial Real Estate Group in CIB and Postbank non-recourse CRE business(4) CIB Other comprises CIB relationship loans, FIC (excl. ABS & CRE) and Equities (Collateralized financing)

Q1 2019 results 26 April 2019
Deutsche BankInvestor Relations
Provision for credit losses and stage 3 loans under IFRS 9
26
Group
Provision for credit losses(% of loans)(1)
CIB
PCB
0.09%
(0.01)%
0.13%
88 86 87144
117
110
2390
Q1Q2
95
(3)Q3Q1
1
Q4
11
140
88
252
Corporate & Investment Banking (CIB)
Private & Commerical Bank (PCB)
2018
4.7 4.7 5.0 5.0 5.1
3.2 3.2 2.8 2.4 2.2
1.9 2.1 1.8 2.0 2.3
9.7
Q2Q1
10.0
Q3 Q4 Q1
9.7 9.4 9.6
CIB (ex-POCI) Purchased or Originated Credit Impaired (POCI)
PCB (ex-POCI)
GroupStage 3 at amortized cost %(2)
Group
Coverage Ratio (3)
CIB
PCB
2.5%
0.09%
0.01%
0.13%
0.09%
0.01%
0.13%
0.13%
0.09%
0.15%
0.13%
0.07%
0.17%
2.5% 2.4% 2.3% 2.3%
44%
35%
50%
44%
34%
51%
42%
36%
45%
44%
37%
47%
44%
42%
45%
Provision for credit losses, € m Stage 3 at amortised cost under IFRS 9, € bn
2019 2018 2019
Note: Provisions for credit losses in the Corporate & Other and Asset Management segments are not shown on this chart but are included in the DB Group totals(1) 2019 Year-to-date provision for credit losses annualized as % of loans at amortized cost (€ 415 bn as of 31 March 2019)(2) IFRS 9 stage 3 financial assets at amortized cost including POCI as % of loans at amortized cost (€ 415 bn as of 31 March 2019)(3) IFRS 9 stage 3 allowance for credit losses for financial assets at amortized cost excluding POCI divided by stage 3 financial assets at amortized cost excluding POCI

Q1 2019 results 26 April 2019
Deutsche BankInvestor Relations
Net interest income sensitivity€ bn, hypothetical +100bps parallel shift impact
27
First year Second year
1.6
0.8
PCB GroupCIB
0.8
Note: All estimates are based on a static balance sheet, excluding trading positions & Asset Management, and at constant exchange rates. The parallel yield curve shift by +100 basis points assumes an immediate increase of all interest rate tenors and no additional management action. Figures do not include Mark-to-Market / Other Comprehensive Income effects on centrally managed positions not eligible for hedge accounting
CIB
0.9
PCB Group
1.8
0.9
> 3M
≤ 3M
> 3M
≤ 3M
0.3
0.5
0.1
0.6
0.4
1.0
0.0
0.0
0.0
0.1
0.1
0.1
EU
RU
SD
0.5
0.3
0.1
0.6
0.7
0.9
0.0
0.0
0.1
0.1
0.1
0.1
> 3M
≤ 3M
> 3M
≤ 3M
EU
RU
SD

Q1 2019 results 26 April 2019
Deutsche BankInvestor Relations
Leverage exposure and Risk-weighted assetsCRD4, fully loaded, € bn
28
250
6464
7
86
CVA
31
Operational Risk RWA
224
31 Mar 2019
Market Risk RWA
Credit Risk RWA
347
136
Derivatives(1)
153
184
401
197
99
31 Dec 2018
166
347
108
179
86
36
Lending commitments(2)
25
Lending
37
112
31 Mar 2019
43174
Trading assets
Reverse repo /securitiesborrowed
Cash and depositswith banks
Other
117103
198
100
411
1,273 1,345
31 Mar 2019
Leverage exposure Risk-weighted assets
(1) Excludes any related market risk RWA which has been fully allocated to non-derivatives trading assets(2) Includes contingent liabilities

Q1 2019 results 26 April 2019
Deutsche BankInvestor Relations
Level 3 assets € bn, as of 31 March 2019
(1) Additional value adjustments deducted from CET 1 capital pursuant to Article 34 of Regulation (EU) No. 575/2013 (CRR)
— Level 3 assets arise from the bank’s activities in various markets, some of which are less liquid
— Level 3 assets are mainly booked in core businesses
— Level 3 classification is not an indicator of risk or asset quality, but rather an accounting indicator of valuation uncertainty due to lack of observability of at least one valuation parameter
— Variety of mitigants to valuation uncertainty:
— Valuation techniques and pricing models maximize the use of relevant observable inputs
— Exchange of collateral with derivative counterparties
— Uncertain input often hedged – e.g. in Level 3 liabilities
— Prudent valuation capital deductions(1)
specific to Level 3 balances of ~€ 0.6bn
4
9 DerivativeAssets
3
7Loans
Debtsecurities
Other
1Equity securities
1Mortgage backed securities
Assets (total: € 25bn)
29

Q1 2019 results 26 April 2019
Deutsche BankInvestor Relations
30
Stressed VaR(1)
VaR
Q1 2018 Q1 2019
∅ 87 ∅ 81 ∅ 87
Q2 2018
∅ 74
Q3 2018 Q4 2018
∅ 95
(1) Stressed Value-at-Risk is calculated on the same portfolio as VaR but uses historical market data from a period of significant financial stress (i.e. characterized by high volatilities and extreme price movements)
Trading book Value at Risk€ m, unless stated otherwise, DB Group, 99%, 1 day
Quarterly average
∅ 28 ∅ 26 ∅ 27∅ 25 ∅ 30
10
30
50
70
90
110
130

Q1 2019 results 26 April 2019
Deutsche BankInvestor Relations
Non-strategic legacy assets in CIB€ bn
Background
― Non-strategic portfolio created to facilitate the run-down of residual ex-CIB assets from NCOU and other inventory not consistent with the CIB strategy
Recent Performance
― Risk weighted assets reduced by almost a third, driven mainly by Shipping portfolio sales and by disposals from the ex-NCOU portfolio
― Leverage exposure reduced by more than a third, driven mainly by run off in the single name CDS portfolio
― Revenues were positive in Q1 2019
― Portfolio now primarily contains legacy Derivative inventory in Rates and Credit.
― Portfolio roll off expected to generate additional reductions in balances in coming years, but likely at a slower rate than in 2017 and 2018
Risk weighted assets excluding operational risk
Leverage exposure
(30)%
10
7
31/12/17 31/12/18
35
21
31/12/17 31/12/18
(40)%
31 Mar 2018 31 Mar 2019
31 Mar 2018 31 Mar 2019
31

Q1 2019 results 26 April 2019
Deutsche BankInvestor Relations
Reconciliation of AM reported segment to DWS standalone€ m, unless stated otherwise
32
Note: Q1 2019 based on consolidated basis, whereas Q1 2018 is based on combined basis for DWS(1) Sold and discontinued business includes the sale of DB Private Equity GmbH, the US Private Equity Access Fund platform and Abbey Life(2) Other perimeter adjustments include adjustments for treasury allocations, IPO related costs and adjustments due to differences in accounting for DWS and AM segment(3) Full-time equivalents
Perimeter adjustments
AM reportedQ1 2019
Sold & discontinued business(1)
Other perimeter adjustments(2)
DWS reportedQ1 2019
Revenues 525 (0) 9 534Noninterest expenses (398) 0 11 (387)Noncontrolling interests (31) 0 31 0Profit before tax 96 0 51 148AuM (€bn) 706 0 (1) 704FTE (3) (#) 4,055 0 (584) 3,471
Perimeter adjustments
AM reportedQ1 2018
Sold & discontinued business(1)
Other perimeter adjustments(2)
DWS reportedQ1 2018
Revenues 545 10 4 559Noninterest expenses (473) 39 12 (423)Noncontrolling interests (0) 0 0 0Profit before tax 72 48 17 137AuM (€bn) 678 (2) (11) 665FTE (3) (#) 4,056 (26) (786) 3,244

Q1 2019 results 26 April 2019
Deutsche BankInvestor Relations
Assets under Management / Client Assets – PCB€ bn
33
(1) Assets under Administration include assets over which DB provides non investment services such as custody, risk management, administration and reporting as well as current accounts / non-investment deposits
(2) Deposits are considered assets under management if they serve investment purposes. In Private and Commercial Businesses, this includes all time deposits and savings deposits. In Wealth Management, it is assumed that all customer deposits are held with us primarily for investment purposes; Wealth Management deposits under discretionary and wealth advisory mandate type were reported as Investment products
(3) Investment Products also include Insurances (4) Regional view is based on a client view(5) Net flows as reported also include shifts between asset classes
Q1 2018 Q2 2018 Q3 2018 Q4 2018 Q1 2019Assets under Management 497 503 499 474 502Assets under Administration (1) 217 220 220 223 229Client Assets 715 723 719 696 731
Private and Commercial Business (Germany) 329 333 338 334 347Private and Commercial Business (International) 78 78 78 75 78Wealth Management (Global) 299 303 295 283 302Exited businesses 9 8 8 4 4
Breakdown of Assets under Management 497 503 499 474 502Private and Commercial Business (Germany) 220 221 222 215 227
therein: Deposits (2) 114 114 114 115 120therein: Investment Products (3) 107 107 108 99 107
Private and Commercial Business (International) 60 60 60 57 59therein: Deposits (2) 10 10 10 10 10therein: Investment Products (3) 51 50 50 47 49
Wealth Management (Global) 211 216 211 199 213by product:
Deposits (2) 55 55 53 52 54Investment Products (3) 155 160 159 146 159
by region: (4)
Americas 29 30 30 26 28Europe 124 126 123 116 121Emerging Markets 58 60 58 57 64
Exited businesses 6 6 6 3 3
Net flows - Assets under Management 1.5 0.7 (3.3) (0.6) 7.9Private and Commercial Business (Germany) 0.8 0.3 (0.1) 1.5 5.3
therein: Deposits (2),(5) (0.5) 0.4 (0.3) 1.7 4.8therein: Investment Products (3),(5) 1.2 (0.1) 0.3 (0.2) 0.5
Private and Commercial Business (International) 0.6 (0.3) 0.2 (0.5) (0.5)therein: Deposits (2),(5) (0.0) 0.1 0.4 0.1 (0.3)therein: Investment Products (3),(5) 0.7 (0.4) (0.2) (0.6) (0.2)
Wealth Management (Global) (0.0) 0.6 (3.4) (1.6) 2.9therein: Deposits (2),(5) 2.3 (1.2) (2.7) (0.1) 1.5therein: Investment Products (3),(5) (2.3) 1.8 (0.7) (1.5) 1.4
Exited businesses 0.1 (0.0) 0.0 0.0 0.1

Q1 2019 results 26 April 2019
Deutsche BankInvestor Relations
EmployeesFull-time equivalents
34
YoY ∆
31 Mar 2019 31 Mar 2018 Absolute Of which disposals 30 Jun 2018 30 Sep 2018 31 Dec 2018
CIB 17,117 17,892 (775) (132) 17,052 16,921 16,764
PCB 41,392 43,785 (2,393) (1,419) 43,614 43,449 41,687
AM 4,055 4,056 (1) (25) 4,027 4,032 4,031
C&O 28,900 31,397 (2,497) (289) 30,735 30,315 29,255
Group 91,463 97,130 (5,667) (1,865) 95,429 94,717 91,737

Q1 2019 results 26 April 2019
Deutsche BankInvestor Relations
Cautionary statements
35
This presentation contains forward-looking statements. Forward-looking statements are statements that are nothistorical facts; they include statements about our beliefs and expectations and the assumptions underlying them.These statements are based on plans, estimates and projections as they are currently available to the management ofDeutsche Bank. Forward-looking statements therefore speak only as of the date they are made, and we undertake noobligation to update publicly any of them in light of new information or future events.
By their very nature, forward-looking statements involve risks and uncertainties. A number of important factors couldtherefore cause actual results to differ materially from those contained in any forward-looking statement. Such factorsinclude the conditions in the financial markets in Germany, in Europe, in the United States and elsewhere from whichwe derive a substantial portion of our revenues and in which we hold a substantial portion of our assets, thedevelopment of asset prices and market volatility, potential defaults of borrowers or trading counterparties, theimplementation of our strategic initiatives, the reliability of our risk management policies, procedures and methods,and other risks referenced in our filings with the U.S. Securities and Exchange Commission. Such factors are describedin detail in our SEC Form 20-F of 22 March 2019 under the heading “Risk Factors.” Copies of this document arereadily available upon request or can be downloaded from www.db.com/ir.
This presentation also contains non-IFRS financial measures. For a reconciliation to directly comparable figuresreported under IFRS, to the extent such reconciliation is not provided in this presentation, refer to the Q1 2019Financial Data Supplement, which is accompanying this presentation and available at www.db.com/ir.