Embed Size (px)
Citation preview

Q1 2014 RESULTSINVESTORS PRESENTATION
14 May 2014
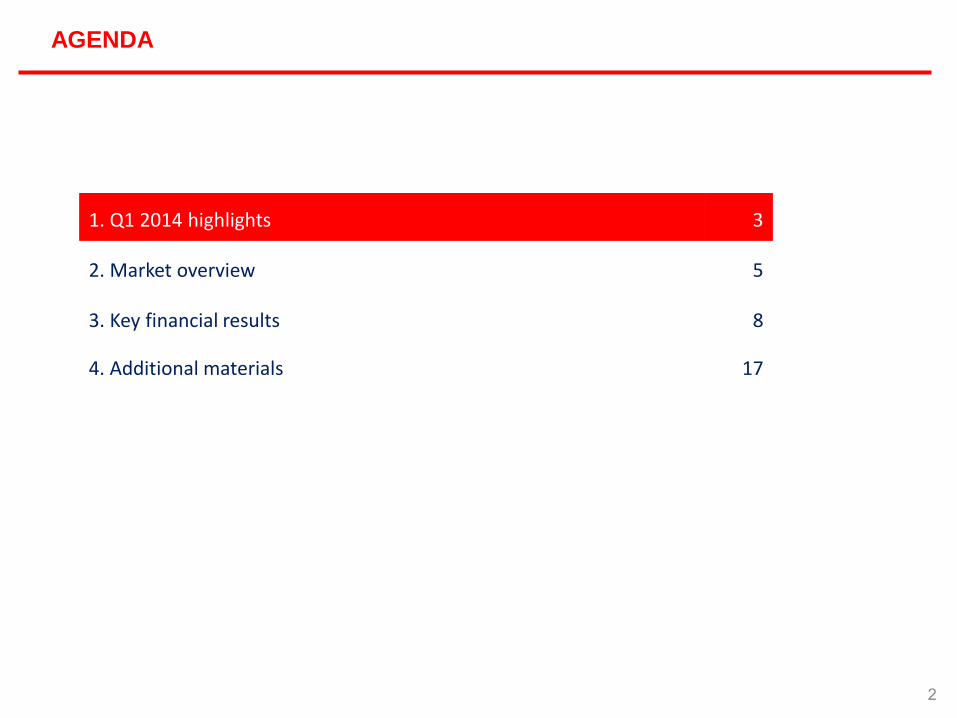
AGENDA
2
1. Q1 2014 highlights 3
2. Market overview 5
3. Key financial results 8
4. Additional materials 17

Significant improvement in liquidity situation:
• Capital increase of €52m
• Bonds issue of €48m
Repayment of €105m bonds in April
Operating results sustained from Q4 2013
• Rental margin at 72%
• Cash generated from operation at €12m
Progress in Galeria Wilanów and Galeria Północna projects
• Galeria Północna - further land acquisition
• Galeria Wilanów - SKO rejected environmental protests
Q1 2014 HIGHLIGHTS I Q1 2014 HIGHLIGHTS & ACHIEVEMENTS
3

AGENDA
4
1. Q1 2014 highlights 3
2. Market overview 5
3. Key financial results 8
4. Additional materials 17

5
MARKET OVERVIEW I OFFICE MARKET
5
Prime rent (€/sq m/mth) and vacancy rate (%)*
15
21
24
19
16 15
1916%
14%12%
15%
10%
15%
19%
0%
5%
10%
15%
20%
0
5
10
15
20
25
Zagreb Prague Warsaw Bucharest Belgrade Bratislava Budapest
Prime rent (EUR/sq m/mth) Vacancy rate (%)
Completions, gross take-up and future supply ('000 sq m)*
43
4
84
23 148
48
136
4927 3726
156
320
144
4
43 54
0
50
100
150
200
250
300
350
Zagreb Prague Warsaw Bucharest Belgrade Bratislava Budapest
Completions ('000 sq m) Gross take-up ('000 sq m) Future supply ('000 sq m)
*Based on Jones Lang LaSalle market reports

MARKET OVERVIEW I RETAIL MARKET
Prime rent (€/sq m/mth)*
45
95100
7060
7065
0
20
40
60
80
100
120
Zagreb Prague Warsaw Bucharest Belgrade Bratislava Budapest
Prime rent (EUR/sq m/mth)
6 6*Based on Jones Lang LaSalle martket reports

AGENDA
7
1. Q1 2014 highlights 3
2. Marekt overview 5
3. Key financial results 8
4. Additional materials 17

8
Total portfolio by sector
Office57%
Retail35%
Residential8%
Total: €1,501m*
• Income generating assets amounted to €1.1 billion (75%
of total portfolio)
• Poland remains key country with 39% of income generating
assets
Income generating assets** - value by country
As of 31 March 2014
Total: 1,127m
Income generating assets** – NLA by country
Total: 584k sq m
** Excludes attributable value for assets in Czech Republic where GTC holds minority stakes
As of 31 March 2014
Poland€443m
39%
Romania €193m
17%
Croatia €143m
13%
Hungary
€162m 14%
Serbia€106m
9%
Bulgaria €65m
6%
Slovakia €16m
1%
Poland33%
Hungary16%
Romania18%
Serbia9%
Croatia11%
Bulgaria11%
Slovakia2%
PORTFOLIO OVERVIEW
* Excludes attributable value for assets in Czech Republic where GTC holds minority stakes
8
As of 31 March 2014
* Excludes € 118m of investment in associates and 50% joint ventures (Russia, Ukraine, Czech Rep., Ana Tower)

KEY FINANCIAL RESULTS I INTRODUCTION OF IFRS 11
9
IFRS 11 was introduced as of 1 January 2014 with restatement of 2013 financials:
• Investment in 50% JVs is no longer proportionally consolidated but presented
as investment in associates and joint ventures
• The main impact on 2013 financials:
(€ m)
Investment property (21)
Investment in associates and joint ventures 85
Cash (74)
Total equity and liabilities (32)
Gross margin from operations (6)
Loss from revaluation/ impairment of assets 5
Profit (loss) before tax 11
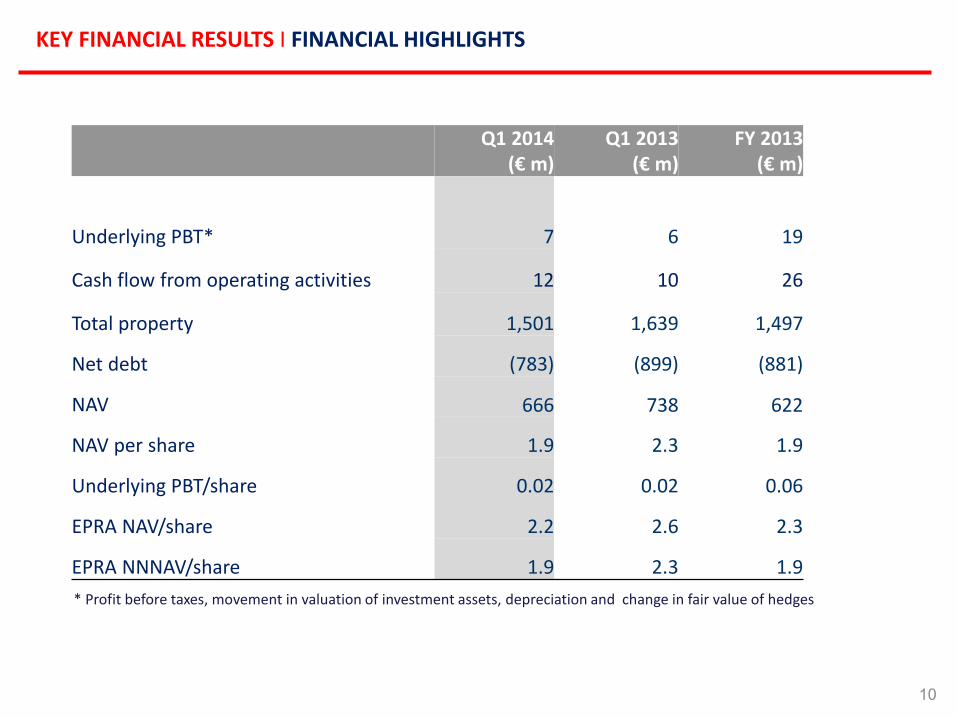
KEY FINANCIAL RESULTS I FINANCIAL HIGHLIGHTS
10
Q1 2014(€ m)
Q1 2013(€ m)
FY 2013(€ m)
Underlying PBT* 7 6 19
Cash flow from operating activities 12 10 26
Total property 1,501 1,639 1,497
Net debt (783) (899) (881)
NAV 666 738 622
NAV per share 1.9 2.3 1.9
Underlying PBT/share 0.02 0.02 0.06
EPRA NAV/share 2.2 2.6 2.3
EPRA NNNAV/share 1.9 2.3 1.9
* Profit before taxes, movement in valuation of investment assets, depreciation and change in fair value of hedges

KEY FINANCIAL RESULTS I BALANCE SHEET
11
Investment property increased due to:
• Progress of Pascal construction
• Acquisition of land for Galeria Północna
Average occupancy: 91% (91% on 31 Dec 2013)
Liquidity situation has significantly improved
• €52m of new capital
• €48m of new bonds
• €47m proceeds from sale of Galeria Kazimierz
Cash balance of €192m (€34m deposits)
Current liabilities include €105m bonds (and hedges)
repaid in April 2014
Residential inventory is gradually being sold
• €3m in Q1 2014
(€ m) 31 March 2014 December 2013
Investment property and L.T. assets (inc. IPUC) 1,386 1,376
Investment in shares and associates 118 120
Cash 192 56
Deposits 34 32
Inventory 115 121
Other current assets 21 18
TOTAL ASSETS 1,866 1,723
Equity 627 576Long term financial debt 881 780
Other long term provisions & payables 142 138Current portion of long term loans 184 197
Trade payables 31 31
TOTAL EQUITY AND LIABILITIES 1,866 1,723

KEY FINANCIAL RESULTS I DEBT AND LTV
12
As at 31 March 2014 31 December 2013(€ m) (€ m)
Long-term bank debt and financial liabilities 885 784
Short-term bank debt and financial liabilities
184 197
Total bank debt and financial liabilities 1,070 981
Cash & cash equivalents and deposits 226 88
Loans from Galeria Kazimierz 61 12
Net debt and financial liabilities 783 881
Total property 1,501 1,497
Loan to value ratio 52% 59%
Average interest rate 4.3% 4.3%
Interest cover 3.14 1.68

70
58 36 108182
388
105 63
55
0
200
400
31 March'15* 31 March'16 31 March'17 31 March'18 31 March'19 31 March'20 and beyond
175 171237
13
€m
KEY FINANCIAL RESULTS I DEBT AND MATURITY SCHEDULE
Debt split
Bonds
*Including hedges
Unsecured debt
30%
Secured debt 70%
As of 31 March 2014
Debt maturity
As of 31 March 2014
Corporate bonds and
loans from minorities in
subsidiaries
Project loans
13
EUR79%
Other currencies21%
13
Interest rate split
Fixed/hedged 45%Floating
55%
As of 31 March 2014
* Other currencies include PLN and HUF

14
KEY FINANCIAL RESULTS I INCOME STATEMENT
14
Q1 2014 Q1 2013 FY 2013
(€ m ) (€ m ) (€ m )
Rental and service revenue 27 28 110
Cost of rental operations (8) (8) (31)
Rental margin 72% 70% 71%
Residential sale result 1 - 1
Gross margin from operations 20 20 78
Selling expenses (1) (1) (3)
G&A expenses w/o share based provision
(3) (3) (11)
Loss from revaluation of Invest.property and impairment
(2) (25) (185)
Financial expenses, net (11) (12) (43)
Share of profit (loss) of associates - - 4
Profit/(loss) for the period (2) (26) (177)
KEY FINANCIAL RESULTS I CASH FLOW HIGHLIGHTS
15
Cash from operating activities at €12m
Net cash at 31 March 2014 at €192m(€34m deposits)
Post balance sheet bonds repaymentdecreased the cash and liabilities by€105m
Q1 2014(€ m)
Q1 2013(€ m)
FY 2013 (€ m)
Operating cash before w. capital changes 16 15 61
Add / deduct:
Decrease in residential inventory 3 3 12
Interest paid, net (6) (8) (45)
Tax (1) - (2)Cash flow from operating activities 12 10 26
Investment in real estate and related (12) (8) (30)
VAT - (36) (35)
Changes in working capital (3) (3) (1)Investment in real estate and related (15) (47) (66)
Finance activity
Sale of assets 47 33 33
Proceeds from issuance of shares, net 54 - -
Proceeds from long term borrowings net of cost 48 - 43
Repayment of long term borrowings/bonds (8) (24) (205)Finance activity 141 9 (128)
Efect of currency translation (2) - -Net change 136 (28) (167)
Cash at the beginning of the period 56 225 225
Cash at the end of the period 192 197 56

AGENDA
16
1. Q1 2014 highlights 3
2. Marek overview 5
3. Key financial results 8
4. Additional materials 17

ADDITIONAL MATERIALS I NET DEBT
17
As at31 March 2014
(€ m)31 March 2013
(€ m) 31 December 2013
(€ m)
Gross debt 1,038 1,067 949
Market value of derivatives 32 67 33
1,070 1,134 981
Cash and deposits (226) (223) (88)
Loan from Galeria Kazimierz 61 12 12
EPRA adjustments - - -
Net debt (EPRA basis) 783 899 881
Average interest rate 4.3% 5.0% 4.3%
Interest cover during the period 3.14 2.36 1.68

ADDITIONAL MATERIALS I RECONCILIATION OF UNDERLYING PBT
18
As at
31 March 2014 31 March 2013 31 December 2013
(€ m) (€ m) (€ m)
IFRS Profit/ (Loss) before tax 3 (21) (162)
Valuation movement (includesdisposals)
2 25 185
Foreign exchange differences, net 1 2 1
Amortisation of intangible asset - - 2
Loss from associates - - (4)
Other non-recurring items 1 (1) (3)
Underling profit before tax 7 6 19

ADDITIONAL MATERIALS I EPRA BALANCE SHEET
19
As at
31 March2014(€ m)
31 March2013(€ m)
31 December2013(€ m)
Total property 1,501 1,639 1,497
Net debt (783) (899) (881)
Other net liabilities (91) (22) (40)
Non-controlling interest 39 20 46
EPRA NNNAV 666 738 622
EPRA NNNAV per share (Euro) 1.9 2.3 1.9
Deferred tax arising on revaluation movements
116 104 112
Mark-to-market of debt and derivatives - - -
EPRA NAV 782 842 734
EPRA NAV per share 2.2 2.6 2.3

As of 31 March 2014
* pro-rata to GTC Holding
ADDITIONAL MATERIALS I PORTFOLIO OF INCOME GENERATING PROPERTIES
20
Poland Hungary Serbia Croatia Romania Bulgaria Slovakia Subtotal Czech* Total
Office properties
Number of assets 11 3 3 - 1 - 1 19 2 21
GTC consolidated share of NLA, ths. sq m
144 91 53 - 48 - 13 350 11 360
Total, NLA, ths. sq m 144 91 53 - 48 - 13 350 35 385
Book Value, € m 293 162 106 - 158 - 16 734 20 754
Average Rent, €/sq m 14.9 12.0 16.6 - 19.7 - 9.8 14.8 13.3 14.8
Average occupancy 92% 93% 95% - 93% - 63% 91% 66% 91%
Retail properties
Number of assets 1 - - 2 3 2 - 8 1 9
GTC consolidated share of NLA, ths. sq m
49 - - 65 59 61 - 234 13 247
Total, NLA, ths. sq m 49 - - 65 59 61 - 234 41 275
Book Value, € m 150 - - 143 35 65 - 393 38 431
Average Rent, €/sq m 20.3 - - 14.6 3.8 7.1 - 11.0 16.2 11.2
Average occupancy 89% - - 90% 89% 89% - 89% 95% 90%
Total 0 0
Number of assets 12 3 3 2 4 2 1 27 3 30
GTC consolidated share of NLA, ths. sq m
193 91 53 65 107 61 13 584 24 608
Total, NLA, ths. sq m 193 91 53 65 107 61 13 584 76 659
Book Value, € m 443 162 106 143 193 65 16 1 127 58 1 185
Average Rent, €/sq m 16.2 12.0 16.6 14.6 10.9 7.1 9.8 13.3 14.9 13.3
Average occupancy 91% 93% 95% 90% 91% 89% 63% 91% 82% 91%

21
Type Retail
Leasable area 61,000 sq m
Total costs (1st phase) €170m
LTC ratio (1st phase) 65%
Loan value (1st phase) €110m
Total equity invested to date (1st phase)
€26m
Total to invest (1st phase) €34m
Expected NOI (1st phase) €19m
Annual return on equity (1st phase) 23%
Cash – on – cash return 11%
Potential developer’s pre-tax profit based on 6% exit yield
€146m
Galeria Wilanów (Warsaw)
ADDITIONAL MATERIALS I NEW DEVELOPMENTS
Galeria Północna (Warsaw)
Type Retail
Leasable area 64,000 sq m
Total costs €178m
LTC ratio 65%
Loan value €115m
Total equity invested to date €39m
Total to invest €24m
Expected NOI €18m
Annual return on equity 20%
Cash – on – cash return 10%
Potential developer’s profit based on 6% exit yield
€122m
21
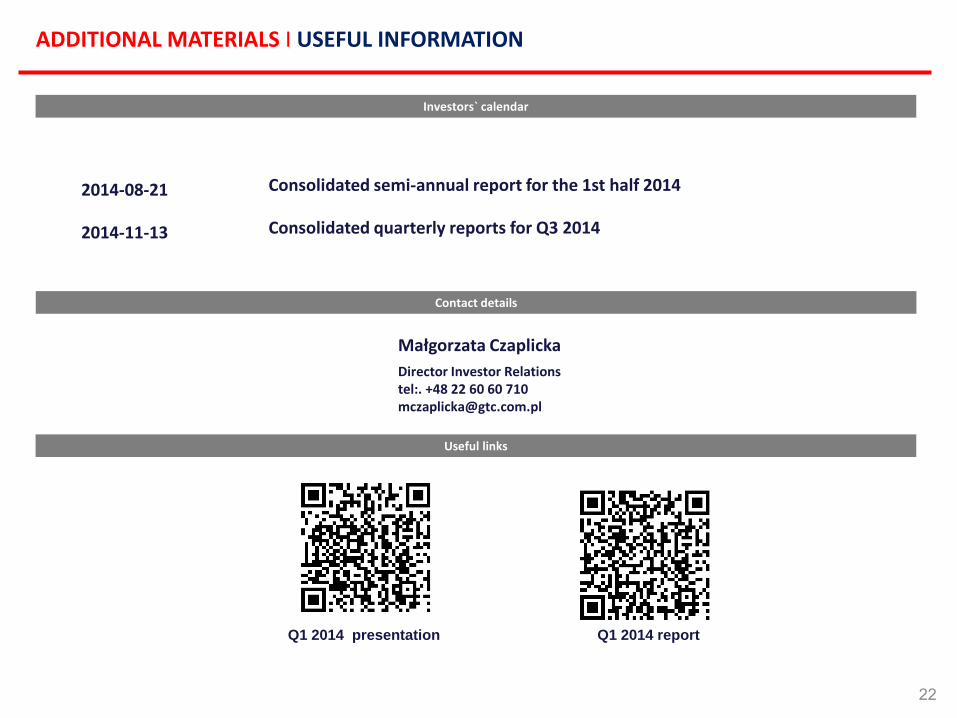
2014-08-21 Consolidated semi-annual report for the 1st half 2014
2014-11-13 Consolidated quarterly reports for Q3 2014
Contact details
Małgorzata Czaplicka
Director Investor Relationstel:. +48 22 60 60 [email protected]
Useful links
Q1 2014 presentation Q1 2014 report
ADDITIONAL MATERIALS I USEFUL INFORMATION
22
Investors` calendar

THIS PRESENTATION IS NOT FOR RELEASE, DIRECTLY OR INDIRECTLY, IN OR INTO THE UNITED STATES OF AMERICA, AUSTRALIA, CANADA OR JAPAN.
THIS PRESENTATION IS NOT AN OFFER TO SELL OR THE SOLICITATION OF AN OFFER TO BUY ANY SECURITIES. BY ATTENDING OR VIEWING THIS PRESENTATION, YOUACKNOWLEDGE AND AGREE TO BE BOUND BY THE FOLLOWING LIMITATIONS AND RESTRICTIONS.
This presentation (the ”Presentation”) has been prepared by Globe Trade Centre S.A. (”GTC S.A.”, the “Company”) solely for use by its clients and shareholders oranalysts and should not be treated as a part of any an invitation or offer to sell any securities, invest or deal in or a solicitation of an offer to purchase any securitiesor recommendation to conclude any transaction, in particular with respect to securities of GTC S.A.The information contained in this Presentation is derived from publicly available sources which the Company believes are reliable, but GTC S.A. does not make anyrepresentation as to its accuracy or completeness. GTC S.A. shall not be liable for the consequences of any decision made based on information included in thisPresentation.
The information contained in this Presentation has not been independently verified and is, in any case, subject to changes and modifications. GTC S.A.’s disclosure ofthe data included in this Presentation is not a breach of law for listed companies, in particular for companies listed on the Warsaw Stock Exchange. The informationprovided herein was included in current or periodic reports published by GTC S.A. or is additional information that is not required to be reported by the Company asa public company.In no event may the content of this Presentation be construed as any type of explicit or implicit representation or warranty made by GTC S.A. or, its representatives.Likewise, neither GTC S.A. nor any of its representatives shall be liable in any respect whatsoever (whether in negligence or otherwise) for any loss or damage thatmay arise from the use of this Presentation or of any information contained herein or otherwise arising in connection with this Presentation.
GTC S.A. does not undertake to publish any updates, modifications or revisions of the information, data or statements contained herein should there be any changein the strategy or intentions of GTC S.A., or should facts or events occur that affect GTC S.A.’s strategy or intentions, unless such reporting obligations arises underthe applicable laws and regulations.
GTC S.A. hereby informs persons viewing this Presentation that the only source of reliable data describing GTC S.A.’s financial results, forecasts, events or indexes arecurrent or periodic reports submitted by GTC S.A. in satisfaction of its disclosure obligation under Polish law.This presentation does not constitute or form part of and should not be construed as, an offer to sell, or the solicitation or invitation of any offer to buy or subscribefor or underwrite or otherwise acquire, any securities of GTC S.A., any holding company or any of its subsidiaries in any jurisdiction or any other person, nor aninducement to enter into any investment activity. In particular, this presentation does not constitute an offer of securities for sale into the United States. Nosecurities of GTC S.A. have been or will be registered under the U.S. Securities Act, or with any securities regulatory authority of any State or other jurisdiction in theUnited States, and may not be offered or sold within the United States, absent registration or an exemption from, or in a transaction not subject to, the registrationrequirements of the Securities Act of 1933, as amended, and applicable state laws.The distribution of this presentation and related information may be restricted by law in certain jurisdictions and persons into whose possession any document orother information referred to herein comes should inform themselves about and observe any such restrictions. Any failure to comply with these restrictions mayconstitute a violation of the securities laws of any such jurisdiction.
DISCLAIMER
23

Thank you
Globe Trade Centre S.A. 5 Woloska street, Taurus Building, 02-675 Warsaw, Poland