Embed Size (px)
Citation preview

Q
Industry~ Trade Summary Saturated Polyesters in Primary Forms
USITC Publication 2743 February 1994
OFFICE OF INDUSTRIES U.S. International Trade Commission Washington, DC 20436
UNITED STATES INTERNATIONAL TRADE COMMISSION
COMMISSIONERS
Don E. Newquist, Chairman Peter S. Watson, Vice Chairman
David B. Rohr Anne E. Brunsdale Carol T. Crawford Janet A. Nuzum
Robert A. Rogowsky Director of Operations
Vern Simpson Director of Industries
This report was prepared principally by
Denby L. Misurelli
Energy, Petroleum, Benzenoid Chemicals, and Rubber and Plastics Branch Energy, Chemicals, and Textiles Division
Address all communications to Secretary to the Commission
United States International Trade Commission Washington, DC 20436

PREFACE
In 1991 the United States International Trade Commission initiated its current Industry and Trade Summary series of infonnational reports on the thousands of products imported into and exported from the United States. Each summary addresses a different commodity/industry area and contains infonnation on product uses, U.S. and foreign producers, and customs treatment. Also included is an analysis of the basic factors affecting trends in consumption, production, and trade of the commodity, as well as those bearing on the competitiveness of U.S. industries in domestic and foreign markets. I
This report on saturated polyesters in primary fonns covers the period 1988-92 and represents one of approximately 250 to 300 individual reports to be produced in this series during the first half of the 1990s. Listed below are the individual summary reports published to daie on the chemicals and textiles sectors.
US/TC publication number
Chemicals: 2458 2509 2548 2578 2588 2590 2598 2736 2739 2741 2743
Publication date
November 1991 ....... . May 1992 ............ . August 1992 .......... . November 1992 ....... . December 1992 ........ . February 1993 ......... . March 1993 ........... . February 1994 ......... . February 1994 ......... . February 1994 ......... . February 1994 ......... .
Textiles and apparel: 2543 August 1992 .......... . 2580 December 1992 ........ . 2642 June 1993 ............ . 2695 November 1993 ....... . 2702 November 1993 ....... . 2703 November 1993 ....... . 2735 February 1994 ......... .
ntle
Soaps, Detergents, and Surface-Active Agents Inorganic Acids Paints, Inks, and Related Items Crude Petroleum Major Primary Olefins Polyethylene Resins in Primary Fonns Perfumes, Cosmetics, and Toiletries Antibiotics Pneumatic Tires and Tubes Natural Rubber Saturated Polyesters in Primary Fonns
Nonwoven Fabrics Gloves Yam Carpets and Rugs Fur Goods Coated Fabrics Knit Fabric
1 The information and analysis provided in this report are for the purpose of this report only. Nothing in this report should be construed to indicate how the Commission would find in an investigation conducted under statutory authority covering the same or similar subject matter.


CONTENTS
Page
Preface ............................... ·················•·····························
Introduction ..........................................•.... · • · · · · ....... · · · ... , .. ·. . . . 1 '
U.S. industry profile ....•.............•... : ................................... ·. . . . . . . . I Product. description and attributes ............................. ·.. . . . . . . . • . . . . . . . . . . . . . . . . 1 Production processes ............................ " ............•................ , . . . . . . . 2 Markets ..........•............................... '·, . . . . . . . . . . . . . . . . . . . . . • . . . . . . . . . 3 Market structure . . . . . . . . . . . . . . . . . . . . . . . . . . . . . . . . . . . . . • . . . . . . . . . . . . . . . . . . . . . . . . . • . . . . 3 Establishments .................. ; . . . . . . . . . . . . . . . . . . . . . . . . . . . . . . . . . . . . . . . . . . . . . . . . . . . S Geographic distribution . . . . . . . . . • . . . . . . . . . . . . . . . . . . . . . . . . • • • . . . . . . . . . . . . . . . . . . . . . .. . . . . S E'!1J;?loyment • . . • . . . . • . . . . . . . . . . . . . . . . . . • . . . . . . . . . . . • . . . . . . . • . . . . . . . . . . . . . . . . . . . . . . . S Pricing ....................................................•.................. ; . • . . 6 Consumer characteristics and factors affecting demand . . . . . . .. . . . . . . . . . . . . . . . . . . . . . . . . . . . . . 7 Environmental considerations and recycling . . . . . . .. . . . . . . . . . . . . . . . . . .. . . . . . . . . . . . . . . . . . . . 1
Foreign industry profile . . . . . . . . . . . . . . . . . . . . . . . . . . . . . . . . . . . . . . . . . . . . . . . . . . . . . . . . . . . • . . . 1 Overview.......................................................................... 1 Europe . . . . . . . . . . . . . . . . . . . . . . . . . . . . . . . . . . . . . . . . . . . . . . . . . . . . . . . . . . . . . . . . . . . . . . . . . . . . 9 Japan .....................................................•.................... ·... 9 Former Soviet Union . . . . . . . . . . . . . . . . . • . . . . . . . . . . . . . . . . . . . . . . . . . . . . . . . . . . . . . . . . . . . . . . 9
U.S. trade measures . . . . . . . . . . . . . . . . . . . . . . . . . . . . . . . . . . . . . . . . . . . . . . . . . . . . . . . . . . . . . . . . . . 10 Tariff measures . . . . . . . . . . . . . . . . . . . . . . . . . . . . . . . . . . . . . . . . . . . . . . . . . . . . . . . . . . . . . . . . . . . . . 10 Nontariff measures and U.S. Government trade-related investigations . . . . . . . . . . . . . . . . . . . . . . . . . 10
Foreign trade measures . . . . . . . . . . . . . . . . . . . . . . . . . . . . . . . . . . . . . . • . . . . . . . . . . . . . . . . . . . . . . . . 10 Tariff measures ........................................ ·. . . . . . . . . . . . . . . . . . . . . . . . . . . . . 10
U.S. market . . . . . . . . . . . . . . . . . . . . . . . . . . . . . . . . . . . . . . . . . . . . . . . . . . . . . . . . . . . . . . . . . . . . . . . . . 10 Consumption .................................... , ...................... , .... , . . . . . . 10 Production . . . . . . . . . . . . . . . . . . . . . . . . . . . . . . . . . . . . . . . . . . . . . . . . . . . . . . . . . . . . . . . . . . . . . . . . . 12 Imports ........................................ ·.................................... 12
Foreign markets ............................................•........................ ~ . 12 Foreign market profile ............... ~............................................... ·.12 u·.s. exports . . . . . . . . . . . . . . . . . . . . . . . . . . . . . . . . . . . . . . . . . . . . . . . . . . . . . . . . . . . . . . . . . . . . . . . . 12
U.S. trade balance . . . . . . . . . . . . . . . . . . . . . . . . . . . . . . . . . . . . . . . . . . . . . . . . . . . . • . . . . . . . . . . . . . . . 12
Appendixes A. Glossary of industry tenns ............................... , .... , . . . . . . . . . . . . . .. . . . . . A-1 . B. Explanation of tariff and trade agreement terms . . . . . . . . . . . . . . . . . . . . . . . . . . . . . . . . . . . . . . . B-1 C. Statistical tables ............................................ ; . . . . . . . . . . . . .. . . . . . . . C-1 Figures 1. U.S. saturated polyester resins industry: Principal raw materials, producer types,
major products, and principal uses . . . . . . . . . . . . . . . . . . . . . . . . • • . . . . . . . . . . . . . . . . . . . . . . . 2 2. Polyethylene terephthalate (PET): U.S. consumption, 1992 •......•.•....•....•.....•.... , . 4 3. Engineering polyesters-PET, PBT, PCT: U.S. consumption, 1992 ; . . . . . . . . . . . . . . . . . . . . . . . . 4 4. Geographic distribution of polyethylene terephthalate (PET) producers • . . • . . . . . . . . . . . . . . . . . . 6 S. Polyethylene terephthalate (PET): Virgin and recycled prices, by months, 1990-92............ 8 6. Saturated polyester resins in primary forms: U.S. trade balance, 1988-92 . . . . . . . . . • . . . . . . . . . 17 Tables 1. Trade names of saturated polyester resins in primary fonns ........................ , . . . . . . 3 2. Saturated polyester resins: Major U.S. markets, 1992 .............•.......... ; • . . . . . . . . . . 5 3. Polyethylene terephthalate (PE1): U.S. capacity, 1993 ............•...... ; . . . . . . . . . . . . . . . . 6 4. Saturated polyester resins in primary forms: U.S. employment, 1986-90 . . . . . . . . . . . . . . . . . . . . 7 S. Polyethylene terephthalate (PET): U.S. recycling capac~ty operations, 1992 . . . . . . . . . . . . . . . . . . 8 6. Major international producers of saturated polyester resins in primary forms ............ · . . . . . 9 . 7. Saturated polyester resins in primary fonns: Harmonized Tariff Schedule subheading;
description; U.S. col. 1 rate of duty as of Jan. 1, 1993; U.S. exports, 1992; and U.S.imports, 1992 ................ , ........... ~ ..•....................... ;.... 11
iii

8.
9. 10.
11. 12.
13.
C-1.
C-2. C-3.
C-4.
C-5. C-6.
iv
CONTENT~ontinued
Page Saturated polyester resins in primary fonns: U.S. producers· shipments, exports of
domestic merchandise, imports for consumption, and apparent consumption, 1988-92 . . . . . 12 Saturated polyester resins in primary fonns: U.S. production by major categories, 1987-91 . . 13 Saturated polyester resins in primary forms: U.S. unports for consumption, by principal
sources, 1988-92 . . . . . . . . . . . . . . . . . . . . . . . . . . . . . . . . . . . . . . . . . . . . . . . . . . . . . . . . . . . . . . 14 Characterization of U.S. imports for consumption, 1992 . . . . . . . . . . . . . . . . . . . . . . . . . . . . . . . . 14 Saturated polyester resins in primary fonns: U.S. exports of domestic merchandise, by principal
markets, 1988-92 . . . . . . . . . . . . . . . . . . . . . . . . . . . . . . . . . . . . . . . • . . . . . . . . . . . . . . . . . . . . . . 15 Saturated polyester resins in primary fonns: U.S. exports of domestic merchandise, imports
for consumption, and merchandise trade balance, by selected countries and country groups, 1988-92............................................................... 16
Polyethylene terephthalate: U.S. exports of domestic merchandise, by principal markets, 1989-92 . . . . . . . . . . . . . . . . . . . . . . . . . . . . . . . . . . . . . . . . . . . . . . . . . . . . . . . . . . . . . . . . . . . . . C-2
Other polyesters: U.S. exports of domestic merchandise. by principal markets, 1989-92 . . . . . C-3 Polyethylene terephthalate, bottle-grade resins: U.S. imports for consumption, by
principal sources, 1989-92 . . . . . . . . . . . . . . . . . . . . . . . . . . . . . . . . . . . . . . . . . . . . . . . . . . . . . . C-4 Polyethylene terephthalate, other than bottle-grade resins: U.S. imports for consumption, by
principal sources, 1989-92 . . . . . . . . . . . . . . . . . . . . . . . . . . . . . . . . . . . . . . . . . . . . . . . . . . . . . . C-5 Polybutylene terephthalate: U.S. imports for consumption, by principal sources, 1989-92 . . . . C-6 Other polyesters: U.S. imports for consumption, by principal sources, 1989-92 . . . . . . . . . . . . C-7
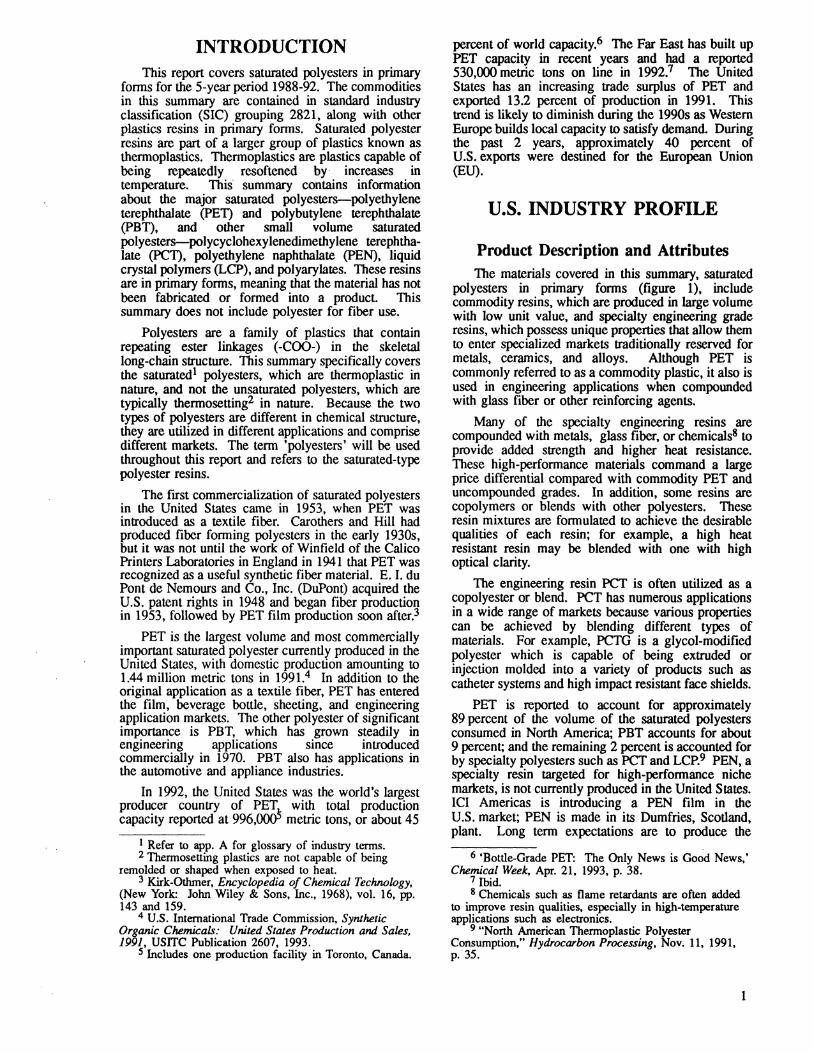
INTRODUCTION This report covers saturated polyesters in primary
fonns for the 5-year period 1988-92. The commodities in this summary are contained in standard industry classification (SIC) grouping 2821, along with other plastics resins in primary fonns. Saturated polyester resins are part of a larger group of plastics known as thennoplastics. Thennoplastics are plastics capable of being repeatedly resoftened by· increases in temperature. This· summary contains infonnation about the major saturated polyesters-polyethylene terephthalate (PET) and polybutylene terephthalate (PBT), and other small volume saturated polyesters-polycyclohexylenedimethylene terephthalate (PCT), polyethylene naphthalate (PEN), liquid crystal polymers (LCP), and polyarylates. These resins are in primary forms, meaning that the material has not been fabricated or fonned into a product. This summary does not include polyester for fiber use.
Polyesters are a family of plastics that contain repeating ester linkages (-COO-) in the skeletal long-chain structure. This summary specifically covers the saturated1 polyesters, which are thennoplastic in nature, and not the unsaturated polyesters, which are typically thennosetting2 in nature. Because the two types of polyesters are different in chemical structure, they are utilized in different applications and comprise different markets. The tenn 'polyesters' will be used throughout this report and refers to the saturated-type polyester resins.
The first commercialization of saturated polyesters in the United States came in 1953, when PET was introduced as a textile fiber. Carothers and Hill had produced fiber forming polyesters in the early 1930s, but it was not until the work of Winfield of the Calico Printers Laboratories in England in 1941 that PET was recognized as a useful synthetic fiber material. E. I. du Pont de Nemours and Co., Inc. (DuPont) acquired the U.S. patent rights in 1948 and began fiber production in 1953, followed by PET film production soon after.3
PET is the largest volume and most commercially important saturated polyester currently produced in the United States, with domestic production amounting to 1.44 million metric tons in 1991.4 In addition to the original application as a textile fiber, PET has entered the film, beverage bottle, sheeting, and engineering application markets. The other polyester of significant importance is PBT, which has grown steadily in engineering applications since introduced commercially in 1970. PBT also has applications in the automotive and appliance industries.
In 1992, the United States was the world's largest producer country of PET with total production capacity reported at 996,~ metric tons, or about 45
I Refer to app. A for glossary of industry terms. 2 Thermosetting plastics are not capable of being
remolded or shaped when exposed to heat. 3 Kirk-Othmer, Encyclopedia of Chemical Technology,
(New York: John Wiley & Sons, Inc., 1968), vol. 16, pp. 143 and 159.
4 U.S. International Trade Commission, Synthetic Organic Chemicals: United States Production and Sales, 1991, USITC Publication 2607, 1993.
S Includes one production facility in Toronto, Canada.
percent of world capacity.6 The Far East has built up PET capacity in recent years and had a reported 530,000 metric tons on line in 1992.7 The United States has an increasing trade surplus of PET and exported 13.2 percent of production in 1991. This trend is likely to diminish during the 1990s as Western Europe builds local capacity to satisfy demand During the past 2 years, approximately 40 percent of U.S. exports were destined for the European Union (EU).
U.S. INDUSTRY PROFILE
Product Description and Attributes The materials covered in this summary, saturated
polyesters in primary forms (figure 1), include commodity resins, which are produced in large volume with low unit value, and specialty engineering grade resins, which possess unique properties that allow them to enter specialized markets traditionally reserved for metals, ceramics, and alloys. Although PET is commonly referred to as a commodity plastic, it also is used in engineering applications when compounded with glass fiber or other reinforcing agents.
Many of the specialty engineering resins are compounded with metals, glass fiber, or chemicals8 to provide added strength and higher heat resistance. These high-perfonnance materials command a large price differential compared with commodity PET and uncompounded grades. In addition, some resins are copolymers or blends with other polyesters. These resin mixtures are formulated to achieve the desirable qualities of each resin; for example, a high heat resistant resin may be blended with one with high optical clarity.
The engineering resin PCT is often utilized as a copolyester or blend. PCT has numerous applications in a wide range of markets because various properties can be achieved by blending different types of materials. For example, PCTG is a glycol-modified polyester which is capable of being extruded or injection molded into a variety of products such as catheter systems and high impact resistant face shields.
PET is reported to account for approximately 89 percent of the volume of the saturated polyesters consumed in North America; PBT accounts for about 9 percent; and the remaining 2 percent is accounted for by specialty polyesters such as PCT and LCP.9 PEN, a specialty resin targeted for high-performance niche markets, is not currently produced in the United States. ICI Americas is introducing a PEN film in the U.S. market; PEN is made in its Dumfries, Scotland, plant. Long term expectations are to produce the
6 'Bottle-Grade PET: The Only News is Good News,' Chemical Week, Apr. 21, 1993, p. 38.
7 Ibid. 8 Chemicals such as flame retardants are often added
to improve resin qualities, especially in high-temperature applications such as electronics.
9 "North American Thermoplastic Polyester Consumption," Hydrocarbon Processing, Nov. 11, 1991, p. 35.
1

Figure 1 U.S. saturated polyester resins: Prlnclpal raw materials, producer types, major products, and principal uses
Principal raw materials
• Ethylene glycol (EG)
Terephthalic acid (TPA)
Dimethyl terephthalate (DMT)
1,4-Butanediol
Producer types
• Multinational chemical companies
Specialty chemical companies
Source: Compiled by the USITC staff from various sources.
material in the United States if the product is acceptable in the marketplace.10
Demand for LCPs, a relatively new type of engineering resin, is predicted to grow during the 1990s. Since introduction in 1985, U.S. demand for LCPs stood at approximately 4,000 tons in late 1991; demand is expected to triple by 1995 and then double to approximately 24,000 tons by the year 2000. Growth in electronic/electrical applications will be the determining factor. I I
Most U.S. producers sell their resins by trade name. Some of the common trade names of polyester resins and the corresponding producing companies are shown in table 1. The use of trade names has increased in recent years as companies tailor their resins and resin blends to specific markets and uses. New technology and developments in the polymerization and blending processes have allowed companies to produce a wider range of resins with specific properties.
lO "PEN Film Business Emerges As ICI Slates Production," Chemical Maruting Reporter, Ml!f. 16, 1992, p. 5.
11 "Liquid crystal polymer demand in the United States will triple through 1995 to 25 million pounds, with subsequent growth to 50 million pounds and $250 million in the year 2000," Chemical Maruting Reporter, Dec. 23, 1991, p. 19.
2
Major products
• PET
• PBT
• PCT
• PEN
• LCP
• Polyarylate
Principal uses
• Beverage bottles
• Film
• Packaging
• Engineering uses:
electronics
automotive
construction
Production Processes
Polyesters are produced by condensation reactions of dicarboxylic acids (or their esters) with dihydroxy alcohols (diols). For example, PET is produced by reacting either dimethyl terephthalate (DM1) or terephthalic acid (1PA) with ethylene glycol (EG). In the commercial production of PET, a continuous melt-phase polymerization process, typically using an antimony catalyst, is utilized. The production of bottle-grade PET includes an additional step known as solid-stating, which further polymerizes the PET from the first reaction, increasing the molecular weight of the polymer. The molecular weight, as measured by intrinsic viscosity (IV) is usually greater than 0.7 dl/g for bottle-grade resins. I2
About 62 percent of ethylene glycol production and nearly all of DMT/1PA production is reported to be used for polyester production (both resins and fiber). I3 Other monomers used to produce polyesters include 1,4-butanediol for PBT, and 1,4-cyclohexane dimethanol for PCT, and 2,6-diinethylnaphthalate for PEN.
12 Ehrig, R.J., Plastics Recycling: Products and Processes, (New York: Hanser Publishers, 1992), pp. 47-48.
13 Ibid., pp. 185 and 344.

Table 1 Trade names of saturated polyester resins In primary forms Trade name 'JYpe Company
Petra . . . • . . . . . . . . • . . . . . . • . . . . . . . . . . • . . • . . . . . . . PET. reinforced ................•..... Allied Signal Xydar . . • . . . . . • . . . . . . . . • . . . . . . . . . . • • . . . . • . . . • • • LCP ..........•..........•......... Amoco Dalar • . • • . . • . . . . • . . • . . • . . . . • . • • • . • • . • . • . . . . • • • PET .•...•...•.......••..•...•..•.• DuPont Rynite . • . . . . . . . . . . . . . . . . • . . . . . . • . . • . . . . • . . . • . • PET ..•.•....•.••.......•.......... DuPont Kodapak • . • . . • . . . . . . . . . . . • • . • . • • . . . • . . . • • . . • . . PET •.••.•.••..••.................. Eastman Kodar • . • . • . • . . • . . . . . . • . • . . . • . • . . • • • . • • . . . • • . . . PETG •.......•....•.........•...... Eastman Tenite . . • • . • • . • • . • • . . . . . • • . . . . . . • . . • . . . . . . . . . . . PET •.•.•••...••.........•..••..... Eastman Ektar . . . . . • . • • . . . • . . • . . . • . . . • . . . • . . • . • . . . • . . . . PET and PCT, reinforced ............. Eastman Valox • . • . . • • . • • . . • . . . • • . . • • . • • . • . . • • . • • . . . . • • • PBT and PCT alloy .................. General Electric Xenoy . • • . . . . • . . • • . . • . . . . • . . • • • . • . . . • • • . . . • . . . PBT alloy .......••.................. General Electric Cleartuf . • • . • • . • • . . • . . . . . . . • • . . • • . . • • • . • • . • . . • • PET .•••...••..•••........••....... Goodyear Celanex . • . . . . . • . . . . . . . . . . • • . • • • . . • . . . . • . . . . • • . PBT .•.•..•.•..••.................. Hoechst Celanese lmpet . . . . . . • • . • . . . • . . • . . . . . . • . . . . . . .. . • • • . • • . . • PET .•••..................•.....•.. Hoechst Celanese Vandar . . • • . • • . . . • . . . . . . . • • • . • • • . . • . . . • • . . • • • • . PBT alloy .•••••........•............ Hoechst Celanese Vectra . . . . • • . . • . • . . . . . . . . . . . • . . • . • . • • . • • • • . . . • LCP .......•..•.................... Hoechst Celanese Thermocomp . • . . • . . . • . . . . . . • • . . . • . • • • . . • • • . . . . PBT. reinforced •...•................. ICI Americas Petlon . . . . • • . . . . . . • . . . . . . . . . • . . . . . . . • • • . . . . • . . PET. reinforced . . . • . . . . . . . . . . . . . . . . . . Miles Pocan • • . . . . . . . . • . . . . . . • . . • . . • . • . • • • . . • • • . . . • . PBT. modified ...•••............. · .... Miles Aspe<?t . . . • . . • . . . • . . . . . . . • . . . • . . • • . . • • • . . . . . • • . PET, reinforced ..••.................. Phillips Tetrafll . • . . • . . • • . . . • . . . . . . . • • . . . . . . . • . • . . . • • . . . PET ......•...•......•............. Thermofil
Source: Modern Plastics Encyclopedia '93, vol. 69, no. 13 (New York: McGraw-Hill, 1992); and Hawley's Condensed Chemical Dictionary, 11th ed. (New York: Van Nostrand Reinhold CompanyL 1987).
After polymerization of the monomers, the polymer usually undergoes some type of compounding to aid in processibility and utility. The following materials are commonly added to the resin: extenders, fillers, colorants, flame retardants, and antioxidants. The polymer may take many forms after production depending on its intended use. The most common forms are powder, flake, solution, or extruded pellets.
Polyester resins are often further processed by the producing company to film or sheet after compounding, because the resins are hygroscopic14 and require careful drying and molding conditions to achieve maximum crystallinity and minimum polymer breakdown. Aside from film extrusion, processes used to fonn polyesters include injection molding and stretch-blow molding.
Markets
Non-engineering grade PET has broad applications in numerous industry segments. As shown in figure 2, the largest market is soft-drink bottles, followed by film, custom bottles1S, sheeting, magnetic film, strapping, oven-ready trays, and coating. In recent years, the packaging market has been a source of growth for PET. Soft-drink companies have turned to PET instead of glass for a number of reasons: liability is reduced because PET bottles are shatterproof; PET's light weight reduces transportation costs; and PET's strength can accommodate carbona~on pressures in the larger 2- and 3-liter bottles. PET packaging for food, distilled spirits, and toiletries also has increased as companies switch from glass and metal containers for
14 Hygroscopic refers to resins that have a tendency to absorb moisture from the air.
15 Includes bottles for cosmetics, toiletries, pharmaceuticals, food, and liquor.
their products. PET's clarity is important to many purchasers who want to present their products in a clear container.
The market for PET film has experienced growth due to increases in video tape, computer tape, and audio tape sales. PET film is also used in photographic film and X-ray film. Other significant markets for PET include strapping for industrial containers, wire coating, and oven-ready food trays.
Markets for PET, PBT, and PCT engineering polyesters are shown in figure 3. These resins possess excellent heat resistance, strength, and chemical resistance, which make them ideally suited for the electronics, automotive, and industrial machinery markets. Electrical end uses include lamp sockets, connectors, switches, fuse holders, and coil bobbins. These resins have a variety of applications in automobiles; structural items like luggage racks, door hardware, and grille panels use PET and PBT, while under-the-hood applications for PBT and PCT include distributor caps, pressure sensors, and alternator armatures. Lower-volume applications for these resins include sunglasses, utility vehicle hoods and fenders, pedestal bases, chair arms, circuit boards, and appliance housings and parts. Table 2 outlines major U.S. markets and applications for saturated polyester resins in 1992.
Market Structure Polyester resins are produced in the United States
by multinational chemical companies and by specialty chemical companies. Engineering grade resins are sometimes compounded by smaller independent ~ompanies. Polyester resins are sold by the producer m compounded and uncompounded form directly to a fabricator, funneled through a compounding or distributin~ intermediary before reaching the fabricator, used internally for derivative products, or further processed by the producer into film, sheet, or
3

Figure 2 Polyethylene terephthalate (PET): U.S. consumption, 1992
Sheeting 4%
Magnetic film 4% Ovenable trays 2%
Strapping 2% Coatings 1%
Soft-drink bottles 40%
Film25%
Source: "U.S. Resin Sales by Process and Market," Modern Plastics, Jan. 1993, p. 86.
Figure 3 Engineering polyesters-PET, PBT, PCT: U.S. consumption, 1992
Electronics and electrical 27%
Source: "U.S. Resin Sales by Process and Market," Modern Plastics, Jan. 1993, p. 86.
4
5%
Industrial 15%
Other 16%

Table 2 Saturated polyester resins: Major U.S. mat1<ets, 1992
(1,000 metric tons)
Type Polyester
Appliances ............................ 4
BuildinQ (1) Glazing and s'9'1ights ••.••..•.•.•••.••
Panels and siding •••...••.••.••••.••• ~~~ Pipes, fittings, conduit ..•••.••...•••.• Plumbing ...•••.•..•••.••..••.•••••• 4
Total ............................. 4
ElectricaVElectronics .•••..•..•••.•..•••. 24
Packaging 6 Coatings ...•••..••.•••.••..•..•••.••
Containers Blow molded •..•...•..••.••••••••• 609 Thermoformed .................... 68 Total ...••.•..••...•...•...•..••.. 677
Transportation2 Cars, vans, light trucks ....•...•...•... 23 Other ••..........•....•..........•.. 5
Total ............................. 28
1 Separate statistics not provided for this application. 2 Includes Canada.
Reinforced Polyester Total
40 44
12 12 49 49 55 55 43 47
159 163
24 48
(1) 6
l~~ 609 68
(1) 677
f > 23
1) 5 (1) 28
Source: "U.S. Resin Sales to Major Markets,• Modem Plastics, Jan. 1993, pp. 89-90.
other fonns. Some producers of PET are integrated backward to produce PET raw materials-EG, DMT, and TPA; other companies are forward-integrated to produce film or other fabricated polyester products.
Establishments
Currently there are four major U.S. producers of PET commodity resins (table 3). The Eastman Chemical Co. presently possesses over 50 percent of the total U.S. capacity and is the world's largest PET producer for packaging applications. During 1991-92 Eastman announced that it would increase its PET capacity worldwide by 140,000 metric tons per year. This expansion includes the construction of a 60,000 metric ton facility in Mexico, a 20,000 metric ton facility in the United Kingdomi and a 60,000 metric ton facility in southern Europe. 6 The second largest U.S. producer, Shell Chemical, recently acquired Goodyear Trre & Rubber Co. 's facility in Point Pleasant, WV; a 35-percent capacity increase is scheduled in the first quarter of 1994.17 Hoechst Celanese Corp. has also announced capacity increa$Cs in its three U.S. plants. The company will add about 180,000 metric tons of capacity during the next 4 years. A new market entrant, Wellman Inc., reportedly intends to bring a 35,000 metric ton plant on stream in
16 "PET: Sitting Pretty as Growth Goes On," European Chemical News, Jwie 21, 1993, p. 20; and "Bottle-Grade PET: The Only News is Good News," Chemical Week. Ap:. 21, 1993.
17 Ibid.
late 1993, and an additional 55,000 metric ton capacity in 1995.18
Other types of polyesters are produced by a variety of companies in addition to the major producers mentioned above. The Commission's report, Synthetic Organic Chemicals: U.S. Production and Sales, 1991, lists a dozen more polyester producers. These companies range from large multinationals, such as Allied Signal Inc. and BASF Corp., to much smaller entities, such as McWhorter and Insulating Materials, Inc.
Geographic Distribution Geographic distribution of U.S. PET producers is
concentrated in the southern States as shown in figure 4. ·The accumulation of producers in North and South Carolina is largely attributed to the IM'ge number of textile establishments in these states.19 A large market for PET is extruded polyester fiber used in textile applications. Close geographic proximity between supplier and purchaser is believed to be advantageous to this commodity-type industry. The geographic distribution of other polyester resin producers is widely dispersed throughout the country.
Employment E;mployment statistics for saturated polyester resins
are not available because of aggregation of all plastics resins in primary fonns into one SIC code. Table 4 shows total employment and production worker
18 Ibid. 19 North and South Carolina are the first and fifth
ranking states in terms of number of textile mill facilities. U.S. Department of Commerce. Counly Business Palterns 1989-90.
5

:.':, ...... ,
Table3 Polyethylene terephthalate (PET): U.S. capacity, 1993
Company Annual capacity
Eastman Chemical1 .•.•...•..••..••.••.........•••..•.•...••................•..........•.. Shell Chemical .•.••.••••.....••......••...•....•...•.......•..•........................... Hoechst Celanese .•.•.•••••.•...•.... •'• ....•..•........•..•.. ~ , ...•........................ ICI Americas •.•.•....••.•.......•...• ~ .•..••.•..•.........................•..............•
metric tons 570 205 160 65
Total ••••.•.••.•••....••••••....• .,. . . . . . . • • . . . . . . . . . . • • . • . . . . . . . . . . . . . . . . . . . . . . . . . . . . 1,000
1 Includes Eastman's Toronto, Canada facility. Source: •Chemical Profile,• Chemical Marketing Reporter, May 3, 1993.
Figure 4 Geographic distribution of polyethylene terephthalate (PET) producers
Source: •Bottle-Grade PET: The Only News is Good News,• Chemical Week, Apr. 21, t993, p. 38; and Collins World Atlas, New Edition 1990 (Glasgow: William Collins, Sons & Co. Ltd. 1990), p. 41.
employment for'' 1986 through 1990,20 based oil Commission staff estimates from U$. Departmejlt of Commerce, Bureau of the Census, data. This ind'ustry is not labor-intensive; therefore employment, labor, and productivity factors are of minor significance.
Pricing Market prices of polyester re8ins vary significantly
from the low-priced commodity , PET reSins '° the highly. specialized engineering polyesters. In '1992, market· prices for bottle-grade PET were 64-67 cents per lb., while LCP (non-compoun,ded) was $12-$22
20 Data for .1991 and 1992 are not available from the U.S. Department of Commerce, Bureau of the Census.
6
per tb:21 PET pncmg reflects that of raw matefials-EG, TPA, and DMT. Supply and demand factors influence market . prices of these materials. Ethylene glycol producers have been squeezed lately by an oversupplied marke~ new capacity coming on stream, arid rising costs. 2 Polyester prices are inherently tied to crude petr,oleum and natural gas prices because their raw materials are derived from these feedstocks.
21 Plastics Technology, Dec. 1992. · 22 'EG Trade Bwnps Along the Bottom,' Chemical
Marketing Reporter, Aug. 10, 1992, p. 3.
.·

Table4 Saturated polyester resins In primary forms: U.S. employment, 1986-90 Year Total employment Production workers
1986..................................... 1,264 1987..................................... 1,734 1988..................................... 1,755 1989 ..................................... 2,300 1990 ..................................... 2,315
788 1,075 1,084 1,402 1,406
Source: Estimated by Commission staff, based on official statistics of the U.S. Department of Commerce.
Consumer Characteristics and Factors Affecting Demand
The demand for polyester resins has grown considerably dwing 1988-92. Derivative products such as recording tapes have experienced growth, and packaging applications such as beverage bottles have taken market share from other materials, such as glass and metal.
New resin blends and improved properties have propelled engineering resins to a variety of new end uses. Plastics applications in automobiles have increased in recent years, as producers strive for greater fuel efficiency through weight reduction. 23 Promising applications for LCP resins in electronic applications such as computer connectors should promote growth for these new resins.
PET bottles have replaced other types of resins such as polyethylene and polyvinyl chloride (PVC) in the packaging industry dwing 1988-92. PET's advantages over these two resins are twofold: PET is a clear resin, unlike polyethylene, which is cloudy or white, and PET does not pose the health and disposal problems that has created concern over PVC use.
Increased environmental concerns by the public in recent years may have a significant impact on future demand for virgin PET. As recycling rates continue to escalate, more of the virgin market may be eroded.
Environmental Considerations and Recycling
• The plastics industry has beeri increasingly involved in recycling as communities, municipalities, industry, and citizens look for alternatives to disposing of wastes. Since 1970, approximately 75 percent of operating landfills in the United States have closed because of stricter environmental regulations and reductions in landfill capacity.24 These closings have contributed to escalating landfill costs, which have prompted communities to look for alternative methods of di~sal. Recycling has become the most popular alterative because other. options, such as incineration, are held to have adverse effects on the environment.
23 Modem Plastics Encyclopedia, (New York: McGraw Hill241991), p. 44.
R.J. Ehrig, Plastics Recycling, p. 3.
In 1990, plastics accounted for approximately 8 percent of the weight of all landfill material and 21 percent of the volume.25 Separate landfill statistics for polyesters are not available.
Recycling of plastics has increased dramatically in the last 2 years. PET has the highest recycling rate among all plastics-24 percent in 1991.26 This high rate can be attributed to the infrastructure in place to return beverage bottles. Many States have legislated "bottle bills" which provide the consumer with an economic incentive to return their bottles. In addition, many communities have commenced cwbside recycling programs; in 1991 there were 1,900 cwbside programs and 3,150 drop-off centers. According to a recent study, one out of every three PET soft drink bottles produced in 1991 was recycled.27
Table 5 provides a list of U.S. recyclers of PET and their present capacities. Industry estimates project a 36 percent rate of PET recycling by 2000.2s Recycled PET is used in many ·products including fiberfill, carpet fiber, and non-food containers. The price differential between virgin and recycled PET provides an incentive to use the recycled material. Figure 5 provides a historical view of the relationship between virgin and recycled PET prices.
FOREIGN INDUSTRY PROFILE
Overview Annual world PET resin capacity was reported to
be 2.2 million metric tons in 1992.29 The United States is the single largest producing country, with almost half the world supply, or nameplate capacity of 996,000 metric tons per year (tpy), followed by East Asia with 530,000 tpy, and Europe with 550,000 tpy. Most industrialized countries of the world have PET capacity.
25 U.S. Environmental Protection Agency, Characterization of Municipal Solid Waste in the United States: 1992 Update, EPA publication 530-S-92-019, EPA 1992.
~"PET Recycling Grows," Chemical Maruting Reporter, June ·l, 1992, p. 5.
7:1 Ibid. 28 "BCC: Plastics Recycling to Surge," Packaging,
Nov. 1991, p. 25. 29 "Bottle-Grade PET," Chemical Week. Apr. 21, 1993,
p. 38.
7

Tables Polyethylene terephthalate (PET): U.S. recycling capacity, 1992
Company Location capacity
1,000 tons per year
Martin Color-Fi ............................. Sumter, Trenton, SC 54 Wellman .................................. Johnsonville, SC 150 Plastics Recycling Alliance .................. Philadelphia, PA/Chicago, IL 135 MA Industries . . . . . . . . . . . . . . . . . . . . . . . . . . . . . . Peachtree City, GA 127 Nicon Plastics . . . . . . . . . . . .. . . . . .. . . . . .. . . . . . Long Island City, NY 117 Day Products . . . . . . . . . . . . . . . . . . . . . . . . . . . . . . Bridgeport, NJ 16 wTe Recycling ............................. Albany, NY 114 Johnson Controls ........................... Novi, Ml 19 Envirothene ............................... Chino, CA 18 St. Jude Polymer . . . . . . . . . . . . . . . . . . . . . . . . . . . Frackville, PA 8 Pepsi/Goodyear . . . . . . . . . . . . . . . . . . . . . . . . . . . . Pt. Pleasant, WV 6 Orion Pacific ............................... Odessa, TX 15 Pure Tech . . . . . . . . . . . . . . . . . . . . . . . . . . . . . . . . . Springfield, MA 5 Polymer Resource Group .................... Rosedale, MD 11
----Total ...............................•...•.......................•.......•............. 1256
1 Includes polyethylene and PET capacity. Source: "1992 Plastics Yellow Pages," Plastics World, Jan. 1992, p. 138.
Figure 5 Polyethylene terephthalate (PET): Virgin and recycled prlces1, by months, 1990-92
70 ....... ,....,..,,.,.,,...
60
50
40
30
20
o~~~~~~~~ ........ ~..;;;;.;.;.....;;;;;.~ ........ ..;;,...,;~~~~~~~;;.;.;_~~-"-~"'--....;;.J JJ AsoNol.J FMAMJJ ASONDIJ FMAMJJ Aso
1990 1991 1992 ND
1 Prices refer to average published prices for the month. Recycled PET is clean flaked.
Source: "Bulk Market Prices,• Plastics Technology, numerous issues; and Trends in End-Use Markets for Plastics, various issues.
8

The United States and the Far East are net exporters of polyesters, while Europe and the rest of the world require imports to meet local demand. In 1992, the United States exported 273,000 metric tons of polyester, or approximately 15 percent of total production. Approximately 40 percent of U.S. exports went to the EU (mainly the Netherlands and United Kingdom) countries during the past 2 years. Imports remain minimal compared with exports, but reached 50,000 metric tons in 1992. The EU supplied about half of U.S. imports of polyester resins. Imports from Canada constituted the largest single source of total U.S saturated polyester resin imports; these imports amounted to 34 percent of the volume, but only 19 percent of the value in 1992. These trading patterns are explained, in part, by intercompany transfers among multinationals.
Major world polyester producers include large multinational conglomerates, multinational chemical companies, and state-owned enterprises. Table 6 lists major world producers, country affiliation, and type of polyester produced.
Europe The United States has a strong presence in the
European PET market. The United States is the source of about 90 percent of European PET imP.Qrts. Current European capacity stands at 550,000 tpy.30 This trend is predicted to change in the future as European producers announce capacity increases and new plant construction. If announced plans materialize, additional European capacity of 200,000 tpy will be added by the mid 1990s, creating an oversupply of PET.31 As a result, U.S. exports would most likely diminish. The largest U.S. producer, Eastman Chemical Co., has plans to increase foreign capacity during the 1990s which will have an effect on U.S. polyester exports. Eastman Chemical Co. sells 40 percent of their products outside the United States, but only 6 percent of world production is outside the United States. Corporate planning announced 40-50 percent PET production increases in the United Kingdom, Mexico, and the former Soviet Union during the next decade.32
30 "PET Producers Pin Hopes on Improving Margins," Euro{{ean Chemical News, Dec. 9, 1991.
"Hoechst and ICI Vie to Hike European PET Capacity," European Chemical News, June 24, 1991; and "PET Producers Pin Hopes on Improving Margins," European Chemical News, Dec. 9, 1991.
32 "Eastman Chemical Develops a Worldwide Picture," Chemical Week, April 22, 1992, p. 22.
Table6
European PET demand grew 12 percent in 1991 as soft drink and mineral water bottles propelled the rise. Projections through 1998 indicate that PET will show a minimum 8 percent annual growth rate, resulting from inroads in the packaging and electronic recording industries. 33
Japan The market for PET and PBT resins in Japan has
grown rapidly in recent years. In 1992, production for non-fiber-use PET reached 467 ,588 metric tons, an increase of 13 percent over 1988 levels.34 During 1988-91, PBT production increased by 36 percent amounting to 55,520 tons in 1991.
Japan's PET market is highly dependent on the electronics industry where 68 percent of PET is consumed for magnetic tape. The other main PET markets in Japan include bottles (food and non-food uses) with approximately 29 percent of the resin market and the remaining 3 percent is utilized in engineering applications. The growth of the electronics and automotive industries is reported to have propelled PBT growth; the electronics market accounts for approximately 50 percent of PBT consumption, automotive use accounts for 35 percent, and 8 percent is exported. 35
Former Soviet Union The former Soviet Union has limited polyester
capacity but that is projected to change. Production capacity was reported at 1,300 tpy, with production at 1,000 tpy, in 1990. Eastman Chemical Co. has announced a joint venture operation with Pepsi and two Russian companies to build a 25,000 tpy PET plant in Russia which is scheduled to begin production in late 1992. This capacity reportedly will be used to produce Pepsi bottles for the Russian market and the remainder will be exported for hard currency. This market is seen as having growth potential as the former Soviet countries can currently only supply 35 percent of demand. 36
33 "PET: Sitting Pretty," European Chemical News, June 21, 1993.
34 Plastics Industry News, Apr. 1992 through Mar. 1993 issues.
35 "Japan-1991 PBT Consumption Forecast," Modern Plastics International, Jan. 1, 1992, p. 48; and "PBT on Steady Increase," Plastics Industry News, Sept. 1991, p. 131.
36 Hunt, Julian, Packaging Week, June 24, 1992, p. 13.
Major International producers of saturated polyester resins In primary fonns Company ReslnlYp• Country
Eastman Chemical . . . . . . . . • . . . . . . . . . . . . . . . . . . . • PET, PBT, PCT .••..•...•...••......• United States EniChem . . . • . . • • . . . . . • • . . • • • . . . . . . . . . . . . • . . . . • PET .......••..•...•............... Italy Hoechst Celanese . . . . . . . . . . . . . . . . . . . . . . . . . . . . . • PET, PBT ........................... Germany ICI .....•...•....•..••.................. ~ • . . . . PET, PEN ..........................• United Kingdom Mitsubishi Kasei . . . . . . . • . . . . . . . . . . . • . . . . . . . . . . . . PET, PBT ...................•..•.... Japan Shell Chemical ................................. PET •........••..•..•......•....... Netherlands Toray Industries . . . . . . . • . . . . . . . . . . • . . . . • . . . . . • . . PET, PBT, LCP ...................... Japan
Source: Compiled by USITC staff from various industry publications.
9
U.S. TRADE MEASURES
Tariff Measures Table 7 shows the rates of duty as of January l,
1993, for imports of polyester resins in primary forms under the U.S. Hannonized Tariff Schedule (HTS). The table shows the column 1 rates of duty for countties that have most-favored-nation (MFN) status, as well as rates of duty for countties qualifying for special tariff programs.37 The column 1 general rate of duty for the products covered in this summary was 3.1 cents per kilogram plus 9 percent ad valorem in 1992.
Saturated polyesters are eligible for duty free treatment under the Generalized System of Preferences (GSP), Caribbean Basin Economic Recovery Act (CBERA), United States-Israel Free Trade Area Implementation Act of 1985, and the Andean Trade Preference AeL Imports of polyester from Canada currently . have duty-free status; non-PET polyesters · received duty-free status in January 1993 after a 5-year duty reduction schedule.
During 1988, the United States classified imports under the Tariff Schedule of the United States (TSUS). This system classified items more broadly than under the HTS (saturated polyester resins). PET was not identified separately from saturated polyester resins; therefore, separate trade data for polyester resins are suppressed for 1988.
NontaritT Measures and U.S. Government Trade-Related Investigations
The U.S. International Trade Commission has conducted only one investigation, under th.e U.S. antidumping law, with respect to derivative PET products. In that investigation, the Commission determined that a domestic industry was materially injured by reason of imports of PET film, sheet, and sttip products from Japan and the Republic of Korea that the U.S. Department of Commerce had determined were being sold in the United States at less than fair
37 Refer to app. B for explanation of tariff and trade agreement tenns.
Nation/Area
value (dumped).38 Commerce subsequently issued an antidumping duty order and imports subject to that order are currently subject to antidumping duties in an amount equal to the margin of dumping (if any). There are no known domestic nontariff import restrictions.
FOREIGN TRADE MEASURES
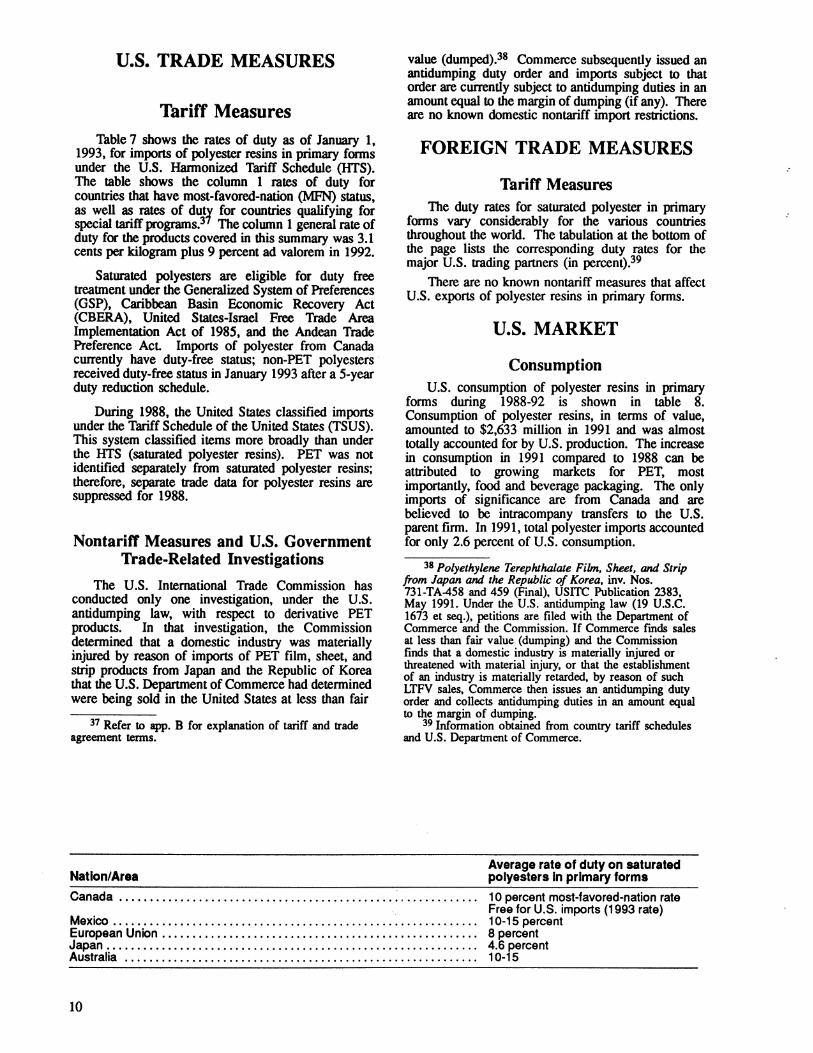
Tariff Measures The duty rates for saturated polyester in primary
forms vary considerably for the various countries throughout the world. The tabulation at the bottom of the page lists the corresponding duty rates for the major U.S. trading partners (in percent).39
There are no known nontariff measures that affect U.S. exports of polyester resins in primary forms.
U.S. MARKET
Consumption U.S. consumption of polyester resins in primary
forms during 1988-92 is shown in table 8. Consumption of polyester resins, in terms of value, amounted to $2,633 million in 1991 and was almost totally accounted for by U.S. production. The increase in consumption in 1991 compared to 1988 can be attributed to growing markets for PET, most importantly, food and beverage packaging. The only imports of significance ate from Canada and are believed to be intracompany transfers to the U.S. parent firm. In 1991, total polyester imports accounted for only 2.6 percent of U.S. consumption.
38 Polyethyle111! Terephthalate Film, Sheet, and Strip from Japan and the Republic of Korea, inv. Nos. 731-TA-458 and 459 (Final), USITC Publication 2383, May 1991. Under the U.S. antidumping law (19 U.S.C. 1673 et seq.), petitions are filed with the Department of Commerce and the Commission. If Commerce fmds sales at less than fair value (dumping) and the Commission finds that a domestic industry is materially injured or threatened with material injury, or that the establislunent of an industry is materially retarded, by reason of such LTFV sales, Commerce then issues an antidumping duty order and collects antidumping duties in an amount equal to the margin of dumping.
39 Infonnation obtained from country tariff schedules and U.S. Department of Commerce.
Average rate of duty on saturated polyesters In primary forms
Canada •••.••..•.•.•...•.........••...••.....•••.•.. ; ............ . 1 O percent most-favored-nation rate Free for U.S. imports (1993 rate) 10-15 percent Mexico ..•.•.•••.••..•.•............................. ~ ............ .
European Union •.••..•..•..••..•......•..•..••...•.•.•..•...••....• Japan .••••..•.•••.•..................•.......• ···················· Australia •.••.•.••.....•..•........................•................
10
8 percent 4.6 percent 10-15

--
Tabte7 Saturated polyester resins In primary forms: Harmonized Tariff Schedule subheading; description; U.S. col. 1 rate of duty as of Jan. 1, 1993;·u.s. exports, 1992; and U.S. Imports, 1992
HTS subheading
3907.60.00 3907.60.0010 3907.60.0050
3907.99.00 3907.99.0010 3907.99.0050
Description
Polyethylene terep~thalate ................................ . Bottle-grade resins .................................... . Other ..•..............................................
Other polyesters: Other ..••...........•.................................
Polybutylene terephthalate .......................... . Other ............................................. .
Col. 1 rate of duty as of Jan. 1, 1993 General Speclalf
3.1¢/kg +9% Free (A,CA,E,IL,J)
3.1¢/kg + 9% Free (A,CA,E,IL,J)
U.S. exports, 1992
U.S. Imports, 1992
320 Million dollars -
33
~~ 136
(2) (2)
2 31
54 10 44
1 Programs under which special tariff treatment may be provided, and the corresponding symbols for such programs as they are indicated in the "Special" subcolumn, are as follows: Generalized System of Preferences (A); Automotive Products Trade Act (8); Agreement on Trade in Civil Aircraft (C); United States-Canada Free-Trade Agreement (CA); Caribbean Basin Economic Recovery Act (E); United States-Israel Free Trade Area (IL); and Andean Trade Preference Act (J).
2 Export statistics are only available at the 8-digit level. Source: Harmonized Tariff Schedule of the United States, and import and export data were compiled from official statistics of the U.S. Department of Commerce.

Table& Saturated 1>9lyester resins In primary forms: U.S. producers' shlpments1.exports of domestic merchandrse, Imports for consumptron, and apparent consumption, 1988-92
U.S. Production
U.S. U.S. Apparent U.S. consumption
Ratio of Imports to consumption Year Exports Imports
------- Million dollars ------- Percent
0.8 1988 .........•.......... 3,066 2,265 2,925 2,972
121 23 2,968 2,064 2,652 2,633
1989 ................... . 252 51 2.5 1990 ................... . 339 66 2.5 1991 ................... . 408 69 2.6 1992 ................... . (1) 456 88 (2) (2)
1 Production data for 1992 are not available.
2 Not available.
Source: Production data compiled from USITC, Synthetic Organic Chemicals, U.S. Production and Sales, 1988-91. Import and export data are compiled from official statistics of the U.S. Department of Commerce.
Production
U.S. production of polyester in primary forms during 1987-91 is shown in table 9. During this period, U.S. production increased from 1.2 million metric tons in 1987 to 1. 7 million metric tons in 1991, or by over 40 percent U.S. production is predicted to increase as all major U.S. producers have announced their intentions to expand capacity during the next few years. If reported capacities come on stream as scheduled through 1995, U.S. capacity will increase by 252,000 tpy. 40
Imports
Although imports of polyester resins in primary forms account for less than 3 percent of domestic consumption, they increased slightly in each of the previous 5 years. Table 10 shows the principal sources of U.S. imports during 1988-92. The majority of U.S. imports were shipped from Canada and were over 95 percent PET (refer to appendix C for classification of imports by type). In contrast to Canada, the second largest import source--Oermany, provided mainly (98 percent) non-PET polyester materials. U.S. imports from Canada and Japan experienced the largest increases during this period.
Imports of polyester resins in primary forms entered the U.S. duty-free under a number of preferential trade agreements. Table 11 shows the composition of these imports. In 1992, approximately 30 percent of U.S. imports of polyester resins entered duty-free; countries under the Generalized System of Preferences (GSP) accounted for 10 percent of total imports.
40 'Eastman will double resins,' Chemical Week, Apr. 15, 1992, p. 32; and 'Goodyear to Sell PET Unit To Shell in Debt Reduction,' Chemical Marketing Reporter, Mar. 30, 1992, p. 5.
12
FOREIGN MARKETS
Foreign Market Profile Traditionally the United States has exported the
majority of polyester resins to the EU. The Netherlands is the single largest destination for U.S. exports. As stated above, firms producing in the EU are planning large capacity increases in the upcoming · years, which will probably limit future U.S. exports. Other potential markets include South American countries such as Brazil, Colombia, Venezuela, which have relatively little production capacity.
U.S. Exports During 1988-92, U.S. exports of polyester resins in
primary forms increased from $121 million in 1988 to $456 million in 1992, or by over 375 percent, as shown in table 12. The United States has exported an average of 12 percent of production during the last 2 years. The largest increase has been in exports destined for the Netherlands, Canada, and Mexico. Combined exports to those three countries increased from $105 million in 1989 to $271 million in 1992. The majority of U.S. exports of polyester resins is destined for European countries, mainly the Netherlands and the United Kingdom.
U.S. TRADE BALANCE The United States has traditionally had a
substantial trade surplus of saturated polyester resins in primary forms. Table 13 depicts the balance of trade for polyester in the top ten countries. The United States has maintained a trade deficit with Germany during 1988-92. A large and growing trade surplus has developed during this period with a high of $368 million recorded in 1992. The majority of this trade is believed to be intercompany transfers among affiliates of multinational companies. Figure 6 shows the trends in imports and exports during this period.

-\.,)
Table9 Satu"'ed polyester resins In primary forms: U.S. production by major categories, 1937.911
(Metric tons. dry weight basis2)
DescrlpUon 1987 1988 1989 1990 1991
Polyethylene terephthalate (PET) . . . . • . . • • . . . . . . . • . . . . • . • . . . . • • . • . . . . . . . . 860,790 957,136 1,211,704 1,347,638 1,441,972 All other, including polybutylene terephthalate (PBT) . . • . . • . . • . . . . . • . • . . . . • . 333,895 294, 707 323, 71 o 250, 747 246,534
Total . . . . . • • • • • • . . . . . • . . . . . . . . • . . . • . . . . . . . . . • • .. . • • . . . . • .. . . . . • . . 1,194,686 1,251,844 1,535,414 1,598,385 1,688,506
1 Data for 1992 are not available at this time. 2 Dry weight basis is the total weight of the materials including resin and coloring agents, extenders, fillers, plasticizers, and other additives, but excluding
water and other liquid diluents unless they are an integral part of the materials. Note.-Because of rounding, figures may not add to the totals shown. Source: USITC, Synthetic Organic Chemicals, U.S. Production and Sales, 1987-91.

Table 10 saturated1 polyester resins In primary forms: U.S. lmpons for consumption. by prlnclpal sources, 1988-92 Source 1988 1989 1990 1991 1992
Quantity (1,000 kilograms)
Canada ...................... ~~ 352 13,106 12,478 16,971 Germany •.•••.....•..•....... 3,227 2,840 3,880 3,859 Japan ••••.•••.......•...•.... ~~ 219 2,579 4,167 5,832 Luxembourg •.•••••.•.••...... 4,048 4,249 3,333 2,786 Mexico •...•......•..........• ~~ 2,212 3,083 5,897 6,998 Taiwan •.••.••...•..•.••...•.. 2,151 2,434 1,209 4,164 Belgium •••.••••.•.•••••••.•.. ~~ 1,818 1,574 1,023 1,696 Switzerland .......•......•.... 1,118 644 1, 101 2,176 United Kingdom ...•...••...... ~) 593 738 879 1,106 Netherlands .................. (2~ 597 858 421 1,211 All other •...•.••.......•...... 3,378 1,969 2,110 2,943
Total ......••..•••..••.•• 11,688 19,713 34,073 36,498 49,742
Value (1,000 dollars)
Canada •.......•..•.......... ~) 587 15,514 14,281 16,765 Germany ...•.•...•.......•... 10, 180 8,117 13,400 14,613 Japan ................•...•... (2~ 1,894 5,951 10,003 14,158 Luxembourg ..•....••..•...... ~) 15,404 13,753 10,940 10,723 Mexico •..•......•............
~~ 2,912 3,567 5,179 5,784
Taiwan •.........•...•...•...• 3,976 3,635 1,700 5,436 Belgium ...................... ~} 4,450 4,416 2,666 4,226 Switzerland .•...... , ••......... (2) 3,087 1,564 2,307 3,713 United Kingdom ............... (2) 1,922 2,475 3,043 3,693 Netherlands .........•........ (2) 1,697 2,658 1,389 3,652 All other ....•.•............... ( ) 4,951 4,109 4,489 4,932
Total .................... 22,893 51,039 65,780 69,396 87,695
Unit value (dollars per kilogram)
Canada .•...............•..•. ~~ 1.67 1.18 1.14 0.99 Germany ..................... 3.15 2.86 3.45 3.79. Japan ....••.•......••........ (2) 8.65 2.31 2.40 2.43 Luxembourg ••........•....... (2) 3.81 3.24 3.28 3.85 . Mexico ....•.•..••.•.•....•... ~~ 1.32 1.16 0.88 0.83 Taiwan ..•••.•.......••....... 1.85 1.49 1.41 1.31 Belgium •..................... ~~ 2.45 2.81 2.61 2.49 Switzerland ............•.....• 2.76 2.43 2.10 1.71 United Kingdom ..•............ ~) 3.42 3.35 3.46 3.34 Netherlands .................. (2~ 2.76 3.10 3.30 3.02 All other •.....••.••........... 1.47 2.09 2.13 1.68
Average ................. 1.96 2.59 1.93 1.90 1.76
1 U.S. trade with East Germany is included in "Germany•. 2 Country-level detail is provided only for years in which there are actual trade data under the Harmonized Tariff
Schedule of the United States (HTS). · . Source: Compiled from official statistics of the U.S. Department of Commerce.
Table 11 Characterization of U.S. lmpons for consumption, 1992
l'YP8 of trade Value of Imports
Share of total Imports
1,000 dollars Percent Total imports . . . . . . . . . . . . . • . . . . . . . . . . . . . . . . . . . . . . . 87,695 100.0 Dutiable imports • . . . . . . . . . . .. . . . . . . . . . . . . . . . . . . . . . 628 •• 42~21 · 71.3 Duty-free imports under GSP . . . . . . . . . . . . . . . . . . . . . . .., 9.4 Duty-free imports under other provisions 1 • • • • • • • • • • • • 16,962 19.3
1 Includes United States-Canada Free-Trade Agreement, Caribbean Basin Economic Recovery Act, and United States-Israel Free Trade Area. Source: Compiled from official statistics of the U.S. Department of Commerce.
14

Table 12 Saturated polyester resins In primary forms: U.S. exports of domestic merchandise, by prlnclpal markets, 1988-92
Market 1988 1989 1990 1991 1992
Quantity (1,000 kilograms}
Netherlands . . . . . . . . . . . . . . . . . . (1) 29,913 70,964 76,110 88,625 Canada . . . . . . . . . . . . . . . . . . . . . . (1) 30,068 49,075 51,311 57,494 Japan........................ (1) 10,099 14,469 20,817 21,689 Australia . . .. . . . . . . . . . .. . . . . . . (1) 14,943 17,798 24,720 20,687 Mexico....................... (1) 2,936 4,153 8,217 15,769 Israel . . . . . . . . . . . . . . . . . . . . . . . . (1) 3,278 6,864 8,949 12,653 United Kingdom . . . . . . . . . . . . . . . (1) 5,510 17,340 11,426 8,632 Argentina..................... (1) 1,075 1,418 4,192 8,086 Colombia..................... (1) 247 37 1,839 5,815 Chile . . . . . . . . . . . . . . . . . . . . . . . . (1) 1,578 652 663 5,222 All other...................... (1) 55,503 28,768 32,758 28,501
~~~~~~~~~~~~~~~~~~~~~~~~
Total . . . . . . . . . . . . . . . . . . . . 72,596 155,152 211,538 241,001 273,174
Value (1,000 dollars}
Netherlands . . . . . . . . . . . . . . . . . . (1) 53,093 112,412 130,893 151,919 Canada . . . . . . . . . . . . . . . . . . . . . . (1) 46,088 82,218 84,311 94,319 Japan........................ (1) 16,683 24,014 37,n8 37,333 Australia . . . . . . . . . . . . . . . . . . . . . (1) 20,842 23,612 34,741 28,753 Mexico....................... (1) 6,210 8,155 14,229 25,191 Israel . . . . . . . . . . . . . . . . . . . . . . . . (1) 5,352 8,608 11,752 15,756 United Kingdom . . . . . . . . . . . . . . . (1) 9,796 25,687 21,468 14,577 Argentina . . . . . . . . . . . . . . . . . . . . . (1) 1,630 1,859 6,530 12,547 Colombia..................... (1) 524 132 2,762 8,670 Chile . . . . . . . . . . . . . . . . . . . . . . . . (1) 2,132 809 1,021 7,690 All other...................... (1) 89,640 51,294 62,737 59,460
~~~~~~~~~~~~~~~~~~~~~~~~
Total . . . . . . . . . . . . . . . . . . . . 120,788 251,990 338,799 408,223 456,214
Netherlands ................. . Canada ..................... . Japan .....................•.. Australia .................... . Mexico ...................... . Israel ....................... . United Kingdom .............. . Argentina .................... . Colombia .................... . Chile ....................... . All other ..................... .
Average ................ .
Unit value (dollars per kilogram}
1.77 1.58 1.72 1.53 1.68 1.64 1.65 1.66 1.81 1.39 1.33 1.41 2.12 1.96 1.73 1.63 1.25 1.31 1.78 1.48 1.88 1.52 1.31 1.56 2.12 3.57 1.50 1.35 1.24 1.54 1.62 1.78 1.92
1.62 1.60 1.69
1.71 1.64 1.72 1.39 1.60 1.25 1.69 1.55 1.49 1.47 2.09
1.67
1 Country-level detail is provided only for years in which there are actual trade data under the new Schedule B (based on the Harmonized Tariff Schedule of the United States). Source: Compiled from official statistics of the U.S. Department of Commerce.
15

Table 13 Saturated polyester resins In primary forms: U.S. exports of domestic merchandise, Imports for consumption, and merchandise trade balance, by selected countries and country groups, 1988-921
(Mil/fan dollars)
Item 1988 1989 1990 1991 1992
U.S. exports of domestic merchandise:
~ Netherlands .•....•............ 53 112 131 152 Canada ....•.............•.... 46 82 84 94 Japan .................•...... 17 24 38 37 Mexico •...............••..... 6 8 14 25 Australia ...................... ~~ 21 24 35 29 United Kingdom ................ 10 26 21 15 Germany .....................
~~ 7 3 3 2
Israel ......................... 5 9 12 16 Ar~ntina ..................... 2 2 7 13 Be ium ...................... ~~ 4 6 6 8 All other ...................... 81 43 57 66
Total ....................... 121 252 339 408 456
EU-12 ........................ ~~ 81 157 170 184 OPEC ....................... 5 3 6 8 ASEAN ....................... (2) 4 4 4 4 CBERA .......................
~~ 3 2 3 4 Eastern Europe ................ 0 0 0 0
U.S. imports for consumption: ~) Netherlands ................... 2 3 1 4
Canada ....................... (2) 1 16 14 17 Japan ........................
~~ 2 6 10 14
Mexico ....................... 3 4 5 6 Australia ...................... (2) 0 () 0 0 United Kingdom ................ (2) 2 2 3 4 Germany ..................... (2) 10 8 13 15 Israel ......................... (2) 0 0 0 0 Ar~entina ..................... (2) 0 0 0 0 Begium ...................... ~~ 4 4 3 4 All other ...................... 19 23 20 25
Total ....................... 23 51 66 69 88
EU-12 ........................ (2) 35 33 33 38 OPEC ....................... ~~ 0 0 0 0 ASEAN ....................... 0 0 0 0
CB ERA .................... (2) 0 0 0 0 Eastern Europe ................ (2) 0 0 0 0
U.S. merchandise trade balance: Netherlands ................... ~~ 51 109 130 148 Canada ....................... 45 66 70 77 Japan ........................ ~) 15 18 28 23 Mexico ....................... (2) 3 4 9 19 Australia ...................... (2) 21 24 35 29 United Kingdom ................ (2) 8 24 18 11 Germany ..................... (2) .-3 -5 -10 -13 Israel ......................... ~~ 5 9 12 16 Ar~entina ............•........ 2 2 7 13 Begium ...................... (2) 0 2 3 4 All other ...................... (2) 62 20 37 41
Total ....................... 98 201 273 339 368
EU-12 ........................ ~~ 46 124 137 146 OPEC ....................... 5 3 6 8 ASEAN ....................... ~~ 4 4 4 4 CBERA .........•............. 3 2 3 4 Eastern Europe ................ (2) 0 0 0 0
1 Import values are based on customs value; export values are based on f.a.s. value, U.S. port of export. U.S. trade with East Germany is included in "Germany• but not "Eastern Europe."
2 Country-level detail is provided only for years in which there are actual trade data under the Harmonized Tariff Schedule of the United States and under the new Schedule 8.
Source: Compiled from official statistics of the U.S. Department of Commerce.
16

Saturated polyester resin In primary forms: U.S. trade balance, 1988·92
400.--~~~~~~~~~~~~~~~~~~~~~~~~~~~~~~~
100
1992
Source: Compiled from official statistics of the U.S. Department of Commerce.
17


APPENDIX A GLOSSARY OF INDUSTRY TERMS

GLOSSARY OF INDUSTRY TERMS
Antioxidant
Blow Molding
Catalyst
Chain Transfer Agent ..
Cold Forming
Colorant
Copolymer
Dielectric
Environmental Stress Cracking
Extender
Extrusion
Filler
Film
Flame Retardants
Homopolymer
A-2
A substance incorporated in a material for the purpose of inhibiting oxidation at normal or elevated temperatures.
The process of forming hollow articles by expanding a hot plastic element against the internal surfaces of a mold.
A substance that causes or accelerates a chemical reaction when added to the reactant in minor amount, without being permanently affected by the reaction.
An agent capable of stopping the growth of a molecular chain by yielding an atom to the active radical at the end of the growing chain, but also in tum being left as a radical that can initiate the growth of a new chain.
A group of processes by which sheets or billets of thermoplastic materials are formed into three-dimensional shapes at room temperature by processes used in the metalworking industry such as forging, brake press bending, deep drawing, stamping, heading, and coining.
Dyes or pigments that import color to plastics.
This term usually denotes a polymer of two chemically distinct monomers.
A material with electrical conductivity less than one millionth of a reciprocal ohm per centimeter, thus so weakly conductive that different parts of its surface can have a different electrical charge.
The formation of external or internal cracks in a plastic caused by tensile stresses less than that of its short-time mechanical strength, when such strength has been reduced by aging or exposure to some environmental condition.
A substance added to the mixture to reduce its cost.
The process of forming continuous shapes by forcing a molten plastic material through a die.
A relatively inert substance added to plastic compound to reduce its cost and/or to improve physical properties, particularly hardness, stiffness, and impact strength.
Film is distinguished from sheet in the plastic and packaging industries only according to thickness. A web under IO mils thick is usually called a film.
Materials that reduce the tendency of plastics to bum.
The polymer resulting from the polymeri7.ation of a single monomer: a polymer consisting substantially of a single type of repeating unit.

GLOSSARY OF INDUSTRY TERMS-Continued
Impact Strength
Initiator
Injection Molding
Intrinsic V1SCosity
Liquid Crystal Polymers
Melt Index
Molecµlar Weight
Monomer
Plasticizer
Polyarylate
Polybutylene Terephthalate
The ability of a material to withstand shock loading.
An agent that causes a chemical reaction to start and becomes a part of the resultant compound.
The method of forming objects from granular or powdered plastics, most often of the thermoplastic type, in which the material is fed from a hopper to a heated chamber in which it is softened, after which a ram or screw forces the material into a mold.
In dilute solution viscosity measurements, intrinsic viscosity is the limit of the reduced and inherent viscosities as the concentration of the polymeric solute approaches zero and represents the capacity of the polymer to increase viscosity.
A wholly aromatic copolyester that exhibits a highly ordered structure in both the melt and solid states. Properties include high tensile and flexural properties, UV radiation stability, and are lransparent to microwaves.
The amount, in grams, of a thermoplastic resin that can be forced through an orifice of 0.0825 inch diameter when subjected to a force of2,160 grams in 10 minutes at 190 oC. The test is performed by an extrusion rheometer described in ASTMD 1238.
The sum of the atomic weights of all atoms in molecule.
A relatively simple compound, usually containing carbon and of low molecular weight, that can react to form a polymer by combination with itself or with other similar molecules or compounds.
A substance or material incorporated in a material (usually a plastic or an elastomer) to increase its flexibility, workability or distensibility.
Polymers that are aromatic polyesters derived from aromatic dicarboxylic acids and diphenols. They are heat-resistant thermoplastics with excellent toughness, UV stability, flexural recovery, dimensional stability, flame retardance, and electrical properties.
A member of the polyalkyleneterephthalate family, similar to polyethylene terephthalate in that it is derived from a polycondensate derived from terephthalic acid whose diol component is butanediol rather than glycol. Properties include high strength, dimensional stability, low moisture absorption, good electrical characteristics and resistance to heat and chemicals when suitably modified.
A-3

GLOSSARY OF INDUSTRY TERMS-Continued
Polycyclobexylenedimetbylene Terephtbalate
Polyethylene Napbthalate
Polyethylene Terephtbalate
Polymer
Polymerization
Resins
Saturation
Sheet
Shore D Hardness
Tensile Strength
Thermoforming
A-4
A high~temperature, semicrystalline, thennoplastic polyester produced by reacting 1,4~yclohexane dimethanol with dimethyl terephthalate. The resin has high heat deflection temperature values, low moisture absorption, and outstanding chemical resistance.
A material developed by Teijin Ltd., described as having a naphthalene core chemical structure which includes two additional benzene nuclei.
A saturated, thennoplastic polyester resin made by condensing ethylene glycol and terephthalic acid, used for fibers, films, and molded parts. It is extremely hard, wear-resistant, dimensionally stable, resistant to chemicals, and has good dielectric properties.
The product of a polymerization reaction.
A chemical reaction in which the molecules of a simple substance (monomer) are linked together to fonn large molecules whose molecular weight is a multiple of that of the monomer.
The tenn resin is defined by ASTM (D 883-75a) as a solid or pseudosolid material, often of high molecular weight, that exhibits a tendency to flow when subjected to stress, usually has a softening or melting range, and usually fractures conchoidally. A note added to this ASTM definition explains that in a broad sense, the tenn is used to designate any polymer that is a basic material for plastics.
The state in which all available valence bonds of an atom (especially carbon) are attached to other atoms.
Sheet is distinguished from film in the plastic and packaging industry only according to thickness. A web over 10 mils is usually called a sheet.
The hardness of a material as determined by either the size of an indentation made by an indenting tool under a fixed load, or the load necessary to produce penetration of the indenter to a predetermined depth.
The maximum tensile stress sustained by the specimen during a tension test. The result is usually expressed in pounds per square inch, the area being that of the original specimen at the point of rupture rather than the reduced area after break.
The process of forming a thermoplastic sheet into a three-dimensional shape by clamping the sheet in a frame, heating it to render it soft and flowable, then applying differential pressure to make the sheet conform to the shape of a mold or die positioned below the frame.

Unsaturation
GLOSSARY OF INDUSTRY TERMS-Continued
The state in which not all the available valence bonds along the alkyl chain are satisfied; in such compounds the exLla bonds usually fonn double or triple bonds (chiefly with carbon).
Source: Whittington's Dictionary of Plastics, Hawley's Condensed Chemical Dictionary, and Modem Plastics Encyclopedia.
A-5


APPENDIXB EXPLANATION OF TARIFF AND TRADE AGREEMENT TERMS

TARIFF AND TRADE AGREEMENT TERMS
The Harmonized TarijJ Schedule of the United States (HTS) replaced the Tariff Schedules of the United States (TSUS) effective January l, 1989. Chapters 1 through 97 are based upon the internationally adopted Harmonized Commodity Description and Coding System through the 6-digit level of product description, with additional U.S. product subdivisions at the 8-digit level. Chapters 98 and 99 contain special U.S. classification provisions and temporary rate provisions, respectively.
Rates of duty in the general subcolumn of HTS column 1 are most-favored-nation (MFN) rates; for the most part, they represent the final concession rate from the Tokyo Round of Multilateral Trade Negotiations. Column I-general duty rates are applicable to imported goods from all nonembargoed countries except those enumerated in general note 3(b) to the HTS plus Serbia and Montenegro, whose products are dutied at the rates set forth in column 2. Goods from Albania, Armenia, Belarus, Bulgaria, the People's Republic of China, the Czech Republic, Estonia, Georgia, Hungary, Kazakhstan, Kyrgyzstan, Latvia, Lithuania, Moldova, Mongolia, Poland, Romania, Russia, Slovakia, · Turkmenistan, Ukraine, and Uzbekistan are currently eligible for MFN treatment, as are the other republics of the former Socialist Federal Republic of Yugoslavia. Among articles dutiable at column I-general rates, particular products of enumerated countries may be eligible for reduced rates of duty or for duty-free entry under one or more preferential tariff programs. Such tariff treatment is set forth in the special subcolumn of HTS column 1. Where eligibility for special tariff treatment is not claimed or established, goods are dutiable at column I-general rates.
The Generalized System of Preferences (GSP) affords nonreciprocal tariff preferences to developing countries to aid their economic development and to diversify and expand their production and exports. The U.S. GSP, enacted in title V of the Trade Act of 1974 and renewed in the Trade and Tariff Act of 1984,. applies to merchandise imported on or after January 1, 1976 and before September 30, 1994. Indicated by the symbol "A" or "A*" in the special subcolumn of column l, the GSP provides duty-free entry to
B-2
eligible articles the product of and imported directly from designated beneficiary developing countries, as set forth in general note 4 to the HTS.
The Caribbean Basin Economic Recovery Act (CBERA) affords nonreciprocal tariff preferences to developing countries in the Caribbean Basin area to aid their economic development and to diversify and expand their production and exports. The CB ERA, enacted in title II of Public Law 98-67, implemented by Presidential Proclamation 5133 of November 30, 1983, and amended by the Customs and Trade Act of 1990, applies to merchandise entered, or withdrawn from warehouse for consumption, on or after January 1, 1984; this tariff preference program has no expiration date. Indicated by the symbol "E" or "E*" in the special subcolumn of column 1, the CBERA provides duty-free entry to eligible articles, and reduced-duty treatment to certain other articles, which are the product of and imported directly from designated countries, as set forth in general note 7 to the HTS.
Preferential rates of duty in the special subcolumn of column 1 followed by the symbol "IL" are applicable to products of Israel under the United States-Israel Free Trade Area Implementation Act of 1985 (IFTA), as provided in general note 8 to the HTS. Where no rate of duty is provided for products of Israel in the special subcolumn for a particular provision, the rate of duty in the general subcolumn of column 1 applies.
Preferential nonreciprocal duty-free or reduced-duty treatment in the special subcolumn of column 1 followed by the symbol "J" or "J*" in parentheses is afforded to eligible articles the product of designated beneficiary countries under the Andean Trade Preference Act (ATPA), enacted in title II of Public Law 102-182 and implemented by Presidential Proclamation 6455 of July 2, 1992 (effective July 22, 1992), as set forth in general note 11 to the HTS.
Preferential rates of duty in the special subcolumn of column 1 followed by the symbol "CA" are applicable to eligible goods of Canada, and those followed by the symbol "MX" are applicable to eligible goods of Mexico, under the North American Free Trade Agreement, as provided in general note 12 to the HTS, effective January 1, 1994.
Other special tariff treatment applies to particular products of insular possessions (general note 3(a)(iv)), goods covered by the Automotive Products Trade Act (APTA) (general note 5) and the Agreement on Trade in Civil Aircraft (ATCA) (general note 6), and articles imported from freely associated states (general note 10).
The General Agreement on Tariffs and Trade (GATT) (61 Stat (pt. 5) A58; 8 UST (pt 2) 1786) is a multilateral agreement setting forth basic principles governing international trade among its signatories. The GAIT's main obligations relate to most-favored-nation treatment, the maintenance of scheduled concession rates of duty, and national (nondiscriminatory) treatment for imported products; the GAIT also provides the legal framework for customs valuation standards, "escape clause" (emergency) actions, antidumping and countervailing duties, and other measures. Results of GAIT-sponsored multilateral tariff negotiations are set forth by
way of separate schedules of concessions for each participating contracting party, with the U.S. schedule designated as Schedule XX.
Officially known as ''The Arrangement Regarding International Trade in Textiles," the Multifzber Arrangement (MFA) provides a framework for the negotiation of bilateral agreements between importing and producing countries, or for unilateral action by importing countries in the absence of an agreement. These bilateral agreements establish quantitative limits on imports of textiles and apparel, of cotton and other vegetable fibers, wool, man-made fibers and silk blends, in order to prevent market disruption in the importing countries--restrictions that would otherwise be a departure from GAIT provisions. The United States has bilateral agreements with many supplying countries, including the four largest suppliers: China, Hong Kong, the Republic of Korea, and Taiwan.
B-3

APPENDIXC STATISTICAL TABLES

Table C-1 Polyethylene terephthalate: U.S. exports of domestic merchandise, by prlnclpal markets, 1989·921
Market
Netherlands ......•..•.........•..•............ Canada ..•...........•.....•..••...•.......... Australia ............................•......... Japan ................................•........ Mexico ....................................... . Israel •.......•..................•.....•....... United Kingdom ...........••..................• Argentina ...................•.................. Colombia •....•............••.........•........ Chile ........................................ . All other .•..............•......................
1989
23,880 18,994 14,781
7,116 802
3,227 4,980 1,033
200 1,546
41,894
1990 1991
Quality (1,000 kilograms)
53,958 57,393 37,612 40,429 17,592 24,462 11,9n 17,456
642 2,757 6,728 8,856
15,689 10,503 1,357 4,046
0 1,757 635 648
19,355 22,417
1992
66,203 44,632 20,431 16,252 10,927 12,436 8,213 7,802 5,704 5,179
20,655
Total . . . . . . . . . . . . . • • . . . • . . . . . . . . . . . . . . . . . . . • 118,453 165,545 190,724 218,435 ~---~~~~~---~~~~.....;_~~~~....;._~
Netherlands .................................. . Canada ...................................... . Australia ..................................... . Japan ........................................ . Mexico ....................................... . Israel ........................................ . United Kingdom ............................... . Argentina ..•................................... Colombia ..................................... . Chile .........•...........•................... All other •..•...................................
42,149 27,714 20,394 10,280
1,714 4,766 7,821 1,459
361 2,065
65,094
Value (1,000 dollars)
80,156 92,025 49,721 52,987 23,069 33,987 16,134 25,606
1,368 4,150 8, 150 11,528
20,676 19,473 1,663 6,088
0 2,543 762 972
30,048 37,160
106,691 57,150 27,850 22,586 15,363 15,269 12,987 11,791 8,328 7,552
34,881
Total . • . • • . • • . . . . . . . . . • . . • • . . . . . . . . . . . . . . . . . 183,818 231,748 286,519 320,448 ~---~~~~~---~~~~-'--~~~~~~
Netherlands .......•........................... Canada .•.....••.......•...................... Australia ......•....................•.......... Japan .........•............................... Mexico ....................................... . Israel .................•...•................... United Kingdom ............•................... Argentina ....................•................. Colombia ..•...•.......•.....•................. Chile .........•.......•...•.............•..... All other ..•.•.••.....••...•.......•...•••....•.
1.77 1.46 1.38 1.44 2.14 1.48 1.57 1.41 1.80 1.34 1.55
Unit value (dollars per kilogram)
1.49 1.60 1.32 1.31 1.31 1.39 1.35 1.47 2.13 1.51 1.21 1.30 1.32 1.85 1.23 1.50
0 1.45 1.20 1.50 1.55 1.66
Average . . . • . . • . . . . . . . • • . . . • . . . . . . . . . . . • . • . . 1.55 1.40 1.50
1 Comparable data for 1988 are not available. Source: Compiled from official statistics of the U.S. Department of Commerce.
C-2
1.61 1.28 1.36 1.39 1.41 1.23 1.58 1.51 1.46 1.46 1.69
1.47

Table C-2 Other p(>lyesters: U.S. exports of domestic merchandise, by prlnclpal markets, 1989-921 Market 1989 1990 1991 1992
Netherlands .................................. . Canada ...................................... . Japan ........................................ . Mexico ....................................... . Belgium ...................................... . France ....................................... . Taiwan ....................................... . South Korea ................... : .............. . Brazil ........................................ . United Kingdom ............................... . All other ...................................... .
Total ...................................... .
Netherlands .................................. . Canada ....................................... . Japan ........................................ . Mexico ....................................... . Belgium ....................................... . France ....................................... . Taiwan ....................................... . South Korea .................................. . Brazil ........................................ . United Kingdom ............................... . All other ........................... · ........... .
Total ...................................... .
Netherlands .................................. . Canada ...................................... . Japan ........................................ . Mexico ....................................... . Belgium ...................................... . France ....................................... . Taiwan ....................................... . South Korea .................................. . Brazil ........................................ . United Kingdom ............................... . All other ...................................... .
Average ................................... .
1 Comparable data for 1988 are not available.
6,033 11,074 2,983 2,134 1,620 1,162
338 1,214
200 530
9,410
36,698
10,944 18,374 6,403 4,496 2,697 2,814
944 1,798
701 1,975
17,026
68,172
1.81 1.66 2.15 2.11 1.67 2.42 2.79 1.48 3.51 3.73 1.81
1.86
Quality (1,000 kilograms)
17,006 18,717 11,463' 10,882 2,491 3,361 3,511 5,460 1,385 1,791 1,085 1,948
429 621 1,016 1,299
330 518 1,651 923 5,626 4,758
45,993 50,278
Value (1,000 dollars)
32,256 38,868 32,496 31,324 7,880 12, 171 6, 787 10,079 4,982 4,658 3,603 3,920
767 1,223 2,312 3,610 1,291 2,339 5,011 1,995 9,667 11,516
107,051 121,704
Unit value (dollars per kilogram)
1.90 2.08 2.83 2.88 3.16 3.62 1.93 1.85 3.60 2.60 3.32 2.01 1.79 1.97 2.27 2.78 3.92 4.51 3.03 2.16 1.72 2.42
2.33 2.42
Source: Compiled from official statistics of the U.S. Department of Commerce.
22,422 12,861 5,437 4,842 1,384
689 1,276
998 460 419
3,951
54,739
45,228 37,169 14,747 9,828 5,917 2,872 2,766 2,488 1,871 1,590
11,291
135,766
2.02 2.89 2.71 2.03 4.28 4.17 2.17 2.49 4.07 3.80 2.86
2.48
C-3

Table C-3 Polyethvlene terephthalate, bottle-grade resins: U.S. Imports for consumption, by principal sources, 1989·92, 2
Source
Taiwan .................................. ~ .... . Canada ...................................... . Netherlands .................................. . South Korea .................................. . United Kingdom ............................... . Germany ..................................... . Colombia ..................................... . Mexico ....................................... . Pakistan .............................•........ Italy •.....•......................•............ All other ............................. :-. ....... .
Total
Taiwan ....................................... . Canada ...................................... . Netherlands .................................. . South Korea .................................. . United Kingdom ............................ ; .. . Germany ..................................... . Colombia ..................................... . Mexico ....................................... . Pakistan ....•................................. Italy ......................................... . All other ...................................... .
Total ...................................... .
Taiwan ....................................... . Canada ...................................... . Netherlands .................................. . South Korea .................................. . United Kingdom .....•.......................... Germany ...........•..................•....... Colombia ...•....••.......•.................... Mexico ..............•......................... Pakistan ..........•.•..•................•..... Italy ......................................... . All other ........• , ............................ .
Average ..... .-. ............................ .
1989
0 0 0 0 2 4 0
102 0 0
68
176
0 0 0 0 4 7 0
115 0 0
83
210
0 0 0 0
2.00 1.67
0 1.12
0 0
1.23
1.19
1 U.S. trad~ with East Germany is included in "Germany•. 2 Comparable data for 1988 are not available. 3 Less than 500 kilograms.
1990 1991
Quality (1,000 kilograms)
0 0 179 165
2 0 0 36
14 0 0 (3) 0 0
92 3 0 0 6 8
41 3
334 215
Value (1,000 dollars)
0 0 151 105
3 0 0 38
15 0 0 12 0 0
49 7 0 0
10 3 22 2
251 168
Unit value (dollars per kilogram)
0 0 0.84 0.64 1.82 0
0 1.05 1.07 0
0 39.62 0 0
0.53 2.48 0 0
1.59 0.40 0.55 0.80
0.75 0.78
Source: Compiled from official statistics of the U.S. Department of Commerce.
C-4
1992
951 542 178 179
81 30 19 5
19 1 4
2,010
1,084 471 148 107 48 28 14 7 6 5 8
1,925
1.14 0.87 0.83 0.60 0.59 0.92 0.72 1.42 0.29 5.12 1.82
0.96

Table C-4 Polyethylene terephthalate, other than bottle-grade resins: U.S. Imports for consumption, by· prlnclpal sources, 1959.921 2
Source
Canada ..........................•............ Japan ........................................ . Mexico ...........................•............ Brazil ........................................ . Taiwan ....................................... . United Kingdom ............................... . Belgium ...................................... . Germany ..................................... . France ....................................... . Venezuela .................................... . All other ...................................... .
1989
196 52
244 1,759
9 2
17 288 200
0 643
1990 1991
Quality (1,000 kilograms)
12,693 12, 107 1,724 2,929 1,956 5, 117 1,022 1,103
0 81 2 0
292 187 28 102 24 9 0 0
1,475 693
1992
16, 112 4,274 5,467 1,434 1,727
273 62 94 49
120 284
Total . . . . . . . . . . . . . . . . . . . . . . . . . . . . . . . . . . . . . . . 3,408 19,217 22,328 29,895 --'--~~~~~~~~~~~~~~~~~-
Canada ...................................... . Japan ........................................ . Mexico ....................................... . Brazil ........................................ . Taiwan ....................................... . United Kingdom ............................... . Belgium ...................................... . Germany ..................................... . France ....................................... . Venezuela .................................... . All other ...................................... .
Total .•.....................................
Canada ...................................... . Japan ........................................ . Mexico ....................................... . Brazil ........................................ . Taiwan ....................................... . United Kingdom ............................... . Belgium ...................................... . Germany ..................................... . France ....................................... . Venezuela .................................... . All other ...............•.......................
Average ................................... .
94 186 439
2,461 9
16 52
928 299
0 2,338
6,822
0.48 3.61 1.80 1.40 1.07 9.02 3.07 3.22 1.50
0 3.63
2.00
1 U.S. trade with East Germany is included in "Germany•. 2 Comparable data for 1988 are not available.
Value (1,000 dollars)
14,554 13,502 2,427 4,801 2,088 4,266 1,485 1,479
0 53 15 0
598 695 260 236 83 25 0 0
3,300 1,320
24,811 26,376
Unit value (dollars per kilogram)
1.15 1.12 1.41 · 1.64 1.07 0.83 1.45 1.34
0 0.65 6.64 0 2.04 3.72 9.41 2.32 3.51 2.95
0 0 2.24 1.90
1.29 1.18
Source: Compiled from official statistics of the U.S. Department of Commerce.
15,584 7,071 4,397 1,758 1,428
270 237 235 90 54
182
31,304
0.97 1.65 0.80 1.23 0.83 0.99 3.83 2.50 1.83 0.45 0.64
1.05
C-5

Table C-5 Polybutylene terephthalate: U.S. lmpons for consumption, by prlnclpal sources, 1989-921 2
Source 1989 1990 1991 1992
Germany •.•••••....•.......••......••...•....• Japan •.....••.......•..•.••......••.......•... Netherlands ....•...........•..•..•••.......... Belgium ....•.•................................ Luxembourg .......•.....•.......•............. Taiwan .•.....•..•..•.•.......•......••......•• United Kingdom •..•..•..•.••...•..•••.••......• Canada •...•..•.•..•......•.•........•........ France ..•.......••...............•............ All other ..•......••.........•......•..•.......•
Total ..•..•..••.•...•.••......••............
Germany .••................................... Japan ...•..•.................................. Netherlands .....•..•................... : ..... . Belgium •..•.•........................•........ Luxembourg .•.......•..........•.............. Taiwan .....•.................................. United Kingdom .....•..•....................... Canada ............•................ .-........ . France ....................................... . All other ...•.......•...........................
Total •..•..........•......•.................
Germany ...........•......•..•.....•.......... Japan ........................................ . Netherlands .................................. . Belgium ...................................... . Luxembourg .................................. . Taiwan .....•.................................. United Kingdom .....•...•...................... Canada ...................................... . France ...•.................................•.. All other .........•.............................
Average ....•.•.•..•..•.................•...
1,426 48
106 553 480
18 15 1 0
25
2,672
4,027. 344 348
1,544 659 32. 89
2 0
36
7,081
2.82 7.14 3.28 2.79 1.37 1.81 5.74 1.78
0 1.41
2.65
1 U.S. trade with East Germany is included in "Germany". 2 Comparable data for 1988 are not available.
Quality (1,000 kilograms)
1,221 1,533 197 288 209 76
21 0 0 167 0 0
18 12 0 0 0 0
58 2
1,724 2,078
Value (1,000 dollars)
3,179 4,189 742 1,046 763 339 53 0
0 335 0 0
92 27 0 0 0 0
189 2
5,019 5,939
Unit value (dollars per kilogram)
2.60 2.73 3.n 3.64 3.65 4.46 2.54 0
0 2.01 0 0
5.18 2.25 0 0 0 0
3.27 1.00
2.91 2.86
Source: Compiled from official statistics of the U.S. Department of Commerce.
C-6
2,039 441 217 206 373
78 25
2 6
284
3,387
5,676 1,767 1,051
825 751 199 119 10 3 0
10,402
2.78 4.01 4.85 4.02 2.01 2.54 4.78 4.62 0.48
0
3.07

Table C-6 Other polyesters: U.S. Imports for consumption, by prlnclpal sources, 1988-921 2
Source 1989 1990 1991 1992
Luxembourg .................................. . Germany ...................................... . Japan ........................................ . Switzerland ................................... . United Kingdom ............................... . Belgium ...................................... . Taiwan ....................................... . Netherlands .................................. . Mexico ....................................... . Austria ....................................... . All other ...................................... .
3,568 1,509
119 839 574
1,248 2,125
149 1,867
87 1,372
Quality (1,000 kilograms)
2,940 2,661 1,591 2,245
655 950 628 981 704 867
1,261 836 2,434 1,128
508 345 1,035 777
103 262 941 826
2,413 1,696 1, 116 2,170
728 1,429 1,408
796 1,526
277 893
Total . . . . . . . . . . . . . . . . . . . . . . . . . . . . . . . . . . . . . . . 13,457 12, 799 11,878 14,450 ---'-~~~~~--"'-~~~~~.;...._~~~~--'-~
Luxembourg .................................. . Germany ...................................... . Japan ........................................ . Switzerland ................................... . United Kingdom ............................... . Belgium ...................................... . Taiwan ....................................... . Netherlands .................................. . Mexico ....................................... . Austria ....................................... . All other ...................................... .
14,745 5,218 1,354 1,844 1,812 2,853 3,935
358 2,358
193 2,255
Value (1,000 dollars)
11,127 9,594 4,678 8,962 2,773 4,156 1,414 2,130 2,352 3,015 3,765 1,971 3,635 1,647 1,453 1,049 1,430 906
265 580 2,809 2,902
9,972 8,675 5,317 3,705 3,257 3,164 2,726 2,427 1,380
901 2,542
Total . . . . . .. . . . . . . . . . . . . . . . . . . . . . . . .. . . . . . . . 36,927 35,700 36,913 44,064 ~~~~~~~~~~~~~~~~~~~
Luxembourg .................................. . Germany ..................................... . Japan ........................................ . Switzerland ................................... . United Kingdom ............................... . Belgium ...................................... . Taiwan ....................................... . Netherlands .................................. . Mexico ....................................... . Austria ....................................... . All other ...................................... .
Average ................................... .
4.13 3.46
11.43 2.20 3.16 2.29 1.85 2.40 1.26 2.20 1.64
2.74
1 U.S. trade with East Germany is included in "Germany". 2 Comparable data for 1988 are not available.
Unit value (dollars per kilogram)
3.78 3.61 2.94 3.99 4.23 4.37 2.25 2.17 3.34 3.48 2.99 2.36 1.49 1.46 2.86 3.05 1.38 1.17 2.58 2.21 2.99 3.51
2.79 3.11
Source: Compiled from official statistics of the U.S. Department of Commerce.
4.13 5.12 4.77 1.71 4.48 2.21 1.94 3.05 0.90 3.25 2.85
3.05
C-7