Embed Size (px)
Citation preview

PY2010-2012 Custom Impact Evaluation – Standalone Net-to-Gross Results
Jennifer Fagan, Itron
September 4, 2014

2
METHODS AND DATA SOURCES
WO033 Standalone NTG Results
• NTG methodology used for this research was the standard Nonresidential Self-Report Approach (SRA) o Originally developed for 2006-2008 evaluationo Refined in early stages of this evaluation
• Four sources of free-ridership and spillover information: o Program files; o Decision Maker (telephone) surveyso Utility and Program Staff Interviewso Small number of targeted interviews with market
actors to substantiate ISP• Both CATI and In Depth Interviews – roughly 50-50 split• Weighting of project level results to population• Final step – review/adjust for early replacement and dual
baseline projects (double counting issue)

WO033 Standalone NTG Results 3
NUMBER OF COMPLETED SURVEYS
Completed Surveys as a Percentage of Total Projects for IOU Core and Third Party Programs
Total Number of Projects
% of Total
Completed Surveys (N)
% of Total
PG&E Electric 6,994 50% 558 40%PG&E Gas 1,270 9% 230 17%SCE Electric 3,052 22% 367 26%SDG&E Electric 1,469 11% 125 9%SDG&E/SCG Gas 1,066 8% 108 8%
Total 13,851 100% 1,388 100%
Utility/Fuel Sampling Domain
Total Number of Projects
Completed Surveys
• A substantial number of NTG surveys were completed, 1,388 in total.
• These were roughly proportional to the population of completed projects for each IOU

WO033 Standalone NTG Results 4
NUMBER OF COMPLETED SURVEYS
Completed Surveys for Statewide and Local Government Programs
• Included in this total were 254 surveys completed for projects funded by Statewide Government/Institutional4 and Local Government programs
• These were not proportional to the population, however
Total Number of Projects
% of Total
Completed Surveys (N)
% of Total
PG&E Statewide Govt/Institutional
308 18% 72 28%
PG&E Local Government
1,101 63% 69 27%
SCE Statewide Govt/Institutional
126 7% 56 22%
SCE Local Government 199 11% 57 22%Total 1,734 100% 254 100%
Utility/Fuel Sampling Domain
Total Number of Projects
Completed Surveys

DETAILED NTG FINDINGS

WO033 Standalone NTG Results 6
WEIGHTED NTG RESULTS - STATEWIDE• On a Statewide basis, the NTGR across all program categories
averaged 0.48 for electric programs and 0.53 for gas programs. • These values indicate a resulting medium low level of program
influence, and are similar in magnitude to NTGRs from the past several evaluation cycles
1998 1999 2000 2001 2002 2004-2005
PY2006-2008 PG&E
PY2006-2008 SCE
PY2010-2012
Electric
PY2010-2012 Gas
0
0.1
0.2
0.3
0.4
0.5
0.6
0.7
0.8
0.9
1
NTGR

RESULTS BY IOU

WO033 Standalone NTG Results 8
NTG RESULTS BY IOU – PG&E ELECTRIC• Weighted NTGR across all programs of 0.46. Little variation pre
and post EAR decision• Some variation across programs:
• Higher program influence for: Core Commercial, 3P Heavy Industry EE, 3P Refinery EE and 3P RCx
• Lower program influence for: Core Industrial, 3P Pump Efficiency, 3P EE Oil/Gas Both Core-Industrial and 3P EEOG reflect the results of legacy POC projectsProgram/Program Group Result
Number of Completed Surveys
Net-to-Gross Ratio
PG&E - Electric
Core Programs
Calculated Incentives - Comm Ind Ag 195 0.47
Calculated Incentives - Commercial 86 0.57
Calculated Incentives - Industrial 44 0.28
Calculated Incentives -Agricultural 65 0.47
Non-Core Programs
PGE21042: New Construction 19 0.46
PGE20135: Pump Efficiency Services 36 0.36
PGE2222: Energy Eff. Oil and Gas 46 0.37
PGE2223: Heavy Industry Energy Efficiency 27 0.62
PGE2225: Refinery Energy Efficiency 9 0.66
PGE2228/2203: RCx Group 12 0.62

WO033 Standalone NTG Results 9
NTG RESULTS BY IOU – PG&E GAS• Weighted NTGR across all programs of 0.56. Some variation pre-
and post-EAR decision.• Some variation across programs:
• Higher program influence for: Core Industrial and Agricultural, 3P Heavy Industry EE and 3P RCx
• Lower program influence for: New Construction, 3P Refinery EEProgram/Program Group Result
Number of Completed
Surveys
Net-to-Gross Ratio
PG&E - Gas Core Programs
Calculated Incentives - Comm Ind Ag 97 0.63 Calculated Incentives - Commercial 40 0.55 Calculated Incentives - Industrial 27 0.63 Calculated Incentives -Agricultural 30 0.61
Non-Core Programs
PGE21042: New Construction 7 0.39 PGE2223: Heavy Industry Energy Efficiency 12 0.57 PGE2225: Refinery Energy Efficiency 5 0.35
PGE2228/2203: RCx Group 8 0.63

WO033 Standalone NTG Results 10
NTG RESULTS BY IOU – SCE ELECTRIC• Weighted NTGR across all programs of 0.49. Very little difference pre
and post EAR decision.• Some variation across programs:
• Higher program influence for: Core Industrial, Lower for Core Commercial and Agricultural
• Among Non-Core programs, generally lower program influence for: New Construction, Other 3P groups
Program/Program Group Result Number of Completed
Surveys
Net-to-Gross Ratio
SCE - Electric Core Programs
Calculated Incentives - Comm Ind Ag 162 0.47 Calculated Incentives - Commercial 59 0.40 Calculated Incentives - Industrial 39 0.54 Calculated Incentives -Agricultural 64 0.44
Non-Core Programs SCE-SW-005A - New Construction 38 0.45
Other Third Party 54 0.51

WO033 Standalone NTG Results 11
NTG RESULTS BY IOU – SDGE ELECTRIC
• Weighted NTGR across all programs of 0.45. Little difference pre and post EAR decision.
• Strongest performance by Local Nonresidential BID program• Core programs had medium low program influence• Low program influence for New Construction program
Program/Program Group Result Number of Completed
Surveys
Net-to-Gross Ratio
SDG&E - Electric Core and Non-Core Programs
Calculated Incentives - Comm Ind Ag 56 0.45 SDGE3118 - New Construction 14 0.33
SDGE3117 - Local Nonresidential BID program 55 0.49

WO033 Standalone NTG Results 12
NTG RESULTS BY IOU – SCG/SDGE GAS• Weighted NTGR across all programs of 0.50. Significant difference pre
and post EAR decision. Illustrates how EAR process can lead to improvement in ex-post results.
• Strong performance by Local Nonresidential BID program• Core programs had medium low program influence. Somewhat better
performance by Deemed vs. Calculated
Program/Program Group Result Number of Completed
Surveys
Net-to-Gross Ratio
SDG&E - Gas Non-Core Programs
SDGE3117 - Local Nonresidential BID program 22 0.67 SCG - Gas Core Programs
Calculated 62 0.48
Deemed 10 0.55

WO033 Standalone NTG Results 13
NTG RESULTS – STATEWIDE PROGRAMS• Scope included Statewide Government and Institutional
Partnerships.• Medium high NTGRs are indicated• Results very similar by IOU• By program category, results show more variation.
• The community college partnership has a somewhat lower NTGR (0.47), while the UC/CSU NTGR is moderately higher (0.56).
• The local government program category has the least favorable result.
Program Results Statewide Govt PGE Govt & Institutional
SCE Govt & Institutional
Weighted NTGR 0.56 0.55 0.57 90 Percent CI 0.536 to 0.584 0.518 to 0.592 0.54 to 0.594 Relative Precision 0.04 0.07 0.05 n NTGR Completes 128 72 56 N Sampling Units 434 308 126
ER 0.35 0.39 0.29

KEY FACTORS INFLUENCING NTGRS

WO033 Standalone NTG Results 15
KEY FACTORS APPROACH
• Predominantly a qualitative approach to examine key project drivers.• The intent was to look more deeply, into the
qualitative factors that drive the numerical results.• Looking for factors that correlate with low/high free
ridership programs. • Did not do formal regression/correlation coefficient
analysis however. • First examined the key contextual factors within each
project, and then summarized across all evaluated projects within a set group.

16
COMMON THEMES
WO033 Standalone NTG Results
• Corporate policy is a major driver of most projects. Corporate standard practice is nearly-universal as a decision influence, along with environmental policies
• Weaker performing programs exhibited one or more other strong drivers that may be contributing to poor performance.• PGE2222 EEOP - a majority of projects have automation
benefits in addition to energy savings. Also, a significant percentage of projects were already in an advanced stage.
• New construction projects have many non-energy efficiency drivers: e.g. firms involved including chains/big box stores are advanced in their adoptions of energy efficiency
• Replacement of failing equipment a common theme for SCE Core and 3P programs
• Environmental compliance is present in decisions for UC/CSU, SDGE3117 NR BID, and New Construction pgms

WO033 Standalone NTG Results 17
EXAMPLE TABLE FOR PG&E PROGRAMS
PGE Core
Comm Ind Ag
Energy Efficiency Services for Oil
Production
New Construction
Heavy Industry
RCx Group Other
3P PGE
PGE2222 PGE21042 PGE2223 RCx
Group
Distribution of NTGRs High - 0.76 to 1.00 9% 0% 10% 5% 14% 13% Medium High- 0.51 to 0.75 30% 7% 24% 55% 50% 42% Medium Low- 0.26 to 0.50 49% 50% 43% 32% 36% 38%
Low - 0.00 to 0.25 12% 43% 24% 8% 0% 7%
Program/Program Grouping NTGR - Electric 0.47 0.37 0.46 0.62 0.62 0.47
Program/Program Grouping NTGR - Gas 0.63 N/A 0.39 0.57 0.63 0.68
Key Project Drivers
Project Maturity Project is in the capital and/or operating budget 5% 33% 11% 3% 7% 0%
Equipment has already been ordered 1% 22% 6% 0% 0% 0%
Corporate Policy/Practice
Measure is part of corporate standard practice 67% 46% 61% 68% 86% 62% Measure is installed elsewhere in company, in places that do not offer rebates 14% 41% 22% 3% 7% 1% Company has environmental policy in place 53% 22% 78% 49% 71% 52%
Energy Efficiency A Secondary, not Primary, Benefit Measure automates existing manual processes 11% 65% 11% 14% 7% 13% Measure improves workplace quality 14% 0% 33% 0% 7% 14%
Environmental Compliance Measure is associated with environmental compliance (e.g., pollution reduction)
6% 0% 0% 3% 0% 7%
Market Segment Measure is installed by a market segment that is ahead of curve on energy efficiency
10% 33% 17% 0% 0% 4%
Measure is installed by national chain/big box firm 10% 0% 22% 0% 0% 6% Project Cost vs. Rebate
Rebate is very small % of overall project cost 7% 28% 11% 16% 0% 1% Project Context
Measure is part of an expansion/remodeling 16% 26% 28% 14% 7% 7% Measure installed to replace failing equipment 20% 4% 0% 5% 29% 18%

NTG FINDINGS BY VARIABLES OF INTEREST

ANALYSIS BY MEASURE TYPE

WO033 Standalone NTG Results 20
ELECTRIC MEASURES

WO033 Standalone NTG Results 21
GAS END USES• New Construction projects had the lowest NTGRs.• Steam trap NTGRs were the highest. These levels are slightly
better than Industrial Steam Trap NTGR levels from PY2006-2008
0.00
0.10
0.20
0.30
0.40
0.50
0.60
0.70
0.80
0.90
1.00
Process Boiler Steam Trap HP Process HeatRecovery
New Construction
SCG
PGE
SDGE
N=7
N=29N=7
N=3
N=19N=506
N=17 N=19N=10
N=3

WO033 Standalone NTG Results 22
DATA CENTER MEASURES• Some conflict with Server Virtualization NTGRs and research by
PG&E and others that this measure is becoming standard practice.

WO033 Standalone NTG Results 23
WATER/WASTEWATER MEASURES• Low NTGRs in general, particularly for Aerators and Controls.• Suggests that the list of eligible measures needs to be
adjusted.

WO033 Standalone NTG Results 24
HVAC MEASURES• Somewhat lower NTGRs for rooftop or split system units and
pump VFDs. ISP study may be warranted for these measures
WO033 Standalone NTG Results 25
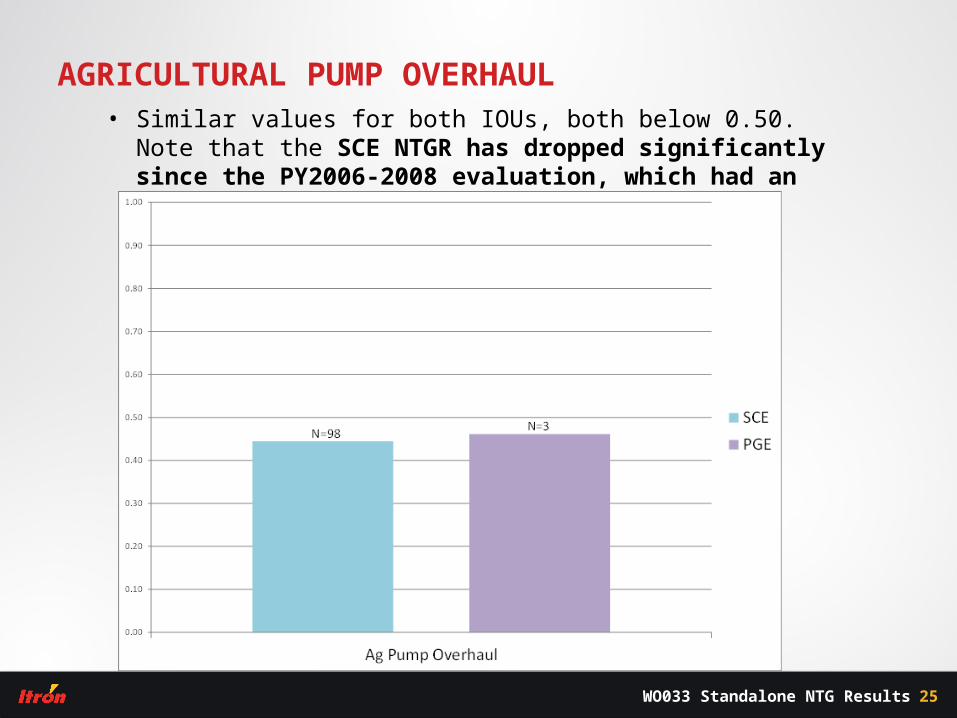
AGRICULTURAL PUMP OVERHAUL• Similar values for both IOUs, both below 0.50. Note that the SCE
NTGR has dropped significantly since the PY2006-2008 evaluation, which had an NTGR of 0.63.

WO033 Standalone NTG Results 26
RETROCOMMISSIONING HVAC• Medium level of program influence. Results are down significantly
from PY2006-2008, where NTGRs were 0.75 and higher.

ANALYSIS BY BASELINE DISPOSITION

WO033 Standalone NTG Results 28
ELECTRIC RESULTS BY BASELINE STATUS• Major Renovation and Add-On Measure categories had the highest levels
of program influenced adoptions.• Program influence for Capacity Expansion projects was very low • Early Replacement results did not make strong case for program influenced
adoptions.
WO033 Standalone NTG Results 29
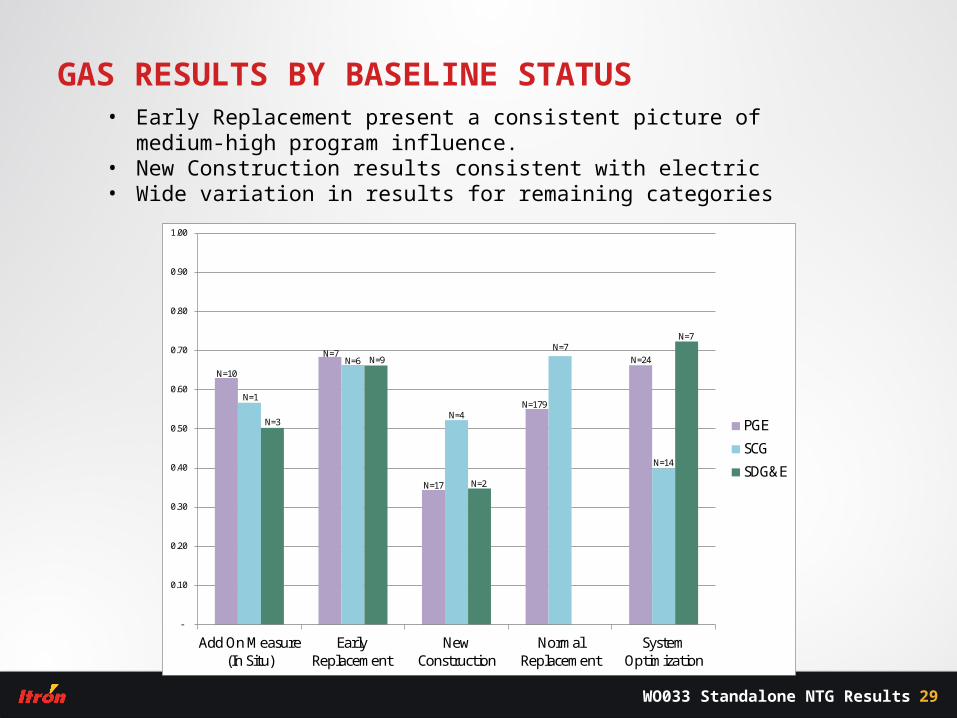
GAS RESULTS BY BASELINE STATUS• Early Replacement present a consistent picture of medium-high program
influence.• New Construction results consistent with electric• Wide variation in results for remaining categories
-
0.10
0.20
0.30
0.40
0.50
0.60
0.70
0.80
0.90
1.00
Add On Measure(In Situ)
EarlyReplacement
NewConstruction
NormalReplacement
SystemOptimization
PGE
SCG
SDG&E
N=10
N=7
N=17
N=179
N=24
N=1
N=6
N=4
N=7
N=14
N=3
N=9
N=2
N=7

ANALYSIS BY SIZE OF INCENTIVE

WO033 Standalone NTG Results 31
ELECTRIC RESULTS BY INCENTIVE LEVEL• Definitions: Low < $50,000/project; Medium - $50,000 - $200,000/project;
High >$200,000/project• Results relatively insensitive to incentive level

WO033 Standalone NTG Results 32
GAS RESULTS BY INCENTIVE LEVEL• Gas results similar to Electric - low sensitivity to incentive level

ANALYSIS BY BUSINESS TYPE
WO033 Standalone NTG Results 34
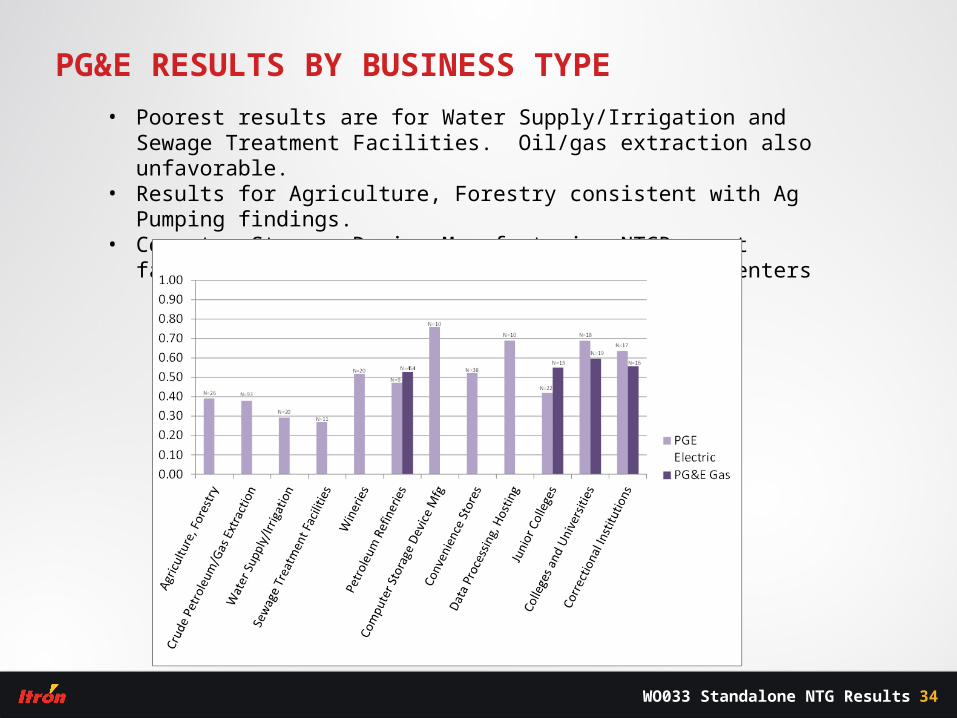
PG&E RESULTS BY BUSINESS TYPE
• Poorest results are for Water Supply/Irrigation and Sewage Treatment Facilities. Oil/gas extraction also unfavorable.
• Results for Agriculture, Forestry consistent with Ag Pumping findings.• Computer Storage Device Manufacturing NTGRs most favorable. These
are manufacturers, not Data Centers

WO033 Standalone NTG Results 35
SCE RESULTS BY BUSINESS TYPE
• Similar to PG&E, lowest NTGRs for the Sewage Treatment/Water Supply/Irrigation
• College and Universities segment had most favorable NTGR, consistent with findings for UC/CSU Statewide Partnership

WO033 Standalone NTG Results 36
SDG&E/SCG RESULTS BY BUSINESS TYPE
• College and Universities performed strongest, consistent with other findings for this segment.
• Petroleum Refinery NTGR consistent with PG&E findings for Oil/Gas• Poorest performance for R&D facility category.

KEY FINDINGS AND RECOMMENDATIONS

WO033 Standalone NTG Results 38
CONCLUSIONS
• Significant free ridership has persisted into this program cycle• Statewide NTGRs of 0.48 for electric programs and
0.53 for gas programs.• Evaluated NTGRs similar in magnitude to those
dating back to PY1998. • Insufficient adjustments have been made with respect
to either program designs or implementation procedures in order to reduce free ridership.
• Certain market segments and energy efficient measure categories experienced higher free ridership. • Water/Wastewater and Agricultural Pump Overhauls
had particularly low NTGRs

WO033 Standalone NTG Results 39
KEY RECOMMENDATIONS
• Adopt procedures to identify and affect projects with low program influence.
• Adjust the set of technologies that are eligible for incentives• Actively highlight and promote technologies that are
less well-adopted, cutting edge, or emerging technologies
• Designating the proper baseline is critical• Incent based on bundling of mandatory requirements
or optional features• Use a comprehensive rather than a prescriptive
approach to discourage free ridership.
WO033 Standalone NTG Results 40
KEY RECOMMENDATIONS• Adopt procedures to limit or exclude known free
riders. Critically examine the key reasons behind the project before the incentive is approved, for example:• Has the project already been included in the capital or
operating budget? Has the equipment already been ordered or installed?
• Is the measure one that the company or other comparable companies in the same industry/segment routinely installs as a standard practice? Is the measure installed in other locations, without co-funding by incentives? Is the measure potentially ISP?
• Is the project being done, in part, to comply with regulatory mandates (such as environmental regulations)?
• Are the project economics already compelling without incentives? Is the rebate large enough to make a difference in whether or not the project is implemented?
• Is the company in a market segment that is ahead of the curve on energy efficiency technology installations? Is it part of a national chain that already has a corporate policy to install the proposed technology?

WO033 Standalone NTG Results 41
KEY RECOMMENDATIONS
• Adopt procedures to limit or exclude known free riders. Critically examine the key reasons behind the project before the incentive is approved, for example:• Is the company in a market segment that is ahead of the
curve on energy efficiency technology installations? Is it part of a national chain that already has a corporate policy to install the proposed technology?
• Does the proposed measure have substantial non-energy benefits? Is it largely being considered for non-energy reasons (such as improved quality or increased production)?
• By conducting a brief interview before the incentive is approved, the implementer can better assess the likely degree of free ridership and can then decide if the project should be excluded or substantially re-scoped.
• Each item above can be tied to a new or enhanced program rule or guidance and program administrators can point to these requirements and minimize concerns over unfair/arbitrary decisionmaking.

WO033 Standalone NTG Results 42
KEY RECOMMENDATIONS
• Make and/or pilot changes to the incentive design• Consider tiering incentives by technology class.• Adopt a Payback Floor, excluding projects for which the
payback time is less than 12 months.• Offer bonuses to incent desirable behavior, e.g., installation
of multiple measures or installation by a first-time participant
• Use a sophisticated program design reflecting a comprehensive mix of program features and leveraging an array of delivery channels• Use a broad mix of program features and delivery channels
to market projects. • More information is needed on industrial project costs,
non-energy costs and benefits, net present value analysis, and associated participant cost-effectiveness analysis.• Rules of thumb, such as assuming that incentives
represent half of incremental costs, appear to have been used instead of actual incremental costs, as proxies.

THANK YOU
www.itron.com
CONSULTING & ANALYSIS GROUP
1111 Broadway
Oakland, CA