Embed Size (px)
Citation preview

www.pwc.de/realestateexperten
A survey on current real estate submarket differences to provide more transparency for investors.
Volume 5, H2 2016March 2017
PwC Real Estate Investor Survey Germany

PricewaterhouseCoopers GmbH Wirtschaftsprüfungsgesellschaft adheres to the PwC-Ethikgrundsätze/PwC Code of Conduct (available in German at www.pwc.de/de/ethikcode) and to the Ten Principles of the UN Global Compact (available in German and English at www.globalcompact.de).
© March 2017 PricewaterhouseCoopers GmbH Wirtschaftsprüfungsgesellschaft. All rights reserved. In this document, “PwC” refers to PricewaterhouseCoopers GmbH Wirtschaftsprüfungsgesellschaft, which is a member firm of PricewaterhouseCoopers International Limited (PwCIL). Each member firm of PwCIL is a separate and independent legal entity.
PwC Real Estate Investor Survey Germany Volume 5
Published by PricewaterhouseCoopers GmbH Wirtschaftsprüfungsgesellschaft
March 2017, 44 pages, 22 figures
All rights reserved. This material may not be reproduced in any form, or saved and edited in any digital medium without the express permission of the editor.
This publication is intended to be a resource for our clients, and the information therein was correct to the best of the authors’ knowledge at the time of publication. Before making any decision or taking any action, you should consult the sources or contacts listed here. The opinions reflected are those of the authors. The graphics may contain rounding differences.

1 Introduction ........................................................................................................ 4
2 Spotlight: Logistics and e-commerce ................................................................... 6
3 Office ................................................................................................................ 10
4 Retail ................................................................................................................ 16
5 Logistics ............................................................................................................ 24
6 Overview of the results ..................................................................................... 28
7 Approach and Definitions ................................................................................. 34
Authors ................................................................................................................. 38
PwC Real Estate Practice ....................................................................................... 40
Contents
Contents
PwC Real Estate Investor Survey Germany 3

1 Introduction
Introduction
4 PwC Real Estate Investor Survey Germany

PwC Real Estate Investor Survey Germany 5
The fifth issue of our Real Estate Investor Survey supports the general trend of compression in yields for office, retail and logistics (under review for the first time) in German submarkets. The results of this issue show that the consistent yield compression in all the asset classes and German submarkets seen in previous periods has lost momentum in the second half of 2016.
Core office properties in B-Cities did not, on average, increase in price. Some sub-markets, such as Mainz-Wiesbaden, Rhine-Neckar or Bremen, even showed negative development. Core assets in Top 7 Cities, however, continued advancing in a strong investment climate and experienced further yield compression. Berlin showed the strongest performance with a compression of 40 bps to a minimum all-risk-yield (ARY) of 3.5%.
An inverse development was observed in the high street retail market, meaning that the price of retail properties in A-Cities did not increase, i.e., did not show any additional yield compression. Instead, B-City high street properties showed considerable yield compression with 20 bps on average. Key drivers of this cluster were cities such as Dresden, Leipzig, Hanover and Karlsruhe.
In the current issue we introduced the logistics sector for the first time with a spot light on future trends for this type of property use.
We gathered our data by interviewing market participants. These included investment and research professionals of real estate investors, varying from conservative asset managers to developers and private equity investors.
Introduction

2 Spotlight: Logistics and e-commerce
Spotlight: Logistics and e-commerce
6 PwC Real Estate Investor Survey Germany

PwC Real Estate Investor Survey Germany 7
German logistics properties continued to see increasing demand from both, users and investors. Recent research suggested that 9% (€4.6bn) of German commercial real estate investments went into logistics in 2016 (+15%/€600m YOY), with gross initial yields declining to levels as low as 5.0%. The unstoppable rise of e-commerce has not only changed the way we shop and retail businesses operate, but also the dimension of logistics involved in these transactions. It changes the operators’ location and layout requirements of providing the quickest and most efficient delivery to the customer. These circumstances have created a new type of logistics space where modern product handling systems cut handling costs, which in turn drives up efficiency and the value of modern logistics space. Hence, cash flows appear less risky to investors, especially since an increasing number of highly solvent retailers take up this type of logistics space.
Reason enough for PwC to have a closer look at what drives the German logistics market. We have therefore asked leading industry experts from our investor survey panel for their current view of the sector and its trends, the obstacles the sector is facing, and Germany’s up-and-coming logistics locations.
2.1 Trends in the logistics sector
Industry experts observed two market trends that result from e-commerce and are currently shaping the German logistics market: demand for urban logistics and – as a subcategory – demand for fresh food logistics.
Handling the last mile to the customer quickly and cost-effectively is key to success, i.e., the location of logistics activity in particular has become a crucial factor for any business related to e-commerce. Experts reported an increasing demand for logistics space in fringe areas of major German cities. They recorded rental levels for urban logistics are well above what could be achieved for traditional logistics properties. In light of new sales approaches – including same-day delivery, which, according to experts, will eventually become the new standard in e-commerce – the location of logistics property in terms of its proximity to the customer will become even more important.
According to our interviewees, a typical modern urban logistics space encompasses an 8,000-to-10,000m2 lettable area with ceilings that are 10 to 12 metres high. In addition, fresh food logistics companies require high-spec building fit-outs to facilitate temperature-controlled, high-bay warehousing and high-frequency product handling. Since existing buildings hardly ever meet these criteria, properties devoted to today’s fresh food logistics are almost exclusively subject to new development.
Our industry experts also believe that large central logistics warehouses will remain the backbone of any urban logistics space. Transregional strategic bases in the form of logistics warehouses larger than 100,000m2 are becoming the market standard.
Spotlight: Logistics and e-commerce

When choosing a location, the human element, i.e., the availability of labour, has started to become a subordinated factor due to the increased automation of logistics. At the same time, areas with low population density are said to be limited in developing potential for larger logistics bases due to a lack of employees.
Our panel has projected increased investor demand for German logistics properties in the next twelve months. As e-commerce has started to extend the range of logistics as an asset class, for instance, by creating low risk-return urban logistics properties, it has brought logistics investments to the attention of a larger investor base. Industry experts believe this positive development will continue throughout the year. Experts also point out, however, the limited scope of urban logistics might impede sole investments from institutional investors. Unlike regional and private investors, institutional investors may, therefore, be restricted to investing in urban logistics space as part of a larger portfolio only.
2.2 Recent challenges for urban logistics developments
The amount of logistics spaces in urban areas inevitably needs to grow to meet the demands of modern e-commerce. However, according to our panel of experts, the sector faces several challenges as it expands.
First of all, one of the EU’s milestones for a sustainable and resource-efficient Europe is to restrict any new sealing of soil surfaces in member states and to drive-down new sealing levels to zero by 2050. Therefore, new urban logistics development is almost exclusively bound to brownfield activities. Secondly, in the experts’ view, the logistics sector remains rather unpopular among both city officials and local residents. Logistics creates traffic, provides only a few, low-paid jobs, and generates little tax revenues. All this leaves logistics projects less attractive and, hence, city authorities are reluctant to grant building permits.
Our experts believe that both factors will contribute heavily to a long-term space shortage of urban logistics space. Along with this, rent and property prices will increase; metropolitan regions with major space shortages, amongst others based on geographical conditions, are anticipated to show growth in rental levels by 5% p.a. and an increase in land prices of up to 150% in the next twelve months, especially in southern Germany.
Satisfying the growing demand for urban logistics space will require the revitalisation of brownfield land. An example is the Ruhr region, where old industrial sites located in higher-density areas with good infrastructure can be reused successfully.
Spotlight logistics and e-commerce
8 PwC Real Estate Investor Survey Germany

PwC Real Estate Investor Survey Germany 9
Spotlight logistics and e-commerce
2.3 Upcoming locations
All investors surveyed noted that demand is rapidly increasing in southern German metropolitan regions with the least available space, e.g., Munich and Stuttgart. As a result, rent and property prices will experience unprecedented growth, with rents for smaller urban logistics spaces reaching up to €9 per square metre in the greater Munich area.
As mentioned above, the Ruhr region shows high potential and will most certainly profit from this trend. However, rental levels will remain stable in the near future due to the high availability of brownfield land, as a result of the region’s structural change.
Finally, northeastern Germany – specifically, the region around Leipzig/Halle, Hanover and Berlin – is suitable from a strategic point of view due to the availability of space for logistics developments. According to experts, prices are not anticipated to rise significantly in the near future.

10 PwC Real Estate Investor Survey Germany
3 Office
All-risk-yields offices

PwC Real Estate Investor Survey Germany 11
All-risk-yields offices
3.1. Net operating income for the office market
Our participants generally included non-recoverable service charges, maintenance expenses, property management and rent loss into the calculation of their net operating income (NOI). Less than 20% of respondents considered tenant improvements, leasing commissions or Capex to be sustainable. These items are therefore largely treated as one-off items, which are considered below NOI.
3.0%
0% 5% 10% 15% 20% 25%
Non-recoverable service charges
Maintenance expenses
Property management
Rent loss
Non-recoverable Opex
Tenant improvements
Leasing commisions
Capex
Fig. 1 NOI calculation method for the office market
16.6%4.5%
12.0%2.5%
5.5%2.0%
0.5%
8.3%2.0%
5.0%1.0%
4.0%1.0%
2.1%
1.0%
12 PwC Real Estate Investor Survey Germany
All-risk-yields offices
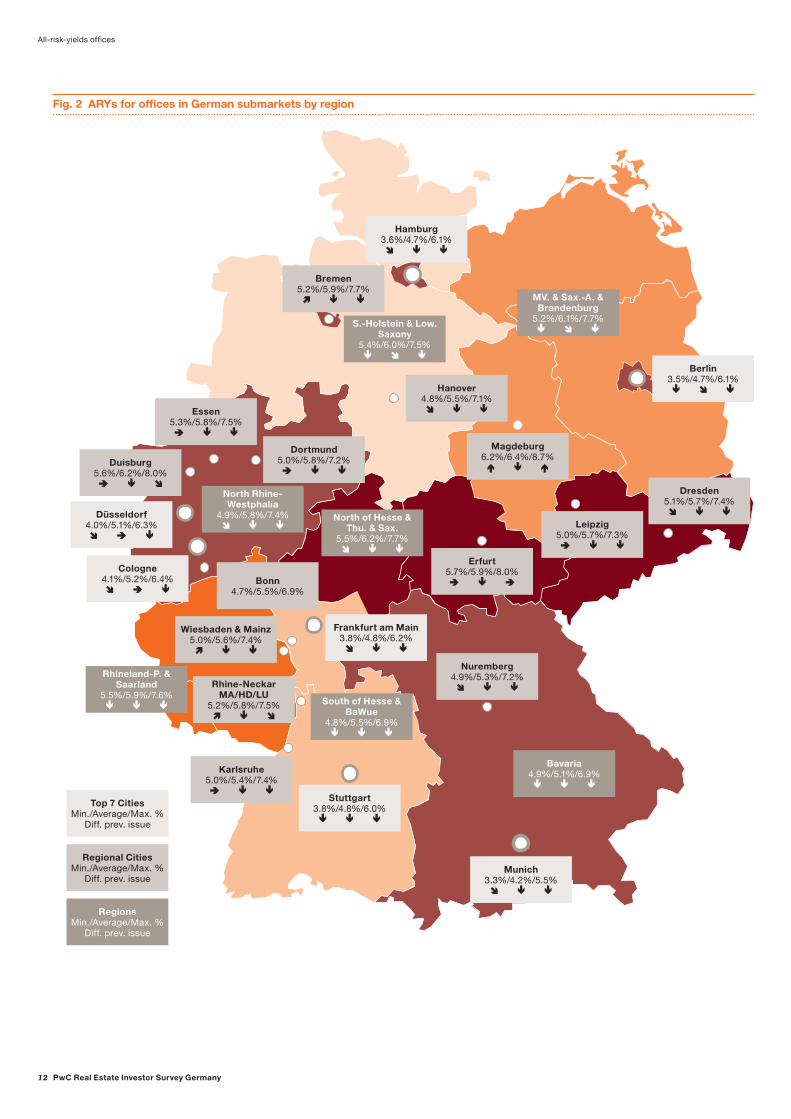
Fig. 2 ARYs for offices in German submarkets by region
Frankfurt
Bremen5.2%/5.9%/7.7%
S.-Holstein & Low. Saxony
5.4%/6.0%/7.5%
North Rhine- Westphalia
4.9%/5.8%/7.4%
Hanover4.8%/5.5%/7.1% Essen
5.3%/5.8%/7.5%
Dortmund5.0%/5.8%/7.2%
Duisburg5.6%/6.2%/8.0%
Dresden5.1%/5.7%/7.4%
Wiesbaden & Mainz5.0%/5.6%/7.4%
Rhine-NeckarMA/HD/LU
5.2%/5.8%/7.5%
Rhineland-P. &Saarland
5.5%/5.9%/7.6%
Nuremberg4.9%/5.3%/7.2%
Hamburg3.6%/4.7%/6.1%
Cologne4.1%/5.2%/6.4%
Düsseldorf4.0%/5.1%/6.3%
Stuttgart3.8%/4.8%/6.0%
Karlsruhe5.0%/5.4%/7.4%
South of Hesse & BaWue
4.8%/5.5%/6.9%
Bavaria4.9%/5.1%/6.9%
Munich3.3%/4.2%/5.5%
Frankfurt am Main3.8%/4.8%/6.2%
Erfurt5.7%/5.9%/8.0%
North of Hesse & Thu. & Sax.
5.5%/6.2%/7.7%
Magdeburg6.2%/6.4%/8.7%
Leipzig5.0%/5.7%/7.3%
MV. & Sax.-A. & Brandenburg
5.2%/6.1%/7.7%
Top 7 CitiesMin./Average/Max. %
Diff. prev. issue
Regional CitiesMin./Average/Max. %
Diff. prev. issue
RegionsMin./Average/Max. %
Diff. prev. issue
Berlin3.5%/4.7%/6.1%
Bonn4.7%/5.5%/6.9%

PwC Real Estate Investor Survey Germany 13
All-risk-yields offices
3.2 All-risk-yield for the office market
The second half of 2016 showed a continued yield compression in all of the Top 7 Cities throughout prime, average and weaker properties (minimum, average and maximum ARYs). Berlin displayed the strongest yield compression with 40 bps, now with a minimum ARY of 3.5%, almost catching up with Munich’s minimum ARY (3.3%). The second-strongest mover was Stuttgart, with a drop of 30 bps, putting its minimum ARY on a comparable level with Frankfurt’s.
On average, minimum ARYs in Regional Cities show no further yield compression. Given the consistent yield compression in previous periods, particularly in the first half of 2016, it indicates a turning point in price development of prime properties in these secondary cities and a potential trend of investors turning away from B-City strategies in the office sector.
A higher level of minimum ARY yield compression was observed in the Regions as well, and is driven by strong smaller cities such as Freiburg, Augsburg or Potsdam.
3.3 Letting parameters for the office market
Fig. 3 Letting parameters for the office market
Rent free period (months) Marketing period (months)Extension propability
Annual market rent growth rate
Top 7 Cities Min. Med. Max. Min. Med. Max.
Berlin 1 2 4 5 6 7 1 3 4 7 8 11 67.0% 67.5% 2.8% 2.6%
Düsseldorf 2 3 4 5 8 7 2 4 6 8 10 12 66.0% 68.3% 1.4% 1.6%
Frankfurt am Main 2 4 5 7 8 10 2 5 5 10 10 15 61.0% 64.2% 1.6% 1.5%
Hamburg 2 3 4 5 6 7 2 4 5 8 10 12 65.0% 67.1% 1.8% 1.8%
Cologne 2 3 5 6 7 8 2 4 5 9 10 13 66.0% 68.3% 1.6% 1.8%
Munich 1 2 3 5 5 7 2 3 5 6 7 10 71.0% 72.1% 2.3% 2.4%
Stuttgart 1 2 4 5 6 7 2 4 5 8 10 11 65.0% 75.0% 1.5% 1.7%
Volume 5 H2 2016
Volume 4 H1 2016
14 PwC Real Estate Investor Survey Germany
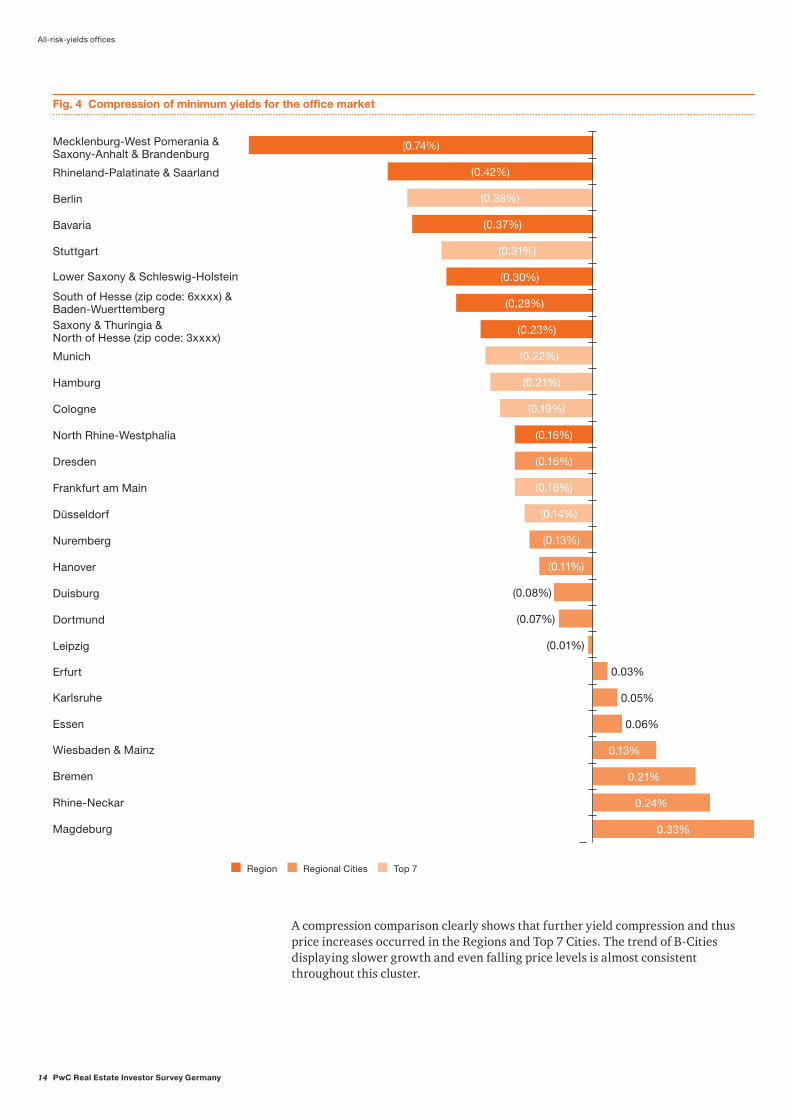
Fig. 4 Compression of minimum yields for the office market
Mecklenburg-West Pomerania & Saxony-Anhalt & Brandenburg
Rhineland-Palatinate & Saarland
Berlin
Bavaria
Stuttgart
Lower Saxony & Schleswig-Holstein
South of Hesse (zip code: 6xxxx) &Baden-Wuerttemberg Saxony & Thuringia &North of Hesse (zip code: 3xxxx)
Munich
Hamburg
Cologne
North Rhine-Westphalia
Dresden
Frankfurt am Main
Düsseldorf
Nuremberg
Hanover
Duisburg
Dortmund
Leipzig
Erfurt
Karlsruhe
Essen
Wiesbaden & Mainz
Bremen
Rhine-Neckar
Magdeburg
(0.16%)
(0.13%)
(0.11%)
0.13%
0.21%
0.24%
0.33%
(0.74%)
(0.42%)
(0.37%)
(0.30%)
(0.28%)
(0.23%)
(0.16%)
(0.38%)
(0.31%)
(0.22%)
(0.21%)
(0.19%)
(0.16%)
(0.14%)
(0.08%)
(0.07%)
(0.01%)
0.03%
0.05%
0.06%
Region Regional Cities Top 7
A compression comparison clearly shows that further yield compression and thus price increases occurred in the Regions and Top 7 Cities. The trend of B-Cities displaying slower growth and even falling price levels is almost consistent throughout this cluster.
All-risk-yields offices

PwC Real Estate Investor Survey Germany 15
4.7%
5.1%
4.8%
4.7%
5.2%
4.2%
4.8%
5.9%
5.8%
5.7%
6.2%
5.9%
5.8%
5.4%
5.5%
5.7%
6.4%
5.6%
5.3%
5.8%
5.5%
6.0%
6.1%
6.2%
5.8%
5.9%
5.5%
5.1%
Fig. 5 ARYs for offices in German submarkets by category
Top 7 Cities
Berlin
Düsseldorf
Frankfurt am Main
Hamburg
Cologne
Munich
Stuttgart
Regional Cities
Bonn
Bremen
Dortmund
Dresden
Duisburg
Erfurt
Essen
Karlsruhe
Hanover
Leipzig
Magdeburg
Wiesbaden & Mainz
Nuremberg
Rhine-Neckar MA/HD/LU
Regions
Lower Saxony & Schleswig-Holstein
Mecklenburg-West Pomerania & Saxony-Anhalt & Brandenburg
Saxony & Thuringia & North of Hesse (zip code: 3xxxx)
North Rhine-Westphalia
Rhineland-Palatinate & Saarland
South of Hesse (zip code: 6xxxx) & Baden-Wuerttemberg
Bavaria
0 2 4 6 8 10
3.5%
4.0% 6.3%
3.8% 6.2%
3.6% 6.1%
4.1% 6.4%
3.3% 5.5%
3.8% 6.0%
5.2% 7.7%
5.0% 7.2%
5.1% 7.4%
5.6% 8.0%
5.7% 8.0%
5.3% 7.5%
5.0% 7.4%
4.8% 7.1%
5.0% 7.3%
5.0% 7.4%
4.9% 7.2%
5.2% 7.5%
5.4% 7.5%
5.2% 7.7%
5.5% 7.7%
4.9% 7.4%
5.5% 7.6%
4.8% 6.9%
4.9% 6.9%
6.2% 8.7%
6.1%
Average % 6 months agoMin. % Max. %
4.7% 6.9%
All-risk-yields offices

4 Retail
All-risk-yields retail
16 PwC Real Estate Investor Survey Germany
PwC Real Estate Investor Survey Germany 17
All-risk-yields retail
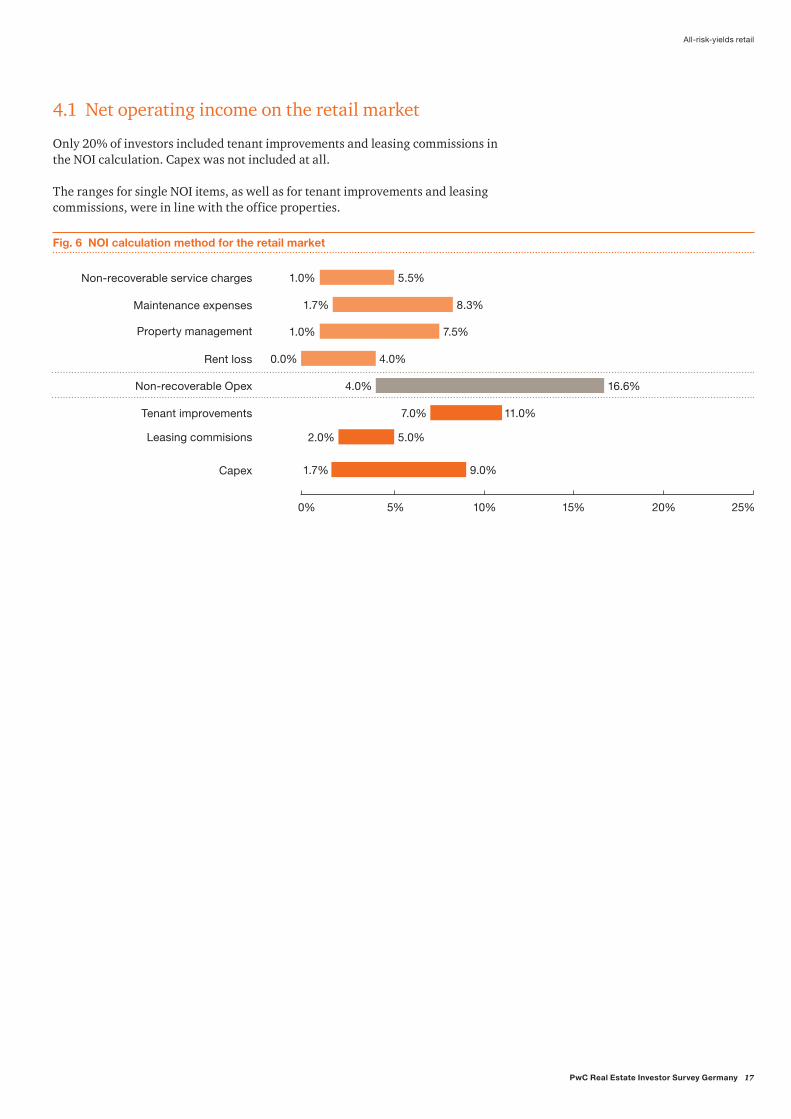
4.1 Net operating income on the retail market
Only 20% of investors included tenant improvements and leasing commissions in the NOI calculation. Capex was not included at all.
The ranges for single NOI items, as well as for tenant improvements and leasing commissions, were in line with the office properties.
Fig. 6 NOI calculation method for the retail market
4.0%
0% 5% 10% 15% 20% 25%
16.6%4.0%
11.0%
8.3%1.7%
5.5%1.0%
7.5%1.0%
9.0%
5.0%
0.0%
7.0%
2.0%
1.7%
Non-recoverable service charges
Maintenance expenses
Property management
Rent loss
Non-recoverable Opex
Tenant improvements
Leasing commisions
Capex

18 PwC Real Estate Investor Survey Germany
All-risk-yields retail
Fig. 7 ARYs for high street retail in German submarkets by geography
Frankfurt
Bremen4.5%/5.4%/6.5%
S.-Holstein & Low. Saxony
5.1%/5.4%/7.6%
North Rhine- Westphalia
5.1%/5.5%/7.8%
Hanover4.3%/5.1%/6.3% Essen
4.6%/5.5%/6.6%
Dortmund4.5%/5.3%/6.5%
Duisburg5.1%/5.8%/7.4%
Dresden4.2%/5.1%/6.5%
Wiesbaden & Mainz4.5%/5.2%/6.6%
Rhine-NeckarMA/HD/LU
4.5%/5.4%/7.0%
Rhineland-P. &Saarland
5.2%/5.7%/7.6%
Nuremberg4.2%/5.0%/6.3%
Hamburg3.5%/4.2%/5.1%
Cologne3.6%/4.3%/5.2%
Düsseldorf3.5%/4.2%/5.1%
Stuttgart3.5%/4.1%/4.9%
Karlsruhe4.4%/5.1%/6.4%
South of Hesse & BaWue
4.6%/5.3%/7.0%
Bavaria4.4%/5.1%/6.5%
Munich3.0%/3.8%/4.5%
Frankfurt am Main3.5%/4.3%/5.1%
Erfurt4.9%/5.6%/6.8%
North of Hesse & Thu. & Sax.
5.5%/5.9%/8.1%
Magdeburg5.4%/6.0%/7.4%
Leipzig4.2%/5.1%/6.5%
MV. & Sax.-A. & Brandenburg
5.2%/6.0%/8.3%
Top 7 CitiesMin./Average/Max. %
Diff. prev. issue
Regional CitiesMin./Average/Max. %
Diff. prev. issue
RegionsMin./Average/Max. %
Diff. prev. issue
Berlin3.3%/4.1%/5.0%
Bonn4.3%/4.9%/6.0%

PwC Real Estate Investor Survey Germany 19
4.2 ARY in high street retail
Though we still observed compression in some markets for high street retail, the trend of increasing ARYs is more distinctive than for office. Regions, in particular, exhibited growing yields.
In Top 7 Cities, minimum ARYs remained unchanged. Only Stuttgart showed a significant reduction in ARYs, which supports a general investor attitude towards the attractiveness of the city. Average and maximum yields showed still a slight compression on average.
The Regional Cities still exhibited relatively strong compression of minimum ARYs. Dresden, Leipzig and Hanover showed the most notable compression, with 51, 43 and 26 bps, respectively. Only Erfurt and Mainz-Wiesbaden remained at the same level of minimum ARYs.
We observed a clear differentiation in the Regions category. On the one hand, Lower Saxony, Schleswig-Holstein, Saxony, Thuringia, and north of Hesse and North Rhine-Westphalia exhibites decrease in prices (see Fig. 9). On the other hand, Mecklenburg-West Pomerania, Saxony-Anhalt, Brandenburg, and south of Hesse as well as Baden-Württemberg and Bavaria still showed compression.
We see compression across almost all Regional Cities and Regions for the average and maximum ARYs.
Overall, the results indicate that the high street retail market is close to saturation. Future development will depend strongly on external macroeconomic developments.
We observe a significant downturn of annual rental growth across all markets. Investors only expect over 2% growth in Munich. The annual growth in the other Top 7 Cities is between 1.4% and 1.9%. In Regional Cities and Regions it is between 0.2% and 1% (Karlsruhe).
4.3 Letting parameters for high street retail
All-risk-yields retail
Fig. 8 Letting parameters for the retail market
Rent free period (months) Marketing period (months)Extension propability
Annual market rent growth rate
Top 7 Cities Min. Med. Max. Min. Med. Max.
Berlin 2 0 4 2 5 3 2 1 5 4 7 5 81.0% 78.3% 1.9% 2.6%
Düsseldorf 3 1 4 3 6 4 3 2 6 4 9 6 75.0% 77.5% 1.4% 2.1%
Frankfurt am Main 1 1 3 4 6 4 1 2 5 5 8 6 77.0% 76.7% 1.7% 2.4%
Hamburg 2 0 4 2 5 4 1 1 5 4 7 5 79.0% 80.0% 1.7% 2.2%
Cologne 2 1 5 4 9 5 2 2 6 5 9 6 73.0% 75.8% 1.6% 1.6%
Munich 1 0 4 2 4 3 1 1 4 3 6 4 83.0% 80.4% 2.1% 2.9%
Stuttgart 1 1 4 4 7 4 2 2 5 4 7 5 78.0% 79.5% 1.7% 1.5%
Volume 5 H2 2016
Volume 4 H1 2016

20 PwC Real Estate Investor Survey Germany
All-risk-yields retail
Fig. 9 Compression of minimum yields in high street retail
Dresden
Leipzig
Hanover
South of Hesse (zip code: 6xxxx) &Baden-Wuerttemberg
Karlsruhe
Rhine-Neckar
Stuttgart
Nuremberg
Bremen
Bavaria
Magdeburg
Essen
Mecklenburg-West Pomerania &Saxony-Anhalt & Brandenburg
Duisburg
Dortmund
Berlin
Erfurt
Cologne
Frankfurt am Main
Rhineland-Palatinate & Saarland
Munich
Düsseldorf
Wiesbaden & Mainz
Hamburg
Lower Saxony & Schleswig-Holstein
Saxony & Thuringia & North ofHesse (zip code: 3xxxx)
North Rhine-Westphalia
Region Regional Cities Top 7
(0.51%)
(0.43%)
(0.26%)
(0.23%)
(0.19%)
(0.18%)
(0.15%)
(0.13%)
(0.13%)
(0.23%)
(0.14%)
(0.18%)
(0.06%)
(0.10%)
(0.10%)
(0.10%)
(0.02%)
(0.01%)
(0.05%)
0.02%
0.10%
0.02%
0.04%
0.06%
0.07%
0.25%
0.47%

PwC Real Estate Investor Survey Germany 21
All-risk-yields retail
Fig. 10 ARYs for high street retail in German submarkets by category
4.1%
4.2%
4.3%
4.2%
4.3%
3.8%
4.1%
5.4%
5.3%
5.1%
5.8%
5.6%
5.5%
5.1%
5.1%
5.1%
6.0%
5.2%
5.0%
5.4%
4.9%
5.4%
6.0%
5.9%
5.5%
5.7%
5.3%
5.1%
Top 7 Cities
Berlin
Düsseldorf
Frankfurt am Main
Hamburg
Cologne
Munich
Stuttgart
Regional Cities
Bonn
Bremen
Dortmund
Dresden
Duisburg
Erfurt
Essen
Karlsruhe
Hanover
Leipzig
Magdeburg
Wiesbaden & Mainz
Nuremberg
Rhine-Neckar MA/HD/LU
Regions
Lower Saxony & Schleswig-Holstein
Mecklenburg-West Pomerania & Saxony-Anhalt & Brandenburg
Saxony & Thuringia & North of Hesse (zip code: 3xxxx)
North Rhine-Westphalia
Rhineland-Palatinate & Saarland
South of Hesse (zip code: 6xxxx) & Baden-Wuerttemberg
Bavaria
0 2 4 6 8 10
3.3%
3.5% 5.1%
3.5% 5.1%
3.5% 5.1%
3.6% 5.2%
3.0% 4.5%
3.5% 4.9%
4.5% 6.5%
4.5% 6.5%
4.2% 6.5%
5.1% 7.4%
4.9% 6.8%
4.6% 6.6%
4.4% 6.4%
4.3% 6.3%
4.2% 6.5%
4.5% 6.6%
4.2% 6.3%
4.5% 7.0%
5.1% 7.6%
5.2% 8.3%
5.5% 8.1%
5.1% 7.8%
5.2% 7.6%
4.6% 7.0%
4.4% 6.5%
5.4% 7.4%
5.0%
4.3% 6.0%
Average % 6 months agoMin. % Max. %

22 PwC Real Estate Investor Survey Germany
All-risk-yields retail
Fig. 11 ARYs for retail (excl. high street) in German submarkets by category
All-risk-yieldRent free period
(months)Marketing period
(months)Extension propability
Annual market rent growth rate
Min. Med. Max. Min. Med. Max. Min. Med. Max.
Out-of-town shopping center
4.5% 5.5% 7.2% 3 2 9 5 6 7 2 2 12 8 6 12 68.0% 61.0% 0.4% 1.0%
Retail park 4.8% 5.8% 8.0% 2 2 8 6 8 9 2 2 14 8 6 12 66.0% 61.5% 0.4% 0.7%
Super-market
5.3% 6.2% 9.1% 2 3 8 6 5 8 2 3 15 7 3 12 70.0% 60.6% 0.3% 0.6%
DIY-store 6.0% 7.1% 9.6% 5 4 11 7 3 10 4 5 18 9 3 12 72.5% 64.3% 0.1% 0.5%
Volume 5 H2 2016
Volume 4 H1 2016
4.4 All-risk-yield and letting parameters: non-high street retail
Retail, excluding high street, showed further compression. However, the minimum ARYs across all property types showed much lower compression than the average and maximum yields.
Annual market rental growth was in line with the high street rental – the rental growth is significantly lower than in the previous issue.

PwC Real Estate Investor Survey Germany 23
All-risk-yields retail

5 Logistics
All-risk-yields logistics
24 PwC Real Estate Investor Survey Germany

PwC Real Estate Investor Survey Germany 25
All-risk-yields logistics
5.1 ARYs in logistics
Fig. 12 ARYs for logistics properties in German submarkets by location
Top 15 Locations (Min./Average/Max. %) Motorways Top 15 Locations (Min./Average/Max. %) Motorways
Small Locations (such as: Aachen,
Saarbrücken, Karlsruhe/Freiburg,
Osnabrück/Münster, Rhein-Neckar,
Bad Hersfeld, Erfurt, Augsburg,
Magdeburg, Dresden)6.1%/6.6%/8.0%
Munich5.0%/5.7%/7.1%
Regensburg/Passau5.3%/6.5%/7.5%
Ulm 5.7%/6.5%/7.7%
Berlin5.1%/5.9%/7.4%
Dortmund 5.5%/6.4%/7.6%
Düsseldorf/Cologne5.1%/6.1%/7.5%
Rhine-Main/Frankfurt
5.0%/5.7%/7.2%
Hanover/Braunschweig
5.5%/6.4%/7.6%
Hamburg5.1%/6.0%/7.3%
Stuttgart5.1%/6.1%/7.3%
Nuremberg5.5%/6.4%/7.4%
Bremen/Bremerhaven/Wilhelmshaven5.5%/6.5%/7.3%
Rhine-Ruhr 5.5%/6.4%/7.7%
Halle/Leipzig5.5%/6.4%/7.7%
Kassel/Göttingen5.5%/6.5%/7.6%

26 PwC Real Estate Investor Survey Germany
All-risk-yields logistics
All-risk-yields in Top 15 Locations are lower compared to those in smaller locations, accounting for larger markets and lower risk. Munich provides the lowest yield in which assets are traded at 5.0% closely followed by Rhine-Main/Frankfurt and Hamburg. Among the Top 15 locations, the six logistics hubs around the Top 7 Cities (counting Cologne and Düsseldorf as one city) are by far still the most expensive.
Minimum ARYs for the remaining nine hubs represent a fairly homogeneous cluster. Maximum ARYs throughout the Top 15 locations display no specific pattern, which indicates that weaker properties are treated individually and are more or less independent of the respective market.
Fig. 13 ARYs for logistics properties in German submarkets by category
Top 15 Locations
Berlin
Düsseldorf/Cologne
Rhine-Main/Frankfurt
Hamburg
Munich
Stuttgart
Bremen/North Sea ports
Dortmund
Halle/Leipzig
Hanover/Braunschweig
Kassel/Göttingen
Lower Bavaria
Nuremberg
Rhine-Ruhr
Ulm
Small locations
Small locations
5.1%
5.5%
7.4%
7.3%
5.1%
5.5%
7.5%
7.6%
5.0%
5.5%
7.2%
7.7%
5.1%
5.5%
7.3%
7.6%
5.0%
5.5%
5.5%
7.1%
7.6%
7.4%
5.1%
5.3%
5.5%
7.3%
7.5%
7.7%
5.7% 7.7%
6.1% 8.0%
0 2 4 6 8 10
Average %Min. % Max. %
5.9%
6.5%
6.1%
6.4%
5.7%
6.4%
6.0%
6.4%
5.7%
6.5%
6.4%
6.1%
6.5%
6.4%
6.5%
6.6

PwC Real Estate Investor Survey Germany 27
All-risk-yields logistics
5.2 Letting parameters for the logistics market
For the Top 15 Locations, rent-free periods range from two to twelve months for a typical contract of five to ten years. The marketing period is not expected to be shorter than two months and can go up to 14 months. The average Top 15 Locations probability of rental prolongation is 68.0%.
Fig. 14 Letting parameters for the logistics market
Rent free period (months) Marketing period (months)Extension propability
Annual market rent growth rate
Min. Med. Max. Min. Med. Max.
Top 15 Locations 2 6 12 2 14 10 68.0% 1.4%
Small locations n/a n/a n/a n/a n/a n/a n/a 0.0%
Volume 5 H2 2016

6 Overview of the results
Overview of the results
28 PwC Real Estate Investor Survey Germany

PwC Real Estate Investor Survey Germany 29
Overview of the results
Fig. 15 Yield comparison
31.12.14 30.06.15 31.12.15 30.06.16 31.12.16
PwC Average ARY office (AVG ARY includes only minimum ARY for Top 7 Cities and Regional Cities)
5.4% 5.1% 4.8% 4.6% 4.5%
PwC Average ARY retail (AVG ARY includes only minimum ARY for Top 7 Cities and Regional Cities)
5.0% 4.8% 4.3% 4.1% 4.0%
PwC Average ARY logistics (AVG ARY includes only minimum ARY for Top 15 Locations)
– – – – 5.3%
CPI Index1 0.2% 0.9% 0.4% 0.3% 1.7%
10-y Germany government bonds2 0.5% 0.8% 0.6% 0.0% 0.2%
3-M-Euribor3 0.1% (0.0%) (0.1%) (0.3%) (0.3%)1 Statistisches Bundesamt2 Bloomberg3 ECB: Historical close, average of observations through period

30 PwC Real Estate Investor Survey Germany
Office
Current 6 months ago 12 months ago
Min. Ø Max. Annual market rent growth rate
Min. Ø Max. Min. Ø Max.
Top 7 Cities
Berlin 3.5% 4.7% 6.1% 2.8% 3.9% 4.9% 6.6% 4.0% 4.9% 7.5%
Düsseldorf 4.0% 5.1% 6.3% 1.4% 4.2% 5.0% 6.8% 4.2% 5.1% 7.5%
Frankfurt am Main 3.8% 4.8% 6.2% 1.6% 4.0% 5.0% 6.6% 4.1% 5.0% 7.4%
Hamburg 3.6% 4.7% 6.1% 1.8% 3.8% 4.9% 6.6% 4.0% 5.0% 7.2%
Cologne 4.1% 5.2% 6.4% 1.6% 4.2% 5.2% 6.7% 4.5% 5.5% 7.8%
Munich 3.3% 4.2% 5.5% 2.3% 3.5% 4.6% 6.2% 3.7% 4.5% 6.5%
Stuttgart 3.8% 4.8% 6.0% 1.5% 4.1% 5.0% 6.7% 4.2% 5.0% 7.5%
Regional Cities
Bonn 4.7% 5.5% 6.9% 1.2% 0.0% 0.0% 0.0% 0.0% 0.0% 0.0%
Bremen 5.2% 5.9% 7.7% 0.5% 5.0% 6.4% 8.2% 5.4% 6.5% 8.7%
Dortmund 5.0% 5.8% 7.2% 0.6% 5.1% 6.3% 8.2% 5.5% 6.4% 8.2%
Dresden 5.1% 5.7% 7.4% 1.0% 5.2% 6.4% 8.2% 5.6% 7.0% 8.1%
Duisburg 5.6% 6.2% 8.0% 0.5% 5.7% 6.9% 8.2% 6.2% 7.1% 8.3%
Erfurt 5.7% 5.9% 8.0% 0.6% 5.7% 6.9% 8.0% 5.9% 6.9% 8.2%
Essen 5.3% 5.8% 7.5% 0.6% 5.2% 6.4% 7.9% 5.6% 6.8% 8.3%
Karlsruhe 5.0% 5.4% 7.4% 0.8% 4.9% 6.1% 7.9% 5.1% 6.4% 7.7%
Hanover 4.8% 5.5% 7.1% 1.1% 4.9% 6.0% 7.9% 5.3% 6.5% 8.3%
Leipzig 5.0% 5.7% 7.3% 1.3% 5.0% 6.2% 8.2% 5.3% 6.3% 7.8%
Magdeburg 6.2% 6.4% 8.7% 0.4% 5.8% 7.2% 8.3% 6.4% 7.9% 8.4%
Wiesbaden & Mainz 5.0% 5.6% 7.4% 0.6% 4.9% 6.1% 7.8% 5.3% 6.2% 7.5%
Nuremberg 4.9% 5.3% 7.2% 0.5% 5.0% 6.1% 7.8% 5.3% 6.0% 8.0%
Rhine-Neckar MA/HD/LU 5.2% 5.8% 7.5% 0.4% 5.0% 6.2% 7.7% 5.3% 6.4% 7.7%
Regions
Lower Saxony & Schleswig-Holstein
5.4% 6.0% 7.5% 0.3% 5.7% 6.2% 8.1% 5.8% 6.6% 8.7%
Mecklenburg-West Pomerania & Saxony-Anhalt & Brandenburg
5.2% 6.1% 7.7% 0.1% 5.9% 6.3% 8.6% 6.2% 6.8% 8.8%
Saxony & Thuringia & North of Hesse (zip code: 3xxxx)
5.5% 6.2% 7.7% 0.3% 5.7% 6.5% 8.6% 6.0% 7.0% 8.8%
North Rhine-Westphalia 4.9% 5.8% 7.4% 0.3% 5.1% 6.2% 8.5% 5.4% 6.5% 8.5%
Rhineland-Palatinate & Saarland
5.5% 5.9% 7.6% 0.0% 5.9% 6.3% 8.3% 6.2% 6.9% 8.8%
South of Hesse (zip code: 6xxxx) & Baden- Wuerttemberg
4.8% 5.5% 6.9% 0.7% 5.1% 5.9% 7.9% 5.4% 6.5% 8.6%
Bavaria 4.9% 5.1% 6.9% 0.6% 5.3% 5.9% 8.1% 5.5% 6.4% 8.3%
Fig. 16 Results overview
Overview of the results

PwC Real Estate Investor Survey Germany 31
Retail
Current 6 months ago 12 months ago
Min. Ø Max. Annual market rent growth rate
Min. Ø Max. Min. Ø Max.
Top 7 Cities
Berlin 3.3% 4.1% 5.0% 1.9% 3.4% 4.5% 5.3% 3.7% 4.8% 6.3%
Düsseldorf 3.5% 4.2% 5.1% 1.4% 3.5% 4.5% 5.2% 3.7% 5.0% 6.0%
Frankfurt am Main 3.5% 4.3% 5.1% 1.7% 3.5% 4.6% 5.3% 3.7% 5.0% 6.0%
Hamburg 3.5% 4.2% 5.1% 1.7% 3.4% 4.5% 5.2% 3.6% 5.0% 5.9%
Cologne 3.6% 4.3% 5.2% 1.6% 3.6% 4.6% 5.4% 3.7% 5.1% 6.3%
Munich 3.0% 3.8% 4.5% 2.1% 3.0% 4.2% 4.8% 3.3% 4.7% 5.6%
Stuttgart 3.5% 4.1% 4.9% 1.7% 3.7% 4.6% 5.4% 3.9% 5.1% 6.3%
Regional Cities
Bonn 4.3% 4.9% 6.0% 0.9% 0.0% 0.0% 0.0% 0.0% 0.0% 0.0%
Bremen 4.5% 5.4% 6.5% 0.6% 4.7% 5.6% 6.7% 5.0% 6.2% 7.6%
Dortmund 4.5% 5.3% 6.5% 0.6% 4.6% 5.5% 6.6% 5.0% 6.2% 7.7%
Dresden 4.2% 5.1% 6.5% 0.9% 4.7% 5.6% 6.7% 5.0% 6.2% 7.7%
Duisburg 5.1% 5.8% 7.4% 0.1% 5.2% 6.0% 7.7% 5.4% 6.4% 8.5%
Erfurt 4.9% 5.6% 6.8% 0.6% 4.9% 6.0% 7.1% 5.2% 6.6% 7.7%
Essen 4.6% 5.5% 6.6% 0.4% 4.8% 5.6% 6.8% 5.0% 6.1% 7.8%
Karlsruhe 4.4% 5.1% 6.4% 1.0% 4.6% 5.5% 6.4% 4.8% 6.1% 7.1%
Hanover 4.3% 5.1% 6.3% 0.7% 4.6% 5.5% 6.6% 4.8% 6.2% 7.6%
Leipzig 4.2% 5.1% 6.5% 0.9% 4.6% 5.4% 6.6% 5.3% 6.1% 7.8%
Magdeburg 5.4% 6.0% 7.4% 0.1% 5.5% 6.5% 8.0% 5.9% 6.8% 9.0%
Wiesbaden & Mainz 4.5% 5.2% 6.6% 0.9% 4.4% 5.5% 6.5% 4.5% 6.2% 7.3%
Nuremberg 4.2% 5.0% 6.3% 0.9% 4.4% 5.5% 6.4% 4.6% 6.0% 7.1%
Rhine-Neckar MA/HD/LU 4.5% 5.4% 7.0% 0.5% 4.7% 5.6% 6.9% 4.9% 6.2% 8.2%
Regions
Lower Saxony & Schleswig-Holstein
5.1% 5.4% 7.6% 0.2% 5.0% 6.2% 7.3% 5.6% 6.8% 8.7%
Mecklenburg-West Pomerania & Saxony-Anhalt & Brandenburg
5.2% 6.0% 8.3% 0.2% 5.3% 6.8% 8.2% 5.7% 7.3% 9.5%
Saxony & Thuringia & North of Hesse (zip code: 3xxxx)
5.5% 5.9% 8.1% 0.2% 5.2% 6.8% 8.4% 5.6% 7.3% 9.0%
North Rhine-Westphalia 5.1% 5.5% 7.8% 0.2% 4.6% 6.0% 7.2% 5.1% 6.7% 9.1%
Rhineland-Palatinate & Saarland
5.2% 5.7% 7.6% 0.2% 5.2% 6.8% 7.6% 5.6% 7.2% 9.7%
South of Hesse (zip code: 6xxxx) & Baden- Wuerttemberg
4.6% 5.3% 7.0% 0.5% 4.8% 6.3% 7.1% 5.2% 6.7% 8.2%
Bavaria 4.4% 5.1% 6.5% 0.7% 4.5% 6.0% 6.7% 5.1% 6.5% 8.0%
Fig. 16 Results overview
Overview of the results
32 PwC Real Estate Investor Survey Germany
Overview of the results
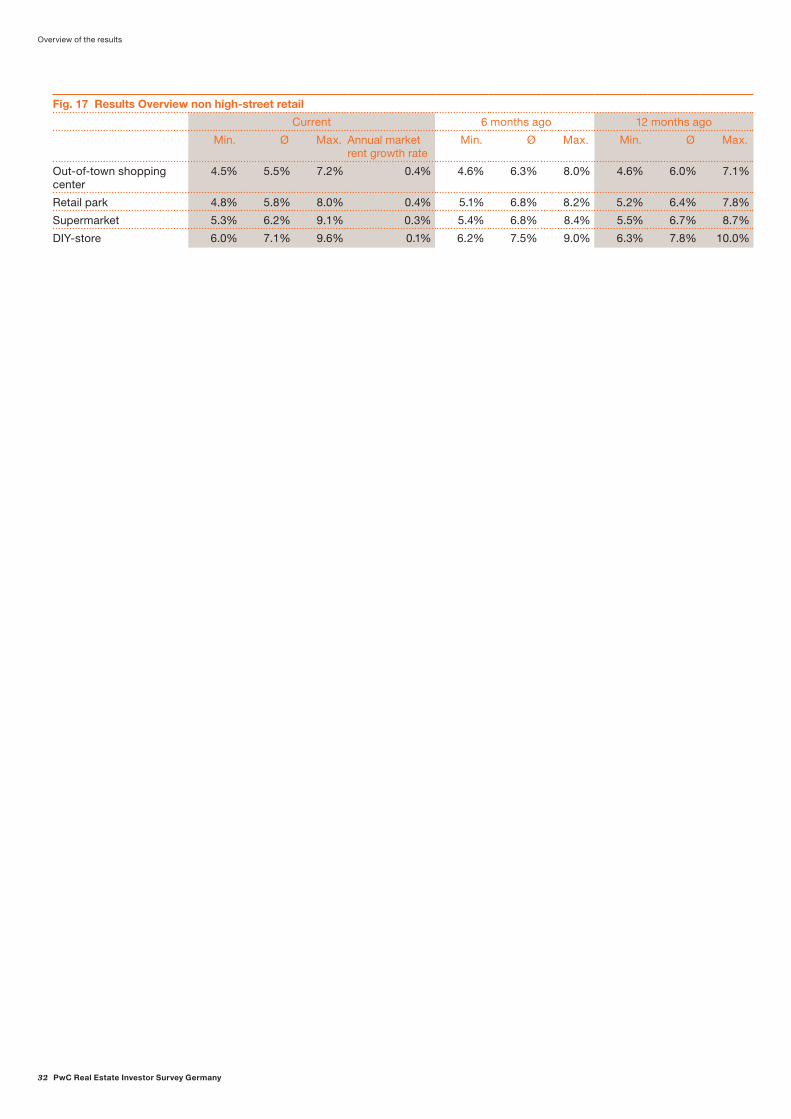
Fig. 17 Results Overview non high-street retail
Current 6 months ago 12 months ago
Min. Ø Max. Annual market rent growth rate
Min. Ø Max. Min. Ø Max.
Out-of-town shopping center
4.5% 5.5% 7.2% 0.4% 4.6% 6.3% 8.0% 4.6% 6.0% 7.1%
Retail park 4.8% 5.8% 8.0% 0.4% 5.1% 6.8% 8.2% 5.2% 6.4% 7.8%
Super market 5.3% 6.2% 9.1% 0.3% 5.4% 6.8% 8.4% 5.5% 6.7% 8.7%
DIY-store 6.0% 7.1% 9.6% 0.1% 6.2% 7.5% 9.0% 6.3% 7.8% 10.0%

PwC Real Estate Investor Survey Germany 33
Overview of the results

7 Approach and Definitions
Approach and Definitions
34 PwC Real Estate Investor Survey Germany

PwC Real Estate Investor Survey Germany 35
Approach and Definitions
In our survey we concentrated on ARYs, as these reflect the relationship between stabilised net operating income (NOI) and an expected purchase price. It thereby has taken into account the individual risk-return relationship and provided a perspective on future market trends as well as developments in rent levels. The ARY would be the capitalisation rate one would employ in a direct capitalisation method. The ARYs presented in our results are a simple average of the single data points received for the respective submarkets.
To account for a broader market – comprising Core, Core+, and Value-Add properties – we have put ARYs into three categories: minimum, maximum and average. Using office properties in Frankfurt as one example, we have defined these categories as follows:
Fig. 18 Classification of range of ARYs for the office market
Location WAULT Vacancy Age
Office
Min. CBD (eg, Frankfurt Financial District) > 5 ~5%–10% < 5 years
Average Immediate vicinity to CBD (eg, Frankfurt trade fair)
~5 ~10%–15% ~5–20 years
Max. Peripheral office locations (eg, Frankfurt-Niederrad)
< 4 >15%–40% < 25 years
Regarding the retail sector, we separated in-town high street retail from location-independent retail. Out-of-town shopping centres, retail parks, single grocery stores and DIY stores represent typical subclasses of the location-independent retail market. Within location-independent retail, we view macrolocation to be of less importance, given that individual competition, performance and accessibility are the factors driving the value of such retail properties. As a result, we have divided the definition of retail as follows:
Fig. 19 Classification of range of ARYs for high street retail
Location/retail class WAULT Vacancy Age
High street retail
Min. City centre high street or 1a shopping centre (Frankfurt Goethestrasse)
> 5 < 5% < 5 years
Average Lesser frequented sections of the high street
~5 ~5% ~5–15 years
Max. Close proximity to the high street, within 100m distance
< 4 ~20% > 15 years
Fig. 20 Classification of range of ARYs for location-independent retail
Competition WAULT Vacancy Age
Location-independent retail
Min. Dominant situation > 5 < 5% < 5 years
Average In competition with equal competitors ~5 ~5% ~5–15 years
Max. Inferior to competitors < 4 ~25% > 15 years

Approach and Definitions
36 PwC Real Estate Investor Survey Germany
Fig. 22 Identified submarkets for office and retail
Top 7 Cities 14 Regional Cities 7 Regions
Frankfurt
Frankfurt
Frankfurt
Fig. 21 Classification of range of ARYs for the logistics market
Motorway access Third party usability WAULT Age
Logistics
Min. <5 minutes excellent ~10 <5 years
Average ~5–15 minutes good ~5 ~5–20 years
Max. >15 minutes limited <4 >25 years
For logistics properties we have defined the three categories (minimum, maximum and average) as follows:
The maximum yield does not cover assets that cannot be valued with a direct capitalisation method – that is, a lack of sustainable cash flow and opportunistic development assets.
Based on Germany’s geographical structure, we have identified three categories of markets for office and retail properties: i) Top 7 Cities, ii) Regional Cities and iii) Regions. The Top 7 Cities reflect the ARYs of the seven most populated cities in Germany. Regional Cities represent a selection of 14 cities with a population ranging from 200,000 to 600,000. The Regions provide the yields in the respective areas, excluding all Top 7 Cities and Regional Cities.

PwC Real Estate Investor Survey Germany 37
Approach and Definitions
Due to different location requirements, we have identified two other markets for logistics properties: i) Top 15 Locations and ii) small locations. The Top 15 Locations reflect the ARYs of the 15 most successful logistics locations in Germany with respect to the investment volume of the last five years and prime yields of the last two years. Small locations represent the remaining established logistics regions in Germany.
Since the third issue of the PwC Real Estate Investor Survey Germany, we have been covering market-specific letting assumptions in addition to ARYs. In the course of our research, we asked for typical market rent growth rates, rent-free periods, reletting periods and the extension probability for the market in question.
The rental growth rate is defined as the expected average annual rental growth rate over the next five years. Respondents provided a range and median for rent-free periods and reletting periods (both in months) that are typically observed in the respective markets. The given underlying lease length is set at 7.5 years.
It is worth noting that we do not use a textbook definition of NOI; our survey takes investment strategies into account and thus varies significantly among participants. We tried to identify which parameters are included in the NOI and which are accounted for below NOI. The results for the office and retail NOI calculation methods are provided in the respective sections.
We do not aim to obtain a uniform average ARY; we therefore have not adjusted single ARYs for a respective NOI calculation method. The resulting average office, retail or logistics ARYs are to be read as an average of single data points.

38 PwC Real Estate Investor Survey Germany
Authors
Authors
38 PwC Real Estate Investor Survey Germany

PwC Real Estate Investor Survey Germany 39
Authors
Alexia TsiterReal Estate Deals
Irina LindnerReal Estate Deals
Maximilian HelmReal Estate Deals
Robert RauchReal Estate Deals
AcknowledgmentWe would like to thank our colleague Robert Bahr for his helpful contribution to this survey.
About usOur clients face diverse challenges, strive to put new ideas into practice and seek expert advice. They turn to us for comprehensive support and practical solutions that deliver maximum value. Whether for a global player, a family business or a public institution, we leverage all of our assets: experience, industry knowledge, high standards of quality, commitment to innovation and the resources of our expert network in 157 countries. Building a trusting and cooperative relationship with our clients is particularly important to us – the better we know and understand our clients’ needs, the more effectively we can support them.
PwC. More than 10,300 dedicated people at 22 locations. €1.9 billion in turnover. The leading auditing and consulting firm in Germany.
Thomas Veith Real Estate DealsTel: +49 69 9585-5905Mobile: +49 175 4340515E-mail: [email protected]
Olga DentzelReal Estate DealsTel: +49 69 9585-2460Mobile: +49 151 62427945E-mail: [email protected]
Jan CorneliusReal Estate DealsTel: +49 69 9585-3435Mobile: +49 160 7434663E-mail: [email protected]

40 PwC Real Estate Investor Survey Germany
PwC Real Estate Practice
PwC Real Estate Practice
40 PwC Real Estate Investor Survey Germany

PwC Real Estate Investor Survey Germany 41
PwC Real Estate Practice
AdvisorySusanne Eickermann-RiepeFriedrich-Ebert-Anlage 35–3760327 Frankfurt am MainTel: +49 69 9585-5909E-mail: [email protected]
Thomas VeithFriedrich-Ebert-Anlage 35–3760327 Frankfurt am MainTel: +49 69 9585-5905E-mail: [email protected]
Dirk HennigKapelle-Ufer 410117 BerlinTel: +49 30 2636-1166E-mail: [email protected]
Dirk KadelFriedrich-Ebert-Anlage 35–3760327 Frankfurt am MainTel: +49 69 9585-5583E-mail: [email protected]
Dr. Harald HeimKapelle-Ufer 410117 BerlinTel: +49 30 2636-1354E-mail: [email protected]
Thorsten SchniedersBernhard-Wicki-Straße 880636 MunichTel: +49 89 5790-6448E-mail: thorsten.schnieders@ de.pwc.com
Dr. Andreas SchillhoferFriedrich-Ebert-Anlage 35–3760327 Frankfurt am MainTel: +49 69 9585-5533E-mail: andreas.schillhofer@ de.pwc.com
AssuranceEva HandrickFriedrich-Ebert-Anlage 35–3760327 Frankfurt am MainTel: +49 69 9585-2217E-mail: [email protected]
Gregory HartmanKapelle-Ufer 410117 BerlinTel: +49 30 2636-4214E-mail: [email protected]
Uwe RittmannMoskauer Straße 1940227 DüsseldorfTel: +49 211 981-1998E-mail: [email protected]
Tax & LegalUwe StoschekKapelle-Ufer 410117 BerlinTel: +49 30 2636-5286E-mail: [email protected]
Dr. Michael A. MüllerKapelle-Ufer 410117 BerlinTel: +49 30 2636-5572E-mail: [email protected]
Helge DammannKapelle-Ufer 410117 BerlinTel: +49 30 2636-5222E-mail: [email protected]
Marcel MiesMoskauer Straße 1940227 DüsseldorfTel: +49 211 981-2294E-mail: [email protected]
Sven BehrendsBernhard-Wicki-Straße 880636 MunichTel: +49 89 5790-5887E-mail: [email protected]
Josip Oreskovic-RipsFriedrich-Ebert-Anlage 35–3760327 Frankfurt am MainTel: +49 69 9585-6255E-mail: josip.oreskovic-rips@ de.pwc.com
Nathan GelbartKapelle-Ufer 410117 BerlinTel: +49 30 2636-3360Mobile: +4915154345764E-mail: [email protected]


www.pwc.de