Embed Size (px)
Citation preview

Bulletinyear x i i • october 2007
130quarterly report


Croatian National Bank
BULLETIN
PUBLISHER Croatian National Bank Publishing Department Trg hrvatskih velikana 3, 10002 Zagreb Phone: 385-1-4564-555 Contact phone: 385-1-4565-006 Fax: 385-1-4564-687
WEBSITE http://www.hnb.hr
Release dates are disseminated on the advance release calendar posted for Croatia on the IMF’s DSBB (http://dsbb.imf.org).
Those using data from this publication are requested to cite the source.
Any additional corrections that might be required will be made in the website version.
Printed in 600 copies
ISSN 1331–6028

Croatian National Bank
BULLETIN
Zagreb, 2007
General Information on Croatia
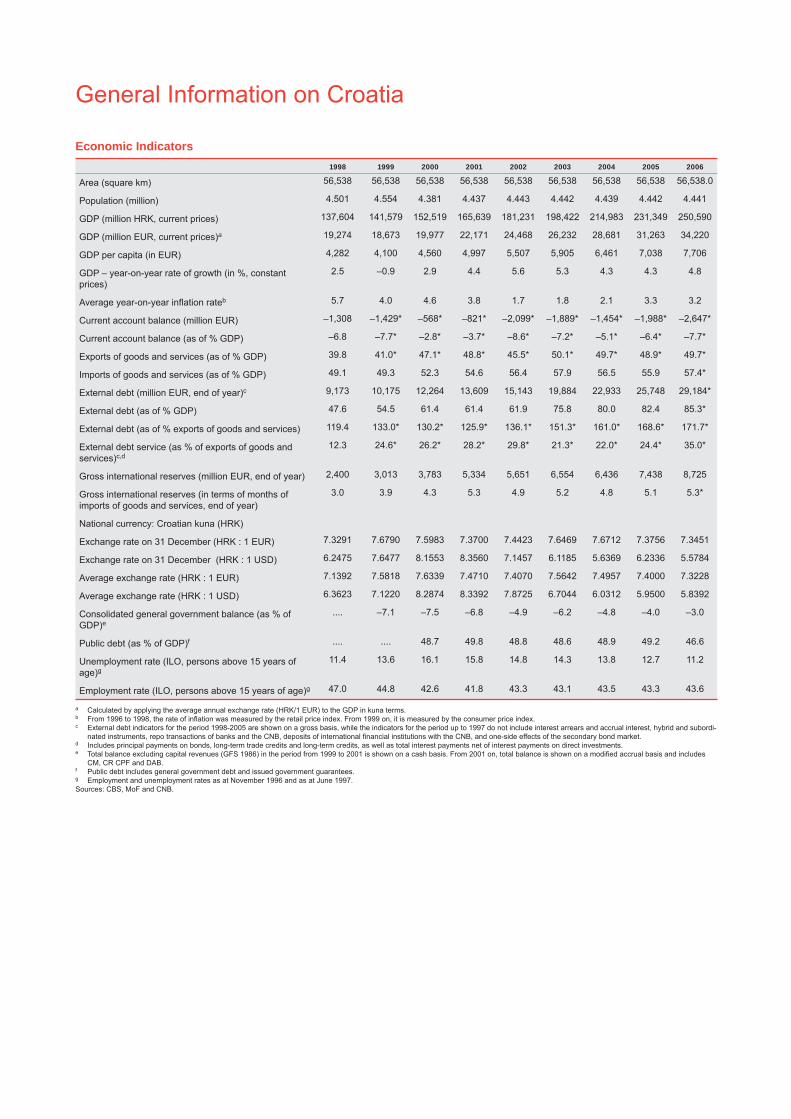
Economic Indicators1998 1999 2000 2001 2002 2003 2004 2005 2006
Area (square km) 56,538 56,538 56,538 56,538 56,538 56,538 56,538 56,538 56,538.0
Population (million) 4.501 4.554 4.381 4.437 4.443 4.442 4.439 4.442 4.441
GDP (million HRK, current prices) 137,604 141,579 152,519 165,639 181,231 198,422 214,983 231,349 250,590
GDP (million EUR, current prices)a 19,274 18,673 19,977 22,171 24,468 26,232 28,681 31,263 34,220
GDP per capita (in EUR) 4,282 4,100 4,560 4,997 5,507 5,905 6,461 7,038 7,706
GDP – year-on-year rate of growth (in %, constant prices)
2.5 –0.9 2.9 4.4 5.6 5.3 4.3 4.3 4.8
Average year-on-year inflation rateb 5.7 4.0 4.6 3.8 1.7 1.8 2.1 3.3 3.2
Current account balance (million EUR) –1,308 –1,429* –568* –821* –2,099* –1,889* –1,454* –1,988* –2,647*
Current account balance (as of % GDP) –6.8 –7.7* –2.8* –3.7* –8.6* –7.2* –5.1* –6.4* –7.7*
Exports of goods and services (as of % GDP) 39.8 41.0* 47.1* 48.8* 45.5* 50.1* 49.7* 48.9* 49.7*
Imports of goods and services (as of % GDP) 49.1 49.3 52.3 54.6 56.4 57.9 56.5 55.9 57.4*
External debt (million EUR, end of year)c 9,173 10,175 12,264 13,609 15,143 19,884 22,933 25,748 29,184*
External debt (as of % GDP) 47.6 54.5 61.4 61.4 61.9 75.8 80.0 82.4 85.3*
External debt (as of % exports of goods and services) 119.4 133.0* 130.2* 125.9* 136.1* 151.3* 161.0* 168.6* 171.7*
External debt service (as % of exports of goods and services)c,d
12.3 24.6* 26.2* 28.2* 29.8* 21.3* 22.0* 24.4* 35.0*
Gross international reserves (million EUR, end of year) 2,400 3,013 3,783 5,334 5,651 6,554 6,436 7,438 8,725
Gross international reserves (in terms of months of imports of goods and services, end of year)
3.0 3.9 4.3 5.3 4.9 5.2 4.8 5.1 5.3*
National currency: Croatian kuna (HRK)
Exchange rate on 31 December (HRK : 1 EUR) 7.3291 7.6790 7.5983 7.3700 7.4423 7.6469 7.6712 7.3756 7.3451
Exchange rate on 31 December (HRK : 1 USD) 6.2475 7.6477 8.1553 8.3560 7.1457 6.1185 5.6369 6.2336 5.5784
Average exchange rate (HRK : 1 EUR) 7.1392 7.5818 7.6339 7.4710 7.4070 7.5642 7.4957 7.4000 7.3228
Average exchange rate (HRK : 1 USD) 6.3623 7.1220 8.2874 8.3392 7.8725 6.7044 6.0312 5.9500 5.8392
Consolidated general government balance (as % of GDP)e
.... –7.1 –7.5 –6.8 –4.9 –6.2 –4.8 –4.0 –3.0
Public debt (as % of GDP)f .... .... 48.7 49.8 48.8 48.6 48.9 49.2 46.6
Unemployment rate (ILO, persons above 15 years of age)g
11.4 13.6 16.1 15.8 14.8 14.3 13.8 12.7 11.2
Employment rate (ILO, persons above 15 years of age)g 47.0 44.8 42.6 41.8 43.3 43.1 43.5 43.3 43.6
a Calculated by applying the average annual exchange rate (HRK/1 EUR) to the GDP in kuna terms.b From 1996 to 1998, the rate of inflation was measured by the retail price index. From 1999 on, it is measured by the consumer price index.c External debt indicators for the period 1998-2005 are shown on a gross basis, while the indicators for the period up to 1997 do not include interest arrears and accrual interest, hybrid and subordi-
nated instruments, repo transactions of banks and the CNB, deposits of international financial institutions with the CNB, and one-side effects of the secondary bond market.d Includes principal payments on bonds, long-term trade credits and long-term credits, as well as total interest payments net of interest payments on direct investments.e Total balance excluding capital revenues (GFS 1986) in the period from 1999 to 2001 is shown on a cash basis. From 2001 on, total balance is shown on a modified accrual basis and includes
CM, CR CPF and DAB.f Public debt includes general government debt and issued government guarantees.g Employment and unemployment rates as at November 1996 and as at June 1997.Sources: CBS, MoF and CNB.

Contents
Quarterly Report
Introduction / 3
Demand / 5Foreign Demand / 6Domestic Demand / 6
Personal Consumption / 7Investment Consumption / 8Government Consumption / 8
Box 1: Potential Output Growth / 9
Output / 10Industry / 10Trade / 11Construction / 12Hotels and Restaurants / 12Transport and Communications / 12
Labour Market / 13Unemployment and Employment / 13Employment / 14Wages and Labour Costs / 15
Prices / 16Box 2: Impact of the Change in the US Dollar/Euro
Exchange Rate on Inflation in Croatia / 19
Exchange Rate / 21
Monetary Policy and Instruments / 23Monetary Environment / 23Uses of Instruments of Monetary Policy / 23Reserve Money and International Reserves / 25Box 3: New Decision on the Purchase of Compulsory CNB
Bills / 26Monetary Developments / 26
Total Liquid Assets / 26Money / 27Non-Monetary Deposits / 27Placements / 28Bank Placements to the Central Government / 29Foreign Assets and Liabilities / 29
Money Market / 30Money Market Interest Rates / 30Banks’ Interest Rates / 32
Capital Market / 33Equity Securities Market / 35Debt Securities Market / 36
International Transactions / 38Current Account / 38Trade in Goods / 40Capital and Financial Transactions / 42External Debt / 43International Liquidity / 45
Government Finance / 45Fiscal Policy Features in the First Half of 2007 / 45Consolidated General Government Revenues / 46Consolidated General Government Expenditures / 46Operating Balance and Transactions in Non-Financial
Assets and Financial Assets and Liabilities / 47Consolidated General Government Balance on a Cash
Basis / 47Government Debt / 48Domestic General Government Debt / 48External General Government Debt / 49Trends in July 2007 / 49
Statistical Survey
A. Monetary and Credit AggregatesTable A1: Monetary and Credit Aggregates / 54
B. Monetary InstitutionsTable B1: Monetary Survey / 55Table B2: Number of Reporting Banks and Savings Banks
and their Classification by Total Assets / 56
C. Monetary AuthoritiesTable C1: Monetary Authorities Accounts / 57
D. BanksTable D1: Banks’ Accounts / 59Table D2: Banks’ Foreign Assets / 60Table D3: Banks’ Claims on the Central Government and
Funds / 61Table D4: Banks’ Claims on Other Domestic Sectors / 61Table D5: Distribution of Banks’ Loans by Domestic
Institutional Sectors / 62Table D6: Demand Deposits with Banks / 62Table D7: Time and Savings Deposits with Banks / 63Table D8: Foreign Currency Deposits with Banks / 63Table D9: Bonds and Money Market Instruments / 64Table D10: Banks’ Foreign Liabilities / 64Table D11: Central Government and Funds’ Deposits with
Banks / 65Table D12: Restricted and Blocked Deposits with
Banks / 65Figure D1: Distribution of Banks’ Loans by Domestic Institutional Sectors / 66Figure D2: Distribution of Banks’ Deposits by Domestic Institutional Sectors / 66
E. Housing Savings BanksTable E1: Housing Savings Banks’ Accounts / 67
F. Monetary Policy Instruments and LiquidityTable F1: Credit Rates of the Croatian National Bank / 68Table F2: Deposit Rates of the Croatian National Bank / 69Table F3: Banks’ Reserve Requirements / 70Table F4: Banks’ Liquidity Indicators / 71

G. Financial MarketsTable G1: Banks’ Interest Rates on Kuna Credits Not
Indexed to Foreign Currency / 72Table G2: Banks’ Interest Rates on Kuna Credits Indexed to
Foreign Currency and on Credits in Euros / 73Table G3: Banks’ Interest Rates on Kuna Deposits Not
Indexed to Foreign Currency / 74Table G4a: Banks’ Interest Rates on Kuna Deposits
Indexed to Foreign Currency and on Foreign Currency Deposits / 75
Table G4b: Banks’ Interest Rates on Kuna Deposits Indexed to Foreign Currency and on Foreign Currency Deposits / 76
Table G5: Banks’ Trade with Foreign Exchange / 77
H. International Economic RelationsTable H1: Balance of Payments – Summary / 78Table H2: Balance of Payments – Goods and Services / 79Table H3: Balance of Payments – Income and Current
Transfers / 80Table H4: Balance of Payments – Direct and Portfolio
Invstments / 81Table H5: Balance of Payments – Other Investment / 82Table H6: Balance of Payments – Summary / 83Table H7: International Reserves and Banks’ Foreign
Currency Reserves / 84Table H8: International Reserves and Foreign Currency
Liquidity / 85Table H9: Midpoint Exchange Rates of the Croatian
National Bank (period average) / 87Table H10: Midpoint Exchange Rates of the Croatian
National Bank (end of period) / 88Table H11: Indices of the Effective Exchange Rate of the
Kuna / 89
Table H12: Gross External Debt by Domestic Sectors / 90Table H13: Public Sector Gross External Debt, and Publicly
Guaranteed and Non-Publicly Guaranteed Private Sector Gross External Debt / 92
Table H14: Gross External Debt by Domestic Sectors and Projected Future Payments / 93
Table H15: International Investment Position – Summary / 95
Table H16: International Investment Position – Direct Investment / 96
Table H17: International Investment Position – Portfolio Investment / 96
Table H18: International Investment Position – Other Investment / 97
I. Government Finance – Selected DataTable I1: Consolidated Central Government According to
the Government Level / 98Table I2: Budgetary Central Government Operations / 99Table I3: Central Government Debt / 100
J. Non-Financial Statistics – Selected DataTable J1: Consumer Price and Producer Price Indices / 101Table J2: Core Consumer Price Indices / 102Table J3: Average Monthly Net Wages / 102Table J4: Consumer Confidence Index, Consumer
Expectations Index and Consumer Sentiment Index / 103
List of Banks and Savings Banks / 105Management of the Croatian National Bank / 106List of Abbreviations and Symbols / 107

Quarterly Report


CNB BULLETIN • NUMBER 130 • QUARTERLY REPORT • INTRODUCTION
3
IntroductionReal economic growth was 6.8% in the first half of 2007
relative to the first half of 2006. Real GDP accelerated sharply in the first quarter, rising at an annual rate of 7.0%, and the economy continued to grow at a high rate of 6.6% in the second quarter. This was primarily due to continued strong personal consumption growth, while gross fixed capi-tal formation slowed relative to the first quarter. Government consumption continued to rise in the second quarter at a rate which exceeded the average rate in the previous year. At the same time, a more dynamic foreign trade, with the real growth of goods and services exports accelerating slightly faster than the growth of imports, significantly offset the negative con-tribution of net foreign demand to real GDP growth relative to the beginning of the year. GVA in all economic activities increased considerably in the first half of 2007. The increase was faster in manufacturing than in service activities, but due to the smaller share of manufacturing activities in the economy their contribution was somewhat smaller than the contribution of service activities.
According to the available monthly indicators of economic activity, positive developments in the real sector are likely to continue, although most likely at slightly lower rates than in the first half of this year. This is confirmed by the industrial production volume growth, continuing at markedly lower rates in the beginning of the third quarter than in the January to June period in 2007. The highest annual rates of change were recorded in the manufacture of durable and non-dura-ble consumer goods and intermediate goods, while the man-ufacture of capital goods, after having grown sharply in the second quarter, reduced early in the third quarter. Total retail trade, having stabilised at high levels in the second quarter this year, rebounded in July, and positive trends were also observed in construction early in the third quarter.
Changes in trends in the sources of household consump-tion financing confirm the continuation of a strong annual growth in personal consumption in the third quarter of 2007. Bank placements to households, excluding housing loans, slowed down in real terms over July and August compared with the beginning of the year, but their growth rates were still high. Positive movements were observed in the labour market as well. In the same period, the semi-annual pension adjustment in September and the repayment of another in-stalment of the pensioners’ debt in June are likely to have positive effects on personal consumption in the second half of the year. Positive trends are also anticipated in gross fixed capital formation, whose growth might pick up in the remain-ing part of the year. This is confirmed by an upsurge in con-struction in July, strong growth of capital and intermediate goods imports and government announcements of an upturn in public investments in the second half of the year. By con-trast, bank corporate placements slowed annually in July and August, but it is worth mentioning here that companies also made use of alternative financing sources and, increasingly, of foreign financing sources.
Since the beginning of 2007, the CBS has been publish-ing the results of the Labour Force Survey in quarterly inter-
vals, and not semi-annually as was formerly done. This was in response to the requirement to upgrade the Survey and bring it in line with the acquis. As shown by the latest Labour Force Survey data, the unemployment and employment rate stood at 11.2% and 42.8% respectively in the first quarter this year.
Favourable labour market trends continued from the first into the second quarter this year, as evidenced by a decline in both the level and rate of registered unemployment and continued total employment growth trend. The drop in regis-tered unemployment in that period was primarily due to a de-cline in the number of newly registered with the CES. Similar trends were also observed at the beginning of the third quar-ter, with the registered unemployment rate standing at 13.8% at end-August, its lowest value since 1997. The preliminary CBS data and data on the number of insured with the CPIA point to total employment growth in the second quarter this year relative to the same period in the previous year. Real gross wages rose by an annual 3.3% in the second quarter, whereas average real net wages grew at a slower rate owing to the tax progression effect. Thanks to strong industrial labour productivity growth in the same period, price pressures stem-ming from the labour market were subdued.
Consumer price inflation accelerated very slightly in the first seven months of 2007, up from 2.0% in December 2006 to 2.1% in July 2007. Accelerating more strongly in August, the rate reached 2.6%, whereas the monthly growth rate of the overall CPI stood at 0.6%. This is primarily a result of a supply-side shock, involving a rise in agricultural and in-dustrial food products prices due to drought-related crop losses in Croatia. The acceleration of the year-on-year con-sumer price inflation rate in the first eight months of 2007 was predominantly driven by the growth of the year-on-year rate of change in core inflation and agricultural products prices. Core inflation remained higher than overall consumer price inflation, with its year-on-year rate of change up from 2.3% in December 2006 to 3.0% in August 2007. The largest contribution to the acceleration of core inflation in the said period came from an increase in some food products prices (bread and cereal products), footwear prices, tobacco prices and the prices of services freely formed on the market (pri-marily package holidays). The year-on-year rate of change in agricultural products prices increased from –1.3% in Decem-ber 2006 to 5.4% in August 2007.
The year-on-year growth rate of administrative prices slowed from 2.0% in December 2006 to 0.7% in August 2007, mainly due to a drop in the year-on-year rate of change in water supply prices, caused by a favourable base effect. By contrast, domestic refined petroleum products prices rose in the first eight months in 2007. This was in response to the increase in world market crude oil prices, with the ensuing upward pressures on domestic prices alleviated by the appre-ciation of the kuna/US dollar exchange rate and the govern-ment’s decision, enacted already in May, to reduce excises on all types of unleaded petrol. In addition, imported inflation-ary pressures on domestic prices in the first eight months this year were also stemming from the rise in the prices of crude oil and some other raw materials on the world market, but they were less marked than in the same period last year.

CNB BULLETIN • NUMBER 130 • QUARTERLY REPORT • INTRODUCTION
4
The year-on-year rate of change in domestic industrial producer prices also accelerated (from 1.9% in Decem-ber 2006 to 3.6% in August 2007). Producer price growth in the observed period was recorded in all main industrial groupings, except in capital goods. The year-on-year rate of change in intermediate goods increased the most, which was primarily due to the world market price increase in raw ma-terials spilling over to domestic products prices.
Domestic consumer price inflation trends were favourably affected by the stable exchange rate. The nominal kuna/euro exchange rate appreciated by 1.1% in the second quarter 2007. Appreciation pressures on the exchange rate prevailed in the third quarter, with slight depreciation pressures ob-served around the middle of the month. In July, the kuna exchange rate was under appreciation pressures, primarily resulting from rising foreign exchange inflows at the peak of the tourist season. In an effort to alleviate the appreciation pressures, the central bank in July conducted two foreign ex-change interventions, purchasing from banks a total of EUR 139.0m. The appreciation of the kuna exchange rate in the second half of September was also due to increased demand for the kuna intended for the purchase of T-HT shares. The kuna/euro exchange rate appreciated by only 0.3% in the third quarter.
In the third quarter 2007, monetary environment was strongly influenced by seasonal trends which, coupled with tightened monetary policy measures, resulted in a decrease in bank external debt and slowdown in bank placements to the non-banking sector.
Since bank placement growth in the first six months of the year was stronger than anticipated by monetary policy measures, the CNB in June 2007 amended the Decision on the purchase of compulsory CNB bills, limiting the monthly growth of placements not subject to compulsory purchase of CNB bills to 0.5%. Central bank measures proved effective in curbing bank lending activity. Bank placements grew at an annual rate of 18.7% at end-August, which was a decrease of 4.2 percentage points compared with end-2006. Further-more, in July and August (following the amendment to the Decision) bank placements grew by a mere 0.4%. In an ef-fort to mitigate the effects of the decision, banks reduced corporate placements, whose annual growth rate declined from 24.4% at end-2006 to 17.0%, whilst the growth rate of household loans reduced by 1.6 percentage points to 20.2%.
All monetary aggregates grew further in the second quar-ter and in the first two months of the third quarter, with for-eign currency deposits up at the highest rate. In addition to the strong inflow of funds during summer months, savings with banks were also boosted due to favourable terms offered and marketing activities carried out by banks prompted by high prices of foreign sources of financing to attract funds from domestic sources. In addition to household and cor-porate deposits, deposits of other banking and non-banking financial institutions also rose significantly, indicating good liquidity levels of funds, which temporarily deposited excess liquidity with banks.
Following a seasonal drop in the first quarter, money (M1) also increased sharply in the second quarter and in the first two months of the third quarter, which primarily re-
sulted from an increase in demand for demand deposits and currency during the summer months. Total liquid assets also surged.
The growth of domestic financing sources during the summer months enabled banks to considerably reduce their external liabilities. This reduction was also a result of sub-stantial recapitalisations of banks, amounting to HRK 7.3bn in the first eight months of 2007. Banks foreign assets and the minimum foreign currency liquidity increased over the third quarter. The increase in foreign currency liquidity was also in consequence of the amendment to the Decision on the minimum required amount of foreign currency claims, introduced by the central bank with a view to extending the scope of banks’ foreign currency claims in the period from July to October to include a EUR 244.5m short-term foreign currency loan to the government.
Despite the rising demand for the kuna and strong foreign currency inflows, appreciation pressures on the kuna exchange rate remained subdued in the third quarter of 2007, so that only two foreign exchange interventions sufficed to alleviate them. The central bank created reserve money primarily by means of regular reverse repo auctions. In spite of high levels of free reserves, especially in the main tourist season, banks’ demand for liquidity increased. In addition to the seasonal influence, the increase in the demand for the kuna was also generated by the rise in kuna reserve requirements, issue of a government bond and supply of foreign exchange resulting from external borrowing by enterprises. In order to meet this demand and offset the imbalance in the money market, the CNB accepted all the received bids on regular repo auctions at an unchanged marginal rate of 3.5%. Total amount gener-ated by reverse repo operations during the summer months, including a fine tuning operation, exceeded HRK 7.0bn. The increase in demand for reserve money late in the third quar-ter, a consequence of the IPO of T-HT, occurred in a stable monetary environment provided by the central bank.
Thanks to a slower increase in the foreign trade deficit and improvement in net services exports compared with the same period in the previous year, the current account deficit ex-panded relatively modestly on an annual basis in the second quarter 2007. The slower increase in the trade deficit can be attributed to good results in goods exports and a slowdown in goods imports. In contrast, balances in factor income and current transfers accounts deteriorated.
Although accelerating in the second quarter, total goods exports grew less in the first eight months of 2007 than in the same period in 2006 (12.3% and 16.7% respectively, based on a constant US dollar exchange rate). This can be primarily ascribed to a drop in the exports of energy products (natu-ral and manufactured gas and electric current), as well as of some food products. However, exports in several other SITC divisions remained strong, especially in the division of ships, electrical machinery apparatus and appliances and oil and re-fined petroleum products.
Goods imports increased at an annual rate of 12.5% in the first eight months of 2007, which is a decrease from the rate of 17% in the same period in 2006. This is largely attribut-able to a decline in imports of natural and manufactured gas, which was especially marked in the second quarter when gas

CNB BULLETIN • NUMBER 130 • QUARTERLY REPORT • DEMAND
5
consumption fell due to warm weather. On the other hand, the imports of road vehicles and steel and iron continued to increase at an accelerated pace and capital goods imports also grew further, although at a slower rate than in the previ-ous year.
Foreign direct investments in Croatia in the capital and financial account increased slightly in the second quarter of 2007, with recapitalisation of foreign owned banks dominat-ing in their structure. The net portfolio investment inflow was relatively small because foreign assets of domestic sec-tors rose at the same rate as foreign liabilities. The increase in foreign assets was primarily accounted for by the increase in domestic investment funds’ investments in foreign markets, while the increase in liabilities was mainly generated by a new CBRD bond issue.
The net inflow in the account of other investments was considerably lower than in the second quarter 2006 due to a weaker increase in total liabilities of domestic sectors arising from loans received, trade credits and currency and depos-its. The major cause of this is the decrease in bank liabilities resulting from CNB measures aimed at curbing placement growth. However, as the decrease in bank debt was to a great extent offset by the accelerated increase in enterprise debt, total external debt rose at the second-quarter end. As tight-ened CNB measures and a favourable seasonal effect led to a sharp fall in banks’ external debt in July and August, total external debt is likely to remain unchanged at the end of the third quarter from the end of the previous quarter.
Fiscal developments were mostly positive in the first six months of 2007. Consolidated general government revenues increased at an annual rate of 13.1% in the first half of the year, driven primarily by rising revenues from VAT, social contributions and profit tax. Expenditures grew at almost half this rate (6.7%), with especially strong growth recorded in expenditures on employee compensation, social benefits and the use of goods and services. In addition, government investment activity, including investments in road infrastruc-ture, remained buoyant in the first six months of 2007.
Due to these developments, the consolidated general gov-ernment deficit (on a cash basis, GFS 1986) stood at HRK 0.3bn at the end of the first six months in 2007, which is a significant decrease compared with the same period in 2006. The deficit was financed by domestic borrowing, with the funds partially used to settle external liabilities due.
According to CNB data, general government debt, includ-ing CBRD debt, reached HRK 113.6bn at end-June this year. Of this amount, 56.5% was accounted for by domestic debt and the remainder by external debt. The increase in debt of HRK 3.2bn compared with the end of last year was primarily the result of the rise in liabilities related to MoF’s domestic bond issues and CBRD’s foreign bond issues.
Demand
Following a noticeable pickup in real GDP growth (to 7.0% annually) over the first quarter of this year, the economy continued to grow at a high rate of 6.6% in the second quar-ter. This was mostly due to further strengthening of personal consumption, as opposed to gross fixed capital formation, whose annual growth slowed down considerably relative to the first quarter, almost halving its contribution to total GDP growth compared with the beginning of 2007. After having grown at the rate of 2.8% in the first quarter, government consumption only slightly decelerated in the remainder of the year, so that its contribution exceeded the previous year’s average. The developments in the stated aggregate demand components resulted in a somewhat stronger demand for im-ported goods and, consequently, in an acceleration of goods and services imports relative to the first quarter. On the other hand, foreign demand increased markedly in the same pe-riod, leading to a strong acceleration of the annual exports of goods and services. As a result, the negative contribution of net exports was noticeably reduced compared with the first quarter of 2007.
Taken cumulatively, gross domestic product at constant prices rose by 6.8% in the first half of 2007 relative to the same period last year,1 which saw a considerably lower eco-nomic activity growth rate of 4.8%.
The available monthly economic activity indicators for July and August 2007 point to continued strong growth in real GDP, but at lower rates. A slowdown in industrial produc-tion was accompanied by a rise in real retail trade turnover and favourable movements in construction. Furthermore, the nominal CBS data on trade in goods point to a mild slow-down in foreign demand, particularly the demand for oil and refined petroleum products.
1 The CBS data on GDP for the period from the first quarter of 2005 to the second quarter of 2007 are preliminary (not adjusted to the annual GDP calculation, i.e. they are based on quarterly GDP estimates).
%
0
2
4
6
8
10
12
14
16
18
20
Figure 1
GROSS DOMESTIC PRODUCT ANDAGGREGATE DEMAND COMPONENTS
y yoriginal data, real ear-on- ear rate of growth
GDP Personalconsump.
Governmentconsump.
Gross fixedcapital
formation
Exports ofgoods andservices
Imports ofgoods andservices
Source: CBS.
Q2/07Q1/07
Q4/06Q3/06Q2/06Q1/06

CNB BULLETIN • NUMBER 130 • QUARTERLY REPORT • DEMAND
6
Relatively strong economic growth over the first half of 2007 was reported by most countries that joined the EU in the last two accession waves, which provided an impetus to domestic production. According to the national statisti-cal offices’ data for the first and second quarters of 2007, the exceptionally fast-growing economies were again the Baltic countries, with the highest growth rates reported by Latvia (11.2% and 11.0% in the first and second quarters respectively), Estonia (10.1% and 7.8% in the first and sec-ond quarters respectively) and Lithuania (8.3% and 8.0% in the first and second quarters respectively). Strong economic growth was also recorded in Slovakia (9.0% and 9.4% in the first and second quarters) and Slovenia (7.2% and 5.9% in the first and second quarters respectively). Only slightly low-er growth rates were observed in Bulgaria (6.2% and 6.6% in the first and second quarters respectively) and the Czech Republic (6.4% and 6.0% in the first and second quarters respectively). At the same time, economic growth in the euro-zone slowed down mildly, from 3.3% in the last quarter of 2006 to 3.0% in the first and 2.5% in the second quarter of the current year.
Eurostat’s short-term forecasts of eurozone GDP growth suggest continued strengthening of total economic activity over the second half of 2007. Expectations are that a chain increase in GDP in this group of countries, adjusted for sea-sonal and working day differences, will range between 0.2% and 0.8% in the third and fourth quarters. If these forecasts come true, there will be a mild annual slowdown in economic growth, and GDP is expected to rise at a rate of about 2.5% over the second half of the year. Moreover, the most recent results of the EU Consumer and Business Confidence Survey suggest a drop in consumer and business optimism in July and August, according to the composite economic sentiment index for the eurozone, which additionally corroborates the likelihood of a more moderate annual growth of total eco-nomic activity in this group of countries for the remainder of the year.
Foreign Demand
According to quarterly GDP estimate, the real growth of both imports and exports of goods and services slowed down at the beginning of 2007, but it accelerated again markedly as early as the second quarter. Goods and services exports rose by 8.9% annually over the second quarter of 2007, contribut-ing 4.1 percentage points to overall real GDP growth. Goods and services imports rose at a somewhat slower rate (6.4%) in the same period, resulting in an almost neutral contribu-tion of net foreign demand (–0.1 percentage point).
In the first half of the year, total exports grew somewhat faster annually (6.3%) than total imports (5.2%). However, given the twice as high value of total goods and services imports as that of total exports in the observed period, net foreign demand made a negative contribution to real GDP growth of 0.6 percentage points, almost four times less than in the same period last year.
As suggested by the nominal (seasonally adjusted) CBS data on trade in goods, July and August saw a mild decline in goods exports relative to the second quarter. However, their growth rates remained relatively high, particularly as con-cerns foreign demand for investment goods and durable con-sumer goods, whereas energy exports dropped considerably. Exports of capital goods increased cumulatively by 27.5% in July and August relative to the same period last year. A similar trend was observed in intermediate goods exports which accelerated to 12.7%. The CBS data also point to a mild slowdown in goods and services exports at the begin-ning of the third quarter, on account of reduced imports of oil and refined petroleum products. All other product group-ings showed relatively high annual growth rates.
Domestic Demand
Strong economic growth in the first and second quarters of 2007 was significantly fuelled by a noticeable recovery of domestic demand, primarily personal demand, with a signifi-cant contribution also made by investments early in the year.
%
0
2
4
6
8
10
14
12
Figure 2
Sources: CBS, Eurostat and national statistical offices.
GDP IN SELECTED COUNTRIESoriginal data, real year-on-year rate of growth
Bu
lga
ria
Cze
ch
R.
Esto
nia
La
tvia
Lith
ua
nia
Hu
ng
ary
Po
lan
d
Ro
ma
nia
Slo
va
kR
.
Slo
ve
nia
Cro
atia
EM
U
Q2/ 70Q1/ 70
Q4/ 60Q3/ 60Q2/06Q1/ 60
%
–12
–6
0
6
12
18
Figure 3
GDP RATES OF GROWTH (in %) AND RELATIVE CONTRIBUTIONOF DEMAND CATEGORIES (in percentage points)
original data, constant prices
Source: CBS.
Domestic demand
Net foreign demand
GDP
Q1
/01
Q3
/01
Q1
/02
Q3
/02
Q1
/03
Q3
/03
Q1
/04
Q3
/04
Q1
/05
Q3
/05
Q1
/06
Q1
/07
Q3
/06

CNB BULLETIN • NUMBER 130 • QUARTERLY REPORT • DEMAND
7
In the second quarter, domestic demand contributed 6.7 per-centage points to total GDP growth of 6.6%. Despite stop-ping the upward trend in personal consumption in the third quarter of 2007, this category still rose at a high rate of 6.5% in this period, accounting for almost two thirds of the real growth in total economic activity. Following its sharp annual increase by 11.2% early in the year, gross fixed capital forma-tion slowed down markedly to a rate of 5.8% in the second quarter, whereas government consumption growth remained at nearly the same level as in early 2007. The change in in-ventories, which includes statistical discrepancy, made a mild positive contribution to real GDP growth over the second quarter of the year.
Personal ConsumptionPersonal consumption, being the most significant aggre-
gate demand component, rose at a somewhat slower pace in the second quarter of 2007, following its exceptionally strong annual growth of 7.1% in the first quarter. However, its an-nual growth rate remained high (6.5%), thus contributing 4.0 percentage points to real GDP growth, much more than the previous year’s average.
Rapid personal consumption growth over the first and second quarters of 2007 also contributed to a marked in-crease in retail trade turnover, as well as to a rise in value added tax revenues. A business survey for the period De-cember 2006-March 2007 carried out by Privredni vjesnik suggests a mild decline in optimism in trade which can be ascribed to high initial expectations of merchants whose or-ders surpassed the actual demand, as shown by a sharp rise in inventories in retail and wholesale trade.
The available monthly indicators on personal consumption trends in the third quarter of 2007 support the expectations for continued strong annual growth of this aggregate demand component compared with the first half of 2007. After having stabilised at high levels during the second quarter of the year, total retail trade resumed its upward trend in July, leading to a 6.4% increase in real retail trade turnover, seasonally adjusted, relative to the same period in 2006. A sizeable in-
crease in VAT revenues over July and August also points to favourable movements in personal consumption during this period. However, it is hard to establish to what extent these movements are associated with stronger demand by foreign tourists.
Changes in trends in the sources of household consump-tion financing confirm the continuation of strong annual growth of personal consumption over the third quarter of 2007. Bank placements to households, excluding housing loans, slowed down in real terms over July and August com-pared with the beginning of the year, but their growth rates were still high (13.5% cumulatively, according to the average loan balance).
Positive movements were observed in the labour market as well. Administrative sources (preliminary CBS data) point to a slight slowdown in employment at the beginning of the third quarter, as confirmed by the CPIA data on the number of insured persons that are considered to be more reliable short-term indicators of employment. However, these move-
%
–3
0
3
6
9
12
15
18
Figure 4
GDP RATES OF GROWTH (in %) AND RELATIVE CONTRIBUTIONOF DOMESTIC CONSUMPTION CATEGORIES (in percentage points)
original data, constant prices
Source: CBS.
Government consumption Gross capital formation
GDPPersonal consumption
Q1
/01
Q3
/01
Q1
/02
Q3
/02
Q1
/03
Q3
/03
Q1
/04
Q3
/04
Q1
/05
Q3
/05
Q1
/06
Q1
/07
Q3
/06
% %
56
57
58
59
60
61
62
2
3
4
5
6
7
8
9
10
Figure 5
PERSONAL CONSUMPTIONseasonally adjusted
Year-on-year rate of change – left
Source: CBS.Share in GDP – right
Q1
/01
Q3
/01
Q1
/02
Q3
/02
Q1
/03
Q3
/03
Q1
/04
Q3
/04
Q1
/05
Q3
/05
Q1
/06
Q3
/06
Q1
/07
–1
0
1
2
3
4
5
6
7
8
9
5
15
25
35
45
55
% %
Figure 6
PERSONAL CONSUMPTION FINANCINGoriginal data, year-on-year rate ofreal change
Source : CBS .s and CNB
Q1
/01
Q3
/01
Q1
/02
Q3
/02
Q1
/03
Q3
/03
Q1
/04
Q3
/04
Q1
/05
Q3
/05
Q1
/06
Q3
/06
Q1
/07
Lending to households (excl housing loans) left. –
Personal consumption right– Net wages right–

CNB BULLETIN • NUMBER 130 • QUARTERLY REPORT • DEMAND
8
ments were accompanied by acceleration of real net wages paid (to 3.8%). The semi-annual pension adjustment2 by 2.6% in September (starting from July pensions) and the re-payment of another instalment of the pensioners’ debt in June are likely to have positive effects on personal consumption over the second half of the year.
Personal consumption is expected to grow in the third quarter of the current year also on account of a rise in con-sumer optimism in April and July compared with the be-ginning of 2007, as suggested by the results of the CNB’s Consumer Confidence Survey. Consumer Confidence Index (CCI) rose markedly in April, primarily on account of con-siderable growth of expectations regarding employment dy-namics in the following 12 months, but also due to positive consumer ratings of their financial situations and the overall economic situation in Croatia in the coming year. Despite a mild decline in the CCI over July, it still remains well above its long-term average, thus suggesting a continuation of per-sonal consumption growth. Moreover, trend indicators of industrial production, trade in goods and inventories for July and August point to the strengthening of domestic demand for durable consumer goods early in the second half of 2007, which can be a sign of a further rise in consumer optimism.
Investment ConsumptionFollowing its strong growth during the first quarter of
2007, gross fixed capital formation slowed down noticeably in the second quarter (to 5.8%), with its contribution to total real GDP growth decreasing to 1.9 percentage points. The observed slowdown in this aggregate demand component most likely reflects the movements in public sector invest-ment, given that the nominal MoF data on the acquisition of non-financial assets by the consolidated general government
suggest an annual decline in public sector capital investments in the second quarter.
According to investment consumption indicators at the beginning of the third quarter, investment consumption is expected to continue to rise in the reference period, yet at a somewhat slower pace than at the beginning of the year. The weakening of domestic demand for capital goods, ob-served early in the second half of the year, was accompanied by stronger (domestic and foreign) demand for intermedi-ate goods. Such developments point to the growing demand of producers for production materials following a period of strong investment in machinery and equipment, which had an impact on imports and the fall in intermediate goods invento-ries. Favourable movements in investment activity can also be expected on account of construction activity dynamics. Thus, following a decline in the volume of construction works early in the year, and its stabilisation during the second quarter, construction activity, both the construction of buildings and road construction, strengthened again in July. In contrast to this, bank placements to enterprises slowed down consider-ably at the annual level during July and August. However, it should be borne in mind that enterprises have also had access to alternative and increasingly foreign sources of financing.
Government ConsumptionFollowing the end of the fiscal consolidation which
marked the period from end-2003 to early 2004, government consumption has grown continuously, contributing increas-ingly to total GDP formation. According to quarterly GDP estimate, government consumption rose by 2.8% in the first quarter of 2007, compared with the same period last year, declining only slightly at the annual level, to 2.7%, in the second quarter. As a result, the cumulative contribution of government consumption to real GDP growth was 0.6 per-centage points in the first half of the year, double as large as in the same period last year, but still smaller than the contri-butions of other aggregate demand components (disregard-ing the volatile and analytically unreliable category “change in inventories”).
2 Pension indexation has been carried out since 2004, in accordance with the Act on Amendments to the Pension Insurance Act (OG 30/2004). Pursuant to the new Act on Amendments to the Pension Insurance Act (OG 92/2005), which took effect on 31 December 2005, the semi-annual pension indexing is based on average semi-annual rate of change in consumer price index and average gross wage.
2
4
6
8
10
%
–30
–25
–20
–15
–10
–5
0
bala
nces
Figure 7
CONSUMER OPTIMISM AND PERSONAL CONSUMPTIONseasonaly adjusted, year-on-year rate of growth and balances
Sources: CBS and CNB.
Q1
/01
Q3
/01
Q1
/02
Q3
/02
Q1
/03
Q3
/03
Q1
/04
Q3
/04
Q1
/05
Q3
/05
Q1
/06
Q3
/06
Q1
/07
Consumer confidence index – left
Personal consumption – right
long term average CCI-
% %
0
5
10
15
20
25
30
20
22
24
26
28
30
34
32
–5
Figure 8
INVESTMENT CONSUMPTIONgross fixed capital formation, seasonally adjusted
Share in GDP – right
Year-on-year rate of change – left
Source: CBS.
Q1
/01
Q3
/01
Q1
/02
Q3
/02
Q1
/03
Q3
/03
Q1
/04
Q3
/04
Q1
/05
Q3
/05
Q1
/06
Q3
/06
Q1
/07

CNB BULLETIN • NUMBER 130 • QUARTERLY REPORT • DEMAND
9
Box 1: Potential Output Growth
Potential output is the measure of the economy’s pro-duction capacities and is generally defined as the highest level of output that can be sustained in the long run without producing inflationary pressures. In the short run, the dif-ference between the potential GDP and actual GDP (the so-called output gap) reflects the relationship between supply and demand and points to potential inflationary pressures.
Potential output cannot be measured directly, but by using various methods of time series analysis, production function models, and, more recently, by increasingly apply-ing structural economic models. Below is a brief presenta-tion of the most commonly used methods.
The most prominent among the time series analysis methods is the Hodrick-Prescott (HP) filter which sepa-rates the trend component of the GDP series from the cy-clical component. The so-called Band-Pass filters3 also de-compose the series into the trend and cyclical components, one of these filters being the Christiano-Fitzgerald (CFA) filter. Simpler trend-based methods are the linear trend and square trend methods.
In production function models, GDP is related to pro-duction factors. The most common of them is the Cobb-Douglas production function:
where Y is the level of GDP, L is the labour employed and K is the accumulated capital. The level of technology and the efficiency of its utilisation are represented by A (total factor productivity), whereas α and β represent production elas-ticities in terms of labour and capital. If the sum of elastici-ties is 1 (α + β = 1), the returns to scale of the production function are constant. If the sum of elasticities is less than one, the returns to scale are decreasing and if it is more than one, the returns are increasing.
It should be noted that, owing to methodological differ-ences, the estimated levels of potential output (and, con-sequently, the output gap) may be, and frequently are, dif-ferent.
The potential output level for Croatia is estimated on the basis of the real GDP data (by quarter), seasonally adjusted. The observed period is from the beginning of 1997 to the first quarter of 2007, inclusive.4
The potential output is estimated by means of the pro-duction function on the basis of annual data for the period 1997-2006. The labour factor (L) is represented by the number of the employed, and capital (K) by the estimated gross capital stock. The underlying assumption is that re-turns to scale are constant and the share of labour in the economy is 64%. Given a function specification, the poten-tial output can be calculated by assessing the trend compo-
nents of all production factors except capital. The smooth-ing of the capital series is not justified because the capital stock is an indicator of available production capacities.
Table 1 shows a calculation of potential GDP growth for Croatia by using different methods. The realised growth data point to its acceleration since 2002, to an average of 4.7% over the last five years, which is equal to the growth outturns in 2006. Given its structure, the HP filter most closely reflects the actual growth, whereas the use of pro-duction function approach and CFA filter results in some-what lower potential growth levels than those achieved in the last few years. The linear trend and square trend method results deviate most from the average values, particularly in 2006. According to these assessments, the actual GDP growth remained at, or even slightly exceeded, the level of its potential growth over the last few years.
The production function method also provides for the calculation of individual production factor contributions to total economic growth (growth accounting). It is shown that the largest contribution to growth over the last decade was made by technology, i.e. an increase in total factor produc-tivity. The second largest contribution came from capital, particularly after 2001, owing to investment acceleration. The most volatile category over the last decade was the la-bour factor, with its only negligible average contribution to economic growth. During recession in Croatia (end-1998 to early 1999), employment dropped, resulting in a nega-tive contribution of the labour factor in the first sub-period. Despite the growth of employment during the economic ex-pansion period (from 2002 on) the contribution of labour has been positive, but still the least of all growth factors. This is due to the demographic structure of the Croatian population, i.e. a rise in the share of elderly persons and a decline in the number of younger persons entering the labour force and finding jobs. The employment of unem-ployed persons and a stronger inflow of inactive population in the labour force could produce a one-off effect on the potential GDP level, without boosting economic growth in the long run. Therefore, the main growth generator in the coming period should be investment, and, particularly, the growth of factor productivity, which could be facilitated by Croatia’s joining the EU.
3 The Band-Pass filters are based on the ability to recognise and allow passing only the central frequencies of a particular signal.
4 Please note that the CBS data on GDP for the post-2004 period are still preliminary and that previous data revisions led to considerable increases in the final GDP values relative to the preliminary indicators for the period 2001-2004.
Table 2: GDP Growth Decomposition by Production Factors
GDPContributions to GDP growth
Labour Capital Total factor productivity
1998 – 2001 2.2 –1.3 1.1 2.4
2002 – 2006 4.7 1.0 1.7 2.0
1998 – 2006 3.6 0.0 1.5 2.2
Source: CNB calculation.
Table 1: Potential GDP Growth Estimated by Different Methods
Realised GDP
growth
Potential GDP estimates based on:
Linear trend
Square trend HP filter CFA filter
(asymmetric)Production
function
2006 4.8 3.9 5.7 4.8 3.8 4.3
1998 – 2006 3.6 3.9 3.8 3.8 3.7 3.8
2002 – 2006 4.7 3.9 4.7 4.6 4.6 4.2
Source: CNB calculation.

CNB BULLETIN • NUMBER 130 • QUARTERLY REPORT • OUTPUT
10
According to nominal MoF data on the realised revenues and expenditures of the consolidated central government (on a cash basis) for July and August 2007, compensation of pub-lic administration employees, including severance payments, accelerated annually, thus fuelling the nominal growth of total government consumption in this period. These developments were paralleled with a marked increase in expenditures for the use of goods and services, which is likely to have a similar effect. However, it is difficult to assess the contribution of material and other expenses to real government consumption growth, given the differences in the coverage between the budgetary data and the System of National Accounts data.
OutputAs shown by quarterly GDP estimate based on production
method, the annual growth rate of gross value added dropped from 6.9% in the first quarter to 6.3% in the second quarter of 2007. At the semi-annual level, all activities contributed positively to GVA growth, with the largest contributions com-ing from industry (2.4 percentage points) and financial inter-mediation (1.3 percentage points).
All economic activities, except public administration, re-ported slower growth rates of real GVA in the second quarter of 2007 relative to those early in the year, as confirmed by available monthly economic indicators. Total volume of indus-trial production rose at steady rates from May to July, with its August decline probably being a sign of stabilisation in indus-trial production over the third quarter. Following its strong growth early in the year, retail trade turnover held steady over the second quarter. Positive movements were also seen in do-mestic and foreign tourist arrivals and nights recorded in the balance of payments. Negative trends in construction were stopped at mid-year, as shown by a pronounced recovery in business optimism in this activity according to a survey car-ried out by Privredni vjesnik in June.
Economic growth acceleration early in 2007 contributed, through the tax mechanism, to a sharp increase in taxes on
goods less subsidies (according to the National Accounts data). Owing to such developments GDP growth surpassed the growth in GVA over the first quarter of 2007. As shown by the MoF data on revenues and expenditures of the consoli-dated general government (on a cash basis, GFS 2001), net indirect taxes continued to rise at an exceptionally high rate (above 12.0%) in the second quarter, primarily on account of the sizeable growth of the taxes on goods, but also due to a cut in government subsidies to public and private sector enterprises. These movements announced the possibility of faster real GDP growth compared with the growth of GVA also in the second quarter of 2007, as confirmed by the quar-terly GDP calculation for the second quarter.
Industry
Real value of production in industry, comprising manu-facturing, mining and quarrying and energy supply, went up 8.4% in the second quarter of 2007 compared with the same
80
90
100
110
120
130
140
150
160
170
180
Figure 10
index,
1998
=100
Agriculture
Trade
Hotels and restaurants Industry
ConstructionTransport and communication
Source: CBS.
GROSS VALUE ADDED INSELECTED ACTIVITIES
trend-cycle
Q1
/01
Q3
/01
Q1
/02
Q3
/02
Q1
/03
Q3
/03
Q1
/04
Q3
/04
Q1
/05
Q3
/05
Q1
/06
Q3
/06
Q1
/07
%
0
2
4
6
8
10
GROSS VALUE ADDED AND TAXESON GOODS MINUS SUBSIDIES
year-on-year changerate oforiginal data,
Figure 11
GVA Taxes on goods minus subsidies
Source: CBS.
Q1
/01
Q3
/01
Q1
/02
Q3
/02
Q1
/03
Q3
/03
Q1
/04
Q3
/04
Q1
/05
Q3
/05
Q1
/06
Q3
/06
Q4
/06
% %
18
19
20
21
22
23
24
–10
–8
–6
–4
–2
0
2
4
6
8
10
Figure 9
GOVERNMENT CONSUMPTIONseasonally adjusted
Share in GDP – right
Year-on-year rate of change – left
Source: CBS.
Q1
/01
Q3
/01
Q1
/02
Q3
/02
Q1
/03
Q3
/03
Q1
/04
Q3
/04
Q1
/05
Q3
/05
Q1
/06
Q3
/06
Q/0
17
CNB BULLETIN • NUMBER 130 • QUARTERLY REPORT • OUTPUT
11
95
105
115
125
135
155
145
index,2000
=100
Figure 12
TOTAL VOLUME OF INDUSTRIAL PRODUCTIONtrend-cycle
Source: CBS.
Mining and quarrying Manufacturing
Electricity, gas and water supply Industry – total
1/0
1
7/0
1
1/0
2
7/0
2
1/0
3
7/0
3
1/0
4
7/0
4
1/0
5
7/0
5
1/0
6
7/0
6
1/0
7
7/0
7
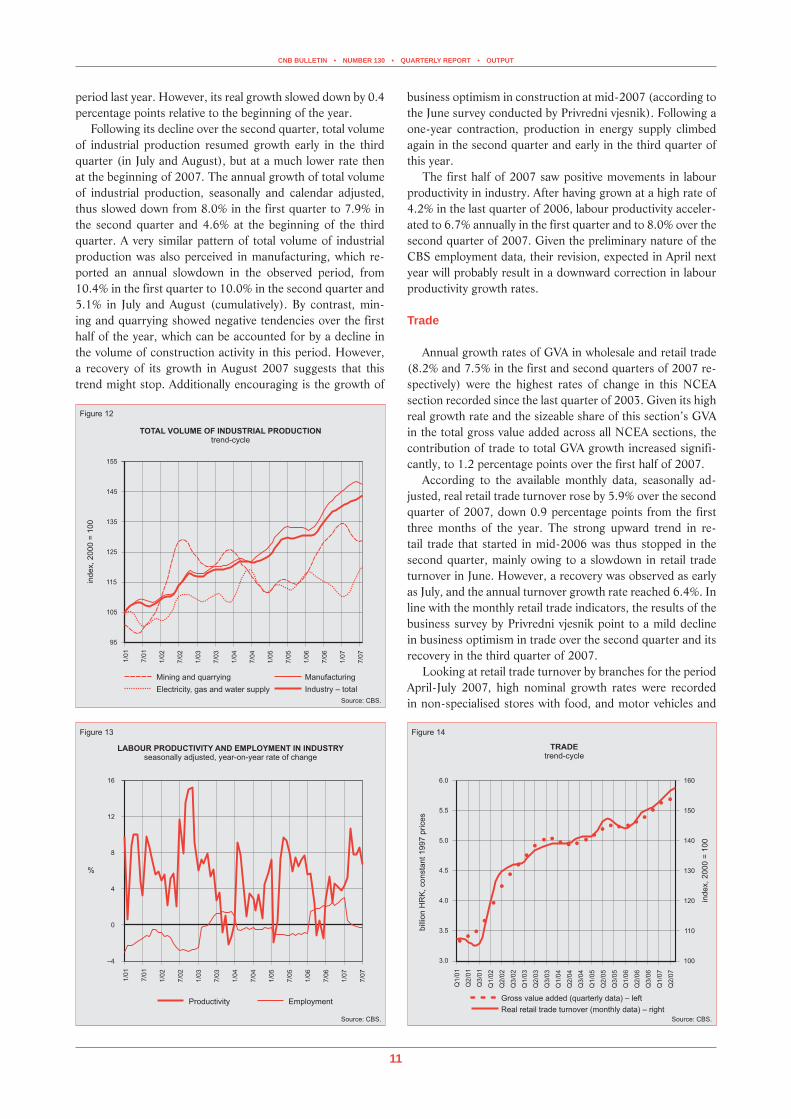
period last year. However, its real growth slowed down by 0.4 percentage points relative to the beginning of the year.
Following its decline over the second quarter, total volume of industrial production resumed growth early in the third quarter (in July and August), but at a much lower rate then at the beginning of 2007. The annual growth of total volume of industrial production, seasonally and calendar adjusted, thus slowed down from 8.0% in the first quarter to 7.9% in the second quarter and 4.6% at the beginning of the third quarter. A very similar pattern of total volume of industrial production was also perceived in manufacturing, which re-ported an annual slowdown in the observed period, from 10.4% in the first quarter to 10.0% in the second quarter and 5.1% in July and August (cumulatively). By contrast, min-ing and quarrying showed negative tendencies over the first half of the year, which can be accounted for by a decline in the volume of construction activity in this period. However, a recovery of its growth in August 2007 suggests that this trend might stop. Additionally encouraging is the growth of
%
–4
0
4
8
12
16
Figure 13
LABOUR PRODUCTIVITY AND EMPLOYMENT IN INDUSTRYyear-on-year rate of changeseasonally adjusted,
Productivity Employment
Source: CBS.
1/0
1
7/0
1
1/0
2
7/0
2
1/0
3
7/0
3
1/0
4
7/0
4
1/0
5
7/0
5
1/0
6
7/0
6
1/0
7
7/0
7
business optimism in construction at mid-2007 (according to the June survey conducted by Privredni vjesnik). Following a one-year contraction, production in energy supply climbed again in the second quarter and early in the third quarter of this year.
The first half of 2007 saw positive movements in labour productivity in industry. After having grown at a high rate of 4.2% in the last quarter of 2006, labour productivity acceler-ated to 6.7% annually in the first quarter and to 8.0% over the second quarter of 2007. Given the preliminary nature of the CBS employment data, their revision, expected in April next year will probably result in a downward correction in labour productivity growth rates.
Trade
Annual growth rates of GVA in wholesale and retail trade (8.2% and 7.5% in the first and second quarters of 2007 re-spectively) were the highest rates of change in this NCEA section recorded since the last quarter of 2003. Given its high real growth rate and the sizeable share of this section’s GVA in the total gross value added across all NCEA sections, the contribution of trade to total GVA growth increased signifi-cantly, to 1.2 percentage points over the first half of 2007.
According to the available monthly data, seasonally ad-justed, real retail trade turnover rose by 5.9% over the second quarter of 2007, down 0.9 percentage points from the first three months of the year. The strong upward trend in re-tail trade that started in mid-2006 was thus stopped in the second quarter, mainly owing to a slowdown in retail trade turnover in June. However, a recovery was observed as early as July, and the annual turnover growth rate reached 6.4%. In line with the monthly retail trade indicators, the results of the business survey by Privredni vjesnik point to a mild decline in business optimism in trade over the second quarter and its recovery in the third quarter of 2007.
Looking at retail trade turnover by branches for the period April-July 2007, high nominal growth rates were recorded in non-specialised stores with food, and motor vehicles and
100
110
120
130
140
160
150
bill
ion
HR
K,consta
nt1997
prices
index,2000
=100
Figure 14
TRADEtrend-cycle
Gross value added (quarterly ) – leftdata
Real retail trade turnover ( ) – rightmonthly dataSource: CBS.
3.0
3.5
4.0
4.5
5.0
5.5
6.0
Q1
/01
Q2
/01
Q3
/01
Q1
/02
Q2
/02
Q3
/02
Q1
/03
Q2
/03
Q3
/03
Q1
/04
Q2
/04
Q3
/04
Q1
/05
Q2
/05
Q3
/05
Q1
/06
Q2
/06
Q3
/06
Q1
/07
Q2
/07
CNB BULLETIN • NUMBER 130 • QUARTERLY REPORT • OUTPUT
12
lubricants, making the largest positive contributions to nomi-nal retail trade growth. The strongest negative contribution to retail trade growth in this period came from the sale of furniture and other household goods, as well as other retail sale in specialised stores.
Construction
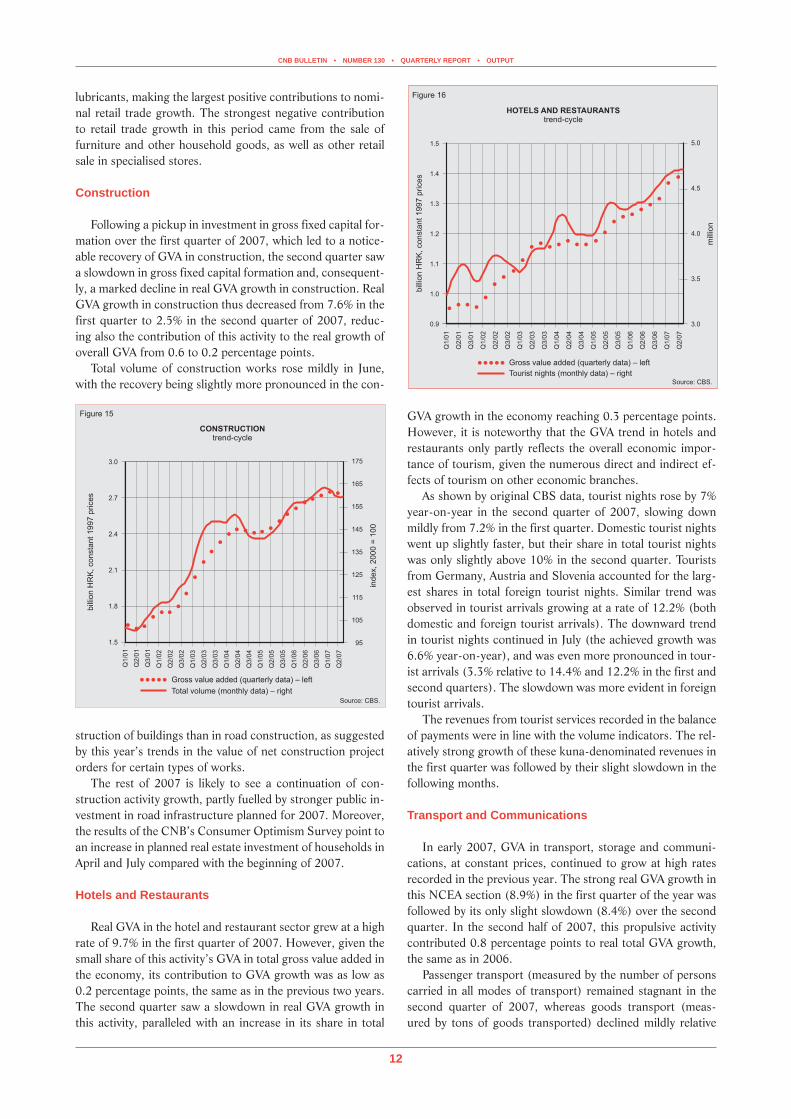
Following a pickup in investment in gross fixed capital for-mation over the first quarter of 2007, which led to a notice-able recovery of GVA in construction, the second quarter saw a slowdown in gross fixed capital formation and, consequent-ly, a marked decline in real GVA growth in construction. Real GVA growth in construction thus decreased from 7.6% in the first quarter to 2.5% in the second quarter of 2007, reduc-ing also the contribution of this activity to the real growth of overall GVA from 0.6 to 0.2 percentage points.
Total volume of construction works rose mildly in June, with the recovery being slightly more pronounced in the con-
GVA growth in the economy reaching 0.3 percentage points. However, it is noteworthy that the GVA trend in hotels and restaurants only partly reflects the overall economic impor-tance of tourism, given the numerous direct and indirect ef-fects of tourism on other economic branches.
As shown by original CBS data, tourist nights rose by 7% year-on-year in the second quarter of 2007, slowing down mildly from 7.2% in the first quarter. Domestic tourist nights went up slightly faster, but their share in total tourist nights was only slightly above 10% in the second quarter. Tourists from Germany, Austria and Slovenia accounted for the larg-est shares in total foreign tourist nights. Similar trend was observed in tourist arrivals growing at a rate of 12.2% (both domestic and foreign tourist arrivals). The downward trend in tourist nights continued in July (the achieved growth was 6.6% year-on-year), and was even more pronounced in tour-ist arrivals (3.3% relative to 14.4% and 12.2% in the first and second quarters). The slowdown was more evident in foreign tourist arrivals.
The revenues from tourist services recorded in the balance of payments were in line with the volume indicators. The rel-atively strong growth of these kuna-denominated revenues in the first quarter was followed by their slight slowdown in the following months.
Transport and Communications
In early 2007, GVA in transport, storage and communi-cations, at constant prices, continued to grow at high rates recorded in the previous year. The strong real GVA growth in this NCEA section (8.9%) in the first quarter of the year was followed by its only slight slowdown (8.4%) over the second quarter. In the second half of 2007, this propulsive activity contributed 0.8 percentage points to real total GVA growth, the same as in 2006.
Passenger transport (measured by the number of persons carried in all modes of transport) remained stagnant in the second quarter of 2007, whereas goods transport (meas-ured by tons of goods transported) declined mildly relative
95
105
115
125
135
145
155
175
165
bill
ion
HR
K,consta
nt1997
prices
index,2000
=100
Figure 15
CONSTRUCTIONtrend-cycle
Gross value added (quarterly ) – leftdata
Total volume monthly data( ) – rightSource: CBS.
1.5
1.8
2.1
2.4
2.7
3.0
Q1
/01
Q2
/01
Q3
/01
Q1
/02
Q2
/02
Q3
/02
Q1
/03
Q2
/03
Q3
/03
Q1
/04
Q2
/04
Q3
/04
Q1
/05
Q2
/05
Q3
/05
Q1
/06
Q2
/06
Q3
/06
Q1
/07
Q2
/07
bill
ion
HR
K,
consta
nt
1997
prices
mill
ion
Figure 16
HOTELS AND RESTAURANTStrend-cycle
Tourist nights (monthly data) – right
Gross value added (quarterly – leftdata)
Source: CBS.
0.9
1.0
1.1
1.2
1.3
1.5
1.4
3.0
3.5
4.0
4.5
5.0
Q1
/01
Q2
/01
Q3
/01
Q1
/02
Q2
/02
Q3
/02
Q1
/03
Q2
/03
Q3
/03
Q1
/04
Q2
/04
Q3
/04
Q1
/05
Q2
/05
Q3
/05
Q1
/06
Q2
/06
Q3
/06
Q1
/07
Q2
/07
struction of buildings than in road construction, as suggested by this year’s trends in the value of net construction project orders for certain types of works.
The rest of 2007 is likely to see a continuation of con-struction activity growth, partly fuelled by stronger public in-vestment in road infrastructure planned for 2007. Moreover, the results of the CNB’s Consumer Optimism Survey point to an increase in planned real estate investment of households in April and July compared with the beginning of 2007.
Hotels and Restaurants
Real GVA in the hotel and restaurant sector grew at a high rate of 9.7% in the first quarter of 2007. However, given the small share of this activity’s GVA in total gross value added in the economy, its contribution to GVA growth was as low as 0.2 percentage points, the same as in the previous two years. The second quarter saw a slowdown in real GVA growth in this activity, paralleled with an increase in its share in total

CNB BULLETIN • NUMBER 130 • QUARTERLY REPORT • LABOUR MARKET
13
to the beginning of the year. Nevertheless, the annual rates of change (13.4% in passenger transport and 5.1% in goods transport, seasonally adjusted) were positive in this quarter, but markedly lower than in the first quarter.
Although the largest number of passengers was carried in road transport over the observed period, the annual rate of change in this mode of transport remained negative in the second quarter (–3.4%). In the same period, the number of passengers in rail transport continued to grow at a high rate (42.1%, according to original data), thus approaching the number of passengers carried in the (dominant) road trans-port. By contrast, road goods transport, measured by ton-kilometres, rose by 8.7% year-on-year in the second quarter, whereas rail goods transport went up 11.7%.
The trends observed in telecommunications services early in the year continued. The number of minutes spent in the fixed network fell by 12.7% annually in the second quarter of 2007. In the same period, minutes spent in the mobile net-work continued upwards at a high annual rate of 28.1%.
Labour MarketSince the beginning of 2007, the CBS has been publishing
the results of the Labour Force Survey in quarterly intervals, and not semi-annually as was formerly done. This was in re-sponse to the requirement to upgrade the Survey and bring it in line with the acquis. The change in the Survey publishing dynamics makes it impossible to compare the data for the first quarter of 2007 with those available earlier. According to the most recent available data for the first quarter, the unem-ployment and employment rates stood at 11.2% and 42.8% respectively.
Favourable labour market trends from the first quarter of 2007 continued in the second quarter as well in July and August. Registered unemployment fell, its rate decreasing to 13.8% at end-August, the lowest rate since 1997. Employ-ment indicators, preliminary CBS data on employment and the CPIA data on the number of employed persons point to
an increase in total employment over the second quarter rela-tive to the same period last year.
The annual slowdown in nominal gross and net wages and the annual acceleration of the consumer price index led to a decline in real gross and net wages paid in the second quarter of 2007. Owing to the tax progression effects, average real net wages rose slower than average real gross wages.
Unemployment and Employment
The number of unemployed persons registered with the CES totalled 35,400 in the second quarter of 2007, down 1,300 or 9.6% from the same period last year. This pro-nounced decrease in the number of the newly registered was partly attributable to low inflows into the register throughout the second quarter, particularly in June when the number of registered persons totalled 11,200, a record low since 1997. Strong inflows into the register reported in July and August were usual for early summer, owing to the inflows of persons
20
24
28
32
36
Gross value added – left Goods carried
Passengers carried
Figure 17
TRANSPORT, STORAGE AND COMMUNICATIONtrend-cycle, quarterly data
bill
ion
HR
K,
consta
nt
1997
prices
mill
ion
of
tons/m
illio
nof
passengers
Source: CBS.
2.2
2.4
2.6
2.8
3.0
3.2
3.4
3.6
3.8
4.0
Q1
/01
Q3
/01
Q1
/02
Q3
/02
Q1
/03
Q3
/03
Q1
/04
Q3
/04
Q1
/05
Q3
/05
Q1
/06
Q3
/06
Q1
/07
–10
–20
0
10
20
30
40
Figure 18
CHANGES IN REGISTERED UNEMPLOYMENT
Balance
Cleared from the recordsfor other reasons
Newly registered
Previously employed
Outflow from the CES register
Source: CES.
thousand
1/0
1
7/0
1
1/0
2
7/0
2
1/0
3
7/0
3
1/0
4
7/0
4
1/0
5
7/0
5
1/0
6
7/0
6
1/0
7
7/0
7
240
260
280
300
320
340
360
380
400
420
Figure 19
UNEMPLOYED PERSONS REGISTERED WITHTHE CROATIAN EMPLOYMENT SERVICE
UnemployedUnemployed – trend
Source: CES.
thousand
1/0
1
7/0
1
1/0
2
7/0
2
1/0
3
7/0
3
1/0
4
7/0
4
1/0
5
7/0
5
1/0
6
7/0
6
1/0
7
7/0
7

CNB BULLETIN • NUMBER 130 • QUARTERLY REPORT • LABOUR MARKET
14
leaving regular education.By contrast, due to seasonal employment, employment
from the CES register strengthened during the second quar-ter relative to a quarter earlier. However, 51,000 persons employed from the register in this period were not enough to increase the annual level of employment. Clearings from the records for non-employment reasons remained low in the second quarter of 2007.
The labour market movements impacted positively on the trends in the registered unemployment level which declined relative to the first quarter of 2007. Unemployment dropped by 24,300 or 8.4% in the second quarter compared with the same period last year. Due to a further slowdown in unem-ployment over July and August, the number of unemployed persons registered with the CES stood at 242,900 and the registered unemployment rate fell to 13.8% at end-August (from 14.0% in July), the lowest recorded level and rate of registered unemployment since 1997.
During 2006, the CES created prerequisites for meth-odological and implementation improvements in the Labour Force Survey aimed at obtaining more accurate results and ensuring full harmonisation with the acquis. Therefore, the Survey has been conducted on a continuous basis since 2007, by interviewing households continually throughout the year, i.e. each week is a reference week, or surveyed or imple-mentation week. The collected data are continually submitted to the CES which processes them and publishes the survey results on a quarterly basis.
The described changes do not allow for comparisons with the existing survey data on employment and unemploy-ment, as they are only available semi-annually. According to the Labour Force Survey data for the first quarter of 2007 published in July this year, unemployment stood at 197,000. The number of unemployed persons for the entire 2006 was 198,500. The Labour Force Survey unemployment rate stood at 11.2% in the first quarter of 2007 and was equal to the av-erage Labour Force Survey rate for the entire 2006.
Employment
Employment indicators suggest further growth of total employment in the second quarter of 2007. The number of persons insured with the CPIA, being a reliable short-term in-dicator of employment, went up by 2.8% year-on-year in the second quarter. According to preliminary CBS data, average employment stood at 1.485 million in the April-June period, the annual employment growth rate being 0.9%. It should be noted that this annual rate is based on revised employment data for the period up to January 2007 and preliminary em-ployment data for the period after that. This rate is therefore likely to be higher after the revision of the preliminary em-ployment data for 2007, expected in April 2008.
The average number of employed persons according to the Labour Force Survey was 1.56 million, with the Labour Force Survey employment rate standing at 42.8%. For the entire 2006, average employment stood at 1.59 million.
Employment in legal entities, accounting for almost 80% of
%
10
12
14
16
18
20
22
24
26
Figure 20
ADMINISTRATIVE AND LABOUR FORCESURVEY UNEMPLOYMENT RATES
Source: CBS.
Administrative sources Labour Force Surveya
Administrative sources – trend
1/0
1
7/0
1
1/0
2
7/0
2
1/0
3
7/0
3
1/0
4
7/0
4
1/0
5
7/0
5
1/0
6
7/0
6
1/0
7
7/0
7
aThe Labour Force Survey is published quarterly since the beginning of 2007.
1020
1040
1060
1080
1100
1120
1140
1160
1180
1200
1080
1100
1120
1140
1160
1180
1200
1220
1240
1260
1280
1300
Figure 21
EMPLOYMENT IN LEGAL ENTITIESaccording to administrative sources and the CPIA
Sources: CBS and CPIA.
Employed in legal entities (administrative sources) – left
Insured with the CPIA (excl private farmersand crafts and trades) – right
.
thousand
thousand
1/0
1
7/0
1
1/0
2
7/0
2
1/0
3
7/0
3
1/0
4
7/0
4
1/0
5
7/0
5
1/0
6
7/0
6
1/0
7
7/0
7
%
41
42
43
44
45
46
48
47
1320
1340
1360
1380
1400
1420
1440
1460
1480
1500
1520
Figure 22
TOTAL EMPLOYMENT ACCORDING TOADMINISTRATIVE SOURCES AND EMPLOYMENT
RATE ACCORDING TO LABOUR FORCE SURVEYTHE
Labour Force Survey – left
Administrative sources – right
Source: CBS.
thousand
1/0
1
7/0
1
1/0
2
7/0
2
1/0
3
7/0
3
1/0
4
7/0
4
1/0
5
7/0
5
1/0
6
7/0
6
1/0
7
7/0
7

CNB BULLETIN • NUMBER 130 • QUARTERLY REPORT • LABOUR MARKET
15
overall employment, was the main generator of total employ-ment growth during the second quarter of 2007. The number of persons employed in crafts and trades and free-lances went up by 0.4% annually, while the number of individual farmers actively insured with the CPIA continued downwards, thus offsetting the small, but positive contribution of employment growth in crafts and trades and free-lances to total employ-ment.
Looking at total employment by activity for the second quarter of 2007, the largest positive contributions to total employment growth came from real estate, rental and other business services (4,500 or 4.5%), financial intermediation (1,000 or 2.9%), construction (3,600 or 2.7%) and whole-sale and retail trade (6,600 or 2.6%). The increase in em-ployment in education and health care mitigated the effect of its decrease in the narrowly defined public administration, so that employment in overall public administration went up by 2,500 or 0.9% annually. In contrast to this, the sharpest an-nual decrease in employment was recorded in electricity, gas and water supply (400 or 1.4%).
Wages and Labour Costs
Real gross wages slowed down annually over the second quarter of 2007, their growth rate falling from 5.3% in the first quarter to 3.3% in the second quarter of 2007. Owing to the tax progression effects, the growth in the average real net wage lagged behind that in the average real gross wage in this period. The annual growth rate of net wages also decelerated, to 2.4% compared with the annual rate of change for the first quarter of the year (4.3%).
The annual slowdown in average real gross and net wages paid in the second quarter was largely the result of slower annual growth in average nominal gross and net wages and, to a smaller part, of the annual acceleration of the consumer price index. The annual growth rate of the average nominal gross wage paid in the second quarter stood at 5.5%, down 1.5 percentage points from the first quarter of 2007.
The annual slowdown in the average real gross wage in
the second quarter of 2007 was due to annual wage decel-eration in all NCEA activities. The largest positive contribu-tions to the growth in the average real gross wage came from manufacturing (0.7%) and wholesale and retail trade (0.7%), notably owing to their large shares in overall industry. The highest annual rates of gross wage growth were recorded in construction (6.8%) and mining and quarrying (5.9%). Real gross wages paid in public administration (including educa-tion, health care and social welfare) rose at a rate of 5.1% in the second quarter, down 0.9 percentage points from the first quarter.
Real gross wages in industry followed the general trends in real gross wages, so that the annual growth in the average real gross wage in industry slowed down from 5.5% in the first quarter to 3.5% in the second quarter of 2007. Labour pro-ductivity in industry, measured by the GVA dynamics in this activity, at constant prices per employee, rose at the rates of 7.5% and 8.3% in the first and second quarters respectively, exceeding markedly the real gross wage growth in this period.
40
50
60
70
80
90
100
110
120
130
140
Figure 23
EMPLOYMENT ACCORDING TOADMINISTRATIVE SOURCES
January 2001 = 100
Employed in legal entities
Employed in crafts and trades and free-lances
Actively insured – private farmersSource: CBS.
index
1/0
1
7/0
1
1/0
2
7/0
2
1/0
3
7/0
3
1/0
4
7/0
4
1/0
5
7/0
5
1/0
6
7/0
6
1/0
7
7/0
7
3100
3300
3500
3700
3900
4100
4300
4500
4700
4700
4900
5100
5300
5500
5700
5900
6100
6300
HR
K
HR
K
Average real net wage – left
Average real gross wage – right
Source: CBS.
Figure 24
AVERAGE REAL WAGESat 2001 prices
1/0
1
7/0
1
1/0
2
7/0
2
1/0
3
7/0
3
1/0
4
7/0
4
1/0
5
7/0
5
1/0
6
7/0
6
1/0
7
7/0
7
%
0
1
2
3
4
5
6
7
8
9
10
Figure 25
CONSUMER PRICES AND AVERAGE NOMINAL GROSS WAGETHEyear-on-year rate of change
Source: CBS.
Average nominal gross wage Consumer prices
1/0
1
7/0
1
1/0
2
7/0
2
1/0
3
7/0
3
1/0
4
7/0
4
1/0
5
7/0
5
1/0
6
7/0
6
1/0
7
7/0
7

CNB BULLETIN • NUMBER 130 • QUARTERLY REPORT • PRICES
16
As suggested by the real gross wage and labour productiv-ity dynamics, price pressures coming from the labour market were not particularly strong.
PricesThe year-on-year consumer price inflation rate accelerat-
ed slightly in the first seven months of 2007, rising from 2.0% in December 20006 to 2.1% in July 2007, and continued to trend upward at a somewhat higher rate (2.6%) in August. The overall CPI increased by a sharp 0.6% in August relative to July, due primarily to a supply-side shock, that is, a rise in the prices of agricultural and industrial food products owing to drought-related crop losses in Croatia. Aiming to allevi-ate the upward pressures on prices, the government levied an export tax on maize5 and authorised its tax-free imports. The export tax on wheat was levied in September.6 The rise in cereal prices pushed up retail prices of bread and cereal prod-ucts by an average 4.7% in August relative to July. Domestic producers warn that the bread price increase was also due to high energy products prices and rising world market prices of maize. The drought also pushed up vegetable prices by a significant 8.2% in August relative to July, while the seasonal drop in fruit prices was lower than usual. As cereal products and vegetables have a large share in the CPI basket, 5.1% and 3.0% respectively, their contribution to monthly inflation in August totalled 0.5 percentage points.
Imported inflationary pressures on domestic prices in the first eight months of this year stemmed from the rise in the prices of crude oil and some other raw materials on the world
market, but they were less marked than in the same period last year. These pressures were offset by the appreciation of the kuna exchange rate against the US dollar (see Box 2)7 and the government’s decision to reduce excises on all kinds of unleaded petrol. Consumer price inflation in the domestic economy was also favourably impacted by a slight apprecia-tion of the kuna against the euro.8 Such exchange rate trends anchor inflationary expectations and stabilise the prices of consumer and intermediate goods and raw material imports from the eurozone. In addition, as shown by the latest avail-able data, industrial labour productivity in the domestic econ-omy increased at a sharper rate than the average nominal net wage (5.1%) in the first seven months of this year, so that the inflationary pressures from that source were subdued.
The acceleration of the year-on-year consumer price in-flation rate in the first eight months of 2007 was primarily driven by the growth of the year-on-year rate of change in core inflation and agricultural products prices. Core inflation remained higher than overall consumer price inflation, with its year-on-year rate of change up from 2.3% in December 2006 to 3.0% in August 2007, and its contribution to the overall consumer price inflation rate rising by 0.5 percentage points. The largest contribution to the acceleration of core inflation in the said period came from an increase in the year-on-year rate of change in some food products prices (bread and cereal products) and footwear prices.9 Furthermore, a considerable contribution to core inflation growth during the observed period was made by the price increase of tobacco products,10 whose share in the core CPI is bigger than that in the overall CPI. In addition, the year-on-year growth rate of services prices, freely formed on the market, accelerated from 2.5% in December 2006 to 4.1% in August 2007, with the result that the contribution of services prices to core in-flation also rose. The sharpest growth was in package holi-days prices, whose year-on-year rate of change went up from 0.2% in December 2006 to 27.7% in August 2007.
The year-on-year rate of change in agricultural products prices increased from –1.3% in December 2006 to 5.4% in August 2007, due primarily to rising fruit prices whose rate of change went up from –5.4% in December 2006 to 5.5% in August 2007. In addition, owing to an unfavourable base effect,11 vegetable prices increased from –1.3% year-on-year in December 2006 to 6.6% year-on-year in August 2007. The contribution of agricultural products prices to overall consumer price inflation in the observed period rose by 0.4 percentage points (from –0.1 percentage point in December
%
–10
–5
0
5
10
15
Q1
/01
Q3
/01
Q1
/02
Q3
/02
Q1
/03
Q3
/03
Q1
/04
Q3
/04
Q1
/05
Q3
/05
Q1
/06
Q3
/06
Q1
/07
Figure 26AVERAGE REAL GROSS WAGE IN PUBLIC
ADMINISTRATION AND INDUSTRY AND GROSSVALUE ADDED IN INDUSTRY PER EMPLOYED
year-on-year rate of change
Source: CBS.
Real wage in public administrationReal wage in industry
Gross value added in industry per employed
5 The export tax on maize was levied on 23 August because of the price leap caused by drought and the condition on the world commodity exchanges. On the Hamburg Commodity Exchange, for example, the maize price for prompt delivery stood at EUR 230 per tonne and at HRK 1.69 per kilo on 7 August, which is a rise of 55% compared with the same period last year.
6 On 13 September, the government enacted the Regulation on imposing an export tax on wheat in order to discourage exports of domestic wheat stocks in the conditions of lowered supply and drought-related price growth and thus stabilise prices.
7 The average daily exchange rate of the kuna versus the US dollar was 3.6% stronger in August than in December 2006.
8 The kuna/euro exchange rate appreciated by a small 0.6% in nominal terms from December 2006 to August 2007.
9 The growth was due to an unfavourable base effect (the drop in footwear prices in the first eight months in 2007 was lower than that in the same period in 2006).
10 Tobacco prices rose in May and July by an average 2.9% and 2.0% re-spectively in relation to the previous month, which was the first significant price rise of this product group since August 2004. The monthly growth of retail tobacco prices in May and July resulted solely from the increase in the producer prices of tobacco products, whereas these products’ price rise in August 2004 resulted from the increase in excises on tobacco products and their producer price growth.
11 Vegetable prices decreased at a lower rate in the first eight months of 2007 than in the same period in 2006.

CNB BULLETIN • NUMBER 130 • QUARTERLY REPORT • PRICES
17
2006 to 0.3 percentage points in August 2007).The year-on-year growth rate of administrative prices
slowed from 2.0% in December 2006 to 0.7% in August 2007 and their contribution to the overall year-on-year infla-tion rate decreased by 0.3 percentage points. The slowdown in administrative prices was mainly due to a drop in the year-on-year rate of change of water supply prices, down from 17.0% in December 2006 to 6.1% in August 2007, which was caused by a favourable base effect related to slower growth of these prices in the first eight months in 2007 than in the same period in 2006. The slowdown in administrative prices was also party caused by the fall in heat energy prices. In con-trast, domestic prices of refined petroleum products rose in the first eight months in 2007,12 and their year-on-year rate of change went up from –1.9% in December 2006 to 0.3% in August 2007. This was because of the world market crude oil price growth and ensuing upward pressures on domestic prices. These pressures were alleviated by the appreciation of the kuna/US dollar exchange rate and the government’s decision, enacted already in late April, to reduce excises on all types of unleaded petrol in order to keep the price of Euro Super 95 below the ceiling of HRK 8.00.
World market crude oil prices grew in the first eight months of 2007, although at a slower pace than in the same period in 2006, with the result that the year-on-year rate of change in crude oil prices dropped from 8.1% in December 2006 to –2.3% in August 2007. The average world market price of crude oil went up 15.0% in that period, i.e. from USD 61.0 per barrel in December 2006 to USD 70.1 per barrel in Au-gust.13 Due to the nominal appreciation of the kuna/US dol-lar exchange rate, this growth was 10.9% in kuna terms. The growth of crude oil prices, especially marked in the summer months of this year, was driven both by supply and demand
–2
0
2
4
6
8
10
%
Figure 27
CONSUMER PRICE INDEXyear-on-year rate of change
Source: CBS.
Total Goods Services
1/0
1
7/0
1
1/0
2
7/0
2
1/0
3
7/0
3
1/0
4
7/0
4
1/0
5
7/0
5
1/0
6
7/0
6
1/0
7
7/0
7
Table 3: Consumer Price Index, year-on-year rate of change
Weight 2007 12/06 3/07 6/07 7/07 8/07
Total 100.0 2.0 1.8 1.9 2.1 2.6
Food and non-alcoholic beverages 30.5 0.8 0.2 0.8 1.4 3.1
Alcoholic drinks and tobacco 5.5 1.9 1.3 2.7 4.0 4.0
Clothing and footwear 8.5 3.2 5.2 5.5 5.3 5.8
Housing, water, energy, gas and other fuels
14.5 5.4 3.0 1.6 1.3 0.8
Furniture, equipment and maintenance
5.4 2.5 2.0 1.6 1.4 1.8
Health 2.9 1.9 1.9 2.6 2.7 1.3
Transport 11.5 1.1 2.1 3.0 2.0 1.8
Communication 4.4 –0.1 –0.3 –0.2 –0.2 –0.2
Recreation and culture 6.3 0.9 2.5 1.3 1.9 3.1
Education 1.0 0.2 0.0 0.0 1.2 1.3
Catering services 3.6 2.3 2.4 1.6 2.7 2.3
Miscellaneous goods and services 5.9 2.9 3.4 3.6 3.6 3.8
Goods 76.4 1.4 1.1 1.6 1.9 2.6
Services 23.6 4.2 3.7 2.7 2.8 2.6
Source: CBS.
%
–1
0
1
2
3
4
5
6
7
Figure 28
CONSUMER PRICE INDEX AND CORE INFLATIONa
year-on-year rate of change
Consumer price index Core inflation
Core inflation is calculated in the manner that agricultural products prices andadministrative prices (which, among others, include the prices of electricityand refined petroleum products) are excluded from the basket of goods andservices used in the calculation of the price .consumer index
a
Source: CBS.
1/0
1
7/0
1
1/0
2
7/0
2
1/0
3
7/0
3
1/0
4
7/0
4
1/0
5
7/0
5
1/0
6
7/0
6
1/0
7
7/0
7
12 Prices of domestic refined petroleum products grew by an average 6.4% in the first eight months of 2007.
13 The increase was sharper in the same period in 2006, with the crude oil price rising by 27.3%, from USD 56.4 per barrel in December 2005 to USD 71.8 per barrel in August 2006. The summer months saw a sharp price increase, which was mainly the fallout from the Middle East crisis.
–2
–1
0
1
2
3
5
4
Figure 29
Sources: CBS and CNB calculations.
CONTRIBUTION OF CPI COMPONENTS TOYEAR-ON-YEAR INFLATION RATE
a
perc
enta
ge
poin
ts
Agricultural products Core inflation Administrative prices
The contribution is defined as the relative importance of a certain component of theconsumer price index in total inflation. The sum of contributions of all componentsexpressed in percentage points in a relevant month is the amount of the year-on-yearconsumer price inflation rate.
a
12
/03
2/0
4
4/0
4
6/0
4
8/0
4
10
/04
12
/04
2/0
5
4/0
5
6/0
5
8/0
5
10
/05
12
/05
2/0
6
4/0
6
6/0
6
8/0
6
10
/06
12
/06
2/0
7
4/0
7
6/0
7
8/0
7

CNB BULLETIN • NUMBER 130 • QUARTERLY REPORT • PRICES
18
factors, of which the most significant include a slower than expected increase in crude oil output of non-OPEC coun-tries, short-term disturbances in crude oil supply caused by technical difficulties with the North Sea pipeline and surging demand for crude oil by American oil refineries. In addition, crude oil prices were also kept high owing to political disturb-ances in Nigeria and tensions between the US and Iran. In June and July, the price of crude oil on the world market rose by an average of 13.0% (from USD 65.2 in May to USD 73.6 in July); with the daily price of Brent crude oil exceeding USD 79.0 per barrel in July. In August, the price of crude oil dropped by an average of 4.7%, to USD 70.1 per barrel. The drop was in response to market concerns that the slumping mortgage market would lead to an economic slowdown in the US and thus reduce demand for goods, especially energy products. Another reason was because the oil refineries in the Mexican Gulf were not too badly damaged during the hurricane season. Following the decrease in August, crude oil prices rebounded in September. According to analysts, this was due to an unanticipated under-utilisation of US refinery capacities, depleted crude oil and petrol reserves and expec-tations of their further reduction, and also to attacks on oil installations in Mexico. In order to prevent oil prices from rising further, on 11 September 2007 the OPEC countries decided to boost the crude oil output by 500 000 barrels per day as of 1 November. However, as US crude oil reserves de-creased further and markets grew concerned about possible adverse weather conditions in the Mexican Gulf, oil prices rose again, with WTI crude reaching USD 81.9 per barrel on 19 September and Brent crude up to USD 78.4 per barrel.
Although subdued in the first eight months of 2007, up-ward pressures on domestic inflation stemming from the world market increase in raw material prices (except energy products) were still evident. The year-on-year rate of change in the HWWI index of raw material prices (excluding energy products) declined from 30.7% in December 2006 to 12.7% in August 2007. The year-on-year growth rate of non-ferrous metals prices slowed considerably in that period, from 52.6% in December 2006 to 2.8% in August 2007, and so did the
growth rate of iron ore prices, down from 16.4% in December 2006 to 10.4% in August 2007. In contrast, the year-on-year growth rate of food products grew from 22.0% in December 2006 to 26.9% in August 2007. The prices of oilseed and oil jumped from 10.3% year-on-year in December 2006 to 49.9% year-on-year in August 2007. The year-on-year rate of change in cereal prices on the world market slowed down from 50.9% in December 2006 to a still very high 37.2% in August 2007. ECB analysts claim that the sharp increase in food products prices primarily resulted from the high prices of energy and fertilisers, low inventory levels, reduced crops due to adverse weather and surge in demand for food prod-ucts from most developing countries and from China in par-ticular. Furthermore, high energy prices and an increasing number of countries opting for the production of alternative fuels caused a considerable rise in the prices of agricultural raw materials used in the production of biofuels, primarily ethanol and biodiesel.
The latest available data suggest a sharp slowdown in eurozone producer price inflation. The year-on-year rate of change in eurozone producer prices declined from 4.1% in December 2006 to 1.8% in July 2007, mainly because of a slowdown in the year-on-year growth rate of energy prices. The year-on-year rate of change in producer prices of final goods in the eurozone remained at a relatively low level of 1.7% and 1.8% for durable and non-durable consumer goods respectively in July 2007, so that there are no indications that the rise in the prices of oil and other raw materials spilled over significantly to producer prices of final goods in the euro zone.
Croatia’s producer price inflation accelerated in the first eight months of 2007, with its year-on-year rate of change increasing from 1.9% in December 2006 to 3.6% in August 2007. Producer prices increased in all main industrial group-ings in the first eight months of this year, except in capi-tal goods. The year-on-year rate of change in intermediate
15
25
35
45
55
65
75
85
US
D/b
arr
el
Figure 30
AVERAGE CRUDE OIL PRICESON THE WORLD MARKET
a
Source: Bloomberg.
Calculated as an average of the following oil prices (prompt delivery):Dubai Fateh, UK Brent and West Texas Intermediate.
a
1/0
1
7/0
1
1/0
2
7/0
2
1/0
3
7/0
3
1/0
4
7/0
4
1/0
5
7/0
5
1/0
6
7/0
6
1/0
7
7/0
7
% %
–6
–4
–2
0
2
4
8
6
–50
–40
–30
–20
–10
0
10
20
30
40
50
60
70
80
Oil prices HWW index – excl energyI .
HRK/EUR – right PPI in eurozone – right
Sources: Bloomberg, HWW , Eurostat and CNB.I
The Hamburg Institute of International Economics (HWW ) constructed the aggregate index ofraw materials prices in the world market, the so-called HWW index. The HWW index is theindicator of movements in costs for imported raw materials (it includes a total of 29 raw materialsor 27 excluding energy) and it is used in analysing the influence of changes in the prices o rawmaterials in the world market on the changes in prices in industrial countries The index iscalculated on the basis of raw materials prices expressed in US dollars.
II I
f.
a
Figure 31IMPORTED INFLATION: OIL PRICES, THE HWW
INDEX THE AVERAGE KUNA/EURO EXCHANGE RATE
AND PRODUCER PRICES IN THE EUROZONE
I
,a
year-on-year rate of change
1/0
1
7/0
1
1/0
2
7/0
2
1/0
3
7/0
3
1/0
4
7/0
4
1/0
5
7/0
5
1/0
6
7/0
6
1/0
7
7/0
7

CNB BULLETIN • NUMBER 130 • QUARTERLY REPORT • PRICES
19
goods increased the most, from 2.6% in December 2006 to 7.2% in August 2007, with the highest rise in prices observed in the manufacture of other non-metallic mineral products and wood. This suggests that the costs arising from the world market price increase in raw materials might spill over on producer prices of intermediate goods in Croatia. The year-on-year rate of change in the prices of durable consumer goods grew from –0.2 in December 2006 to 2.1% in August 2007. It should be mentioned in this context that the Ordi-nance on the management of waste electronic and electri-cal devices and equipment came into effect in July this year, requiring importers and manufacturers to pay a fee of HRK 2.5 per one kilo of product, so that manufacturers are likely to transfer these expenses to their products’ prices. The year-on-year rate of change in energy prices grew from 1.9% in
December 2006 to 3.6% in August 2007 as a result of the growth in producer prices of refined petroleum products and water supply.14 In addition, the increase in the prices of in-dustrial food products and producer prices of tobacco prod-ucts contributed the most to the growth of producer prices of non-durable consumer goods, whose year-on-year rate of change went up from 2.0% in December 2006 to 2.3% in August 2007.
In contract with inflation in Croatia, inflation in the euro-zone (measured by the HICP) drifted slightly lower in the first eight months of 2006, standing, according to Eurostat data, at 1.7% year-on-year, which is a decrease of 0.2 per-centage points compared with December 2006. The year-on-year consumer price inflation rate in the eurozone was 0.9 percentage points lower in August 2007 than the inflation
% %
–16
–8
0
8
16
24
32
48
40
–8
–6
–4
–2
0
2
4
6
8
10
12
Source: CBS.
Total
Energy – left
Intermediate goods
Capital goods
Durable consumer goods
Non-durable consumer goods
Figure 32
PRODUCER PRICES OF INDUSTRIAL PRODUCTSBY MAIN INDUSTRIAL GROUPINGS
year-on-year rate of change
1/0
1
7/0
1
1/0
2
7/0
2
1/0
3
7/0
3
1/0
4
7/0
4
1/0
5
7/0
5
1/0
6
7/0
6
1/0
7
7/0
7
%
0
1
2
3
4
5
6
7
8
9
10
Figure 33
HICP IN THE EUROZONE AND SELECTEDEU COUNTRIES AND CPI IN CROATIA
year-on-year rate of change
Sources: Eurostat.CBS and
Cro
atia
Euro
zone
Czech
R.
Hungary
Pola
nd
Slo
vak
R.
Slo
venia
12/06 6/07 8/073/07
Box 2: Impact of the Change in the US Dollar/Euro Exchange Rate on Inflation in Croatia
Trends in the exchange rate of the domestic currency against the currencies used in international trade are be-lieved to significantly impact changes in consumer prices. The exchange rate pass-through to inflation is reflected in the importers embedding the change in the kuna exchange rate versus the payment currency in the selling price of a product on the domestic market. As the euro and US dol-lar account for a 70% and 20% share respectively in the currency structure of Croatia’s imports, special attention should be given to the kuna/euro and kuna/US dollar ex-change rates, where the latter can be expressed as the ratio between the bilateral kuna/euro and US dollar/euro ex-change rates.
Besides the currency structure of imports, inflation is also affected by which currency the price is originally set in. For example, trends in the kuna/US dollar exchange rate are embedded in the price of petrol no matter which currency the imported oil is paid for. Also important is the exchange rate variability, so that strong exchange rate fluctuations
often necessitate price adjustments. Although Croatia’s im-ports in euro terms more than three times exceed imports in US dollar terms, the kuna/euro exchange rate variability, measured by standard deviation, is about four times lower than the kuna/US dollar exchange rate variability. More precisely, the year-on-year rate of change in the kuna/US dollar exchange rate had a standard deviation of 10.7% in the last ten years, while the deviation for the kuna/euro ex-change rate was 2.8%.
Considering low inflation of tradables in eurozone coun-tries, the stability of the kuna/euro exchange rate and high volatility of the US dollar/euro exchange rate in recent years, it is realistic to expect the change in the kuna/US dollar ex-change rate to translate into import prices and, in turn, to consumer prices, i.e. domestic inflation (see Figure 34).
In order to quantify the said impact, an estimate is made of the impulse-response function of the VAR model15 show-ing dynamic interaction of the following five variables: the world price index (WPI), US dollar/euro exchange rate
14 The rise in water supply prices in the first eight months of 2007 was completely due to their sharp monthly increase in January this year.
15 VAR stands for vector autoregression.

CNB BULLETIN • NUMBER 130 • QUARTERLY REPORT • PRICES
20
(USD/EUR), domestic output gap, producer price index (PPI) and consumer price index (CPI).16 All the variables are shown as quarterly rates of change, except the domestic output gap, which is shown as a percentage deviation from trend. The standard model is adjusted so that the external variables’ shocks (WPI, USD/EUR) have an impact on the domestic variables (domestic output gap, PPI, CPI), but not vice versa (i.e. the domestic variables cannot make an im-pact on the change in world raw materials prices or the US dollar/euro exchange rate). In our opinion, such a model is suitable for analysing the impact of external (exogenous) shocks on a small open economy like Croatia’s.
Table 4 shows the estimated accumulated impact of the impulse-response of the US dollar/euro exchange rate on domestic inflation. In the first quarter, following the exchange rate shock (weakening of the dollar against the euro) of 100 percentage points, inflation reduces by 8 percentage points. The impact of the shock would be felt throughout four quarters (the absorption period), in which period inflation would reduce by a total of 13 percentage points (Figure 35). In other words, a one percentage point decrease in inflation in the described model results from a 7.7 percentage point appreciation of the US dollar/euro exchange rate. Except directly, the external shocks are also transmitted indirectly (through producer prices), but with a time gap.
The results of the estimate based on the decomposition of the variance show that the external variables’ shocks generate a great deal of variability in all the three domes-tic variables observed (PPI, CPI, domestic output gap). An especially interesting finding concerns the strong impact of shocks on domestic consumer price inflation, with as much
Table 4: Accumulated Impulse-Response of the Quarterly Change in the CPI to the Shocks of External (WPI, USD/EUR) and Domestic (domestic output gap, PPI, CPI) Variables
Horizon WPI USD/EUR Domestic output gap PPI CPI
t + 1 0.01 –0.08 0.01 0.00 0.53
t + 4 0.07 –0.13 0.19 0.09 0.65
t + 8 0.08 –0.13 0.20 0.11 0.65
Note: Horizon is expressed in quarters.Source: CNB calculation.
Table 5: Decomposition of the Variance of the PPI, CPI and Domestic Output Gap
Horizon WPI USD/EUR WPI + USD/EUR
Domestic output gap PPI CPI
t + 1 0.21 0.17 0.38 0.01 0.61 0.00
t + 8 0.41 0.19 0.60 0.03 0.35 0.01
t + 1 0.24 0.42 0.66 0.00 0.01 0.32
t + 8 0.32 0.33 0.65 0.06 0.13 0.15
t + 1 0.02 0.27 0.29 0.71 0.00 0.00
t + 8 0.10 0.44 0.54 0.40 0.06 0.00
Note: Horizon is expressed in quarters. Source: CNB calculation.
0 1 2 3 4 5 6 7 8 9 10 11 12 13 14 15 16
ACCUMULATED IMPULSE-RESPONSEOF THE QUARTERLY INFLATION RATE TO
THE SHOCK OF THE USD/EUR EXCHANGE RATE
Figure 35
Sources CN calculation.: B
–0.30
–0.25
–0.20
–0.15
–0.10
–0.05
0.00
quarter as of the moment of the shock
as 65% of its variability caused by external shocks (33% by US dollar/euro exchange rate shocks and 32% by raw material prices shocks).
In order to achieve a deeper insight into the US dollar/euro exchange rate pass-through to prices, we have calculated the correlations between the year-on-year rates of change in the US dollar/euro exchange rate and the subgroups of good and services included in the CPI. The results of this microa-nalysis are in line with the results of the VAR model – most of the product subgroups included in the CPI basket are nega-tively correlated with the US dollar/euro exchange rate. In other words, the depreciation of the US dollar reduces their prices. As anticipated, this primarily refers to the products and services whose price depends on the price of oil, paid mostly in US dollars, and to road and air transport services, fuels and lubricants for personal vehicles, etc. Furthermore, a strong correlation with the US dollar exchange rate has been observed with the products that are largely produced in Asia and whose prices are mostly set in US dollars, e.g. household appliances, watches, toys, footwear, etc.
YEAR-ON-YEAR RATES OF CHANGE IN
THE CPI AND EUR/USD EXCHANGE RATEa
Figure 34
–2.5
–2.0
–1.5
–1.0
–0.5
0.0
0.5
1.0
1.5
2.0
2.5
3.0
19
98
19
99
20
00
20
01
20
02
20
03
20
04
20
05
20
06
20
07
CPI EUR/USD exchange rate
Both series are standardised by subtracting their meansand dividing by their standard deviations.
a
Sources CB and C .: S NB
16 Also analysed were the specifications of the kuna/euro exchange rate and the Index of the Nominal Effective Exchange Rate (INEER). The kuna/euro exchange rate had no significant impact on the prices in the statistical model, which leads to the assumption that its fluctuations in the observed period (1998-2007) were too weak to be embedded in prices. The nominal effective exchange rate exerts a strong impact on prices, but this impact almost entirely derives from the kuna/US dollar exchange rate, that is, indirectly from the US dollar/euro exchange rate.

CNB BULLETIN • NUMBER 130 • QUARTERLY REPORT • EXCHANGE RATE
21
rate in Croatia (2.6%). This is primarily because of the in-creasing difference between the contribution of food prices to the overall year-on-year inflation rate in Croatia and the contribution to inflation coming from food prices in the euro-zone. Specifically, while the drop in the year-on-year rate of change in food prices in the eurozone in the first eight months this year contributed to the slowdown in the over-all year-on-year inflation rate, rising food prices in Croatia considerably increased their contribution to overall domes-tic inflation. In addition, the share of the prices of food and non-alcoholic beverages in the CPI basket is much higher in Croatia (30.5%) than in the eurozone (15.6%). Also, the lat-est data indicate that food prices in the eurozone remained unaffected by the food products price increase on the world market. ECB analysts ascribe this to several factors including a relatively small share of agricultural products in eurozone imports, provisions related to the EU common agricultural policy which to some extent shelter the eurozone agricultural products market from external influences, and the apprecia-tion of the euro/US dollar exchange rate. However, appar-ently there are indications that agricultural products prices could grow in August this year, primarily due to the price increase of dairy and cereal products in some eurozone mem-bers.
Exchange RateThe kuna/euro exchange rate appreciated by 1.1% in the
second quarter 2007, rising from HRK 7.38/EUR on 31 March to HRK 7.30/EUR on 30 June 2007. The appreciation of the kuna/euro exchange rate, slightly more pronounced in the first two months of the second quarter, was due to a rise in demand for the kuna during Easter holidays and to increased foreign exchange supply resulting from the start of the tourist season and decisions of some foreign parent banks to recapitalise subsidiary banks in Croatia. The kuna/euro exchange rate was also subject to appreciation pressures arising from an increase in demand for the kuna due to con-
tinued kuna lending by banks and to investors’ preparations for the purchase of the second tranche of a ten-year kuna government bond, issued in July 2007. In the second quarter, like in the first quarter, there was no need for central bank foreign exchange interventions and banks met their needs for kuna liquidity at regular reverse repo auctions. Also in the second quarter, the central bank sold a net of EUR 34.8m of foreign exchange to the MoF,17 withdrawing from circulation HRK 0.3bn.
In the third quarter 2007, the nominal kuna/euro ex-change rate ranged between HRK 7.28/EUR and HRK 7.33/EUR, i.e. within a relatively narrow band of between –0.4% and 0.3% relative to the average daily exchange rate (HRK 7.31/EUR). The kuna exchange rate appreciated slightly by 0.3% in the third quarter, with the euro dropping from HRK 7.30 on 30 June to HRK 7.28 on 30 September. As regards monthly exchange rate trends, the kuna/euro exchange rate strengthened over July and September and depreciated in August.
In July, the kuna exchange rate was under appreciation pressures, primarily resulting from a rise in foreign exchange inflows at the peak of the tourist season. Strong foreign ex-change inflows were also generated by continued foreign bor-rowing by enterprises, especially by the Zagrebački holding eurobond issue worth EUR 300m. In an effort to alleviate the appreciation pressures, the central bank in July conducted the first foreign exchange intervention in 2007, purchasing from banks a total of EUR 139.0m at two auctions and creat-ing HRK 1.0bn in kuna liquidity (EUR 71.2m was purchased on 12 July and EUR 67.8m on 17 July). The kuna/euro ex-change rate stood at HRK 7.30/EUR at end-July, rising only by 0.1% compared with end-June.
Due to the increasing foreign exchange demand, the kuna/euro exchange rate dropped by 0.3% in August, standing at HRK 7.32/EUR on 31 August. Moderate depreciation pres-sures were also observed in the first half of September, when
17 Part of this amount was used to repay the World Bank loans granted to the Republic of Croatia, and part was used to settle the liabilities due to the EUROFIMA.
Figure 36
DAILY NOMINAL EXCHANGE RATEHRK vs. EUR and USD–
HRK/EUR HRK/USD
Source: CNB.
CN
Bm
idpoin
texchange
rate
5.0
5.5
6.0
6.5
7.0
7.5
8.0
8.5
9.5
9.0
1/1
/02
27/4
/02
21/8
/02
15/1
2/0
2
10/4
/03
4/8
/03
28/1
1/0
3
23/3
/04
17/7
/04
10/1
1/0
4
6/3
/05
30/6
/05
24/1
0/0
5
17/2
/06
13/6
/06
7/1
0/0
6
31/1
/07
27/5
/07
20/9
/07
%
0.00
0.35
0.05
0.10
0.15
0.20
0.25
0.30
Figure 37
Source: CNB.
EXCHANGE RATE VARIABILITYaverage absolute change of daily kuna/euro
exchange rate, by months
1/0
1
6/0
1
11
/01
4/0
2
9/0
2
2/0
3
7/0
3
12
/03
5/0
4
10
/04
3/0
5
8/0
5
1/0
6
6/0
6
11
/06
4/0
7
9/0
7

CNB BULLETIN • NUMBER 130 • QUARTERLY REPORT • EXCHANGE RATE
22
continually strong enterprise demand for foreign exchange pushed the euro to HRK 7.33. The kuna exchange rate then strengthened, reaching HRK 7.28/EUR on 30 September, which is a 0.5% appreciation compared with end-August. The appreciation was in the second half of September due, among other things, to increased demand for the kuna intended for the purchase of T-HT shares and to investors preparing for the purchase of a new kuna government bond totalling HRK 3.0bn. Against the background of a stable kuna/euro exchange rate, central bank foreign exchange interventions were again not required in September. Through foreign ex-change transactions carried out in September, the CNB sold EUR 3.3m worth of foreign exchange to the MoF for the purpose of interest payments under the World Bank PAL.
The kuna exchange rate stability was further confirmed by a relatively low variability of the kuna/euro exchange rate. The average absolute change in the daily exchange rate of the kuna against the euro, a measure of the exchange rate volatil-ity, reduced from 0.08% in the second quarter to 0.06% in the third quarter 2007.
Having weakened by 1.1% in the second quarter, the US dollar/euro exchange rate, under intense depreciation pres-sures for the most part of the third quarter, weakened by 5.2% in that quarter, falling from USD 1.35/EUR at end-October to USD 1.42/EUR at end-October. The depreciation in July was followed by a slight appreciation in August and resumed again in September. The downward pressures on the US dollar/euro exchange rate in the world’s foreign exchange market in July stemmed from expectations that the interest rate in the eurozone would increase further and from market concern over the conditions in the mortgage loan market. In August, the US dollar slightly strengthened against the euro, regaining some of the value lost in the previous month. In September, however, the US dollar depreciated against the euro due to adverse economic indicators in the US (e.g. an unanticipated decline in employment, lowered consumer confidence and slumping housing sales) and investor expec-tations that the Fed would decrease the benchmark interest rate. These expectations turned out to be right as the Fed on
18 September reduced the benchmark rate by 0.5 percentage points (from 5.25% to 4.75%). The ECB rate remained un-changed at 4.0% in the same period. In line with kuna/euro and US dollar/euro exchange rate trends, the kuna exchange rate appreciated by 5.3% against the US dollar in the third quarter, rising from HRK 5.42/USD on 30 June to HRK 5.14/USD on 30 September.
In addition to appreciating by 0.3% against the euro and by 5.3% against the US dollar, the kuna exchange rate ap-preciated by 4.1% against the pound of sterling and by 0.4% against the Swiss franc in the third quarter. As a result, the index of the daily nominal effective exchange rate of the kuna appreciated by 1.7% from 30 June to 30 September.
According to the latest available data on the index of the real effective exchange rate of the kuna, the export price competitiveness slightly worsened. The index of the real ef-fective exchange rate of the kuna deflated by consumer prices appreciated by 1.3% from July to December 2007, which was due to a 1.8% appreciation of the average monthly index of the nominal effective kuna exchange rate, but also to slower growth of domestic than foreign consumer prices (in the US, eurozone and Great Britain). In the same period, the index of the real effective exchange rate of the kuna deflated by producer prices appreciated by 1.8%, with a relatively faster growth of producer prices in the US compared with Croatian prices offset by a slower growth of producer prices in the eurozone, Switzerland and Great Britain.
%
–8
–6
–4
–2
0
2
4
6
8
HRK/USDHRK/EUR
Figure 38
RATES OF CHANGE OF THE NOMINALEXCHANGE RATE HRK vs. EUR and USDmonth-on-month, CNB midpoint exchange rate
–
Source: CNB.
appreciationof the kuna
1/0
1
6/0
1
11
/01
4/0
2
9/0
2
2/0
3
7/0
3
12
/03
5/0
4
10
/04
3/0
5
8/0
5
1/0
6
6/0
6
11
/06
4/0
7
9/0
7
Source: CNB.
Figure 39INDICES OF THE NOMINAL AND
REAL EFFECTIVE KUNA EXCHANGE RATEWITH CONSUMER AND PRODUCER PRICES
a
2001 = 100
aThe fall of index denotes appreciation of the kuna.
Real CPIReal PPINominal
1/0
1
6/0
1
11
/01
4/0
2
9/0
2
2/0
3
7/0
3
12
/03
5/0
4
10
/04
3/0
5
8/0
5
1/0
6
6/0
6
11
/06
4/0
7
9/0
7
85
90
95
100
105

CNB BULLETIN • NUMBER 130 • QUARTERLY REPORT • MONETARY POLICY AND INSTRUMENTS
23
18 Amendments to the Decision on the purchase of compulsory CNB bills are described in more detail in Box 3.
Monetary Policy and InstrumentsMonetary Environment
In the third quarter of 2007, the monetary environment was strongly influenced by seasonal developments that, to-gether with effective monetary policy measures, led to a de-cline in external debt of banks and slower growth in bank placements to the non-banking sector. The impact of the tourist season on this year’s monetary developments has been more pronounced than in the previous years, as evidenced by swelling bank deposits. This enabled banks to considerably reduce their foreign liabilities. In addition, the central bank tightened up the provisions of the Decision on the purchase of compulsory CNB bills in June 2007 since the rise in bank placements in the first half of the year exceeded the projec-tions.18 Following these changes, which set a 0.5% restric-tion on placement growth per month that does not entail the purchase of compulsory CNB bills, placements grew by only 0.4% in the July-August period.
Notwithstanding strong seasonal demand for the kuna and large foreign exchange inflows that characterise the summer months, appreciation pressures on the exchange rate were less pronounced in the third quarter of 2007 than in the last year. The lowest level of the CNB’s midpoint exchange rate was HRK 7.28/EUR in July 2007, while it was HRK 7.24/EUR in July 2006. Hence, the central bank created reserve money mostly by regular reverse repo auctions, purchasing foreign exchange from banks only twice in July. The liquidity of banks was relatively high, particularly in July.
Uses of Instruments of Monetary Policy
As in the first half of the year, regular weekly reverse repo auctions of T-bills were the main instrument of reserve money creation in the third quarter of 2007. Reverse repo placements averaged HRK 4.2bn in the third quarter, HRK 1.6bn more than in the first half of the year, and four times more than in the same period last year. The largest turnover, of HRK 5.9bn, was made at the auction held on 18 July. If we add a fine tuning operation in the amount of HRK 1.2bn, which was being renewed throughout the third quarter and by which the central bank at end-June created the liquid-ity needed to finance the repayment of a pensioners’ debt tranche, the total funds placed at reverse repo auctions sur-passed HRK 7.0bn. As MoF T-bills are the only collateral used in reverse repo transactions, the turnovers realised were extremely high relative to the amount of collateral available to banks at the time. Lombard loans were used on several occasions: at the beginning of the new reserve requirement maintenance period in July and at end-September.
Intense demand for reserve money and strong creation of kuna liquidity at the outset of the main tourist season in mid-July were spurred by the rise in currency outside banks,
coupled with the issue of kuna government bonds and the foreign currency supply arising from corporate foreign bor-rowing. To these factors, one should add the rise in the cal-culated kuna reserve requirement, which also boosted banks’ demand for kuna. In such conditions, banks were prone to hold much larger amounts of free reserves than usual. Inter-est rates on the money market went up and were quite vola-tile. To neutralise the imbalances present, the central bank accepted all the bids received at reverse repo auctions. Some banks offered even higher repo rates (up to 3.61%) to ensure the funds needed, but the CNB kept the marginal repo rate at 3.5%.
In addition to open market operations, the CNB alleviated appreciation pressures by intervening in the foreign exchange market on 12 and 17 July when it purchased a total of EUR 139.0m from banks, thus creating HRK 1.0bn of additional liquidity. Owing to these interventions and record high turn-overs at reverse repo auctions, banks’ average surplus liquid-ity increased up to HRK 2.0bn at end-July. With the tourist
0
1
2
3
4
6
5
0
1
2
3
4
5
6
Figure 40bill
ion
HR
K
Total amount of bids submitted – left
Total amount of bids accepted – left
Weighted repo rate Highest offered repo rate
Marginal repo rate
REGULAR REVERSE REPO AUCTIONS
inte
restra
teSource: CNB.
6/4
/05
1/6
/05
27
/7/0
5
21
/9/0
5
16
/11
/05
11
/1/0
6
8/3
/06
3/5
/06
28
/6/0
6
23
/8/0
6
25
/10
/06
20
/12
/06
14
/2/0
7
11
/4/0
7
6/6
/07
1/8
/07
26
/9/0
7
7.15
7.25
7.35
7.45
7.55
7.65
7.75
HR
K/E
UR
Figure 41
FOREIGN EXCHANGE TRANSACTIONS OF THE CROATIANNATIONAL BANK AND MIDPOINT HRK/EUR RATE OF EXCHANGE
at current rate of exchange
Source: CNB.
Foreign exchange interventions
Other foreign exchange transactions
End-month rate of exchange
bill
ion
HR
K
–4
–3
–2
–1
0
1
2
3
1/0
1
7/0
1
1/0
2
7/0
2
1/0
3
7/0
3
1/0
4
7/0
4
1/0
5
7/0
5
1/0
6
7/0
6
1/0
7
7/0
7
Note: The positive value of foreign exchange interventions and foreign exchangetransactions relates to the repurchase of foreign exchange by the CNB.
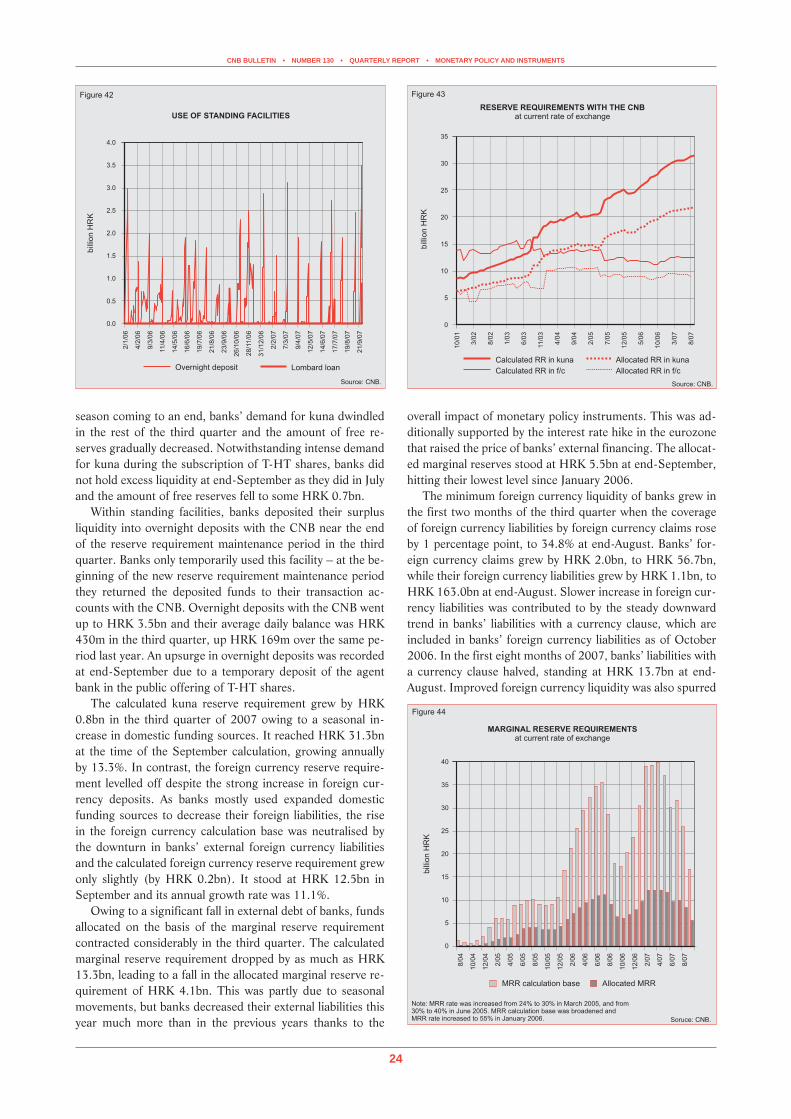
CNB BULLETIN • NUMBER 130 • QUARTERLY REPORT • MONETARY POLICY AND INSTRUMENTS
24
35
30
5
10
15
20
25
0
Figure 43
RESERVE REQUIREMENTS WITH THE CNBat current rate of exchange
Source: CNB.
bill
ion
HR
K
Calculated RR in kuna
Allocated RR in f/c
Allocated RR in kuna
Calculated RR in f/c
10
/01
3/0
2
8/0
2
1/0
3
6/0
3
11
/03
4/0
4
9/0
4
2/0
5
7/0
5
12
/05
5/0
6
10
/06
3/0
7
8/0
7
0
5
10
15
20
25
30
35
40
Note: MRR rate was increased from 24% to 30% in March 2005, and from30% to 40% in June 2005. MRR calculation base was broadened andMRR rate increased to 55% in January 2006.
Figure 44
MARGINAL RESERVE REQUIREMENTSat current rate of changeex
Soruce: CNB.
bill
ion
HR
K
Allocated MRRMRR calculation base
8/0
4
10
/04
12
/04
2/0
5
4/0
5
6/0
5
8/0
5
10
/05
12
/05
2/0
6
4/0
6
6/0
6
8/0
6
10
/06
12
/06
2/0
7
4/0
7
6/0
7
8/0
7
overall impact of monetary policy instruments. This was ad-ditionally supported by the interest rate hike in the eurozone that raised the price of banks’ external financing. The allocat-ed marginal reserves stood at HRK 5.5bn at end-September, hitting their lowest level since January 2006.
The minimum foreign currency liquidity of banks grew in the first two months of the third quarter when the coverage of foreign currency liabilities by foreign currency claims rose by 1 percentage point, to 34.8% at end-August. Banks’ for-eign currency claims grew by HRK 2.0bn, to HRK 56.7bn, while their foreign currency liabilities grew by HRK 1.1bn, to HRK 163.0bn at end-August. Slower increase in foreign cur-rency liabilities was contributed to by the steady downward trend in banks’ liabilities with a currency clause, which are included in banks’ foreign currency liabilities as of October 2006. In the first eight months of 2007, banks’ liabilities with a currency clause halved, standing at HRK 13.7bn at end-August. Improved foreign currency liquidity was also spurred
Figure 42bill
ion
HR
K
Source: CNB.
USE OF STANDING FACILITIES
Lombard loanOvernight deposit
0 0.
0 5.
1 0.
1 5.
2 0.
2 5.
3 0.
3 5.
4 0.
2/1
/06
4/2
/06
9/3
/06
11
/4/0
6
14
/5/0
6
16
/6/0
6
19
/7/0
6
21
/8/0
6
23
/9/0
6
26
/10
/06
28
/11
/06
31
/12
/06
2/2
/07
7/3
/07
9/4
/07
12
/5/0
7
14
/6/0
7
17
/7/0
7
19
/8/0
7
21
/9/0
7
season coming to an end, banks’ demand for kuna dwindled in the rest of the third quarter and the amount of free re-serves gradually decreased. Notwithstanding intense demand for kuna during the subscription of T-HT shares, banks did not hold excess liquidity at end-September as they did in July and the amount of free reserves fell to some HRK 0.7bn.
Within standing facilities, banks deposited their surplus liquidity into overnight deposits with the CNB near the end of the reserve requirement maintenance period in the third quarter. Banks only temporarily used this facility – at the be-ginning of the new reserve requirement maintenance period they returned the deposited funds to their transaction ac-counts with the CNB. Overnight deposits with the CNB went up to HRK 3.5bn and their average daily balance was HRK 430m in the third quarter, up HRK 169m over the same pe-riod last year. An upsurge in overnight deposits was recorded at end-September due to a temporary deposit of the agent bank in the public offering of T-HT shares.
The calculated kuna reserve requirement grew by HRK 0.8bn in the third quarter of 2007 owing to a seasonal in-crease in domestic funding sources. It reached HRK 31.3bn at the time of the September calculation, growing annually by 13.3%. In contrast, the foreign currency reserve require-ment levelled off despite the strong increase in foreign cur-rency deposits. As banks mostly used expanded domestic funding sources to decrease their foreign liabilities, the rise in the foreign currency calculation base was neutralised by the downturn in banks’ external foreign currency liabilities and the calculated foreign currency reserve requirement grew only slightly (by HRK 0.2bn). It stood at HRK 12.5bn in September and its annual growth rate was 11.1%.
Owing to a significant fall in external debt of banks, funds allocated on the basis of the marginal reserve requirement contracted considerably in the third quarter. The calculated marginal reserve requirement dropped by as much as HRK 13.3bn, leading to a fall in the allocated marginal reserve re-quirement of HRK 4.1bn. This was partly due to seasonal movements, but banks decreased their external liabilities this year much more than in the previous years thanks to the

CNB BULLETIN • NUMBER 130 • QUARTERLY REPORT • MONETARY POLICY AND INSTRUMENTS
25
by the amendments to the Decision on the minimum required amount of foreign currency claims, under which the cen-tral bank increased the coverage of banks’ foreign currency claims in the July-October period to include the short-term foreign currency loan of EUR 244.5m in order to prevent the distortion of banks’ foreign currency liquidity.
Reserve Money and International Reserves
Reserve money (M0) was on its usual upward trend in the third quarter, primarily on account of the seasonal rise in currency in circulation. At the end of the second and over the third quarter, strong reserve money growth was also fuelled by other factors, among which, in addition to seasonal move-ments, the most important were the banks’ increased ten-dency to hold high liquidity surpluses and the July upturn in reserve requirements. Unusually strong demand for currency continued into September due to the subscription of T-HT shares. Growing by HRK 2.5bn in the third quarter, reserve
20
25
30
35
40
45
Figure 45
Soruce: CNB.
MINIMUM REQUIRED F/C CLAIMSratio between liquid f/c claims and total f/c liabilities
ratio
betw
een
f/c
cla
ims
and
f/c
liabili
ties
Achieved coverage percentage
adjustment period
cut in the rate of minimumrequired f/c claims
inclusion of kuna liabilities witha currency clause in the base
Prescribed 32% coverage rate
2/0
3
4/0
3
7/0
3
10
/03
1/0
4
4/0
4
7/0
4
10
/04
1/0
5
4/0
5
7/0
5
10
/05
1/0
6
4/0
6
7/0
6
10
/06
1/0
7
4/0
7
7/0
7
%
–10
–5
0
5
10
15
20
25
30
0
10
20
30
40
50
60
Figure 46
Source: CNB.
Quarterly rate of change – left
Balance – right
bill
ion
HR
K
RESERVE MONEYseasonally adjusted
Q1/0
1
Q3/0
1
Q1/0
2
Q3/0
2
Q1/0
3
Q3/0
3
Q1/0
4
Q3/0
4
Q1/0
5
Q3/0
5
Q1/0
6
Q3/0
6
Q1/0
7
Q3/0
7
money amounted to HRK 50.9bn at end-September and its annual growth rate was 13.4%.
The rise in currency in circulation over the summer months was in line with its usual seasonal movements. Currency ex-ceeded HRK 17bn in July and August and started its seasonal falling trend at end-August. Still, the September subscription of T-HT shares led to a renewed currency increase, which is uncommon for the end of the third quarter, as households withdrew assets from banks and funds to convert them into this most liquid monetary aggregate. In mid-September, cur-rency again surpassed HRK 17bn, falling to HRK 15.5bn at the end of the month, up 8.1% over end-September 2006.
Parallel to the high level of currency, banks maintained a high level of funds in settlement accounts. In addition to the strong inclination to hold large free reserves, banks’ funds in settlement accounts in July were also influenced by the rise in the kuna reserve requirement, which had to be increased by another HRK 350.8m in the July allocation. Still, balances in settlement accounts were somewhat lower in August and September than in July. At end-September, banks’ funds in settlement accounts stood at HRK 8.1bn, being 4.1% higher than the year before.
An important source of increasing bank deposits with the CNB was the allocated kuna reserve requirement, which grew by HRK 1.5bn in the first nine months of 2007, to HRK 22.0bn at end-September. The rise in the kuna reserve requirement was particularly pronounced over the summer months due to the already stated huge expansion of house-hold and corporate deposits.
Bank deposits with the CNB also include compulsory CNB bills purchased by the banks that exceed the “non-taxable” placement growth. After the 9 July repurchase of HRK 167.4m of CNB bills that were purchased under the former Decision, the first purchase under the new Decision on the purchase of compulsory CNB bills, which was adopted in June 2007, was made in August. On the basis of the calculated place-ment growth in July, banks purchased HRK 144.0m worth of CNB bills on 20 August, and they purchased additional HRK 114.0m in September on the basis of the calculated place-ment growth in August.
In the first three quarters of 2007, government deposits were characterised by somewhat lower balances and subdued volatility compared with the same period of 2006, which sug-gests better liquidity management on the part of the govern-ment. The average balance of government deposits was HRK 355m and HRK 294m in 2006 and the first three quarters of 2007 respectively.
Net international reserves grew at a somewhat slower pace in the first nine months of 2007 compared with the same period last year, mostly due to a smaller number and amount of CNB interventions in the foreign exchange market. In con-trast to 2006, when the central bank intervened eight times in the foreign exchange market by purchasing EUR 0.9bn net from banks in the period up to end-September, the CNB relied mostly on reverse repo operations as the instrument of liquidity creation in the first three quarters of 2007. Only two foreign exchange interventions occurred in 2007 (ex-cluding the end-2006 intervention whose monetary effect was recorded in January 2007), both in July, amounting to

CNB BULLETIN • NUMBER 130 • QUARTERLY REPORT • MONETARY POLICY AND INSTRUMENTS
26
a total of EUR 139m. In addition, EUR 159m net was sold to the Ministry of Finance in the January-September period of 2007, compared with only EUR 21m net sold to the MoF in the same period of 2006. At end-September 2007, net international reserves stood at EUR 6.8bn, up 10.9% over September 2006.
Gross international reserves recorded a fall of EUR 375m
in the third quarter of 2007 due to the contraction of the allocated marginal reserve requirement. At end-September, gross international reserves stood at EUR 8.8bn, up 8.1% over September 2006.
Monetary Developments
In the first eight months of 2007, bank placements to the non-banking sector grew at a somewhat slower pace, external debt of banks reduced while all monetary aggregates contin-ued to grow sharply. In the first half of the year, placement growth was strong, though somewhat slacker than last year. Hence, the central bank further tightened up the Decision on the purchase of compulsory CNB bills in June. The rise in bank placements to the private sector considerably deceler-ated in July and August. Coupled with the strong increase in domestic funding sources, this deceleration enabled banks to much improve their external position in the first eight months of 2007.
Total Liquid AssetsTotal liquid assets (M4) continued to trend up at a brisk
pace in the second quarter and the first two months of the third quarter. Both components of the monetary aggregate M4, money and quasi-money, expanded strongly. Within the structure of quasi-money, particularly pronounced was the increase in foreign currency deposits. Growing by HRK
Box 3: New Decision on the Purchase of Compulsory CNB Bills
In June 2007, the Croatian National Bank tightened up the Decision on the purchase of compulsory CNB bills by introducing a 0.5% restriction on placement growth per month that does not entail the purchase of CNB bills. The former Decision, which restricted placement growth to 12% a year, was repealed by the adoption of the new Decision. As the banks realised 2/3 of the total annual growth that is not subject to the compulsory CNB bill purchase already in the first half of 2007 (placements increased by 8.9% in the first six months of 2007), the amendments to the Decision were in line with the previous central bank efforts to attain projected monetary policy objectives and thus help reduce external imbalances threatening Croatia.
The Decision on the purchase of compulsory CNB bills that had been in force since end-2006 was repealed on the date of entry into force of the new Decision (9 July 2007). Compulsory CNB bills purchased by the banks whose place-ment growth exceeded the “non-taxable” placement growth limit under the former decision were repurchased on the same day. The new starting base for the calculation of the compulsory CNB bill purchase is the amount of placements as at 30 June 2007 and the base for calculating the amount of compulsory CNB bills to be purchased is placement growth exceeding the permissible growth rate in the respective calcu-lation period. The permissible growth rate of placements for the first calculation period was set at 0.5% and is increased in each subsequent calculation by 0.5 percentage points, which
means that the permissible cumulative placement growth in the second half of 2007 amounts to 3.0%. The rate of pur-chase of compulsory CNB bills stayed at 50% of placement growth exceeding the permissible limit and the interest paid by the CNB is equal to the interest paid on the allocated kuna reserve requirement (0.75%). The maturity term of compul-sory CNB bills is 360 days.
The coverage of placements included in the calculation base was also changed prior to adopting the new Decision. Under the former Decision, annual placement growth re-ferred to the sum of on- and off-balance sheet items. Some banks used this to create additional room for placement growth by decreasing their off-balance sheet items, in par-ticular loans based on current account overdrafts. Hence, as of early June 2007, on- and off-balance sheet items have been monitored separately: one base comprises placement growth and the other includes the rise in guarantees, letters of credit, bills of exchange and other off-balance sheet as-sets. This separation of bases provides for better monitoring of placement growth based on the increase in on- and off-balance sheet assets, which should in the final run contrib-ute to the attainment of set monetary policy objectives.
Despite a 12% limit, it should be noted that a high start-ing level of placements also implies a relatively high abso-lute increase that does not entail the purchase of CNB bills. The permissible 2007 placement growth amounts to around HRK 22bn and is, apart from the record year of 2006, one of the largest annual placement growths. It also provides a more than sufficient base for continued dynamic economic growth that is sustainable in the long run.
2
3
4
5
6
7
10
9
1
8
Figure 47
CNB s INTERNATIONAL RESERVES’at current rate of exchange
International reserves Net usable international reservesa
aNU R = international reserves – foreign liabilities – CNB bills in f/c reserverequirements in f/c .
I –– government foreign currency deposits Source: CNB.
bill
ion
EU
R
1/0
1
5/0
1
9/0
1
1/0
2
5/0
2
9/0
2
1/0
3
5/0
3
9/0
3
1/0
4
5/0
4
9/0
4
1/0
5
5/0
5
9/0
5
1/0
6
5/0
6
9/0
6
1/0
7
5/0
7
9/0
7
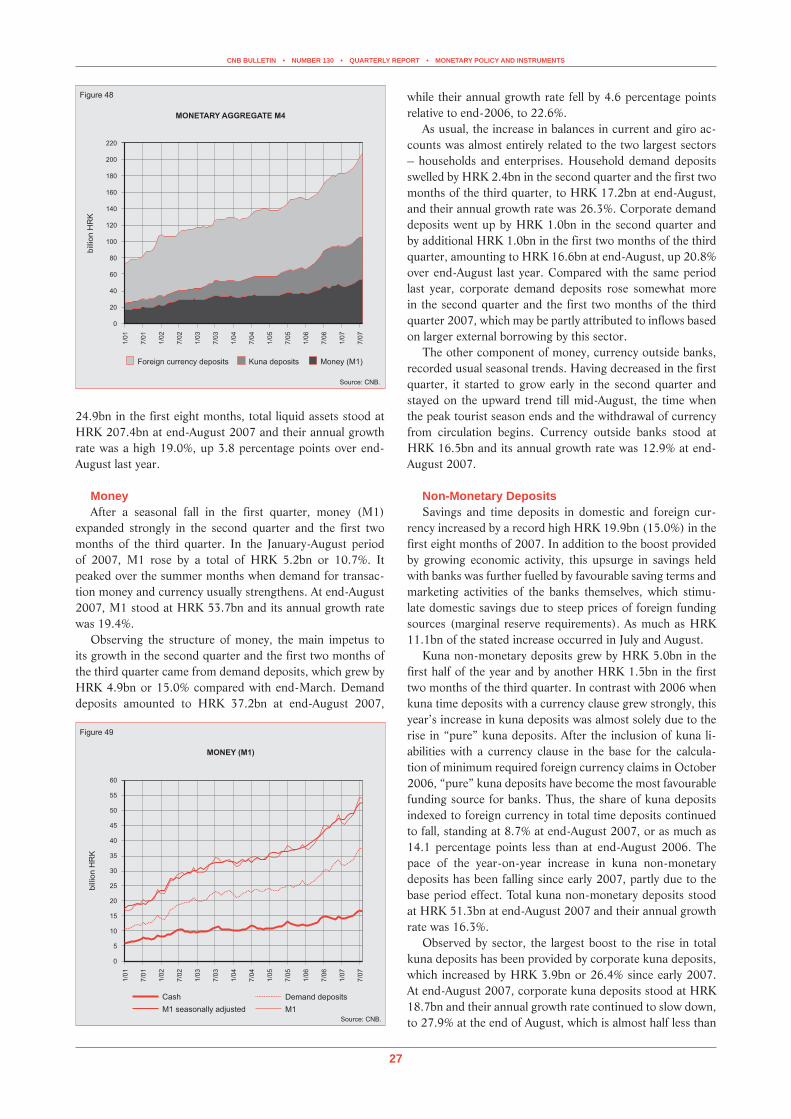
CNB BULLETIN • NUMBER 130 • QUARTERLY REPORT • MONETARY POLICY AND INSTRUMENTS
27
24.9bn in the first eight months, total liquid assets stood at HRK 207.4bn at end-August 2007 and their annual growth rate was a high 19.0%, up 3.8 percentage points over end-August last year.
MoneyAfter a seasonal fall in the first quarter, money (M1)
expanded strongly in the second quarter and the first two months of the third quarter. In the January-August period of 2007, M1 rose by a total of HRK 5.2bn or 10.7%. It peaked over the summer months when demand for transac-tion money and currency usually strengthens. At end-August 2007, M1 stood at HRK 53.7bn and its annual growth rate was 19.4%.
Observing the structure of money, the main impetus to its growth in the second quarter and the first two months of the third quarter came from demand deposits, which grew by HRK 4.9bn or 15.0% compared with end-March. Demand deposits amounted to HRK 37.2bn at end-August 2007,
while their annual growth rate fell by 4.6 percentage points relative to end-2006, to 22.6%.
As usual, the increase in balances in current and giro ac-counts was almost entirely related to the two largest sectors – households and enterprises. Household demand deposits swelled by HRK 2.4bn in the second quarter and the first two months of the third quarter, to HRK 17.2bn at end-August, and their annual growth rate was 26.3%. Corporate demand deposits went up by HRK 1.0bn in the second quarter and by additional HRK 1.0bn in the first two months of the third quarter, amounting to HRK 16.6bn at end-August, up 20.8% over end-August last year. Compared with the same period last year, corporate demand deposits rose somewhat more in the second quarter and the first two months of the third quarter 2007, which may be partly attributed to inflows based on larger external borrowing by this sector.
The other component of money, currency outside banks, recorded usual seasonal trends. Having decreased in the first quarter, it started to grow early in the second quarter and stayed on the upward trend till mid-August, the time when the peak tourist season ends and the withdrawal of currency from circulation begins. Currency outside banks stood at HRK 16.5bn and its annual growth rate was 12.9% at end-August 2007.
Non-Monetary DepositsSavings and time deposits in domestic and foreign cur-
rency increased by a record high HRK 19.9bn (15.0%) in the first eight months of 2007. In addition to the boost provided by growing economic activity, this upsurge in savings held with banks was further fuelled by favourable saving terms and marketing activities of the banks themselves, which stimu-late domestic savings due to steep prices of foreign funding sources (marginal reserve requirements). As much as HRK 11.1bn of the stated increase occurred in July and August.
Kuna non-monetary deposits grew by HRK 5.0bn in the first half of the year and by another HRK 1.5bn in the first two months of the third quarter. In contrast with 2006 when kuna time deposits with a currency clause grew strongly, this year’s increase in kuna deposits was almost solely due to the rise in “pure” kuna deposits. After the inclusion of kuna li-abilities with a currency clause in the base for the calcula-tion of minimum required foreign currency claims in October 2006, “pure” kuna deposits have become the most favourable funding source for banks. Thus, the share of kuna deposits indexed to foreign currency in total time deposits continued to fall, standing at 8.7% at end-August 2007, or as much as 14.1 percentage points less than at end-August 2006. The pace of the year-on-year increase in kuna non-monetary deposits has been falling since early 2007, partly due to the base period effect. Total kuna non-monetary deposits stood at HRK 51.3bn at end-August 2007 and their annual growth rate was 16.3%.
Observed by sector, the largest boost to the rise in total kuna deposits has been provided by corporate kuna deposits, which increased by HRK 3.9bn or 26.4% since early 2007. At end-August 2007, corporate kuna deposits stood at HRK 18.7bn and their annual growth rate continued to slow down, to 27.9% at the end of August, which is almost half less than
0
20
40
60
80
100
120
140
220
200
180
160
Foreign currency deposits Kuna deposits Money (M1)
Figure 48
MONETARY AGGREGATE M4
Source: CNB.
bill
ion
HR
K
1/0
1
7/0
1
1/0
2
7/0
2
1/0
3
7/0
3
1/0
4
7/0
4
1/0
5
7/0
5
1/0
6
7/0
6
1/0
7
7/0
7
0
5
10
15
20
25
30
35
40
45
50
55
60
Figure 49
MONEY (M1)
bill
ion
HR
K
Source: CNB.
M1M1 seasonally adjusted
Demand depositsCash
1/0
1
7/0
1
1/0
2
7/0
2
1/0
3
7/0
3
1/0
4
7/0
4
1/0
5
7/0
5
1/0
6
7/0
6
1/0
7
7/0
7

CNB BULLETIN • NUMBER 130 • QUARTERLY REPORT • MONETARY POLICY AND INSTRUMENTS
28
at end-August last year. Other banking and non-banking fi-nancial institutions also recorded strong growth in kuna de-posits (totalling HRK 3.1bn since the beginning of 2007). This reflects good liquidity of the funds, which temporarily place surplus assets into their accounts with banks. On the other hand, since the amendments to the Decision on the minimum required amount of foreign currency claims banks no longer encourage kuna savings with a currency clause, so that households again turn to foreign currency savings. A slight falling trend in household kuna deposits, which be-gan last September, has continued into 2007. At end-August 2007, total kuna non-monetary deposits of the household sector stood at HRK 22.3bn, down 4.6% over end-August 2006.
In the first eight months of 2007, foreign currency depos-its recorded the sharpest increase among all monetary ag-gregates, of as much as HRK 13.5bn or 15.3%. They grew the most in July and August (by HRK 3.9bn and HRK 5.8bn respectively) owing to seasonal foreign currency inflows
from tourism, which were this year larger than usual. At end-August 2007, total foreign currency deposits exceeded HRK 101.7bn and their annual growth rate, partly due to the base period effect, rose sharply – to 21.6%.
Foreign currency deposits of all domestic sectors have been rising since early 2007. Growing by HRK 6.9bn, foreign currency deposits of the most important sector, i.e. house-holds, amounted to HRK 81.7bn at end-August 2007 and their annual growth rate was 14.6%. The rest of the increase in foreign currency deposits was accounted for by corporate deposits (HRK 4.0bn), which stood at HRK 15.6bn at end-August, as much as 44.1% up over the end of August 2006. At the same time, foreign currency deposits of other bank-ing and non-banking financial institutions went up by HRK 2.6bn.
PlacementsThe first eight months of 2007 were marked by slacker
growth in bank placements to the non-banking sector follow-ing the introduction of the Decision on the purchase of com-pulsory CNB bills late in 2006. Placement growth was even slower in July and August following the tightening of the said Decision and introduction of a 0.5% monthly limit on place-ment growth that does not entail the purchase of compulsory CNB bills (for more details on amendments to the measure on the purchase of compulsory CNB bills, see Box 3). Bank placements to the non-banking sector rose by 9.3% (10.3% excluding the exchange rate effect) in the first eight months of 2007, while they increased by 13.2% (14.5% excluding the exchange rate effect) in the same period last year. Such developments reflected on their annual growth rate, which stood at 18.7% at end-August 2007, down 4.2 percentage points over end-2006. Growing by HRK 17.0bn in absolute terms in 2007, bank placements to the non-banking sector reached HRK 200.4bn at end-August.
Banks strove to somewhat subdue the impact of the stricter Decision on the purchase of compulsory CNB bills by de-creasing their placements to the corporate sector. In July and August alone, corporate placements fell by HRK 2.2bn or
%
0
5
10
15
20
25
35
30
40
45
Source: CNB.
Figure 50
SHARE OF KUNA TIME DEPOSITSIN TOTAL TIME DEPOSITS
Kuna time deposits with a currency clause
Kuna time deposits without a currency clause
12
/04
6/0
5
12
/05
6/0
6
8/0
6
10
/06
12
/06
2/0
7
4/0
7
6/0
7
8/0
7
%
0
10
20
30
50
80
70
40
60
M1 M4M0
Source: CNB.
Figure 51
MONETARY AGGREGATESyear-on-year rate of change
1/0
1
7/0
1
1/0
2
7/0
2
1/0
3
7/0
3
1/0
4
7/0
4
1/0
5
7/0
5
1/0
6
7/0
6
1/0
7
7/0
7
%
0
20
40
60
80
100
220
200
180
160
35
0
5
10
15
20
25
30
120
140
Source: CNB.
Year-on-year rate of change – right
Placements – left
Figure 52
BANKS’ PLACEMENTS TO NON-BANKING SECTORTHE
bill
ion
HR
K
3/0
1
9/0
1
3/0
2
9/0
2
3/0
3
9/0
3
3/0
4
9/0
4
3/0
5
9/0
5
3/0
6
9/0
6
3/0
7

CNB BULLETIN • NUMBER 130 • QUARTERLY REPORT • MONETARY POLICY AND INSTRUMENTS
29
2.5% and their growth rate was 6.4% in the first eight months of 2007, which is almost twice lower than in the same period last year. At the same time, corporate borrowing abroad in-creased, which may be related to the fact that banks encour-age some of their clients to raise funds abroad so as to avoid excessive domestic placement growth. At end-August, bank placements to the corporate sector stood at HRK 88.7bn and their annual growth rate went down from 24.4% at end-2006 to 17.0%.
In contrast, the slowdown in household loan growth was less pronounced. The rise in household loans was 12.5% in the first eight months of 2007, down 1.5 percentage points compared with the same period last year. Growing by HRK 4.9bn and HRK 4.0bn in the first and second quarters re-spectively, and by another HRK 3.1bn in the first two months of the third quarter, total household loans amounted to HRK 107.7bn and their annual growth rate dropped by 1.6 per-centage points, to 20.2% at end-August.
Within the structure of household loans, housing loans still grow fastest, although their growth pace declined somewhat relative to last year. Their annual growth rate went down from 35.5% in August 2006 to 27.1% at end-August 2007. Growing by HRK 5.9bn in absolute terms since the begin-ning of 2007, housing loans reached HRK 42.9bn, account-ing for 39.8% of total household loans. Other all-purpose loans, which account for the largest share in total household loans (44.1%), have continued to grow at their 2006 pace. They stood at HRK 47.5bn and their annual growth rate was 19.0% at end-August 2007.
Bank Placements to the Central GovernmentBank placements to the central government recorded a
major upturn early in the third quarter of 2007. Growing by HRK 1.2bn in the first half of the year, bank placements to the government rose by another HRK 2.9bn in July and Au-gust, primarily due to the short-term foreign currency loan of EUR 244.5m, which a group of domestic banks granted to the government for the repayment of due foreign liabilities. The rest of the 2007 increase related to banks’ claims based
on subscribed MoF T-bills (a total increase of HRK 1.1bn) and claims based on subscribed bonds (an increase of HRK 0.7bn). Total bank placements to the central government stood at HRK 32.1bn at end-August 2007, up 2.8% over the same month last year.
Following a downturn of HRK 0.3bn in the first quarter of 2007, central government deposits rose by HRK 2.4bn in the second quarter and dropped by HRK 0.4bn in the first two months of the third quarter. With the described devel-opments in placements and deposits, banks’ net claims on the central government went up by HRK 2.4bn in 2007, to HRK 19.4bn at end-August. Still, compared with the same month last year, net bank placements to the central govern-ment dipped by 8.0%, which is due to the effect of a high base period value.
Foreign Assets and LiabilitiesA large inflow of domestic deposits over the summer
months and significant recapitalisation amounts recorded in July and August (HRK 2.6bn) allowed the banks to reduce their foreign liabilities much more than expected this year. Foreign liabilities of banks decreased by HRK 4.5bn in the second quarter and by another HRK 10.3bn in the first two months of the third quarter, with the total reduction amount-ing to as much as HRK 13.9bn in 2007. At end-August 2007, banks’ foreign liabilities stood at HRK 62.2bn, down 6.6% over end-August 2006.
Notwithstanding a substantial increase in August (of HRK 2.5bn), banks’ foreign assets also recorded a downturn in the first eight months of 2007 compared with end-2006 (of HRK 0.8bn or 2.0%). The fall in foreign liabilities, specifically the decrease in foreign currency liabilities, enabled the banks to attain the minimum required foreign currency liquidity despite the decrease in their foreign assets. At end-August 2007, banks’ foreign assets stood at HRK 38.8bn and their annual growth rate was a high 35.4%, which is mostly due to the effect of a low base period value.
Recorded developments in banks’ foreign assets and li-abilities improved the total external position of banks by HRK
%
0
5
10
15
20
25
30
35
40
45
50
Figure 53
BANKS’ LOANSyear-on-year rate of change
Source: CNB.Household loans
Corporate loansTotal
1/0
1
7/0
1
1/0
2
7/0
2
1/0
3
7/0
3
1/0
4
7/0
4
1/0
5
7/0
5
1/0
6
7/0
6
1/0
7
7/0
7
% %
–10
0
10
20
30
40
50
–100
–50
0
50
100
150
200
Figure 54CLAIMS ON PRIVATE SECTOR, TOTAL
LIQUID ASSETS AND NET FOREIGN ASSETSreal relative to the same month
of the previous year, 2001 = 100rate of change
Net foreign assets – right
Claims on private sector
Total liquid assets
Source: CNB.
1/0
1
7/0
1
1/0
2
7/0
2
1/0
3
7/0
3
1/0
4
7/0
4
1/0
5
7/0
5
1/0
6
7/0
6
1/0
7
7/0
7

CNB BULLETIN • NUMBER 130 • QUARTERLY REPORT • MONEY MARKET
30
13.1bn relative to the end of 2006. At end-August 2007, net foreign assets (NFA) of banks stood at HRK –23.4bn, which is as much as 38.3% less than at end-August 2006.
Money MarketFollowing a long period of maintaining relatively low and
stable levels, money market interest rates went up at the end of the second quarter and in the third quarter of 2007. The weighted interest rates on one-year T-bills rose from 3.5% in the second quarter to 4.5% in July and August. Interest rates on overnight loans in direct interbank trading gradually grew from some 2% to 4%, while late in the second quar-ter we witnessed an unusual rise in their level and fluctua-tion. Since liquidity of the banking sector remained good, according to the available data, such movements may partly be explained by the uncharacteristic imbalance between sup-ply and demand in the money market, where a small group of banks accounts for the substantial share of the kuna demand, while market participants with excess funds are not willing to place them at current prices. Continued strong kuna lend-ing, preparations for the subscription of the second tranche of the ten-year government bond in July 2007, worth HRK 3.0bn, paired with preparations for the payment of the third tranche of government debt to pensioners and high level of currency outside banks due to the start of the peak tourist season contributed to higher-than-usual liquidity stocks. The central bank contributed to good aggregate liquidity of the banking sector by conducting thirteen reverse repo auctions, with average placements per auction totalling HRK 3.7bn, HRK 2.1bn more than in the previous quarter. Money mar-ket interest rates reduced in July and August, but continued fluctuating. The CNB conducted this year’s first two foreign exchange auctions in July, creating HRK 1.0bn, while up to that moment the highest amounts of demanded and placed funds were seen at reverse repo auctions in July and August 2007. Several Lombard loans were also approved during the period. All this indicates that the cause for the rise in interest rate fluctuation is probably to be sought in the still shallow money market which cannot absorb higher inflows or out-flows in short periods of time without substantial interest rate changes.
Interest rates on short-term household loans not indexed to foreign currency continued growing in the second quar-ter of 2007. At the same time, following a short period of growth in the first quarter, interest rates on long-term house-hold loans indexed to foreign currency again declined in the second quarter. Interest rates on short-term corporate loans not indexed to foreign currency went up after a short period of decline, while interest rates on long-term corporate loans indexed to foreign currency followed the downward trend started in the previous quarter after having grown almost throughout the entire 2006. In the second quarter of 2007, the noticeable growth of bank interest rates on time depos-its not indexed to foreign currency continued, while interest rates on foreign currency deposits also went up but at milder rates. Interest rates on sight deposits did not change much. These interest rate trends were for the most part a result of
expected adjustment of banks to CNB’s measures and of the rise in European interest rates.
Money Market Interest Rates
In the second quarter of 2007, banks were financing their primary liquidity using money market secondary liquidity sources to an average daily amount of HRK 2.5bn (a total of HRK 149.2bn for the quarter), which is HRK 1bn more than in the first quarter of 2007 and also HRK 1.2bn more than in the same period last year. This means that banks’ financing on the money market was HRK 55.9bn higher than in the previous quarter, which was mainly due to the rise in trading in reserve money of close to HRK 32bn. Turnovers in other money market segments remained mostly unchanged. The lion’s share of the HRK 149.2bn worth of loans banks received on the money market, was, as usual, made up of demand deposit loans (HRK 136bn), while the purchase of repo agreements and sale of securities accounted for about HRK 9.9bn and HRK 3.2bn respectively. Of the HRK 136bn in demand deposit loans, some HRK 70bn was accounted for by loans received from banks, HRK 38bn were loans received from other financial institutions and HRK 28bn were loans received from other legal persons.
The increase in the total amount of loans received by banks on the money market and turnover in trading in re-serve money contributed to further rise of interest rates in interbank trading (in reserve money) in the second quarter of 2007. Interbank trading was dominated by direct inter-bank trading, which generated a quarterly turnover of HRK 64.8bn, while turnover in interbank trading intermediated by the ZMM was HRK 4.8bn, which represents a further reduc-tion in the significance of this market segment. This is why the increase in the price of money on the money market in the second quarter of 2007 was primarily caused by the consid-erable rise in weighted interest rates in direct interbank trad-ing in demand deposits, which went up from 1.82 percentage points to 1.72 percentage points.
Direct interbank trading in reserve money generated a
%
1 2 3 4 5 6 7 8 9 10
YIELD CURVES OF KUNA T-BILLS ANDGOVERNMENT BONDS ON THREE DATES
Figure 55
Sources: CNB and ZSE.
5.5
2.5
3.0
3.5
4.0
4.5
5.0
years to maturity
18
2-d
ay
–T-b
ill3
64
-da
y–
T-b
illR
HM
F-
-O-0
85
A
RH
MF
--O
-10
3A
RH
MF
--O
-13
7A
RH
MF
--O
-15
CA
31/12/200630/6/2007 31/3/2007
RH
MF
-O-
17
2A

CNB BULLETIN • NUMBER 130 • QUARTERLY REPORT • MONEY MARKET
31
turnover of HRK 64.8bn in the second quarter of 2007, of which HRK 46.9bn was accounted for by the most liquid in-strument, overnight loans. The average daily turnover in these steadily trended upwards during this quarter, rising from the March HRK 327m to the June HRK 1,042m. However, by August it again declined to HRK 830m. The weighted inter-est rate followed a similar pattern: it increased from 3.32% in March to 5.98% in June and then declined to 3.71% in Au-gust. A monthly breakdown shows that both the turnover in overnight loans in direct interbank trading and their interest rates trended upwards since December 2006. The average daily turnover in overnight loans intermediated by the ZMM mildly reduced during the observed period, from HRK 84.7m in March to HRK 82.5m in June, while in August it rose to HRK 156.6m. The weighted interest rate on these loans went up from 2.68% in March to 5.08% in June, declining again in August to 2.84%. These weighted interest rate trends were to the largest extent due to changes in the price of money in direct interbank trading, and only to a small extent to the re-
lationship between the supply and demand for smaller over-night loans that are most often traded in this segment of the interbank market.
In the second quarter 2007, the Ministry of Finance held six T-bill auctions. The amount of received subscription bids was HRK 4.15bn smaller than in the previous quarter, amounting to HRK 3.8bn. Slightly over 60% of received bids were accepted, leading to the subscription HRK 2.4bn worth of T-bills, HRK 100m less than initially planned.
Interest rates on MoF auctions of T-bills in the second quarter of 2007 did not follow the movements of money market interest rates. The weighted interest rates on 91 and 182-day T-bills declined in June compared with March, from 3.07% and 3.30% to 3.0% and 3.20% respectively, while at the same time the weighted interest rate on T-bills with longest maturity of 364 days went up mildly from 3.50% to 3.54%. By August 2007, the weighted interest rates on T-bill auctions went up for T-bills of all maturities, with the interest rate on 364-day T-bills rising the most, by slightly less than
0
20
40
60
80
100
120
140
160
Figure 56MONEY MARKET TURNOVER
quarterly data
Source: CNB.
bill
ion
HR
K
Banks’ financing on the money market
Trade in demand deposits
Trading in reserve moneyDirect trading in reserve money
Direct trading in reserve money – overnight loans
Q4
/02
Q1
/03
Q2
/03
Q3
/03
Q4
/03
Q1
/04
Q2
/04
Q3
/04
Q4
/04
Q1
/05
Q2
/05
Q3
/05
Q4
/05
Q1
/06
Q2
/06
Q3
/06
Q4
/06
Q1
/07
Q/0
72
%
0
1
2
3
4
5
6
7
8
9
10
Figure 57
INTEREST RATES IN DIRECT INTERBANKTRADING AND FREE RESERVES
monthly average on the basis of daily data
Source: CNB.
mill
ion
HR
K
Free reserves – rightOvernight loans
Loans maturing in 1 month
9/0
2
12
/02
3/0
3
6/0
3
9/0
3
12
/03
3/0
4
6/0
4
9/0
4
12
/04
3/0
5
6/0
5
9/0
5
12
/05
3/0
6
6/0
6
9/0
6
12
/06
3/0
7
6/0
7
0.0
0.2
0.4
0.6
0.8
1.0
1.2
1.4
1.6
1.8
%
0
1
2
3
4
5
6
7
8
9
10
Figure 58
DIRECT INTERBANK TRAD IN OVERNIGHT LOANSINGmonthly average on the basis of daily data
Source: CNB.m
illio
nH
RK
9/0
2
12
/02
3/0
3
6/0
3
9/0
3
12
/03
3/0
4
6/0
4
9/0
4
12
/04
3/0
5
6/0
5
9/0
5
12
/05
3/0
6
6/0
6
9/0
6
12
/06
3/0
7
6/0
7
Average daily turnover – right
Weighted average interest rate
0.0
0.2
0.4
0.6
0.8
1.0
1.2
%
0
1
2
3
4
5
6
7
8
9
10
Figure 59
Sources: MoF CNB.and
1 MM
INTEREST RATES ON T-BILLSAND IN DIRECT INTERBANK TRADING
91-day – T-bill 364-day – T-bill
182-day – T-bill
9/0
2
12/0
2
3/0
3
6/0
3
9/0
3
12/0
3
3/0
4
6/0
4
9/0
4
12/0
4
3/0
5
6/0
5
9/0
5
12/0
5
3/0
6
6/0
6
9/0
6
12/0
6
3/0
7
6/0
7

CNB BULLETIN • NUMBER 130 • QUARTERLY REPORT • MONEY MARKET
32
one percentage point, to 4.45%. These movements on the primary T-bill market widened the negative spread between interest rates on these bills and interest rates in trading in reserve money. The negative spread between the weighted monthly interest on MoF auctions of 364-day T-bills and the weighted interest rate on loans due in less than one month (in direct interbank trading in reserve money) increased gradu-ally from 0.55 in March to 2.45 percentage points in June.
The stock of subscribed MoF T-bills declined from HRK 13.2bn at the end of March to HRK 12.6bn at the end of June (HRK 12bn at the end of August). In the structure of subscribed T-bills, one-year bills continued to account for the lion’s share which stood at 94.2% at the end of the second quarter, up 1 percentage point on the previous quarter. Next to follow were 182-day T-bills with a share of 4.8%, while the share of T-bills with the shortest maturity amounted to 1%. In August 2007, the share of 364-day T-bills grew even more to a high 95.9%, while T-bills with maturity of 91 and 182 days accounted for 0.78% and 3.3% of the total.
Banks’ Interest Rates
Banks’ interest rates on both short-term corporate and household loans not indexed to foreign currency went up. The weighted interest rate on short-term kuna corporate loans not indexed to foreign currency grew from 6.68% in March to 7.03% in June and 7.12% in August, while the weighted interest rate on short-term household loans not indexed to foreign currency, which went up from 12.14% in March to 12.29% in June, declined to 12.16% in August. This was pri-marily a result of the rise in the share of overdrafts, com-monly the most expensive loans, whose interest rate did not change much in the second quarter as well as of the sizeable rise in the interest rate on other short-term household loans, which went up from 7.38% to 8.47%.
The weighted interest rate on long-term corporate loans indexed to foreign currency mildly declined compared to the previous quarter. In March, it stood at 6.03%, while in June it decreased to 5.81%. By August it grew to 6.28%. The weight-
ed interest rate on long-term household loans indexed to for-eign currency went down from 6.44% in March to 5.97% in June, to go up to 6.46% in August.
The weighted interest rate on kuna time deposits not indexed to foreign currency continued rising in the second quarter. In March, it stood at 3.49%, rising to 4.55% in June and 4.95% in July, its highest level since October 2004. How-ever, in August it went down to 4.25%. This increase was a consequence of banks adjusting to CNB’s measures from late 2006, making these deposits the cheapest source of bank funds in terms of regulatory costs. The weighted interest rate on foreign currency time deposits also grew further, primarily due to the rise of interest rates in the eurozone, from 3.86% in March to 4.05% in June and 4.16% in August. The weight-ed interest rate on kuna savings deposits slightly narrowed to 0.42%, that is, to 0.38% in August, while the weighted interest rate on foreign currency sight deposits remained un-changed at 0.26%.
As compared to the previous periods, the spreads between
4
%
6
8
10
12
14
16
18
20
Short-term household loans
Short-term corporate loans
Source: CNB.
Figure 60
BANKS’ AVERAGE INTEREST RATES ON SHORT-TERMLOANS WITHOUT A CURRENCY CLAUSE
a
aThe average weighted interest rate on newly granted loans in the reporting month.
1/0
1
7/0
1
1/0
2
7/0
2
1/0
3
7/0
3
1/0
4
7/0
4
1/0
5
7/0
5
1/0
6
7/0
6
1/0
7
7/0
7
%
0
2
4
6
8
10
12
Figure 61
BANKS’ AVERAGE INTEREST RATES ON LONG-TERMLOANS WITH A CURRENCY CLAUSE
a
Long-term household loans
Long-term corporate loans
Source: CNB.
12-month EURIBORaThe average weighted interest rate on newly granted loans in the reporting month.
1/0
2
7/0
2
1/0
3
7/0
3
1/0
4
7/0
4
1/0
5
7/0
5
1/0
6
7/0
6
1/0
7
7/0
7
%
0
1
2
3
4
5
6
7
Figure 62
BANKS’ AVERAGE DEPOSIT INTEREST RATESb
Source: CNB.
Kuna time depositsa
Foreign currency time deposits
Kuna sight depositsa
Foreign currency sight deposits
1-month EURIBOR
1/0
2
7/0
2
1/0
3
7/0
3
1/0
4
7/0
4
1/0
5
7/0
5
1/0
6
7/0
6
1/0
7
7/0
7a
Without a currency clause.b
The average weighted interest rate on newly received deposits in the reporting month.

CNB BULLETIN • NUMBER 130 • QUARTERLY REPORT • CAPITAL MARKET
33
lending and deposits rates mostly narrowed in the second quarter of 2007, while in August they widened mildly. The spread between the weighted interest rate on total loans and that on total deposits went up from 5.91 percentage points in March to 6.02 percentage points in June and up to 6.16 percentage points in August. Despite this rise it still remained at its lowest recorded level since the introduction of the new interest rate reporting methodology in January 2002. The spread between the weighted interest rate on kuna loans not indexed to foreign currency and the weighted interest on kuna deposits not indexed to foreign currency narrowed from 6.95 percentage points in March to 6.88 percentage points in June, to rise again to 7.09 percentage points in August. The spread between the weighted interest rate on kuna loans indexed to foreign currency and the weighted interest rate on foreign currency deposits dropped from 3.29 percentage points in March to 2.90 percentage points in June, but wid-ened to 3.13 percentage points in August.
The mentioned decrease in the weighted nominal interest
rate on long-term corporate loans indexed to foreign curren-cy in the second quarter 2007 did not affect the movements of the weighted interest rate on all long-term kuna corporate loans (with or without a currency clause) in Croatia, which rose and continued rising through July and August. Its rise, moderated by the parallel increase in the inflation rate, re-sulted in a mild increase in the real interest rate on long-term corporate loans in the second quarter of 2007. In the same period this interest rate rose in the EMU, Poland, Hungary and Slovakia. As regards the EMU and Poland, these trends were due to the rise in nominal interest rates on long-term corporate loans accompanied by stable inflation rate, while in Hungary they resulted from the decline in the inflation rate. In Slovakia they were a result of the concurrent rise in nomi-nal interest rates and a decline in the inflation rate. Due to faster growth of the inflation rate than the rise in nominal interest rates, real interest rates on long-term corporate loans declined in the Czech Republic.
Due to the parallel increase in the inflation rate and the nominal interest rate on household deposits, in Croatia the real interest rate on household deposits went up only mildly in the first quarter 2007. They rose also in the EMU, Hun-gary and Slovakia. Real interest rates on household deposits in other observed countries declined, mainly because of the inflation rate rise.
Capital MarketPositive developments in the capital market observed in the
first quarter of 2007 largely continued in the second quarter, which was marked by continued rise in the prices of most shares and a record value of the domestic stock exchange index as well as by the record quarterly share turnover.
CROBEX value reached its record high in mid-May 2007, reducing again in June due to the negative influence of the several factors on share prices. They were the sting opera-tion by the State Attorney’s Office leading to the arrest of several officials of the Croatian Privatisation Fund, the in-
%
2
4
6
8
10
12
14
Figure 63
SPREAD BETWEEN BANKS’ AVERAGEINTEREST RATES ON LOANS AND DEPOSITS
Kuna loans – kuna depositsa a
Kuna loans – foreigncurrency deposits
b
Total loans – total deposits
aWithout a currency clause With a currency clause. .
bSource: CNB.
1/0
2
7/0
2
1/0
3
7/0
3
1/0
4
7/0
4
1/0
5
7/0
5
1/0
6
7/0
6
1/0
7
7/0
7
%
0
2
4
6
8
Figure 64
REAL INTEREST RATES ON LONG-TERMCORPORATE LOANS IN SELECTED COUNTRIES
EMU Czech R. Poland Hungary Slovak R. Croatia
Sources: Central banks' bulletins and CNB.
Note: Due to the differences between some countries'statistical coverage interest rates cannot be directlycompared, but their development can be analy ed.s
9/06 12/06 3/07 6/07
–4
–2
0
2
%
4
Figure 65
REAL INTEREST RATES ON SHORT-TERMHOUSEHOLD DEPOSITS IN SELECTED COUNTRIES
EMU Czech R. Poland Hungary Slovak R. Croatia
Sources: Central banks' bulletins and CNB.
Note: Due to the differences between some countries'statistical coverage interest rates cannot be directlycompared, but their development can be analy ed.s
9/06 12/06 3/07 6/07

CNB BULLETIN • NUMBER 130 • QUARTERLY REPORT • CAPITAL MARKET
34
security surrounding the planned further privatisations and possible revision of the already completed ones as well as the start of Magma’s IPO. Negative developments in the world’s equity market also contributed to the decline in the value of the index, but their influence was much weaker. Magma’s initial public offering which lasted from the end of June to the middle of July, prompted some investors to raise the required funds by selling off their existing portfolios, which caused many share prices, especially those of highly liquid shares, to fall. This IPO attracted numerous small investors, who pre-viously did not participate in the capital market, which was to a great extent a result of the success of Ina’s IPO. After recovering in July, in the middle of August CROBEX value started declining again, which had to do primarily with in-vestors preparing for the second stage of the privatisation of the T-HT through an initial public offering in the middle of September. The crisis in the world’s financial markets caused by problems with subprime mortgage loans in the US did not significantly affect the domestic capital market.
In April 2007, the Central Depository Agency additionally contributed to the transparency of the domestic capital mar-ket by publishing data on the ownership structure and top ten accounts per security quoted on the stock exchange on daily basis instead of weekly. The new trading system of the Zagreb Stock Exchange is also expected to become operational soon, enabling larger transaction volumes and financial derivatives trading. Market makers in the equity market which are about to start operating in the domestic capital market are also ex-pected to contribute to its better liquidity and transparency, reducing the volatility of share prices which is characteristic of the domestic market.
Following an exceptionally dynamic first quarter, which registered the largest bond turnover, the domestic debt secu-rities market was much less eventful in the second quarter of 2007. Reasons for this are probably to be found in the fact that investors took time to prepare for the second tranche of the kuna government bond in July 2007 as well as that there was only one corporate bond issue and the issue of one tranche of a municipal bond. This latest government borrow-ing was the reason why bond turnover in the domestic market grew more intensive again in July and August.
Stock exchange indices grew and share trading intensified also on other Central and Eastern European markets in the
second quarter of 2007. Until end-June, compared with the end of the first quarter, the Ljubljana Stock Exchange in-dex grew the most (37.3%), followed by the Budapest Stock Exchange index which, increasing by 23.5% on the end of March 2007, recovered from a fall early in the year. In the same period, the Warsaw Stock Exchange index increased by 14.9%, while the Zagreb Stock Exchange index went up at a slightly lower rate of 14.1%. The Prague Stock Exchange index also went up (8.6%), while the only index whose value declined in the second quarter was the Bratislava Stock Ex-change index, which went down by 2.0%, and was the only one among the selected stock exchange indices that ended the first half of the year in negative territory compared to the end of the previous year.
Market capitalisation of shares moved in line with the movement of stock exchange indices, so at the end of June 2007 it exceeded March results at all selected stock exchanges apart from the Bratislava Stock Exchange. However, market capitalisation of bonds went up only at the Bratislava Stock Exchange, declining at all other stock exchanges in question. According to the market capitalisation of shares to GDP, the Zagreb Stock Exchange was ahead of all other selected stock exchanges in the second quarter of 2007. In June, compared
50
100
150
200
250
300
350
450
400
Source : Bloomberg, BSSE, BSE, PSE, LJSE, WSE and ZSE.s
Bratislava – SAX
Budapest – BUX
Ljubljana – SBI20
Prague – PX-50
Warsaw – WIG
Zagreb – CROBEX
Figure 66
SELECTED STOCK EXCHANGE INDICESend of period, December 2001 = 100
3/0
4
6/0
4
9/0
4
12
/04
3/0
5
6/0
5
9/0
5
12
/05
3/0
6
6/0
6
9/0
6
12
/06
3/0
7
6/0
7
Table 6: Comparison of Capital Market Indicators
June 2007 Bratislava Budapest Ljubljana Prague Warsaw Zagreb
Average daily turnover, shares (million EUR) 0.0 205.7 8.0 115.6 576.1 13.5
Average daily turnover, bonds (million EUR) 9.8 2.7 0.4 94.6 5.2 14.9
Turnovera/GDPc, annual level (%) 0.0 55.9 6.5 24.9 52.4 10.0
Turnoverb/GDPc, annual level (%) 5.3 0.7 0.3 20.4 0.5 11.0
Turnover velocityd 0.3 138.3 11.4 46.2 n.a. 7.9
Market capitalisationa (million EUR), end month 4,489 37,486 17,622 63,120 n.a. 42,936
Market capitalisationb (million EUR), end month 13,227 37,972 6,055 n.a. n.a. 5.751
Market capitalisationa/GDPc, end month (%) 9.7 40.4 57.4 54.0 n.a. 125.5
Market capitalisationb/GDPc, end month (%) 28.6 41.0 19.7 n.a. n.a. 16.8
Index movement from the beginning of the year (%) –1.4 16.4 65.5 17.0 31.1 50.6
Index movement from the beginning of the month (%) 3.8 8.3 12.3 1.4 4.0 –2.8a Shares. b Bonds. c 2006. d Annualised monthly share turnover × 100/market capitalisation of shares.Sources: Bloomberg and reports from BSSE, BSE, PSE, LJSE, WSE and ZSE.

CNB BULLETIN • NUMBER 130 • QUARTERLY REPORT • CAPITAL MARKET
35
to March, share turnover was higher at all observed stock ex-changes, with the exception of the Bratislava Stock Exchange and the Prague Stock Exchange. Bond turnover went up as well, declining only at the Zagreb Stock Exchange and the Bratislava Stock Exchange.
Equity Securities Market
In the second quarter of 2007, share turnover19 on the Croatian capital market reached an all time high of HRK 6.1bn, up HRK 1.3bn over the previous quarter and HRK 1.7bn over the same period in 2006. The most traded share in the second quarter was that of Adris Group d.d. which ac-counted for 6.5% of the total share turnover, followed by Ina (5.9%) and Ericsson Nikola Tesla d.d. (5.1%). In July and August, trade was dominated by Ina, whose share made up 8.5% of the total monthly share turnover, Dalekovod (5.1%) and Ericsson Nikola Tesla d.d. which took up the third place (4.7%).
Strong growth of the Zagreb Stock Exchange index, CROBEX,20 which started in the first quarter 2007, contin-ued in the second quarter of the year, pushing its value up by another 14.1% to 4835 points, up as much as 50.7% on the end of 2006. However, due to developments discussed in the introduction its uninterrupted upward trend was halted,
so its value stood at 4760 at the end of August, down 1.5% on the end of the first half of 2007. Nevertheless, CROBEX exceeded its last year’s value by a healthy 48.3%.
Thanks to the continued strong growth of most share prices, market capitalisation of shares on the Zagreb Stock Exchange went up by 18.6% at the end of the second quarter, compared with the previous quarter, reaching HRK 313.4bn. In addition to the growth of share prices, the rise in share market capitalisation on the Zagreb Stock Exchange was also due to a significant increase in liquidity of some shares.21 Un-til the end of August, share market capitalisation decreased to HRK 308.7bn.
Share prices growth in the second quarter of 2007 re-sulted in further increase in the price to earnings ratio for
19 The data on the total share turnover from January 2002 to February 2007 are the sum of individual shares’ turnovers on the stock exchanges in Varaždin and Zagreb. The data of the unified Zagreb Stock Exchange have been used since March 2007 and the merger of the Varaždin Stock Exchange and the Zagreb Stock Exchange.
20 Since 19 March 2007, the CROBEX has been calculated based on the new methodology including only the amount of market capitalisation actually available for trading, as opposed to the previous CROBEX weighting based on full market capitalisation. In addition, new procedures have been installed providing for the accelerated listing of the most liquid new shares. As a result of these methodological changes and the Varaždin Stock Exchange ceasing its operations, as of 19 March 2007 the CROBEX consisted of thirty shares, seventeen of which were included in the previous index composition, seven were comprised by the Varaždin Stock Exchange index, VIN, five were included after having met the new index inclusion criteria and one share included following the accelerated listing requirements.
500
1500
2500
3500
4500
5500
Figure 76
Source: ZSE.
Share turnover – left CROBEX – right
bill
ion
HR
K
1/0
2
7/0
2
1/0
3
7/0
3
1/0
4
7/0
4
1/0
5
7/0
5
1/0
6
7/0
6
1/0
7
7/0
7
0.0
0.5
1.0
1.5
2.0
2.5
3.0
MONTHLY SHARE TURNOVER
AND END-MONTH CROBEX
ON THE CROATIAN
CAPITAL MARKET
0
5
10
15
20
25
30
Figure 68
CHANGES IN NET ASSETS OF OPEN-ENDINVESTMENT FUNDS WITH PUBLIC OFFERING BY THEIR TYPE
Source: Hanfa.
bill
ion
HR
K
Money Bond Balanced Equity
31
/12
/03
31
/12
/04
31
/12
/05
31
/12
/06
31
/3/0
7
30
/6/0
7
31
/8/0
7
21 The ZSE market capitalisation is calculated including the total market capitalisation of shares traded regularly in the previous three months, half of market capitalisation of shares not traded in the previous month and a quarter of market capitalisation of shares not traded in the previous three months.
5
10
15
20
25
30
40
35
Sources: Bloomberg and RBA.
Figure 69
TRENDS IN PRICE TO EARNINGS RATIOSON SELECTED STOCK EXCHANGES
Croatia – CROEMI Slovenia – SVSM Poland – WIG
Czech R. – PX Bulgaria – SOFIX Romania – BET
3/0
5
6/0
5
9/0
5
12
/05
3/0
6
6/0
6
9/0
6
12
/06
3/0
7
6/0
7

CNB BULLETIN • NUMBER 130 • QUARTERLY REPORT • CAPITAL MARKET
36
the CROEMI,22 which stood at 35.9 at the end of June, up 14.8% on the end of March 2007 and 108.9% on the end of June last year. A long-term upward trend in this ratio was ob-served also at the majority of Central and Eastern European Stock Exchanges, with the exception of the Bucharest Stock Exchange and the Prague Stock Exchange where this ratio narrowed in the period from the end of the first until the end of the second quarter.
Debt Securities Market
The government did not borrow in the domestic market in the second quarter of 2007, so only one new tranche of a municipal bond and one corporate bond were issued since
22 The Croatian Equity Market Index, CROEMI, is a Raiffeisenbank Austria d.d. index, calculated since 20 May 2003 as the only index monitoring share prices prior to the merger of the Varaždin Stock Exchange into the Zagreb Stock Exchange irrespective of the stock exchange of their listing, which was because the constituent shares of the CROBEX and VIN were exclusively listed on either the Zagreb or the Varaždin Stock Exchange. The CROEMI is weighted based on the market capitalisation of shares available for trading, with the maximum weight assigned to a share limited to 15%. As opposed to the CROBEX, for which data on the price to earnings ratio of constituent shares have been compiled since as early as September 2006, such data have been compiled for the CROEMI since June 2004 and they are also comparable, as the CROEMI calculation methodology has not changed, in contrast with the CROBEX calculation methodology.
23 The CNB calculates bond market capitalisation based on the latest price achieved in regular trading and, in converting the kuna exchange rate into the euro equivalent and vice versa, uses the exchange rate valid at the end of the observed month. As the ZSE calculates this indicator applying the weighted average price on the last trading day, irrespective of the turnover and the exchange rate valid on that day, minor discrepancies might be discovered between the amounts of bond market capitalisation stated here and those presented in Table 5.
Table 7: Bond Issues in the Domestic Market, stock as at 31 August 2007
Series Issuer Issue date Maturity Currency Issue nominal value
Nominal interest rate Last pricea Current yield
31/8/2007
RHMF-O-08CA Republic of Croatia 14/12/2001 14/12/2008 EUR 200,000,000 6.875% 102.45 6.711%
RHMF-O-125A Republic of Croatia 23/5/2002 23/5/2012 EUR 500,000,000 6.875% 108.60 6.331%
RHMF-O-085A Republic of Croatia 28/5/2003 28/5/2008 HRK 1,000,000,000 6.125% 101.10 6.058%
RHMF-O-142A Republic of Croatia 10/2/2004 10/2/2014 EUR 650,000,000 5.500% 103.50 5.314%
RHMF-O-19BA Republic of Croatia 29/11/2004 29/11/2019 EUR 200,000,000 5.375% 110.45 4.866%
RHMF-O-103A Republic of Croatia 8/3/2005 8/3/2010 HRK 3,000,000,000 6.750% 106.60 6.332%
RHMF-O-157A Republic of Croatia 14/7/2005 14/7/2015 EUR 350,000,000 4.250% 95.45 4.453%
RHMF-O-15CA Republic of Croatia 15/12/2005 15/12/2015 HRK 5,500,000,000 5.250% 101.15 5.190%
RHMF-O-137A Republic of Croatia 11/7/2006 11/7/2013 HRK 4,000,000,000 4.500% 96.35 4.670%
RHMF-O-172A Republic of Croatia 8/2/2007 8/2/2017 HRK 5,500,000,000 4.750% 96.25 4.935%
GDKC-O-116A City of Koprivnica 29/6/2004 29/6/2011 HRK 60,000,000 6.500% 101.30 6.417%
GDZD-O-119A City of Zadar 1/9/2004 1/9/2011 EUR 18,500,000 5.500% 102.55 5.363%
GDRI-O-167A City of Rijeka 18/7/2006 18/7/2016 EUR 16,383,008 4.125% – –
GDST-O-137A City of Split 24/7/2006 24/7/2013 EUR 8,000,000 4.563% 100.30 4.549%
HBOR-O-112A CBRD 11/2/2004 11/2/2011 EUR 300,000,000 4.875% – –
BLSC-O-091A Belišće d.d. 14/1/2005 14/1/2009 EUR 8,000,000 5.500% 101.60 5.413%
HYBA-O-086A Hypo Alpe-Adria-Bank d.d. 6/6/2003 6/6/2008 HRK 150,000,000 6.500% 102.00 6.373%
BNAI-O-22CA Bina Istra d.d. 15/12/2002 15/12/2022 EUR 210,000,000 8.000% 100.00 8.000%
PLVA-O-115A Pliva d.d. 12/5/2004 12/5/2011 EUR 75,000,000 5.750% 99.50 5.779%
MDKA-O-087A Medika d.d. 11/7/2005 11/7/2008 EUR 16,500,000 4.500% 99.10 4.541%
RBA-O-112A Raiffeisen Bank Austria d.d. 10/2/2006 10/2/2011 HRK 600,000,000 4.125% 98.00 4.209%
PODR-O-115A Podravka d.d. 17/5/2006 17/5/2011 HRK 375,000,000 5.125% 96.20 5.327%
NEXE-O-116A Nexe grupa d.d. 14/6/2006 14/6/2011 HRK 750,000,000 5.500% 97.00 5.670%
MTEL-O-097A Metronet telekomunikacije d.d. 28/7/2006 28/7/2009 HRK 120,000,000 8.500% 101.90 8.342%
HOTR-O-941A Hospitalija trgovina d.o.o. 5/10/2006 5/10/2009 HRK 75,000,000 8.250% 101.20 8.152%
HEP-O-13BA Hrvatska elektroprivreda d.d. 29/11/2006 29/11/2013 HRK 500,000,000 5.000% 94.00 5.319%
ATGR-O-11CA Atlantic grupa d.d. 6/12/2006 6/12/2011 HRK 115,000,000 5.750% 98.35 –
INGR-O-11CA Ingra d.d. 6/12/2006 6/12/2011 HRK 200,000,000 6.125% 98.80 6.199%
OPTE-O-142A Optima telekom d.o.o. 1/2/2007 1/2/2014 HRK 250,000,000 9.125% 101.85 8.959%
JDGL-O-126A Jadran Galenski laboratorij d.d. 11/06/2007 11/06/2012 HRK 125,000,000 5.650% – –a Regularly traded shares. Source: ZSE.
the beginning of the year. In May, the City of Rijeka issued the second tranche of its ten-year bond in the nominal value of EUR 8.2m, doubling the total value of the issue, and June saw the issue of “JADRAN” – Galenski laboratorij d.d. ten-year kuna bond, worth HRK 125m in nominal terms, with yield to maturity at issue of 5.65%. In July, MoF issued the second tranche of a ten-year kuna bond, whose nominal val-ue was reduced from the planned HRK 3.5bn to HRK 3.0bn due to favourable movements of budget revenues, raising the total value of the issue to HRK 5.5bn. As the govern-ment euro three-year bond and the euro three-year bond of Atlantic Group d.o.o. matured in July, there were 30 bonds listed on the domestic capital market on the last day of Au-gust, including ten government bonds, four municipal bonds, one government agency bond (CBRD) and fifteen corporate bonds. Market capitalisation23 of the government bonds, mu-nicipal bonds and CBRD bond totalled HRK 4.9bn at the end of August, accounting for about 14.3% of GDP for 2006, while market capitalisation of the corporate bonds stood at

CNB BULLETIN • NUMBER 130 • QUARTERLY REPORT • CAPITAL MARKET
37
EUR 781m or some 2.3% of GDP for 2006. As at end-June 2007, twenty six commercial paper issues by sixteen issu-ers were listed on the Zagreb Stock Exchange, the largest number of commercial paper issues listed up to that date, totalling slightly less than HRK 1.0bn.
Total bond turnover24 was down HRK 6.6bn in the second quarter 2007, compared with the record high in the previ-ous quarter, totalling HRK 9.1bn, which was to the greatest extent due to weaker trading in May and June, to be linked with the market preparing for the new tranche of a govern-ment bond. Its issue contributed to turnover reintensification in July and August, when it totalled HRK 7.4bn. Republic of Croatia bonds issued in the domestic currency had the largest share in the bond turnover in the second quarter of 2007, with the most traded bond being the government bond due in 2015, which was followed by the government bonds maturing in 2014 and 2013, while the most traded govern-ment bond in August was the ten-year bond due in 2017. The share of all the government bonds in the total quarterly
bond turnover amounted to 97%, maintaining similar levels in July and August. The Zagreb Stock Exchange bond index, CROBIS, continued declining, standing at 99.08 points at the end of the second quarter 2007 and 98.53 points at the end of August.
In accordance with the government debt management strategy, aimed at replacing external with domestic debt, the Republic of Croatia issued no bonds in the foreign markets ei-ther in the second quarter or in July or August of 2007. Since the seven-year Samurai bond matured in July, in the nominal value of JPY 40bn or some HRK 1.8bn, seven Croatian bonds were listed on international markets, one less than at the end of the previous quarter. Of the remaining international issues of Croatian bonds, four were euro-denominated, two yen-denominated and one was denominated in US dollars. The seven Croatian eurobond issues totalled HRK 23.4bn at the end of August 2007.
In line with forecasts of the rise in the ECB’s reference rate due to inflationary pressures which accompanied posi-tive economic developments in the eurozone, the second quarter of 2007 was marked by the rise in required yields on benchmark German bonds. At the same time required yields on domestic eurobonds also rose, but at a slower pace, so yield spreads between Croatian eurobonds and benchmark German bonds due in 2009, 2011 and 2014 declined at the end of July, to 21, 25 and 31 basis points respectively,
90
94
98
102
106
110
0
2
4
6
8
10
Figure 70
Bond turnover – left CROBIS – right
Source: ZSE.
bill
ion
HR
K
poin
ts
1/0
4
4/0
4
7/0
4
10
/04
1/0
5
4/0
5
7/0
5
10
/05
1/0
6
4/0
6
7/0
6
10
/06
1/0
7
4/0
7
7/0
7
MONTHLY BOND TURNOVER
AND END-MONTH CROBIS
ON THE CROATIAN
CAPITAL MARKET
24 The data on the total bond turnover from January 2004 to February 2007 are the sum of the respective bond turnovers on the Varaždin Stock Exchange and Zagreb Stock Exchange, with data of the unified Zagreb Stock Exchange used since March 2007 and the merger of the Varaždin Exchange into the Zagreb Stock Exchange. It needs emphasising that the Varaždin Stock Exchange bond turnover had been negligible, standing be-low 0.4% of the total turnover on both stock exchanges in all the observed years.
Table 8: Republic of Croatia International Bond Issues, stock as at 30 June 2007
Bonds Issue date Currency Amount Nominal interest rate
Yield on issue date
Spread on issue
date
Spreada 30/9/2006
Spreada 31/12/2006
Spreada 31/3/2007
Spreada 30/6/2007
London Club A, 2010 31/7/1996 USD 857,796,000 6-month LIBOR + 81.25 b.p. 100 86 92 100
Eurobonds, 2011 14/3/2001 EUR 750,000,000 6.75% 6.90% 215 53 40 40 25
Eurobonds, 2009 11/2/2002 EUR 500,000,000 6.25% 6.45% 158 52 39 38 21
Eurobonds, 2010 14/2/2003 EUR 500,000,000 4.625% 4.65% 102 50 39 40 20
Eurobonds, 2014 15/4/2004 EUR 500,000,000 5.000% 5.11% 101 54 42 43 31
Samurai bonds, 2007 11/7/2000 JPY 40,000,000,000 3.00% 3.00% 135 59 46 62 ....
Samurai bonds, 2008 26/6/2002 JPY 25,000,000,000 2.15% 2.15% 144 48 40 40 41
Samurai bonds, 2009 26/6/2003 JPY 25,000,000,000 1.23% 1.23% 99 50 46 44 47a In relation to benchmark bond. Source: Bloomberg.
20
40
60
80
100
120
140
160
180
20112009 2014
Figure 71
CROATIAN EUROBOND SPREAD 2009, 2011 AND 2014,COMPARED WITH BENCHMARK GERMAN BONDS
basis
poin
ts
Source: Bloomberg.
30
/8/0
2
30
/11
/02
28
/2/0
3
30
/5/0
3
30
/8/0
3
30
/11
/03
29
/2/0
4
30
/5/0
4
30
/8/0
4
30
/11
/04
28
/2/0
5
30
/5/0
5
30
/8/0
5
30
/11
/05
28
/2/0
6
30
/5/0
6
30
/8/0
6
30
/11
/06
28
/2/0
7
30
/5/0
7
30
/8/0
7

CNB BULLETIN • NUMBER 130 • QUARTERLY REPORT • INTERNATIONAL TRANSACTIONS
38
which was a significant decrease compared with 38, 40 and 43 basis points at end-March 2006. However, crisis on the world’s financial markets which was threatening to spread to other segments of the economy pushed investors towards safer investments, which resulted in strong growth of de-mand for government bonds of developed countries in July and August 2007 and large decrease in required yields on low-risk bonds. Such movements continued amid specula-tions that ECB might decide against raising the benchmark interest rate until the end of 2007, while Fed was expected to reduce its benchmark rate at the September meeting of the FOMC (Federal Open Market Comittee). In contrast, yields on Croatian eurobonds maintained much the same levels as in June 2007 or slightly higher, which resulted in the sub-stantial rise in the spread between their yields and the yield on comparable German bond. As a result, the yield spread for bonds of above-mentioned maturities totalled 65, 72 and 72 basis points at the end of August, which were the results last seen at the end of 2004.
As eurobond yields of the new EU members mostly grew at a slightly slower pace than the yields on benchmark Ger-man bonds in the second quarter of 2007, the related yield spreads narrowed. However, in contrast to yields on Croatian eurobonds, yields on eurobonds of other observed countries, except Bulgaria, went down in July and August, increasing the spread between their yields until the end of August. How-ever, this spread increase was still smaller than in the case of the comparable Croatian eurobond.
International TransactionsThe less pronounced growth of the current account defi-
cit in the second quarter of 2007 is attributed to the addi-tional slowdown in the foreign trade deficit and the increase in net exports of services relative to the second quarter in 2006. In contrast, the factor income account and the account of current transfers saw a deteriorated in their balances in the reference period. The second quarter of 2007 was also
marked by slower growth of external debt. Notwithstanding the increase in direct borrowing of enterprises abroad, the major contributor to the slowdown of external debt was the decrease in banks’ debt. The tighter CNB measures aimed at curbing placement growth and the favourable seasonal effects resulted in a further substantial reduction of banks’ external debt in July and August. It is therefore expected that the growth in total external debt will not be registered at the end of the third quarter.
Given a relatively mild increase in the current account deficit in the first quarter of 2007, the overall deficit growth was substantially lower in the first half of 2007 than in the same period in 2006 (3.6% vs. 23.7%). Following these developments, the foreign trade deficit fell from 14.2% to 11.7%, mostly due to the slowdown in the growth of goods imports. Concurrently, the growth of goods exports was two times slower, mainly on account of poorer performance in the first quarter of 2007 which was largely the result of the base effects related to exports of ship. The foreign trade in services additionally improved in the first half of 2007, with the growth in the positive balance being three times faster in the reference period than in the first half of 2006, predomi-nantly due lower expenditures. As a result, the growth of the negative foreign trade balance in goods and services was four times slower in the first six months of 2007 than in the same period in 2006, contributing to a slight improvement in the import/export coverage rate (from 69.3% to 70.5%).
Current Account
According to preliminary data, the current account deficit rose by 3.9% in the second quarter of 2007 relative to the second quarter of 2006, reaching a total of EUR 1.3bn. The annual growth of the current account deficit was consider-ably lower than the one registered in the same period last year (10.8%). In part, this was the consequence of the slower growth in the foreign trade deficit, which fell from 11.8% in the April-June period of 2006 to 8.2% in the April-June period of 2007 on account of commendable performance in goods exports. In addition, the account of services saw an increase in net revenues.
The annual growth of total goods imports, according to the BoP data expressed in euros, accelerated from 5.2% in the second quarter of 2006 to as much as 16.1% in the same period in 2007. This acceleration was for the major part ac-counted for by larger exports of transport equipment (pre-dominantly ships), which offset weaker exports of ships in the first quarter of the year. Concurrently, the value of exports of oil and refined petroleum products grew strongly in the refer-ence period as the growth in the volume of exports outpaced the fall in export prices. In contrast, exports of other energy products decelerated, especially those encompassing natural gas, manufactured gas and electric current. Exports of some foods products, including coffee, tea, cacao and spices, and sugar, sugar preparations and honey, also fell.
The annual growth of total exports of goods stood at 9% in the first half of 2007 and was two times lower than the one registered in the same period last year (17.5%). The slower growth of exports was for the main part the result of much
0
50
100
150
250
200
basis
poin
ts
Romania 2012 Croatia 2011
Poland 2011
Bulgaria 2013
Slovenia 2011
CROATIAN EUROBOND SPREAD AND THESPREAD OF SIMILAR EURO-DENOMINATED BONDS
OF SELECTED TRANSITION COUNTRIES COMPAREDWITH THE BENCHMARK GERMAN BOND
Source: Bloomberg.
Figure 72
Hungary 2011
1/0
4
4/0
4
7/0
4
10
/04
1/0
5
4/0
5
7/0
5
10
/05
1/0
6
4/0
6
7/0
6
10
/06
1/0
7
4/0
7
7/0
7

CNB BULLETIN • NUMBER 130 • QUARTERLY REPORT • INTERNATIONAL TRANSACTIONS
39
smaller exports of energy products (natural gas, manufac-tured gas and electric current), exports of coffee, tea, cacao and spices and exports of fish and preparations. In addition, the growth of exports of other transport equipment (ships) and exports of oil and refined petroleum products slowed down considerably in the first six months of 2007, contribut-ing negatively to the growth of total exports of goods in the reference period. In contrast to these SITC divisions, some other divisions, including electrical machinery apparatus and equipment and wearing apparel, showed good export re-sults.
Imports of goods strengthened to 11.8% in the second quarter of 2007, while in the second quarter of 2006 they stood at 8.7%. To a large extent, this strengthening was the result of the increase in imports of oil and refined petroleum products, iron and steel, road vehicles and general industrial machinery and equipment. The growth in the value of im-ports of oil and refined petroleum products was the result of the substantially larger volume of imports, given that their import prices were lower in the second quarter than in the same period last year. Imports of natural and manufactured gas also declined, which was especially marked in the second quarter when gas consumption fell due to warm weather.
The annual growth of total imports of goods fell from 15.8% in the first six months of 2006 to 10.4% in the first six months of 2007. Weaker imports of energy products contributed the most to the slower growth of total imports. Specifically, imports of oil and refined petroleum products slowed down noticeably in the first half of 2007 and were accompanied by considerably lower imports of natural and manufactured gas. In contrast, strong imports of iron and steel and imports of road vehicles made a large contribution to the growth of total imports of goods which remained rela-tively high.
The balance in the account of services was positive in the second quarter of 2007 compared with the same period last year, standing at 17.2%. This is largely attributed to the strong growth of tourism revenues and to the lower net im-ports of other services from abroad, predominately financial services (insurance services excluded). The balance in trans-
portation services saw no significant changes in the refer-ence period due to an almost equal growth in revenues and expenditures.
After growing strongly in the first quarter of 2007, the annual growth of tourism revenues continued at an unabated pace in the second quarter of 2007 (13.5%). These trends are also corroborated by CBS data on foreign tourists’ arriv-als and nights stayed in commercial accommodation facilities which, compared with the second quarter of 2006, went up by 12.3% and 6.9% respectively. The increase in the number of nights was to a large extent the result of the increase in nights stayed by tourists from Slovenia, the Czech R., Russia and Austria, while on the other hand a considerable decrease in the number of nights was the result of the fall in nights stayed by tourists from Germany, France and Great Britain.
Due to the better results seen in the account of services in the first quarter of 2007 than in the same quarter of 2006, the annual growth of its positive balance accelerated to a high 30% in the first half of 2007 relative to 10.7% in the same period of 2006. The major contributors to this were the fall
Tablica 9: Current Account, in million EUR
2005 2006 Apr.–Jun.2006 Apr.–Jun. 2007aIndices
2006/2005 Apr.–Jun. 2007a/Apr.–Jun. 2006
CURRENT ACCOUNT –1,988 –2,647 –1,299 –1,350 133.1 103.9
1. Goods –7,518 –8,344 –2,343 –2,535 111.0 108.2
1.1. Credit (f.o.b.) 7,220 8,464 1,977 2,295 117.2 116.1
1.2. Debit (f.o.b.) –14,738 –16,808 –4,320 –4,830 114.0 111.8
2. Services 5,318 5,710 1,297 1,520 107.4 117.2
2.1. Credit 8,053 8,534 2,019 2,197 106.0 108.8
2.2. Debit –2,735 –2,824 –722 –677 103.2 93.8
3. Income –972 –1,119 –549 –598 115.2 108.9
3.1. Credit 611 820 191 310 134.1 162.3
3.2. Debit –1,583 –1,939 –740 –907 122.5 122.7
4. Current transfers 1,184 1,106 297 263 93.4 88.5
4.1. Credit 1,628 1,638 441 392 100.6 88.9
4.2. Debit –445 –532 –144 –129 119.7 89.7a Preliminary data.Source: CNB.
%
0
20
40
60
80
100
Figure 73
Source: CBS.
Q1
/05
Q2
/05
Q3
/05
Q4
/05
Q1
/06
Q2
/06
Q3
/06
Q4
/06
Q1
/07
Q/0
72
FOREIGN TOURIST NIGHTS IN COMMERCIALACCOMMODATION FACILITIES BY COUNTRY OF RESIDENCE
Other countries Old EU Member States
EU-10 (excl Malta and Cyprus).

CNB BULLETIN • NUMBER 130 • QUARTERLY REPORT • INTERNATIONAL TRANSACTIONS
40
in expenditures on other services and the strong growth in revenues, especially tourism-related revenues. In addition to the slower growth of the deficit in the account of goods, the annual growth of the deficit in trade of goods and services slowed down considerably in the first six months of 2007 over the same period last year (4% vs. 15.8%).
The factor income deficit was 8.9% higher in the second half of 2007 than in the same period last year, due to sturdy growth in expenditures. As for individually types of expen-ditures, the biggest increase was seen in domestic sectors’ expenditures on direct equity investment, the largest portion of which was accounted for by retained earnings that did not change considerably relative to the same period last year, and in the dividends paid out to the foreign owners of domestic enterprises which grew three times over the same period last year. Domestic sectors also largely increased their expendi-tures on interest on foreign liabilities, predominantly enter-prises, while banks and the government sector moderately decreased their expenditures on interest on foreign liabilities. In the second quarter of 2007, the factor income account also saw a significant growth in revenues, mostly comprising the compensation to employees, external inflows from inter-national reserves investment and retained earnings of domes-tic owners of foreign enterprises.
The balance in the account of current transfers continued to deteriorate in the second quarter of 2007, due to the larger annual fall in revenues than in expenditures. The fall in total revenues was almost fully accounted for by lower revenues of other domestic sectors from workers’ remittances, while the fall in expenditures was almost fully accounted for by the government sector and included the lower value of goods that were exported without being paid for (e.g. humanitarian aid, products presented at the fairs, and the like).
Trade in Goods
Total exports of goods (measured in constant exchange rate terms) grew by 12.3% in the first eight months of 2007, down 4.4 percentage points over the same period last year.
This slowdown may to a large extent be attributed to the fall in exports of energy products (natural gas, manufactured gas and electric current). Moreover, exports of some food prod-ucts such as coffee, tea, cacao and spices and exports of fish and preparations also fell in the first eight months of 2007, while in the same period last year they were one of the largest SITC contributors to total export growth.
In contrast to these SITC divisions, a number of other SITC divisions continued to register good export results in the reference period. Specifically, exports of other transport equipment (predominantly ships) made the largest individual contribution to total export growth in the first eight months of 2007. In addition, one should take into account the increase in exports of electrical machinery, apparatus and equipment and the high value of exports of oil and refined petroleum products whose annual growth was three times lower in the January-August period of 2007 than in the same period last year. An exceptional increase was also registered in the ex-ports of cereals and cereal preparations, power generating
200
250
300
350
400
450
500
6 05
600
550
Figure 74
GOODS EXPORTS (f.o.b.) AND TRENDother transport equipment, oil and refined petroleumproducts excluded, at constant 2002 exchange rate
Exports
Sources: CBS and CNB.
Exports – trend
mill
ion
US
D
1/0
1
7/0
1
1/0
2
7/0
2
1/0
3
7/0
3
1/0
4
7/0
4
1/0
5
7/0
5
1/0
6
7/0
6
1/0
7
7/0
7
–200
–150
–100
–50
0
50
100
150
200
Figure 75
CONTRIBUTION OF SELECTED SITC DIVISIONSTO YEAR-ON-YEAR GROWTH OF GOODS PORTSTOTAL EX
Source: CBS.
mill
ion
US
D
Oth
er
tra
nsp
ort
eq
uip
me
nt
Ele
ctr
ica
lm
ach
ine
ry,
ap
pa
ratu
sa
nd
ap
plia
nce
s
Oil
an
dre
fin
ed
pe
tro
leu
mp
rod
ucts
Ce
rea
lsa
nd
ce
rea
lp
rep
ara
tio
ns
Po
we
rg
en
era
tin
gm
ach
ine
rya
nd
eq
uip
me
nt
Co
rka
nd
wo
od
Jan Aug 20.– . 05 Jan. Aug– . 0620 Jan. Aug– . 0720
200
400
600
800
1000
1 008
1600
1400
1200
Figure 76
GOODS IMPORTS (c.i.f.) AND TRENDoil and refined petroleum products excluded,
at constant 2002 exchange rate
Imports – trendImports
Sources: CBS and CNB.
mill
ion
US
D
1/0
1
7/0
1
1/0
2
7/0
2
1/0
3
7/0
3
1/0
4
7/0
4
1/0
5
7/0
5
1/0
6
7/0
6
1/0
7
7/0
7

CNB BULLETIN • NUMBER 130 • QUARTERLY REPORT • INTERNATIONAL TRANSACTIONS
41
machinery and equipment, cork and wood, and machinery specialised for particular industries.
Total imports of goods (measured in constant exchange rate terms) rose by 12.5% in the first eight months of 2007, which was less than in the same period last year (17%). The slowdown in the growth of total imports may in part be at-tributed to lower imports of natural and manufactured gas, imports of sugar, sugar preparations and honey, and imports of leather manufactures and dressed fur skins. The fall in imports of natural and manufactured gas was mainly regis-tered in the second quarter when, due to warm weather, the consumption of these energy products trended downward. In addition, imports of some other SITC divisions grew slower in the first eight months of 2007 than in the same period of 2006 and thus contributed to the moderate growth of total imports of goods. This is in particular related to the growth in the import value of oil and refined petroleum products which, although still high, was four times lower in the January- August period of 2007 than in the same period last year.
In contrast, imports of road vehicles continued to grow strongly (in the first eight months of 2007, the annual growth
–100
0
100
200
300
400
500
Figure 77
CONTRIBUTION OF SELECTED SITC DIVISIONSTO YEAR-ON-YEAR GROWTH OF GOODS IMPORTSTOTAL
Source: CBS.
mill
ion
EU
R
Ro
ad
ve
hic
les
Iro
na
nd
ste
el
Ge
ne
ral
ind
ustr
ial
ma
ch
ine
rya
nd
eq
uip
me
nt
Ma
nu
factu
res
of
me
tals
(n.e
.c.)
Oth
er
tra
nsp
ort
eq
uip
me
nt
We
arin
ga
pp
are
l
Jan Aug 20.– . 05 Jan. Aug– . 0620 Jan. Aug– . 0720
Tablica 10: Exports and Imports by Economic Classification of Countries, in %
Export Import
2005 2006 Jan.–Aug 2006 Jan.–Aug. 2007a 2005 2006 Jan.–Aug 2006 Jan.–Aug. 2007a
Developed counties 69.3 71.7 72.6 70.5 73.8 72.6 72.6 72.8
EU-25 62.0 63.2 65.1 59.7 65.6 65.0 65.1 64.3
Slovenia 8.1 8.2 8.3 8.3 6.8 6.3 6.4 6.1
Hungary 1.6 1.7 1.6 2.0 3.1 3.0 3.1 2.7
EU-15 48.1 48.8 50.5 44.9 50.6 50.1 49.9 50.2
Austria 7.2 6.0 6.4 6.2 5.8 5.4 5.3 5.4
Italy 21.2 23.1 23.5 20.0 16.0 16.7 16.6 16.9
Germany 10.7 10.3 10.5 10.3 14.8 14.5 14.5 14.5
EFTA 1.1 1.5 1.6 1.3 1.7 1.7 1.7 1.9
Developing countries 30.7 28.3 27.4 29.5 26.2 27.4 27.4 27.2
Bosnia and Herzegovina 14.3 12.6 12.3 14.4 2.4 2.8 2.7 3.0
Serbia, Montenegro 4.5 5.4 5.3 6.3 0.9 1.1 1.0 1.2
Russia 1.3 1.2 1.1 1.1 9.2 10.1 10.3 9.3
China 0.1 0.2 0.1 0.1 4.7 5.3 4.8 5.9a Preliminary data. Source: CBS.
rate of imports of road vehicles, measured in constant ex-change rate terms, stood at 16.5%, while in the first eight months of 2006 it amounted to 14.4%). In addition, imports of iron and steel continued to play the major role in the rel-atively high growth of imports – the growth of imports of this SITC division accounted for about one-tenth of the total growth in goods imports in the first eight months of 2007, which is almost two times more than in the same period last year. The increase in the value of imports of iron and steel was also accounted by their high prices in the world market. As far as other SITC divisions are concerned, high rates of growth were seen in imports of general industrial machinery and equipment, manufactures of metals (n.e.c.) and other transport equipment. Although slower than in the first eight months of 2006, the relatively high growth of 11.2% was also registered in imports of capital goods (machinery and trans-port equipment, excluding other transport equipment and road vehicles).
As shown by the geographic structure of Croatia’s goods exports in the first eight months of 2007, exports to devel-oped countries fell in the January-August period of 2007 over the same period last year, mainly on account of the slowdown in the growth of exports to old EU Member States. This slowdown may to a large extent be attributed to considerably lower exports to Italy, including energy products (natural and manufactured gas) and ships. In addition, exports to Swe-den also fell noticeably and were in part accounted for by considerably lower exports of ships and non-metallic mineral manufactures. In contrast, the growth of exports to the ma-jority of new Member States remained relatively high, with exports to Malta and Hungary accelerating the most. As for developed countries, an exceptionally high growth of exports was registered with respect to some less important trading partners, such as Marshall Islands and Bermuda, and largely comprised ships.
In contrast to developed countries, exports to develop-ing countries grew more strongly in the first eight months of 2007 than in the same period last year, thus increasing their share in total goods exports. In addition, after slowing down in 2006, exports to Croatia’s most important trading partner – Bosnia and Herzegovina – grew exceptionally fast

CNB BULLETIN • NUMBER 130 • QUARTERLY REPORT • INTERNATIONAL TRANSACTIONS
42
in the reference period. Exports of oil and refined petroleum products, and iron and steel accounted for a large share of exports to this country and were additionally stimulated by their high prices in the world market. Moreover, exports to Serbia and Montenegro, mostly comprising oil and refined petroleum products, non-metallic mineral manufactures and cigarettes, continued to grow at an exceptionally fast pace in the reference period.
As shown by the geographic structure of Croatia’s goods imports, the share of imports from developed countries changed only slightly in the first eight months of 2007 relative to the same period last year. Specifically, it grew as strong as imports from developing countries. As a result, goods con-tinued to predominate in imports from developed countries (72.8%). Of this, more than two-thirds of imports were made from old EU Member States, predominantly Italy and Ger-many. Imports from these two countries also grew the most in the January-August period of 2007 relative to the same period last year. In case of Italy, the increase in imports was mainly accounted for by larger imports of ships, which were to a great extent the result of the recording of the value-added finishing operations on a gross basis. The increase in imports from Germany was for the major part accounted for by larger imports of road vehicles and iron and steel. Imports from newer EU Member States continued to grow, but at much lower rate than in the January-August period of 2006, largely due to the slowdown in the growth of imports from Slovakia, Hungary and Malta.
Imports from developing countries continued to grow at a relatively high rate – in the January-August period of 2007, they went up by 17.6% relative to the same period last year. Imports from China grew the most or by one-third and main-ly comprised the wearing apparel, telecommunication appa-ratus, and electrical machinery, apparatus and equipment. Imports from the neighbouring countries, especially Bosnia and Herzegovina (non-ferrous metals and manufactures of metals (n.e.c.)) and Serbia and Montenegro (iron and steel, and organic chemicals), also grew substantially. Although at a noticeably lower rate than in the first eight months of 2006, imports from Russia also grew considerably in the January-August period of 2007 and were for the most part accounted
for by the energy products whose average import price was lower in the first eight months of 2007 than in the same pe-riod last year.
Capital and Financial Transactions
The account of capital and financial transactions saw a modest annual growth in net foreign direct investment in the second quarter of 2007, mostly on account of the growth in liabilities of domestic enterprises to affiliated enterprises abroad. The net portfolio investment inflow was relatively small because foreign investment of domestic sectors rose at the same rate as foreign liabilities. The net inflow in the ac-count of other investments was considerably lower than in the second quarter 2006 due to a weaker increase in liabilities of domestic sectors arising from loans, trade credits and cur-rency and deposits. Gross international reserves also fell in the second quarter of 2007.
Net foreign direct investment stood at EUR 0.8bn in the April-June period of 2007, up 2.8% over the same period last year. Outward foreign direct investments have not changed substantially in the reference period, while inward foreign di-rect investments grew modestly. For the most part, this was due to the growth in other investment, i.e. the growth in li-abilities to affiliated enterprises abroad. In the same period, the value of equity investment was more than two times low-er, while retained earnings fell negligibly.
Monetary intermediation (i.e. recapitalisation of banks in foreign ownership) accounted for somewhat less than a half of total foreign direct investment in the second quarter of 2007 (insurance and pension funds excluded). Moreover, equity investments were also made in retail trade and repair of personal and household goods, manufacture of chemicals and chemical products, and publishing, printing and repro-duction of recorded media. Almost 90% of all foreign direct investments were made by investors from Austria, Germany, Italy and Slovenia.
In the second quarter of 2007, the account of portfolio investment saw a relatively small net inflow (EUR 8m), due to outflows arising from larger foreign investment of domes-tic sectors (the growth in foreign assets) being only slightly
Tablica 11: Capital and Financial Account, in million EUR
2005 2006 Apr.–Jun. 2006 Apr.–Jun. 2007aIndices
2006/2005 Apr.–Jun. 2007a / Apr.–Jun. 2006
CAPITAL AND FINANCIAL ACCOUNT 3,002 3,693 1,478 1,339 123.0 90.6
1. Capital account 54 –134 4 9 – 247.5
2. Financial account, excl. reserves 3,770 5,239 2,171 994 139.0 45.8
2.1. Direct investment 1,276 2,549 772 794 199.8 102.8
2.1.1. Abroad –192 –164 –42 –42 85.3 99.1
2.1.2. In Croatia 1,468 2,713 814 836 184.8 102.6
2.2. Portfolio investment –1,188 –527 87 8 44.4 8.9
2.2.1. Assets –581 –460 –5 –338 79.1 6,296.9
2.2.2. Liabilities –607 –67 92 345 11.1 374.3
2.3. Financial derivatives 0 0 0 0 – –
2.4. Other investment 3,771 3,217 1,312 192 85.3 14.6
2.4.1. Assets 977 –674 102 –195 – –
2.4.2. Liabilities 2,794 3,891 1,210 387 139.3 32.0
3. Reserve assets (CNB) –822 –1,412 –697 336 171.8 –a Preliminary data.Source: CNB.
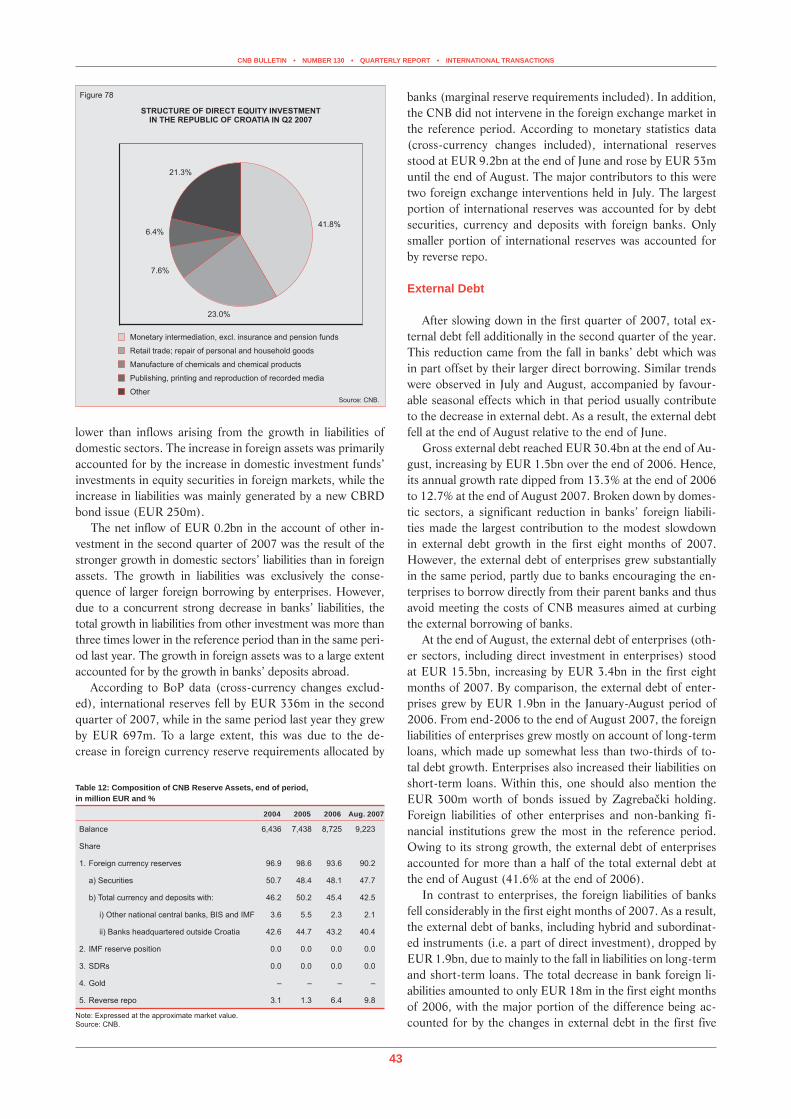
CNB BULLETIN • NUMBER 130 • QUARTERLY REPORT • INTERNATIONAL TRANSACTIONS
43
lower than inflows arising from the growth in liabilities of domestic sectors. The increase in foreign assets was primarily accounted for by the increase in domestic investment funds’ investments in equity securities in foreign markets, while the increase in liabilities was mainly generated by a new CBRD bond issue (EUR 250m).
The net inflow of EUR 0.2bn in the account of other in-vestment in the second quarter of 2007 was the result of the stronger growth in domestic sectors’ liabilities than in foreign assets. The growth in liabilities was exclusively the conse-quence of larger foreign borrowing by enterprises. However, due to a concurrent strong decrease in banks’ liabilities, the total growth in liabilities from other investment was more than three times lower in the reference period than in the same peri-od last year. The growth in foreign assets was to a large extent accounted for by the growth in banks’ deposits abroad.
According to BoP data (cross-currency changes exclud-ed), international reserves fell by EUR 336m in the second quarter of 2007, while in the same period last year they grew by EUR 697m. To a large extent, this was due to the de-crease in foreign currency reserve requirements allocated by
banks (marginal reserve requirements included). In addition, the CNB did not intervene in the foreign exchange market in the reference period. According to monetary statistics data (cross-currency changes included), international reserves stood at EUR 9.2bn at the end of June and rose by EUR 53m until the end of August. The major contributors to this were two foreign exchange interventions held in July. The largest portion of international reserves was accounted for by debt securities, currency and deposits with foreign banks. Only smaller portion of international reserves was accounted for by reverse repo.
External Debt
After slowing down in the first quarter of 2007, total ex-ternal debt fell additionally in the second quarter of the year. This reduction came from the fall in banks’ debt which was in part offset by their larger direct borrowing. Similar trends were observed in July and August, accompanied by favour-able seasonal effects which in that period usually contribute to the decrease in external debt. As a result, the external debt fell at the end of August relative to the end of June.
Gross external debt reached EUR 30.4bn at the end of Au-gust, increasing by EUR 1.5bn over the end of 2006. Hence, its annual growth rate dipped from 13.3% at the end of 2006 to 12.7% at the end of August 2007. Broken down by domes-tic sectors, a significant reduction in banks’ foreign liabili-ties made the largest contribution to the modest slowdown in external debt growth in the first eight months of 2007. However, the external debt of enterprises grew substantially in the same period, partly due to banks encouraging the en-terprises to borrow directly from their parent banks and thus avoid meeting the costs of CNB measures aimed at curbing the external borrowing of banks.
At the end of August, the external debt of enterprises (oth-er sectors, including direct investment in enterprises) stood at EUR 15.5bn, increasing by EUR 3.4bn in the first eight months of 2007. By comparison, the external debt of enter-prises grew by EUR 1.9bn in the January-August period of 2006. From end-2006 to the end of August 2007, the foreign liabilities of enterprises grew mostly on account of long-term loans, which made up somewhat less than two-thirds of to-tal debt growth. Enterprises also increased their liabilities on short-term loans. Within this, one should also mention the EUR 300m worth of bonds issued by Zagrebački holding. Foreign liabilities of other enterprises and non-banking fi-nancial institutions grew the most in the reference period. Owing to its strong growth, the external debt of enterprises accounted for more than a half of the total external debt at the end of August (41.6% at the end of 2006).
In contrast to enterprises, the foreign liabilities of banks fell considerably in the first eight months of 2007. As a result, the external debt of banks, including hybrid and subordinat-ed instruments (i.e. a part of direct investment), dropped by EUR 1.9bn, due to mainly to the fall in liabilities on long-term and short-term loans. The total decrease in bank foreign li-abilities amounted to only EUR 18m in the first eight months of 2006, with the major portion of the difference being ac-counted for by the changes in external debt in the first five
Source: CNB.
Figure 78
STRUCTURE OF DIRECT EQUITY INVESTMENTIN THE REPUBLIC OF CROATIA IN Q 20072
41.8%6.4%
21.3%
23.0%
7.6%
Monetary intermediation, excl. insurance and pension funds
Retail trade; repair of personal and household goods
Manufacture of chemicals and chemical products
Publishing, printing and reproduction of recorded media
Other
Table 12: Composition of CNB Reserve Assets, end of period, in million EUR and %
2004 2005 2006 Aug. 2007
Balance 6,436 7,438 8,725 9,223
Share
1. Foreign currency reserves 96.9 98.6 93.6 90.2
a) Securities 50.7 48.4 48.1 47.7
b) Total currency and deposits with: 46.2 50.2 45.4 42.5
i) Other national central banks, BIS and IMF 3.6 5.5 2.3 2.1
ii) Banks headquartered outside Croatia 42.6 44.7 43.2 40.4
2. IMF reserve position 0.0 0.0 0.0 0.0
3. SDRs 0.0 0.0 0.0 0.0
4. Gold – – – –
5. Reverse repo 3.1 1.3 6.4 9.8
Note: Expressed at the approximate market value. Source: CNB.
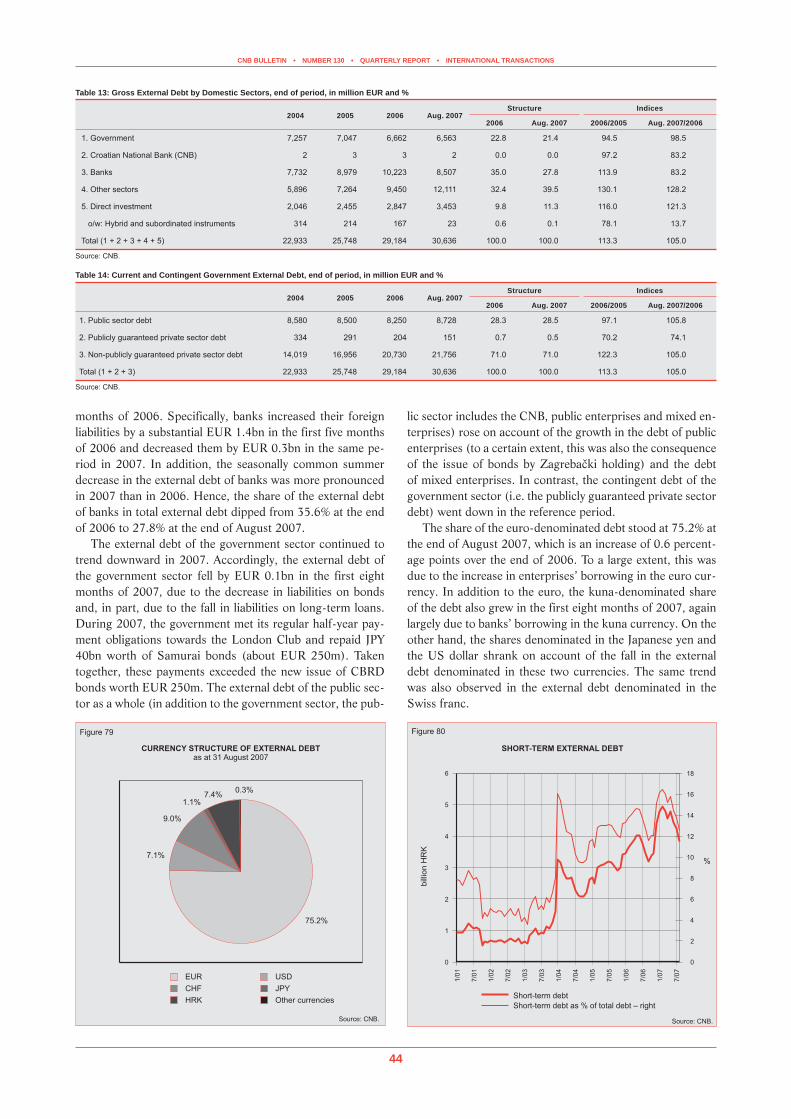
CNB BULLETIN • NUMBER 130 • QUARTERLY REPORT • INTERNATIONAL TRANSACTIONS
44
months of 2006. Specifically, banks increased their foreign liabilities by a substantial EUR 1.4bn in the first five months of 2006 and decreased them by EUR 0.3bn in the same pe-riod in 2007. In addition, the seasonally common summer decrease in the external debt of banks was more pronounced in 2007 than in 2006. Hence, the share of the external debt of banks in total external debt dipped from 35.6% at the end of 2006 to 27.8% at the end of August 2007.
The external debt of the government sector continued to trend downward in 2007. Accordingly, the external debt of the government sector fell by EUR 0.1bn in the first eight months of 2007, due to the decrease in liabilities on bonds and, in part, due to the fall in liabilities on long-term loans. During 2007, the government met its regular half-year pay-ment obligations towards the London Club and repaid JPY 40bn worth of Samurai bonds (about EUR 250m). Taken together, these payments exceeded the new issue of CBRD bonds worth EUR 250m. The external debt of the public sec-tor as a whole (in addition to the government sector, the pub-
lic sector includes the CNB, public enterprises and mixed en-terprises) rose on account of the growth in the debt of public enterprises (to a certain extent, this was also the consequence of the issue of bonds by Zagrebački holding) and the debt of mixed enterprises. In contrast, the contingent debt of the government sector (i.e. the publicly guaranteed private sector debt) went down in the reference period.
The share of the euro-denominated debt stood at 75.2% at the end of August 2007, which is an increase of 0.6 percent-age points over the end of 2006. To a large extent, this was due to the increase in enterprises’ borrowing in the euro cur-rency. In addition to the euro, the kuna-denominated share of the debt also grew in the first eight months of 2007, again largely due to banks’ borrowing in the kuna currency. On the other hand, the shares denominated in the Japanese yen and the US dollar shrank on account of the fall in the external debt denominated in these two currencies. The same trend was also observed in the external debt denominated in the Swiss franc.
Table 13: Gross External Debt by Domestic Sectors, end of period, in million EUR and %
2004 2005 2006 Aug. 2007Structure Indices
2006 Aug. 2007 2006/2005 Aug. 2007/2006
1. Government 7,257 7,047 6,662 6,563 22.8 21.4 94.5 98.5
2. Croatian National Bank (CNB) 2 3 3 2 0.0 0.0 97.2 83.2
3. Banks 7,732 8,979 10,223 8,507 35.0 27.8 113.9 83.2
4. Other sectors 5,896 7,264 9,450 12,111 32.4 39.5 130.1 128.2
5. Direct investment 2,046 2,455 2,847 3,453 9.8 11.3 116.0 121.3
o/w: Hybrid and subordinated instruments 314 214 167 23 0.6 0.1 78.1 13.7
Total (1 + 2 + 3 + 4 + 5) 22,933 25,748 29,184 30,636 100.0 100.0 113.3 105.0
Source: CNB.
Table 14: Current and Contingent Government External Debt, end of period, in million EUR and %
2004 2005 2006 Aug. 2007Structure Indices
2006 Aug. 2007 2006/2005 Aug. 2007/2006
1. Public sector debt 8,580 8,500 8,250 8,728 28.3 28.5 97.1 105.8
2. Publicly guaranteed private sector debt 334 291 204 151 0.7 0.5 70.2 74.1
3. Non-publicly guaranteed private sector debt 14,019 16,956 20,730 21,756 71.0 71.0 122.3 105.0
Total (1 + 2 + 3) 22,933 25,748 29,184 30,636 100.0 100.0 113.3 105.0
Source: CNB.
Source: CNB.
Figure 79
CURRENCY STRUCTURE OF EXTERNAL DEBTas at 31 August 2007
EUR USD
CHF JPY
HRK Other currencies
75.2%
7.1%
9.0%
1.1%
0.3%7.4%
0
1
2
3
4
5
6
0
2
4
6
8
10
12
14
16
18
%
Figure 80
SHORT-TERM EXTERNAL DEBT
Source: CNB.
bill
ion
HR
K
Short-term debt
Short-term debt as % of total debt – right
1/0
1
7/0
1
1/0
2
7/0
2
1/0
3
7/0
3
1/0
4
7/0
4
1/0
5
7/0
5
1/0
6
7/0
6
1/0
7
7/0
7

CNB BULLETIN • NUMBER 130 • QUARTERLY REPORT • GOVERNMENT FINANCE
45
As for the maturity structure, the short-term debt fell in the first eight months of the year, mainly on account of the decrease in the short-term foreign liabilities of banks, pre-dominately currency and deposits. In contrast, enterprises increased their short-term liabilities in the reference period. Total short-term external debt stood at EUR 3.8bn at the end of August. It accounted for 12.6% of total external debt, down 2.6 percentage points on the end of 2006.
Although the recent data point to the slowdown in the growth of total external debt, its high absolute and relative levels indicate that its future movement will have to be moni-tored closely. In case of more pronounced shocks, such as a hike in interest rates, stronger depreciation of the domestic currency or the loss of confidence on the side of foreign in-vestors, the difficulties regarding the settlement of the current debt liabilities might materialise and thus negatively contrib-ute to the financial stability and economic developments in the country in general. In this regard, it is of utmost impor-tance that the government continues to borrow on the do-mestic market. As far as banks are concerned, it should be pointed out that the restrictions currently applied by the CNB will remain in force and thus probably contribute to further reduction in their external debt. Accordingly, it can be con-cluded that further changes in the overall external debt stock will for the most part depend on the external borrowing of enterprises to which the measures of the CNB do not apply.
International Liquidity
The index of exchange market pressure (IEMP)25 was fa-vourable in the second quarter of 2007, with its values fluc-tuating significantly less around the long-term average value in the reference period than in the previous periods. Although the international reserves have declined in the second quar-
ter of 2007, mainly due to lower allocations of foreign cur-rency reserve requirements (marginal reserve requirements included) and the absence of foreign exchange interventions, the favourable IEMP movement was the result of the concur-rent appreciation of the kuna/euro exchange rate. The July change in the IEMP value is attributed to the monthly rise in gross international reserves (stimulated by two CNB inter-ventions and net inflow of banks’ foreign exchange) and to the slight appreciation of the kuna exchange rate. The fall in reserves and the depreciation of the exchange rate in August contributed to a slight rise in the IEMP value, which however remained significantly below the critical level.26
Government FinanceFiscal Policy Features in the First Half of 2007
Fiscal trends were mostly positive in the first half of 2007. On an annual level, revenues rose twice faster than expen-ditures, while strong government investment activity contin-ued, reflecting, among others, new investments in road infra-structure. Such trends led to a substantial cut in the general government deficit, so that borrowing requirements reduced. Still, as the revised budget projects that expenditures and acquisition of non-financial assets will pick up pace in the second half of the year, a more complete estimate of public finance will be possible only when data for the entire 2007 become available.
In early July 2007, the Croatian parliament adopted the Government’s proposal on the revision of the 2007 govern-ment budget. The main reasons for the budget revision are the substantial revenue increase, which resulted from strong economic activity early in 2007, and the need to revise the amount and structure of expenditures. The Parliament also adopted revised financial plans of extrabudgetary users. The stated revision cut the consolidated general government defi-cit target from the originally planned 2.8% to 2.6% of GDP for 2007.
In July 2007, the Croatian government also adopted Eco-nomic and Fiscal Policy Guidelines for the period 2008-2010, which define objectives for the next three-year period. The reforms planned should cut the general government deficit and public debt to 0.5% and 37.1% respectively of GDP in 2010.
In line with the Act on the Enforcement of the Decision of the Constitutional Court of the Republic of Croatia of 12 May 199827 and the Pensioners’ Fund Act,28 the year 2007 has seen the continued repayment of the debt to pensioners. Although the related financial transactions are not included in the budget, they have important macroeconomic as well as fiscal implications as the government will have to ensure additional HRK 3.4bn for this purpose in 2007. Within this
25 IEMP is calculated as a weighted average of the monthly growth rate of the kuna/euro exchange rate (at end-period) and the monthly growth rate of gross international reserves (in euro terms), using standard deviations as weights.
–8
10
–6
–4
–2
0
2
4
6
8
Figure 81
INDEX OF EXCHANGE MARKET PRESSURE
Source: CNB.
IEMP
Average IEMP
Average IEMP + 2 standard deviations
Average IEMP 2 standard deviations–
1/0
1
7/0
1
1/0
2
7/0
2
1/0
3
7/0
3
1/0
4
7/0
4
1/0
5
7/0
5
1/0
6
7/0
6
1/0
7
7/0
7
26 The upper and lower critical levels are set as the average value of the IEMP increased (decreased) by two standard deviations. The value of the index above the critical levels indicates potential difficulties in the settle-ment of international payments.
27 OG 105/2004.28 OG 93/2005.

CNB BULLETIN • NUMBER 130 • QUARTERLY REPORT • GOVERNMENT FINANCE
46
amount, HRK 2.4bn relates to the payment of the last two instalments to the pensioners who opted for the so-called ac-celerated debt recovery at a 50% discount, some HRK 0.7bn will be needed for the payment of the first instalment to those pensioners who opted for the entire debt amount to be paid in the 6-year period and some HRK 0.3bn should be paid to beneficiaries of survivors’ and highest pensions, whose rights to debt repayment have also been recognised.29 The funds for the first 2007 instalment, which was paid in June (of HRK 1.4bn), were mostly raised by a loan that Hrvatska poštanska banka granted to the government. The funds for the second instalment, which is to be paid in December (of HRK 2.0bn), and for the repayment of the stated bank loan will be raised through the public offering of T-HT shares.
Consolidated General Government Revenues
According to preliminary MoF data, consolidated general government revenues reached HRK 59.9bn in the first six months of 2007, up as much as HRK 7bn or 13.1% over the same period last year. The largest contribution to the increase came from VAT, social contribution and profit tax revenues, with strong upturns recorded also in income tax revenues and revenues from administrative fees.
Tax revenues, which amounted to HRK 35.6bn in the first six months, increased by 12.7% on an annual level, slightly more than in the same period last year. VAT revenues, which prevail in the structure of tax revenues and account for some-what over 50% of the total, amounted to HRK 18bn in the observed period, up 11.2% on an annual level. This high growth rate partly reflects the tremendous rise in the retail trade turnover, and particularly the continuation of imports at high growth rates as almost 3/4 of these revenues refer to VAT paid for imports.
Excise revenues, the second most important source of tax revenues, amounted to HRK 5.7bn in the observed period, up 7.5% over the same period last year. The major share in the structure of total excise revenues was accounted for by excises on refined petroleum products (to ensure compara-bility of data with the previous periods, these data comprise revenues from levies for public road construction and main-tenance), which increased by 4.9% on an annual level in the observed period. However, the rise in revenues from excises on refined petroleum products should slow down in the rest of the year due to the Government’s ordinance, in force since May 2007, which reduced excises on all types of non-leaded petrol by 25 lipa per litre.30 In addition to revenues from ex-cises on refined petroleum products, the major contribution to the total increase in excise revenues came from excises on tobacco products, with revenues from excises on cars also growing strongly due to a high annual increase in the value of road vehicle imports.
Profit tax revenues, which have been completely allocated to the government budget since January 2007 due to the amended Act on the Financing of Local and Regional Self-
Government Units,31 went up 25.2% in the first half of the year, to HRK 5.3bn. As tax payers pay advance profit tax based on the tax return for the previous tax period, this huge growth in profit tax revenues reflects favourable performance of Croatian enterprises in 2006. Income tax revenues, cer-tain portions of which are distributed among the municipal-ity, city, county and government budgets, amounted to HRK 4.5bn in the first six months of 2007, up 13.4% over the same period last year. Among others, this growth was the result of the increase in the number of the employed and the annual rise in the average monthly gross wage. Revenues from social contributions, including health insurance contributions, pen-sion insurance contributions, employment contributions and contributions for the insurance against work injuries, went up 10.5%, to HRK 18bn.
Other revenues, including, inter alia, property income (in-terest and dividends), revenues from administrative fees and income from the sales of goods and services, totalled HRK 6.2bn in the January-June period of 2007, up 22.6% over the first half of 2006. Looking at individual categories, the strongest rise was recorded by revenues from dividends, ad-ministrative fees and rent. Other revenues are also expected to grow strongly in the rest of the year due to the September payment of extraordinary T-HT dividends of HRK 2.41bn, 42% of which was allocated to the government.
Consolidated General Government Expenditures
Consolidated general government expenditures totalled HRK 55.3bn in the first six months of 2007, rising by 6.7% over the same period last year. The main sources of the in-crease were expenditures on employee compensation, social benefits and the use of goods and services, whereas interest expense and expenditures on subsidies slightly decreased.
Expenditures for social benefits stood at HRK 23.2bn in the first half of 2007, growing annually by 5.3%. Social se-curity benefits, including the majority of pensions and health care expenditures (hospital health care, primary health care and medicaments on prescription) amounted to HRK 16.2bn, up 5.6% over the same period last year. Such developments were partly the outcome of the annual rise in the average pen-sion in the first half of the year (0.9%), slight growth in the number of pension beneficiaries (0.5%) and the major upturn in health care expenditures, primarily those related to hospital health care. Social assistance benefits, including child allow-ances, disability pensions, Croatian war veterans’ permanent rights and pension supplements amounted to HRK 6.9bn in the observed period, up 4% on an annual level.
Expenditures on employee compensation stood at HRK 15.1bn in the first half of 2007, HRK 12.9bn of which related to wages and salaries of civil servants and employees, and the rest related to social contributions paid from the government budget. Compared with the same period last year, expendi-tures on employee compensation rose by 9.4%, reflecting a slight increase in the number of civil servants and employees (0.9%) and growth in the average public sector wage (7.6%).
29 OG 19/2007.30 Ordinance on the change of excises on refined petroleum products (OG
44/2007). 31 OG 132/2006.

CNB BULLETIN • NUMBER 130 • QUARTERLY REPORT • GOVERNMENT FINANCE
47
The gross wage increase partly reflects a 6% increase in the calculation base for public administration wages compared with the previous year’s base.
Expenditures on the use of goods and services (inclusive of expenditures on telecommunication, postal, transport, intel-lectual and personal services and expenses on materials and energy) amounted to HRK 6.4bn in the first half of 2007, rising by 11.5% over the same period last year.
In the January-June period, expenditures on subsidies amounted to HRK 3.4bn, mostly holding steady relative to the same period last year. Subsidies to public corporations, which are predominated by subsidies to the Croatian Rail-ways, remained flat. In contrast, subsidies to private enter-prises slightly declined in the observed period, to HRK 1.7bn, down 3.1% compared with the first half of 2006. The major portion of these subsidies was channelled to private farmers, craftsmen and small and medium-sized entrepreneurs.
In the January-June period of 2007, interest expense stood at HRK 3.1bn, of which HRK 1.6bn, or 10% less than in the same period of 2006, related to foreign interest expense, which fell due to a reduction in general government external debt. In the same period, domestic interest expense increased by 6.1%, amounting to HRK 1.5bn.
Operating Balance and Transactions in Non-Financial Assets and Financial Assets and Liabilities
The net operating balance or the difference between rev-enues and expenditures at the consolidated general govern-ment level was a positive HRK 4.6bn, four times more than the net operating balance in the first six months of 2006. Government investments continued to grow strongly in the same period so that its non-financial assets, which ac-cording to the GFS 2001 methodology include, inter alia, buildings, roads, highways, bridges and land, increased by HRK 3.9bn. Expenditures on the acquisition of non-financial assets reached HRK 4.5bn, reflecting to a large extent the continuance of relatively strong government activities related to the construction of road infrastructure. The same period saw an increase in the disposal of non-financial assets, result-ing primarily from the increased disposal of strategic stocks,
whereas the disposal of fixed assets levelled off compared with 2006.
According to MoF data, financial assets of the consoli-dated general government sharply increased (HRK 1.4bn) in the observed period. This was almost entirely the result of the rise in domestic financial assets, whereas foreign financial as-sets recorded no major changes. The net increase in domestic financial assets was due to an extraordinary upturn in money and deposits. As the government budget and extrabudget-ary users ran a surplus in the observed period, their surplus funds were deposited with commercial banks and the CNB and are to be used in the rest of the year when expenditures and public investments are projected to pick up pace.
In the first six months of 2007, consolidated general gov-ernment liabilities increased by HRK 0.6bn, with domestic liabilities, in contrast with foreign liabilities, steadily trending up. Developments in liabilities were largely the result of new domestic and foreign borrowing of the CM whose positive net operating balance was insufficient for new investment financing. Liabilities decreased on the budgetary central gov-ernment level as a result of foreign loan repayment, whereas domestic liabilities continued to trend up in the observed pe-riod.
Consolidated General Government Balance on a Cash Basis
The consolidated general government deficit, exclusive of capital revenues (on a cash basis, GFS 1986), stood at HRK 0.3bn in the first six months of 2007. Extrabudgetary users recorded the largest deficit (HRK 1bn), followed by local and regional self-government units (HRK 0.1bn), while budget-ary central government ran a surplus (HRK 0.7bn).
Compared with the same period of 2006, the deficit was cut by as much as HRK 3.6bn. The major fiscal adjustment was achieved on the budgetary central government level. Fol-lowing a HRK 2.3bn deficit recorded in the first six months of 2006, a surplus of HRK 0.7bn recorded in the same period this year was mostly the result of the revenue increase out-pacing the expenditure increase. The deficit of extrabudget-ary users was cut by HRK 0.4bn, entirely due to the reduc-
Table 15: Operating Balance and Transactions in Non-Financial Assets and Financial Assets and Liabilities, GFS 2001, in million HRK
Consolidated general government
Jan.–Jun. 2006 Jan.–Jun. 2007 Jan.–Jun. 2007 / Jan.–Jun. 2006
1. Change in net worth (net operating balance) 1,131.2 4,617.3 408
1.1. Revenue 52,963 59,914 113
1.2. Expense 51,831 55,297 107
2. Change in net non-financial assets 3,788.0 3,878.4 102
2.1. Acquisition of non-financial assets 4,266 4,504 106
2.2. Disposal of non-financial assets 479 626 131
3. Net lending (+) / borrowing (–) (1–2) –2,656.8 738.9 –
3. Financing (5–4) Transactions in financial assets and liabilities 2,656.8 –738.9 –
4. Change in financial assets –459.4 1,386.2 –
4.1. Domestic –462 1,378 –
4.2. Foreign 3 8 300
5. Change in liabilities 2,197.4 647.3 29
5.1. Domestic 5,246 1,088 21
5.2. Foreign –3,049 –441 14
Note: On a cash basis. Source: MoF.

CNB BULLETIN • NUMBER 130 • QUARTERLY REPORT • GOVERNMENT FINANCE
48
tion in the CR deficit. By contrast, the CM deficit increased by almost 16% on an annual level in the January-June period of 2007 due to strong growth in interest expense and ex-penditures on the use of goods and services. A slight deficit expansion was recorded at the local government level.
Government Debt
CNB data show that general government debt, including CBRD debt, stood at HRK 113.6bn at end-June 2007, 56.6% of which was accounted for by domestic debt and the rest was accounted for by external debt. Debt increased by HRK 3.2bn from end-2006, which is much more than both the consolidated general government deficit in the same period and the increase in general government liabilities according to MoF statistics. Among others, such diverse debt and deficit dynamics reflect the fact that the consolidated general gov-ernment according to MoF statistics excludes the CBRD.32 In addition, the budgetary treatment of the pensioners’ debt repayment also adds to divergent developments in the defi-cit and general government debt. As the debt repayment is not treated as the budgetary expenditure, the short-term loan from Hrvatska poštanska banka, which was used to finance this year’s first tranche of the pensioners’ debt repayment,
has not been included in the budget. The MoF considers the debt repayment as the settlement of a liability created in the 1990s and hence believes that it should be reported as a part of the 1990s’ budgetary deficit, and not as the deficit of the current period of debt repayment. On the other hand, Hrvat-ska poštanska banka has reported this loan as a claim on the government, so that the CNB statistics included the loan in general government debt.
Potential government debt based on government guaran-tees issued expanded by HRK 0.8bn in the first six months of 2007, much more compared with a slight increase recorded in the same period of 2006. If domestic and foreign guaran-tees were added to general government debt, the total general government debt stood at HRK 128.5bn at the end of the first half of 2007.
Domestic General Government Debt
As shown by CNB data, domestic general government debt amounted to HRK 63.9bn at end-June 2007, a rise of HRK 2.8bn over the end-2006 balance. According to gov-ernment level, almost 90% of domestic general government debt was accounted for at the level of the Republic of Croatia, slightly less than 10% was accounted for by central govern-
Table 16: Consolidated General Government Balance, on a cash basis, in million HRK
Jan.–Jun. 2007
Budgetary central government
Extrabudgetary users
Consolidated central government
Units of local and regional self-government
Consolidated general government
Revenuea 51,563 3,688 53,686 6,967 59,914
Total expenditure and net lending 50,838 4,658 53,930 7,056 60,248
Expensea 49,702 2,543 50,680 5,355 55,297
Acquisition of non-financial assetsa 763 2,058 2,821 1,683 4,504
Net acquisition of financial assets – loansa 266 37 304 8 312
Acquisition of shares and other equitya 107 20 127 7 134
Acquisition of securities other than sharesa 0 0 0 0 0
Acquisition of other accounts receivablea 0 0 0 1 1
GFS 1986 balance 725 –970 –245 –89 –334a GFS 2001. Source: MoF.
Table 17: Government Debt, end of period, in million HRK
Stock Change
Dec. 2005 Jun. 2006 Dec. 2006 Jun. 2007 Jan.–Jun. 2006 Jan.–Jun. 2007
A. General government debt (1+2) 101,426.8 102,717.4 102,683.2 104,445.9 1,290.7 1,762.7
1. Domestic general government debt 56,046.5 61,153.7 61,077.4 63,869.4 5,107.2 2,792.1
1.1. Domestic debt of the Republic of Croatia 50,559.5 55,440.1 54,216.7 56,616.2 4,880.6 2,399.5
1.2. Domestic debt of central government funds 3,935.0 4,296.4 5,168.2 5,540.7 361.4 372.4
1.3. Domestic debt of local government 1,551.9 1,417.2 1,692.4 1,712.6 –134.7 20.2
2. External general government debt 45,380.3 41,563.7 41,605.9 40,576.5 –3,816.5 –1,029.4
2.1. External debt of the Republic of Croatia 36,414.5 32,637.6 32,540.0 31,159.9 –3,777.0 –1,380.1
2.2. External debt of central government funds 8,749.8 8,769.7 8,913.4 9,244.3 19.9 330.9
2.3. External debt of local government 216.0 156.5 152.5 172.3 –59.5 19.8
B. CBRD debt (1+2) 7,139.4 7,012.1 7,688.2 9,125.1 –127.3 1,436.8
1. CBRD domestic debt 534.2 659.4 293.2 357.9 125.2 64.8
2. CBRD external debt 6,605.1 6,352.7 7,395.1 8,767.1 –252.5 1,372.0
Supplement:
C. Total guarantees issued by the Republic of Croatia 12,383.8 12,395.4 14,085.9 14,935.8 11.7 850.0
1. Domestic 5,268.5 5,646.0 7,252.3 8,157.9 377.6 905.6
2. Foreign 7,115.3 6,749.4 6,833.5 6,777.9 –365.9 –55.6
Source: CNB.
32 In the CNB statistics, the institutional sector of the central government includes the CBRD.

CNB BULLETIN • NUMBER 130 • QUARTERLY REPORT • GOVERNMENT FINANCE
49
ment funds, and the rest by local government units.The major portion of the debt rise related to the increase
in debt arising from bonds issued, and a lesser portion re-lated to loans received and T-bills. A new kuna bond worth a nominal HRK 2.5bn and maturing in ten years was issued in the domestic market in February 2007. The remaining part of the increase in domestic general government debt in the ob-served period was attributable to T-bills issued (HRK 0.3bn) and loans received from domestic banks (HRK 0.2bn). In line with the public debt management strategy, these trends confirm the government’s intention to increase the share of long-term and domestic currency denominated debt in the total debt structure.
CBRD domestic debt stood at HRK 0.3bn at end-June 2007, down HRK 0.1bn compared with end-2006 due to the decrease in liabilities arising from bonds issued.
External General Government Debt
External general government debt stood at HRK 40.6bn at end-June 2007, which was a decrease of HRK 1bn compared with end-2006. At the Republic of Croatia level, external debt was reduced by HRK 1.4bn as a result of the EUR 30m pay-ment to the London Club for series A bonds and interest pay-ments on other international government bond issues. Also decreased were liabilities arising from foreign loans, inter alia, due to the repayment of regular liabilities to the Paris Club. In addition, the strengthening of the kuna against the euro, US dollar and Japanese yen led to a statistical decrease in the debt. At the same time, external debt of central government funds increased by HRK 0.3bn compared with end-2006, mostly because of new borrowings by the CM.
CBRD external debt increased by HRK 1.5bn in the first half of 2007 due to the rise in liabilities arising from bonds issued. Specifically, the CBRD issued EUR 250m worth of bonds in the foreign market.
Trends in July 2007
Government finance data at the consolidated general gov-ernment level are available on a quarterly basis so that the budget outturn data for July 2007 are analysed at the consoli-dated central government level. MoF data suggest that a steep rise in revenues recorded in the first half of 2007 continued into July. Consolidated central government revenues stood at HRK 9.9bn in July, up 12.6% over the same month last year. This was mostly the outcome of the strong upturn in profit tax, VAT and social contribution revenues. From the cumu-lative standpoint, consolidated central government revenues stood at HRK 63.5bn in the first seven months of 2007, up 13.5% compared with the same period of 2006.
Consolidated central government expenditures stood at HRK 8.7bn in July, up 7.9% over July 2006. The major impe-tus to total expenditure growth was provided by the dynam-ics of expenditures on employee compensation, social ben-efits and the use of goods and services. From the cumulative standpoint, consolidated central government expenditures stood at HRK 59.4bn in the January-July period of 2007, up 6.7% over the same period last year. In addition to these expenditures, the government spent large amounts for the acquisition of non-financial assets (HRK 3.8bn in the first seven months of 2007).
A huge upturn in revenues coupled with moderate ex-penditure growth and the continuation of strong public in-
Table 18: Domestic General Government Debt, end of period, in million HRK
Stock Change
Dec. 2005 Jun. 2006 Dec. 2006 Jun. 2007 Jan.–Jun. 2006 Jan.–Jun. 2007
1. Domestic general government debt 56,046.5 61,153.7 61,077.4 63,869.4 5,107.2 2,792.1
1.1. Domestic debt of the Republic of Croatia 50,559.5 55,440.1 54,216.7 56,616.2 4,880.6 2,399.5
Treasury bills 12,533.4 12,647.4 12,662.2 12,956.3 114.0 294.1
Bonds 30,716.0 31,025.6 34,827.9 36,732.6 309.6 1,904.6
Money market instruments 0.9 – – – –0.9 –
Credits from banks 7,309.2 11,767.1 6,726.6 6,927.4 4,457.9 200.8
1.2. Domestic debt of central government funds 3,935.0 4,296.4 5,168.2 5,540.7 361.4 372.4
Bonds – – – – – –
Credits from banks 3,935.0 4,296.4 5,168.2 5,540.7 361.4 372.4
1.3. Domestic debt of local government 1,551.9 1,417.2 1,692.4 1,712.6 –134.7 20.2
Supplement: Issued guarantees 5,268.5 6,226.3 7,252.3 8,050.9 957.8 798.6
Source: CNB.
Table 19: External General Government Debt, end of period, in million HRK
Stock Change
Dec. 2005 Jun. 2006 Dec. 2006 Jun. 2007 Jan.–Jun. 2006 Jan.–Jun. 2007
1. External general government debt 45,380.3 41,563.7 41,605.9 40,576.5 –3,816.5 –1,029.4
1.1. External debt of the Republic of Croatia 36,414.5 32,637.6 32,540.0 31,159.9 –3,777.0 –1,380.1
Bonds 27,020.1 22,794.0 22,836.9 21,950.1 –4,226.1 –886.8
Credits 9,394.5 9,843.6 9,703.1 9,209.8 449.1 –493.3
1.2. External debt of central government funds 8,749.8 8,769.7 8,913.4 9,244.3 19.9 330.9
Credits 8,749.8 8,769.7 8,913.4 9,244.3 19.9 330.9
1.3. External debt of local government 216.0 156.5 152.5 172.3 –59.5 19.8
Credits 216.0 156.5 152.5 172.3 –59.5 19.8
Supplement: Issued guarantees 7,186.7 6,410.9 6,847.2 6,859.3 –775.8 12.0
Source: CNB.

CNB BULLETIN • NUMBER 130 • QUARTERLY REPORT • GOVERNMENT FINANCE
50
vestments in the first seven months of 2007 led to the con-solidated central government deficit (on a cash basis, GFS 1986) of HRK 0.2bn, down HRK 3.7bn relative to the same period last year. The deficit was financed by domestic bor-rowing, with a portion of thus raised funds being used to settle due foreign liabilities.
Central government debt, excluding CBRD debt, stood at HRK 101.9bn at end-July, down HRK 0.6bn relative to end-June, but HRK 1.1bn up relative to end-2006. Domes-tic central government debt increased by HRK 1.4bn on a monthly level in July 2007, almost entirely in consequence of new loans received from domestic banks. The government obtained a short-term foreign currency loan of EUR 244.5m from a domestic bank syndicate in July to repay due Samurai bonds. The government thus continues to refinance its due
foreign liabilities by domestic market funds, in an effort to reduce its external exposure. This year as well, such efforts have been supported by the central bank, which temporarily amended the Decision on the minimum required amount of foreign currency claims. The amendments to the said Decision have enabled each bank to include the amount with which it participates in the loan in its minimum required foreign cur-rency claims. On the other hand, liabilities based on issued bonds were almost stagnant in July, although the government then issued 10-year kuna bonds worth HRK 3bn. The funds thus raised were used to repay EUR 400m of 3-year domestic eurobonds. External central government debt shrank by HRK 2bn in July as a result of the repayment of JPY 40bn (around HRK 1.7bn) worth of Samurai bonds and the second regular repayment due to the London Club.

Statistical Survey


CNB BULLETIN • NUMBER 130 • STATISTICAL SURVEY
53
Classification and Presentation of Data on Claims and Liabilities
Data on financial institutions’ claims and liabilities are classified according to institutional sectors and financial instruments. Insti-tutional sectors are: financial institutions, central government and funds, other domestic sectors and foreign sector.
The financial institutions sector includes the following subsec-tors: monetary authorities (the central bank), banks, other banking institutions and non-banking financial institutions. The central bank is the Croatian National Bank (CNB). Banks are institutions to which the Croatian National Bank has issued a license to perform banking business services in accordance with the Banking Act, including sav-ings banks during a transition period. Data on banks do not include claims and liabilities of banks undergoing bankruptcy proceedings, nor former branches of banks headquartered outside the Republic of Croatia. Other banking institutions comprise housing savings banks, savings and loan cooperatives and investment funds. Non-banking financial institutions are financial institutions not classified as banks or other banking institutions (e.g. insurance companies, pension funds).
The central government and funds consists of two subsectors, the Republic of Croatia and central government funds. Until December 2003, the subsector Republic of Croatia included government au-thorities, comprising the Croatian Roads, the Croatian Motorways
and the State Agency for Deposit Insurance and Bank Rehabilitation, and the subsector central government funds included the Croatian Institute for Health Insurance, the Croatian Pension Insurance Ad-ministration, the Croatian Employment Service, the Croatian Priva-tisation Fund, the Croatian Waters and the Croatian Bank for Recon-struction and Development.
Since January 2004, the Croatian Roads, the Croatian Highways, and the State Agency for Deposit Insurance and Bank Rehabilitation have been reclassified, from the subsector Republic of Croatia to the subsector central government funds.
Other domestic sectors include local government authorities, pub-lic and other enterprises and households, including craftsmen and non-profit institutions providing services to households. The subsec-tor other enterprises also comprises banks undergoing bankruptcy proceedings. In some tables other domestic sectors are divided into the following subsectors: local government (which comprises units of local and regional self-government), public and other enterprises, and households (including craftsmen and non-profit institutions).
Foreign sector includes foreign legal and natural persons.All data on claims and liabilities refer to balances at the end of the
reporting period. Foreign currency items are reported in their kuna equivalent at the CNB’s midpoint exchange rate at the end of the reporting period.
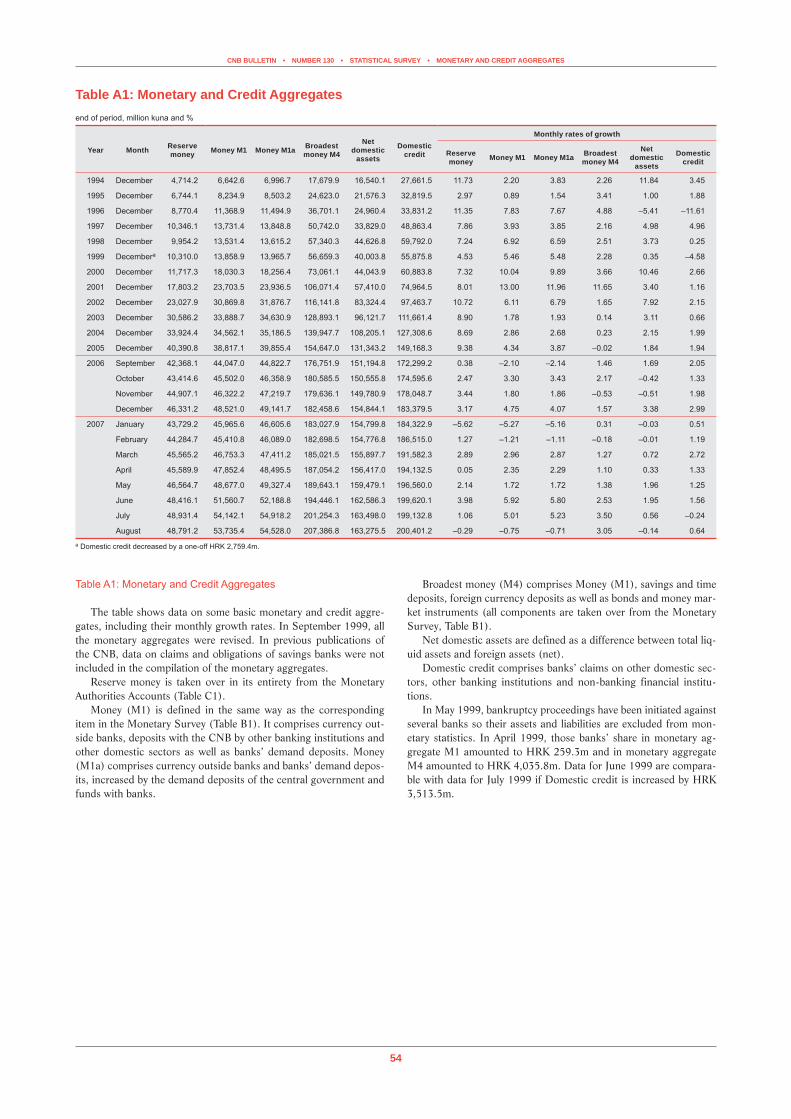
CNB BULLETIN • NUMBER 130 • STATISTICAL SURVEY • MONETARY AND CREDIT AGGREGATES
54
Table A1: Monetary and Credit Aggregates
The table shows data on some basic monetary and credit aggre-gates, including their monthly growth rates. In September 1999, all the monetary aggregates were revised. In previous publications of the CNB, data on claims and obligations of savings banks were not included in the compilation of the monetary aggregates.
Reserve money is taken over in its entirety from the Monetary Authorities Accounts (Table C1).
Money (M1) is defined in the same way as the corresponding item in the Monetary Survey (Table B1). It comprises currency out-side banks, deposits with the CNB by other banking institutions and other domestic sectors as well as banks’ demand deposits. Money (M1a) comprises currency outside banks and banks’ demand depos-its, increased by the demand deposits of the central government and funds with banks.
Broadest money (M4) comprises Money (M1), savings and time deposits, foreign currency deposits as well as bonds and money mar-ket instruments (all components are taken over from the Monetary Survey, Table B1).
Net domestic assets are defined as a difference between total liq-uid assets and foreign assets (net).
Domestic credit comprises banks’ claims on other domestic sec-tors, other banking institutions and non-banking financial institu-tions.
In May 1999, bankruptcy proceedings have been initiated against several banks so their assets and liabilities are excluded from mon-etary statistics. In April 1999, those banks’ share in monetary ag-gregate M1 amounted to HRK 259.3m and in monetary aggregate M4 amounted to HRK 4,035.8m. Data for June 1999 are compara-ble with data for July 1999 if Domestic credit is increased by HRK 3,513.5m.
Table A1: Monetary and Credit Aggregatesend of period, million kuna and %
Year Month Reserve money Money M1 Money M1a Broadest
money M4
Net domestic
assets
Domestic credit
Monthly rates of growth
Reserve money Money M1 Money M1a Broadest
money M4
Net domestic
assets
Domestic credit
1994 December 4,714.2 6,642.6 6,996.7 17,679.9 16,540.1 27,661.5 11.73 2.20 3.83 2.26 11.84 3.45
1995 December 6,744.1 8,234.9 8,503.2 24,623.0 21,576.3 32,819.5 2.97 0.89 1.54 3.41 1.00 1.88
1996 December 8,770.4 11,368.9 11,494.9 36,701.1 24,960.4 33,831.2 11.35 7.83 7.67 4.88 –5.41 –11.61
1997 December 10,346.1 13,731.4 13,848.8 50,742.0 33,829.0 48,863.4 7.86 3.93 3.85 2.16 4.98 4.96
1998 December 9,954.2 13,531.4 13,615.2 57,340.3 44,626.8 59,792.0 7.24 6.92 6.59 2.51 3.73 0.25
1999 Decembera 10,310.0 13,858.9 13,965.7 56,659.3 40,003.8 55,875.8 4.53 5.46 5.48 2.28 0.35 –4.58
2000 December 11,717.3 18,030.3 18,256.4 73,061.1 44,043.9 60,883.8 7.32 10.04 9.89 3.66 10.46 2.66
2001 December 17,803.2 23,703.5 23,936.5 106,071.4 57,410.0 74,964.5 8.01 13.00 11.96 11.65 3.40 1.16
2002 December 23,027.9 30,869.8 31,876.7 116,141.8 83,324.4 97,463.7 10.72 6.11 6.79 1.65 7.92 2.15
2003 December 30,586.2 33,888.7 34,630.9 128,893.1 96,121.7 111,661.4 8.90 1.78 1.93 0.14 3.11 0.66
2004 December 33,924.4 34,562.1 35,186.5 139,947.7 108,205.1 127,308.6 8.69 2.86 2.68 0.23 2.15 1.99
2005 December 40,390.8 38,817.1 39,855.4 154,647.0 131,343.2 149,168.3 9.38 4.34 3.87 –0.02 1.84 1.94
2006 September 42,368.1 44,047.0 44,822.7 176,751.9 151,194.8 172,299.2 0.38 –2.10 –2.14 1.46 1.69 2.05
October 43,414.6 45,502.0 46,358.9 180,585.5 150,555.8 174,595.6 2.47 3.30 3.43 2.17 –0.42 1.33
November 44,907.1 46,322.2 47,219.7 179,636.1 149,780.9 178,048.7 3.44 1.80 1.86 –0.53 –0.51 1.98
December 46,331.2 48,521.0 49,141.7 182,458.6 154,844.1 183,379.5 3.17 4.75 4.07 1.57 3.38 2.99
2007 January 43,729.2 45,965.6 46,605.6 183,027.9 154,799.8 184,322.9 –5.62 –5.27 –5.16 0.31 –0.03 0.51
February 44,284.7 45,410.8 46,089.0 182,698.5 154,776.8 186,515.0 1.27 –1.21 –1.11 –0.18 –0.01 1.19
March 45,565.2 46,753.3 47,411.2 185,021.5 155,897.7 191,582.3 2.89 2.96 2.87 1.27 0.72 2.72
April 45,589.9 47,852.4 48,495.5 187,054.2 156,417.0 194,132.5 0.05 2.35 2.29 1.10 0.33 1.33
May 46,564.7 48,677.0 49,327.4 189,643.1 159,479.1 196,560.0 2.14 1.72 1.72 1.38 1.96 1.25
June 48,416.1 51,560.7 52,188.8 194,446.1 162,586.3 199,620.1 3.98 5.92 5.80 2.53 1.95 1.56
July 48,931.4 54,142.1 54,918.2 201,254.3 163,498.0 199,132.8 1.06 5.01 5.23 3.50 0.56 –0.24
August 48,791.2 53,735.4 54,528.0 207,386.8 163,275.5 200,401.2 –0.29 –0.75 –0.71 3.05 –0.14 0.64a Domestic credit decreased by a one-off HRK 2,759.4m.

CNB BULLETIN • NUMBER 130 • STATISTICAL SURVEY • MONETARY INSTITUTIONS
55
Table B1: Monetary Surveyend of period, million kuna
2001Dec.a
2002Dec.
2003Dec.
2004Dec.
2005Dec.
2006Dec.
2007
Mar. Jun. Jul. Aug.
ASSETS
1. Foreign assets (net) 48,661.3 32,817.4 32,771.4 31,742.6 23,303.8 27,614.5 29,123.8 31,859.8 37,756.3 44,111.3
2. Domestic credit 87,637.6 112,518.9 126,372.0 141,278.1 168,427.7 200,328.9 209,243.1 215,740.2 218,028.5 219,778.8
2.1. Claims on central government and funds (net)
12,673.1 15,055.2 14,710.6 13,969.6 19,259.4 16,949.4 17,660.8 16,120.0 18,895.7 19,377.6
2.2. Claims on other domestic sectors 74,513.0 96,329.0 110,467.8 125,790.7 147,414.3 181,031.9 189,738.0 197,749.9 197,408.8 198,568.8
2.3. Claims on other banking institutions 170.2 219.5 431.8 624.0 592.2 1,029.5 675.0 476.8 454.8 570.4
2.4. Claims on non-banking financial institutions
281.4 915.3 761.8 893.9 1,161.8 1,318.1 1,169.3 1,393.5 1,269.1 1,262.1
Total (1+2) 136,298.9 145,336.3 159,143.4 173,020.7 191,731.5 227,943.3 238,366.9 247,599.9 255,784.8 263,890.1
LIABILITIES
1. Money 23,703.5 30,869.8 33,888.7 34,562.1 38,817.1 48,521.0 46,753.3 51,560.7 54,142.1 53,735.4
2. Savings and time deposits 10,213.1 13,001.1 18,370.7 22,479.2 27,992.1 44,836.8 46,765.9 49,832.0 50,364.3 51,297.6
3. Foreign currency deposits 71,836.9 72,054.6 76,035.3 81,742.9 86,760.8 88,256.7 90,699.6 92,041.8 95,950.9 101,717.9
4. Bonds and money market instruments 317.8 216.3 598.4 1,163.5 1,077.0 844.1 802.7 1,011.6 797.1 635.8
5. Restricted and blocked deposits 1,926.2 1,729.5 1,721.6 2,067.0 2,092.3 2,504.5 2,753.5 2,757.9 2,499.2 2,401.0
6. Other items (net) 28,301.4 27,465.1 28,528.7 31,006.1 34,992.2 42,980.2 50,592.0 50,396.0 52,031.3 54,102.3
Total (1+2+3+4+5+6) 136,298.9 145,336.3 159,143.4 173,020.7 191,731.5 227,943.3 238,366.9 247,599.9 255,784.8 263,890.1a The first revaluation of securities with the effect of HRK 165.5m was conducted within the CNB’s international reserves as at 31 December 2001. Accrued interest on deposits, with the effect of HRK 63.8m, was included in the international reserves as at 31 December 2001 as well. The CNB’s foreign liabilities increased by HRK 6.4m on the basis of accrued interest, while liabilities on the basis of required foreign currency reserves increased by HRK 8.6m.
Table B1: Monetary Survey
The monetary survey shows consolidated data from the Monetary Authorities Accounts (Table C1) and Banks’ Accounts (Table D1).
Foreign assets (net) are the difference between total foreign assets and total foreign liabilities of the CNB and banks.
Domestic credit is the sum of corresponding items from Mon-etary Authorities Accounts and Banks’ Accounts. Claims on central government and funds are reported on a net basis, i.e. decreased by central government and funds’ deposits with the CNB and banks.
Money is the sum of currency outside banks, deposits by other
banking institutions with the CNB, deposits by other domestic sec-tors with the CNB and banks’ demand deposits (item Demand de-posits in Banks’ Accounts, Table D1).
Items Savings and time deposits, Foreign currency deposits as well as Bonds and money market instruments are entirely taken over from the Banks’ Accounts, while item Restricted and blocked depos-its represents the sum of corresponding items from the Monetary Au-thorities Accounts (excluding banks’ blocked deposits with the CNB) and Banks’ Accounts. Other items (net) are unclassified liabilities decreased by unclassified assets.

CNB BULLETIN • NUMBER 130 • STATISTICAL SURVEY • MONETARY INSTITUTIONS
56
Table B2: Number of Reporting Banks and Savings Banks and their Classification by Total Assets
Year Month
Total number of reporting
banks
Reporting banks classified according to their total assetsTotal number of reporting
savings banks
Savings banks classified according to their total assets
Less than 100 million
kuna
100 million kuna to less
than 500 million kuna
500 million kuna to less than 1 billion
kuna
1 billion kuna to less than 2 billion
kuna
2 billion kuna to less than
10 billion kuna
10 billion kuna and
over
Less than 10 million
kuna
10 million kuna to less
than 100 million kuna
100 million kuna and
over
1 2 3 4 5 6 7 8 9 10 11 12 13
1994 December 50 13 21 6 6 2 2 33 22 9 2
1995 December 53 15 20 7 7 2 2 21 7 13 1
1996 December 57 10 26 6 9 4 2 22 10 11 1
1997 December 60 4 28 9 8 9 2 33 12 18 3
1998 December 60 3 26 8 11 10 2 33 4 25 4
1999 December 53 4 23 7 7 10 2 30 5 21 4
2000 December 45 3 15 9 6 10 2 29 5 19 5
2001 December 44 3 13 7 7 10 4 21 4 12 5
2002 December 46 4 13 7 9 8 5 10 3 5 2
2003 December 42 2 13 8 5 8 6 7 3 2 2
2004 December 39 1 12 9 6 5 6 6 3 3 –
2005 December 36 1 10 6 8 5 6 3 2 1 –
2006 September 35 2 7 7 7 4 8 3 2 1 –
October 35 2 7 4 10 4 8 3 2 1 –
November 35 2 7 5 9 4 8 3 2 1 –
December 35 2 6 5 10 4 8 3 2 1 –
2007 January 35 2 7 4 10 4 8 3 2 1 –
February 35 2 7 4 10 4 8 3 2 1 –
March 35 2 6 5 10 4 8 3 2 1 –
April 35 2 6 5 10 4 8 3 2 1 –
May 35 2 5 5 11 4 8 3 2 1 –
June 35 2 5 5 11 3 9 2 1 1 –
July 35 2 5 5 10 4 9 2 1 1 –
August 35 2 5 5 9 5 9 2 1 1 –
Table B2: Number of Reporting Banks and Savings Banks and their Classification by Total Assets
The table shows the total number of banks and savings banks during the transition period which report monthly to the CNB. Their operations are shown in the Banks’ Accounts. Monetary statistics includes reporting institutions under winding-up and, until February 2005, institutions whose operating licences have been revoked, but
which have not initiated winding-up proceedings.Special reporting requirements applied to savings banks until
June 1995. Savings banks were not legally obliged to report on their operations, so that data up to June 1995 relate only to those savings banks that reported voluntarily to the CNB. From July 1995 on, the data cover all registered savings banks.
The table also shows the classification of reporting banks and sav-ings banks according to their total assets.

CNB BULLETIN • NUMBER 130 • STATISTICAL SURVEY • MONETARY AUTHORITIES
57
Table C1: Monetary Authorities Accountsend of period, million kuna
2001Dec.
2002Dec.
2003Dec.
2004Dec.
2005Dec.
2006Dec.
2007
Mar. Jun. Jul. Aug.
ASSETS
1. Foreign assets 39,308.9 42,058.8 50,118.6 49,373.4 54,862.5 64,088.2 70,279.2 66,973.2 68,683.3 67,507.0
1.1. Gold – – – – – – – – – –
1.2. Holdings of SDRs 905.8 17.4 5.0 4.8 6.3 5.3 5.7 5.9 9.2 5.3
1.3. Reserve position in the IMF 1.8 1.6 1.5 1.4 1.4 1.3 1.3 1.3 1.3 1.3
1.4. Currency and demand deposits with foreign banks 6.1 6.4 5.8 5.7 7.7 7.2 26.3 26.4 26.1 26.1
1.5. Time deposits with foreign banks 25,565.9 28,183.2 25,580.7 24,337.7 28,274.1 33,243.0 38,638.0 35,769.7 36,863.8 35,280.8
1.6. Securities in f/c 12,829.3 13,850.0 24,525.5 25,023.7 26,573.0 30,831.2 31,607.9 31,169.8 31,782.9 32,193.4
1.7. Non-convertible foreign exchange 0.0 0.0 0.0 0.0 0.0 0.0 0.0 0.0 0.0 0.0
2. Claims on central government and funds – 0.5 1.4 3.3 1.4 0.9 – – – 0.8
2.1. Claims in kuna – 0.5 1.4 3.3 1.4 0.9 – – – 0.8
2.2. Claims in f/c – – – – – – – – – –
3. Claims on other domestic sectors 229.2 110.6 93.6 82.9 73.4 64.0 64.0 64.0 64.0 68.0
4. Claims on banks 18.5 17.9 972.0 408.9 4,215.6 3,911.5 2,639.5 5,670.4 4,954.3 4,915.6
4.1. Credits to banks 16.6 17.6 968.9 408.9 4,215.6 3,911.5 2,639.5 5,670.4 4,954.3 4,915.6
Lombard credits – – 954.4 – – – – 372.6 – –
Short-term liquidity credits – – – – – – – – – –
Other credits 16.6 17.6 14.5 15.0 14.5 14.5 14.7 14.7 14.5 14.5
Reverse repo transactions – – – 394.0 4,201.1 3,897.0 2,624.8 5,283.1 4,939.8 4,901.1
4.2. Overdue claims 1.9 0.3 3.1 – – – – – – –
5. Claims on other banking institutions – – – – – – – – – –
Total (1+2+3+4+5) 39,556.6 42,187.7 51,185.6 49,868.5 59,153.0 68,064.6 72,982.8 72,707.6 73,701.7 72,491.5
LIABILITIES
1. Reserve money 17,803.2 23,027.9 30,586.2 33,924.4 40,390.8 46,331.2 45,565.2 48,416.1 48,931.4 48,791.2
1.1. Currency outside banks 8,507.4 9,680.9 10,573.1 10,955.6 12,163.8 14,609.3 14,381.9 16,079.8 16,763.3 16,497.8
1.2. Banks' cash in vaults 538.8 1,214.8 1,683.2 1,871.0 2,210.7 2,698.0 2,318.8 2,996.6 2,864.7 2,949.1
1.3. Banks' deposits 8,741.5 12,109.4 18,329.3 21,082.6 26,016.3 29,023.9 28,864.5 29,339.7 29,303.4 29,344.3
Settlement accounts 2,450.1 3,923.4 5,616.0 6,408.2 8,411.1 8,535.7 7,652.1 7,722.5 7,511.4 7,356.6
Statutory reserves 6,291.4 8,186.0 12,603.9 14,674.4 17,605.2 20,478.2 21,212.4 21,433.7 21,784.5 21,843.2
CNB bills on obligatory basis – – 109.4 – – – – 167.4 0.0 144.5
Overnight deposits – – – – – 10.0 – 16.0 7.5 –
1.4. Deposits of other banking institutions 15.5 19.1 – – – – – – – –
1.5. Deposits of other domestic sectorsb 0.1 3.5 0.6 15.1 – – – – – –
2. Restricted and blocked deposits 6,030.5 7,091.2 6,699.2 10,777.1 13,551.8 16,633.5 21,683.8 18,771.0 19,322.0 17,499.9
2.1. Statutory reserve in f/c 5,705.1 7,042.3 6,686.6 10,764.7 13,495.9 16,576.7 21,616.1 18,711.0 19,285.6 17,470.9
2.2. Restricted deposits 325.4 49.0 12.6 12.4 55.9 56.9 67.7 60.0 36.4 29.0
2.3. Escrow deposits – – – – – – – – – –
3. Foreign liabilities 1,597.5 195.7 2,798.0 18.1 18.9 18.9 15.7 17.0 15.6 15.7
3.1. Use of IMF credit 1,025.5 2.8 0.0 – – – – – – –
3.2. Liabilities to international organisations 12.2 12.6 19.6 18.1 18.9 18.9 15.7 17.0 15.6 15.7
3.3. Liabilities to foreign banksa 559.8 180.2 2,778.5 – – – – – – –
4. Central government and funds' deposits 1,752.1 768.1 1,551.1 263.2 332.2 188.0 175.0 288.0 115.1 351.4
4.1. Demand deposits 1,752.1 608.3 600.2 228.0 319.0 174.5 143.3 262.1 90.8 202.7
Central government demand deposits 1,564.8 569.5 548.5 123.0 246.3 138.6 134.1 160.6 75.3 81.0
Central government funds' demand deposits 187.3 38.7 51.7 105.0 72.7 35.9 9.1 101.6 15.5 121.6
4.2. Central government f/c deposits – – 950.9 35.2 13.2 13.5 31.8 25.8 24.3 148.7
4.3. CNB bills – 159.9 – – – – – – – –
5. CNB bills 6,372.3 6,212.4 4,920.2 – – – – – – –
5.1. CNB bills in kuna 3,458.9 4,986.2 – – – – – – – –
5.2. CNB bills in f/c 2,913.4 1,226.3 4,920.2 – – – – – – –
6. Capital accounts 6,425.2 5,353.5 5,039.0 5,096.5 5,357.4 5,408.8 6,066.1 5,760.5 5,866.5 6,365.5
7. Other items (net) – 424.2 –461.1 –408.1 –210.8 –498.2 –515.8 –523.0 –545.0 –549.0 –532.1
Total (1+2+3+4+5+6+7) 39,556.6 42,187.7 51,185.6 49,868.5 59,153.0 68,064.6 72,982.8 72,707.6 73,701.7 72,491.5a From October 2001 to May 2003, Liabilities to foreign banks include also liabilities based on CNB bills subscribed by non-residents.b In December 2002, CDA accounts with the CNB for the gross and net settlement of purchased securities have been reclassified from the sector central government to the sector other financial organisations.

CNB BULLETIN • NUMBER 130 • STATISTICAL SURVEY • MONETARY INSTITUTIONS
58
Table C1: Monetary Authorities Accounts
The table reports data on claims and liabilities by monetary au-thorities.
Foreign assets include the following forms of foreign currency and kuna claims on foreign legal and natural persons: monetary gold, holdings of special drawing rights, foreign cash in vault, reserve posi-tion in the International Monetary Fund, current account balances with foreign banks, time deposits with foreign banks and accrued interest, foreign currency security investments and other claims.
Claims on central government and funds are loans and overdue claims on the budget of the Republic of Croatia. In accordance with the Croatian National Bank Act that entered into force in April 2001, the Croatian National Bank may not extend credit to the Republic of Croatia. Hence, this item comprises only overdue claims on the budget of the Republic of Croatia based on the payment system op-erations and the liabilities to the IMF and foreign banks. Until April 2001, Claims in kuna were short-term loans granted for the purpose of overcoming timing differences between incoming revenues and execution of budgetary expenditures, long-term loans granted by special regulations by the government of the Republic of Croatia, and overdue claims on the budgetary central government, while Claims in foreign currency was a counter-entry to the liability to the IMF based on the succession of membership in that institution.
Claims on other domestic sectors are loans and overdue claims on other domestic sectors, including banks in bankruptcy proceedings.
Claims on banks are credits to banks and overdue claims on banks. Credits to banks comprise Lombard credits, short-term li-quidity credits, other credits and reverse repo transactions. Item Lombard credits comprises credits to banks for regular maintaining of the day-to-day liquidity, which were replaced by Lombard credits in December 1994. Short-term liquidity credits, which have been granted since the beginning of 1999, also serve to bridge liquidity problems. Other credits include intervention credits, special credits for bridging liquidity problems granted in the past (initial credits, prerehabilitation credits), due but unpaid credits and banks’ deposits with the CNB. From April 2005 on, reverse repo transactions are conducted on a weekly basis. Overdue claims on banks comprise settlement account overdrafts (until mid-1994) and banks’ failure to correctly and promptly allocate and maintain statutory reserve re-quirements.
Since May 1999, Claims on other domestic sectors include over-due claims on banks against which bankruptcy proceedings have been initiated. Due to the reclassification of savings banks from the
subsector other banking institutions to the subsector banks, data for Claims on banks and Claims on other banking institutions have been revised.
Reserve money consists of currency outside banks, cash in banks’ vaults, banks’ deposits with the CNB, other banking institutions’ de-posits and other domestic sectors’ deposits with the CNB. Banks’ de-posits are: settlement account balances, statutory reserves deposited on a special account with the CNB (including, from March 2006, special reserve requirement on liabilities arising from issued securi-ties), CNB bills on an obligatory basis and overnight deposits. De-posits by other banking institutions included, until September 2003, settlement account balances of housing savings banks. Deposits by other domestic sectors are other domestic sectors’ giro account bal-ances which are deposited with the Croatian National Bank in ac-cordance with law or other regulation.
Restricted and blocked deposits include required foreign cur-rency reserves and accrued interest, restricted deposits and blocked foreign currency deposits. Banks are required to set aside the reserve requirements against certain foreign currency sources of funds and the marginal reserve requirements (from August 2004 on) in special accounts at the Croatian National Bank. Restricted deposits are kuna funds set aside on the basis of a court order or regulations, kuna funds set aside in the period between May 1999 and April 2002 and deposits of banks against which bankruptcy proceedings have been initiated. Blocked foreign currency deposits are funds that were set aside in special accounts at the Croatian National Bank for repaying unpaid amounts due to foreign creditors.
Foreign liabilities include use of IMF credits, liabilities to interna-tional financial institutions and foreign banks and accrued interest.
Central government and funds’ deposits are demand deposits and foreign currency deposits of the Republic of Croatia and central gov-ernment funds with the CNB, and CNB bills purchased by central government institutions.
CNB bills are kuna and f/c CNB bills on a voluntary basis, exclud-ing CNB bills voluntarily purchased by central government institu-tions.
Capital accounts include reserves, provisions and the income and cost accounts.
Other items (net) are unclassified liabilities decreased by unclas-sified assets of the Monetary Authorities Accounts.
Due to the reclassification of savings banks from the subsector other banking institutions to the subsector banks, data for Currency outside banks, Banks’ cash in vaults, Banks’ deposits and Deposits of other banking institutions were revised.

CNB BULLETIN • NUMBER 130 • STATISTICAL SURVEY • BANKS
59
Table D1: Banks’ Accountsend of period, million kuna
2001Dec.
2002Dec.
2003Dec.
2004Dec.
2005Dec.
2006Dec.
2007
Mar. Jun. Jul. Aug.
ASSETS
1. Reserves with the CNB 15,002.7 20,373.5 26,783.7 33,718.2 41,775.2 48,384.7 52,798.5 51,043.8 51,463.0 49,757.8
1.1. In kuna 9,306.2 13,340.0 20,103.4 22,962.9 28,283.1 31,814.1 31,188.9 32,339.4 32,185.7 32,296.6
1.2. In f/c 5,696.5 7,033.5 6,680.2 10,755.3 13,492.1 16,570.6 21,609.6 18,704.4 19,277.3 17,461.2
2. Foreign assets 32,807.6 25,977.8 35,382.9 43,551.0 35,572.5 39,621.2 35,925.8 37,419.8 36,344.3 38,841.2
3. Claims on central government and funds 20,059.9 21,917.7 21,543.6 21,051.3 28,877.2 27,936.8 28,349.3 29,216.2 31,341.1 32,050.3
4. Claims on other domestic sectors 74,283.8 96,218.4 110,374.3 125,707.9 147,340.9 180,967.8 189,674.0 197,685.9 197,344.8 198,500.7
4.1. Claims on local government 1,280.0 1,422.4 1,563.1 1,787.9 1,767.2 1,892.0 1,902.7 2,074.7 2,045.2 2,064.2
4.2. Claims on enterprises 42,882.0 51,723.4 53,809.8 58,643.3 67,017.9 83,386.5 87,190.4 90,980.4 89,291.0 88,748.2
4.3. Claims on households 30,121.9 43,072.6 55,001.4 65,276.7 78,555.7 95,689.3 100,580.9 104,630.7 106,008.6 107,688.4
5. Claims on other banking institutions 170.2 219.5 431.8 624.0 592.2 1,029.5 675.0 476.8 454.8 570.4
6. Claims on non-banking financial instituions 281.4 915.3 761.8 893.9 1,161.8 1,318.1 1,169.3 1,393.5 1,269.1 1,262.1
Total (1+2+3+4+5+6) 142,605.6 165,622.2 195,278.0 225,546.2 255,319.8 299,258.1 308,591.8 317,235.9 318,217.1 320,982.5
LIABILITIES
1. Demand deposits 15,180.6 21,166.2 23,315.0 23,591.3 26,653.3 33,911.7 32,371.4 35,480.8 37,378.7 37,237.6
2. Savings and time deposits 10,213.1 13,001.1 18,370.7 22,479.2 27,992.1 44,836.8 46,765.9 49,832.0 50,364.3 51,297.6
3. Foreign currency deposits 71,836.9 72,054.6 76,035.3 81,742.9 86,760.8 88,256.7 90,699.6 92,041.8 95,950.9 101,717.9
4. Bonds and money market instruments 317.8 216.3 598.4 1,163.5 1,077.0 844.1 802.7 1,011.6 797.1 635.8
5. Foreign liabilities 21,857.8 35,023.5 49,932.0 61,163.7 67,112.3 76,076.0 77,065.5 72,516.2 67,255.7 62,221.3
6. Central government and funds' deposits 5,634.7 6,094.9 5,283.3 6,821.8 9,287.0 10,800.4 10,513.4 12,808.2 12,330.3 12,322.2
7. Credit from central bank 16.6 17.6 968.9 408.9 4,215.6 3,911.4 2,639.5 5,670.4 4,954.3 4,915.6
8. Restricted and blocked deposits 1,600.8 1,680.5 1,709.0 2,054.6 2,036.4 2,447.6 2,685.7 2,697.9 2,462.8 2,372.0
9. Capital accounts 25,455.1 26,323.2 27,389.5 28,666.4 32,665.7 40,805.1 45,886.2 46,901.3 48,475.0 50,276.1
10. Other items (net) –9,507.8 –9,955.6 –8,324.2 –2,546.3 –2,480.4 –2,631.7 –838.2 –1,724.3 –1,751.9 –2,013.7
Total (1+2+3+4+5+6+7+8+9+10) 142,605.6 165,622.2 195,278.0 225,546.2 255,319.8 299,258.1 308,591.8 317,235.9 318,217.1 320,982.5
Table D1: Banks’ Accounts
Banks’ Accounts include data on banks’ claims and liabilities. Banks’ mutual claims and liabilities are consolidated.
Required reserves held at the central bank include kuna and for-eign currency reserves. Kuna reserves include vault cash and kuna funds held in accounts at the central bank. Foreign currency reserves include foreign currency held in the CNB’s foreign currency ac-counts.
Foreign assets are the following forms of kuna and foreign cur-rency claims on foreign legal and natural persons: foreign cash in vaults, current account balances with foreign banks and time depos-its with foreign banks (including loro letters of credit and other forms of collateral), securities, loans, and equities.
Claims on central government and funds are the following forms of claims in kuna and foreign currency: securities and loans.
Claims on other domestic sectors include the following claims in kuna and foreign currency: money market instruments, bonds, loans (including acceptances), and equities.
The same forms of kuna and foreign currency claims are included in claims on other banking institutions and non-banking financial in-stitutions, with one difference: Claims on other banking institutions also include deposits with those institutions.
Items Demand deposits, Savings and time deposits, Foreign currency deposits as well as Bonds and money market instruments comprise banks’ liabilities to other domestic sectors, other banking institutions and non-banking financial institutions.
Demand deposits include giro and current accounts balances and banks’ obligations arising from kuna payment instruments issued, minus currency in the payment system, i.e. checks in banks’ vaults and checks in collection.
Savings and time deposits are kuna sight deposits as well as kuna time and notice deposits.
Foreign currency deposits are foreign currency sight deposits as
well as foreign currency time and notice deposits.Bonds and money market instruments are banks’ liabilities for
securities issued (net) and loans received. Issued subordinated and hybrid instruments, purchased by foreign investors, are excluded from this item.
Foreign liabilities comprise the following forms of kuna and for-eign currency liabilities to foreign legal and natural persons: giro and current accounts, savings deposits (including loro letters of credit and other forms of collateral), time deposits, loans received and li-abilities due. Issued subordinate and hybrid instruments, purchased by foreign investors, are also included in loans received.
Central government and funds’ deposits are all forms of banks’ kuna and foreign currency liabilities (except restricted and blocked deposits) to the central government and funds.
Credit from central bank comprises loans received from the CNB and deposits by the CNB with banks. Repurchase of securities is also considered and treated as a loan.
Restricted and blocked deposits comprise the following banks’ liabilities: kuna and foreign currency restricted deposits by other do-mestic sectors, other banking institutions, non-banking financial in-stitutions, central government and funds as well as foreign legal and natural persons, and households’ blocked foreign currency deposits, regulated by the Act on Converting Households’ Foreign Currency Deposits into the Public Debt of the Republic of Croatia.
Capital accounts are share capital, profit or loss for the previous and current year, retained earnings (loss), legal reserves, reserves provided for by the articles of association and other capital reserves, hedging reserves, unrealised gains (losses) from financial assets clas-sified as available-for-sale assets, value adjustments and specific re-serves for unidentified losses.
Other items (net) are unclassified liabilities decreased by unclas-sified assets, including the fair value of derivative financial instru-ments.

CNB BULLETIN • NUMBER 130 • STATISTICAL SURVEY • BANKS
60
Table D2: Banks’ Foreign Assetsend of period, million kuna
2001Dec.
2002Dec.
2003Dec.
2004Dec.
2005Dec.
2006Dec.
2007
Mar. Jun. Jul. Aug.
1. Foreign assets in f/c 32,763.6 25,924.4 35,261.9 43,428.1 35,457.9 39,454.5 35,731.3 36,988.8 35,910.6 38,401.5
1.1. Claims on foreign financial institutions
31,660.3 21,333.5 31,877.6 35,911.0 27,228.5 30,404.1 26,688.4 28,160.2 27,813.0 31,206.1
Foreign currencies 7,324.7 1,019.8 1,268.6 1,190.0 1,136.1 1,232.1 1,022.9 1,509.6 1,591.6 1,376.6
Demand deposits 1,231.9 757.7 1,057.0 906.2 860.2 870.1 930.6 1,157.0 906.4 799.9
Time and notice deposits 21,765.2 17,569.8 27,969.4 30,943.7 20,874.6 23,509.4 20,355.5 21,235.1 21,075.2 24,837.3
Securities 1,008.5 1,690.2 1,364.2 2,674.1 4,197.0 4,441.5 4,099.5 4,019.1 4,001.3 3,954.1
Loans and advances 290.3 278.7 203.1 189.0 152.9 339.2 268.0 227.7 223.1 222.9
Shares and participations 39.7 17.2 15.4 8.1 7.8 11.8 11.8 11.7 15.4 15.4
1.2. Claims on foreign non-banks 1,103.3 4,590.8 3,384.4 7,517.1 8,229.4 9,050.4 9,042.9 8,828.6 8,097.6 7,195.4
Claims on foreign governments 596.2 3,855.5 2,905.0 7,066.6 7,735.7 8,217.0 8,067.5 7,892.6 7,196.6 6,245.4
Claims on other non-residents 505.5 733.7 478.9 450.2 493.1 798.1 933.5 913.8 879.4 928.4
Securities 72.1 191.3 32.1 77.4 68.0 141.5 180.7 159.4 178.4 176.2
Loans and advances 433.4 542.4 446.8 372.8 425.2 656.6 752.8 754.4 701.0 752.2
Shares and participations 1.6 1.6 0.4 0.3 0.5 35.3 41.9 22.2 21.6 21.6
2. Foreign assets in kuna 44.1 53.4 120.9 122.9 114.6 166.7 194.5 430.9 433.6 439.7
2.1. Claims on foreign financial institutions
29.2 19.6 99.1 77.8 71.3 96.9 120.8 348.7 305.1 314.8
2.2. Claims on foreign non-banks 14.8 33.8 21.9 45.1 43.4 69.8 73.6 82.3 128.5 124.9
o/w: Loans and advances 13.9 33.0 21.0 44.3 42.6 69.2 73.0 81.7 127.9 124.3
Total (1+2) 32,807.6 25,977.8 35,382.9 43,551.0 35,572.5 39,621.2 35,925.8 37,419.8 36,344.3 38,841.2
Tables: D2 – D12
This group of tables (with the exception of Table D5) provides a detailed analysis of the relevant asset and liability items from Table D1 (Banks’ Accounts).
Table D2: Banks’ Foreign Assets
This table shows banks’ claims on foreign legal and natural per-sons.
Foreign assets of banks’ comprise foreign assets in kuna and for-
eign currency.Claims on foreign banks and Claims on foreign non-banks (total
and by financial instruments) are shown separately within both for-eign assets in kuna and in foreign currency.

CNB BULLETIN • NUMBER 130 • STATISTICAL SURVEY • BANKS
61
Table D3: Banks’ Claims on the Central Government and Fundsend of period, million kuna
2001Dec.
2002Dec.
2003Dec.
2004Dec.
2005Dec.
2006Dec.
2007
Mar. Jun. Jul. Aug.
1. In kuna 17,778.7 18,444.4 18,007.1 16,270.2 20,532.7 22,703.0 23,159.6 24,225.0 24,668.5 25,339.7
1.1. Claims on central government 16,230.2 16,443.4 16,032.6 14,465.6 17,352.6 18,361.2 18,665.8 19,668.2 20,056.0 20,631.3
Securities 15,403.2 13,989.1 11,770.0 11,779.1 16,037.7 14,546.7 15,839.5 15,598.9 15,963.9 16,505.3
o/w: Bonds (c'part to f/c savings deposits)
3,420.1 2,473.5 1,531.9 532.0 20.6 8.3 6.6 6.9 6.4 6.1
Loans and advances 826.9 2,454.3 4,262.6 2,686.5 1,314.9 3,814.5 2,826.4 4,069.3 4,092.0 4,126.0
1.2. Claims on central government funds
1,548.5 2,001.0 1,974.5 1,804.6 3,180.1 4,341.9 4,493.8 4,556.8 4,612.5 4,708.3
Securities 560.1 560.7 723.6 621.1 – – 1.7 – 9.2 3.0
Loans and advances 988.4 1,440.3 1,250.9 1,183.5 3,180.1 4,341.9 4,492.0 4,556.8 4,603.3 4,705.4
2. In f/c 2,281.2 3,473.3 3,536.4 4,781.1 8,344.5 5,233.8 5,189.7 4,991.2 6,672.6 6,710.7
2.1. Claims on central government 1,390.9 2,359.1 3,196.9 3,548.4 7,241.0 4,624.4 4,604.3 4,417.7 6,160.9 6,203.2
Securities 1,065.5 1,733.4 1,805.4 1,117.0 1,248.1 429.0 393.5 267.5 257.6 276.1
Loans and advances 325.5 625.7 1,391.5 2,431.3 5,992.8 4,195.4 4,210.8 4,150.2 5,903.3 5,927.1
2.2. Claims on central government funds
890.3 1,114.2 339.5 1,232.8 1,103.5 609.4 585.4 573.5 511.7 507.5
Securities 75.4 195.0 96.4 163.1 144.2 109.2 109.5 115.9 74.2 74.5
Loans and advances 814.8 919.2 243.1 1,069.7 959.3 500.2 475.9 457.6 437.5 433.0
Total (1+2) 20,059.9 21,917.7 21,543.6 21,051.3 28,877.2 27,936.8 28,349.3 29,216.2 31,341.1 32,050.3
Table D4: Banks’ Claims on Other Domestic Sectorsend of period, million kuna
2001Dec.
2002Dec.
2003Dec.
2004Dec.
2005Dec.
2006Dec.
2007
Mar. Jun. Jul. Aug.
1. Claims in kuna 66,626.8 85,418.7 100,365.0 114,635.7 133,603.5 166,755.1 175,605.5 183,820.8 183,395.6 184,807.6
1.1. Money market instruments 544.7 1,394.7 1,314.1 2,510.0 2,329.9 1,980.7 1,902.5 1,959.6 1,945.3 1,887.6
1.2. Bonds 7.7 72.4 56.2 559.8 361.6 1,088.8 1,102.8 895.0 830.4 672.7
1.3. Loans and advances 62,180.6 80,887.6 96,081.7 109,523.9 128,882.3 161,694.2 170,520.1 178,827.5 178,471.4 180,130.3
1.4. Shares and participations 3,893.8 3,064.0 2,912.9 2,042.0 2,029.6 1,991.4 2,080.0 2,138.7 2,148.5 2,117.1
2. Claims in f/c 7,657.0 10,799.8 10,009.3 11,072.2 13,737.4 14,212.8 14,068.5 13,865.0 13,949.1 13,693.1
2.1. Securities 126.6 243.2 130.6 213.5 307.6 221.1 214.8 194.6 246.7 218.6
2.2. Loans and advances 7,530.5 10,556.6 9,878.7 10,858.6 13,429.8 13,991.6 13,853.7 13,670.4 13,702.4 13,474.5
Total (1+2) 74,283.8 96,218.4 110,374.3 125,707.9 147,340.9 180,967.8 189,674.0 197,685.9 197,344.8 198,500.7
Table D3: Banks’ Claims on the Central Government and Funds
The table shows banks’ kuna and foreign currency claims on the central government and funds. The item Securities, shown under
Claims in kuna on the Republic of Croatia, also comprises bonds arising from blocked foreign currency savings deposits issued in ac-cordance with the Act on Converting Households’ Foreign Currency Deposits into the Public Debt of the Republic of Croatia.
Table D4: Banks’ Claims on Other Domestic Sectors
The table shows banks’ kuna and foreign currency claims on other domestic sectors, classified according to financial instruments:
money market instruments (including factoring and forfaiting since January 2004), loans and advances (including acceptances and pur-chased claims), and equities.

CNB BULLETIN • NUMBER 130 • STATISTICAL SURVEY • BANKS
62
Table D5: Distribution of Banks’ Loans by Domestic Institutional Sectorsend of period, million kuna
2001Dec.
2002Dec.
2003Dec.
2004Dec.
2005Dec.
2006Dec.
2007
Mar. Jun. Jul. Aug.
LOANS IN KUNA
1. Loans to central government and funds 1,815.4 3,894.6 5,513.5 3,870.0 4,495.0 8,156.4 7,318.4 8,626.1 8,695.3 8,831.4
1.1. Loans to central government 826.9 2,454.3 4,262.6 2,686.5 1,314.9 3,814.5 2,826.4 4,069.3 4,092.0 4,126.0
1.2. Loans to central government funds 988.4 1,440.3 1,250.9 1,183.5 3,180.1 4,341.9 4,492.0 4,556.8 4,603.3 4,705.4
2. Loans to local government 1,069.1 1,202.9 1,485.1 1,701.9 1,613.9 1,720.3 1,728.4 1,859.2 1,838.4 1,853.4
3. Loans to enterprises 31,049.4 36,708.1 39,777.4 42,844.7 49,105.9 64,666.3 68,619.5 72,708.9 70,992.1 70,947.5
4. Loans to households 30,062.1 42,976.6 54,819.3 64,977.2 78,162.4 95,307.6 100,172.2 104,259.4 105,640.9 107,329.4
o/w: Housing loans 9,450.0 12,363.4 16,896.2 21,397.9 27,571.1 36,927.3 39,266.0 41,083.2 41,944.6 42,849.9
5. Loans to other banking institution 34.7 17.6 82.3 154.5 46.5 304.4 100.5 63.3 62.2 29.7
6. Loans to non-banking financial institutions
240.9 521.3 427.9 558.0 591.8 854.4 675.0 773.9 673.4 644.6
A. Total (1+2+3+4+5+6) 64,271.6 85,321.1 102,105.4 114,106.4 134,015.6 171,009.4 178,614.0 188,290.8 187,902.3 189,635.9
LOANS IN F/C
1. Loans to central government and funds 1,140.3 1,544.9 1,634.7 3,501.0 6,952.1 4,695.6 4,686.7 4,607.8 6,340.9 6,360.1
1.1. Loans to central government 325.5 625.7 1,391.5 2,431.3 5,992.8 4,195.4 4,210.8 4,150.2 5,903.3 5,927.1
1.2. Loans to central government funds 814.8 919.2 243.1 1,069.7 959.3 500.2 475.9 457.6 437.5 433.0
2. Loans to local government 179.1 152.3 47.1 31.9 63.0 11.3 10.1 10.0 8.7 8.7
3. Loans to enterprises 7,291.7 10,308.3 9,649.4 10,527.3 12,973.5 13,598.5 13,435.0 13,289.1 13,326.0 13,106.8
4. Loans to households 59.7 96.0 182.1 299.5 393.3 381.8 408.7 371.3 367.7 359.0
5. Loans to other banking institutions – 1.2 174.3 52.9 19.9 68.1 220.5 27.9 3.0 122.7
6. Loans to non-banking financial institutions
– 28.3 58.8 255.3 512.3 360.5 378.0 469.0 444.4 462.2
B. Total (1+2+3+4+5+6) 8,670.7 12,131.0 11,746.4 14,667.8 20,914.1 19,115.9 19,139.0 18,775.1 20,490.7 20,419.5
TOTAL (A+B) 72,942.3 97,452.1 113,851.8 128,774.2 154,929.7 190,125.3 197,753.0 207,065.9 208,393.0 210,055.5
Table D6: Demand Deposits with Banksend of period, million kuna
2001Dec.
2002Dec.
2003Dec.
2004Dec.
2005Dec.
2006Dec.
2007
Mar. Jun. Jul. Aug.
1. Local government 907.0 1,910.4 2,006.2 2,020.7 1,688.7 1,803.8 1,528.8 1,689.2 1,688.1 1,911.1
2. Enterprises 8,981.6 12,344.5 12,872.9 12,036.9 13,344.2 16,668.6 14,586.5 15,628.9 16,984.7 16,656.9
3. Households 4,872.0 6,307.4 7,873.1 8,773.0 10,728.3 14,257.8 14,813.8 16,780.2 17,190.2 17,227.1
4. Other banking institutions 17.0 42.1 98.9 245.4 322.1 485.1 446.3 344.4 385.0 317.0
5. Non-banking financial institutions 407.1 568.1 468.1 517.5 571.3 697.6 996.8 1,039.6 1,131.7 1,126.3
6. Less: Checks of other banks and checks in collection
–4.2 –6.4 –4.2 –2.2 –1.3 –1.2 –0.8 –1.5 –0.8 –0.7
Total (1+2+3+4+5+6) 15,180.6 21,166.2 23,315.0 23,591.3 26,653.3 33,911.7 32,371.4 35,480.8 37,378.7 37,237.6
Table D5: Distribution of Banks’ Loans by Domestic Institutional Sectors
The table shows data on kuna and foreign currency loans granted
by banks to domestic sectors, including acceptances, financial leases, payments made on the basis of guarantees and similar instruments, purchased claims, and until December 2003 factoring and forfait-ing.
Table D6: Demand Deposits with Banks
The table shows demand deposits with banks, classified by do-mestic institutional sectors.
Demand deposits are the sum of other domestic sectors’, other
banking institutions’ and non-banking financial institutions’ giro and current accounts balances, minus currency in the payment system (i.e. checks in banks’ vaults and checks in collection). Banks’ obliga-tions arising from kuna payment instruments issued are included in the household sector.

CNB BULLETIN • NUMBER 130 • STATISTICAL SURVEY • BANKS
63
Table D7: Time and Savings Deposits with Banksend of period, million kuna
2001Dec.
2002Dec.
2003Dec.
2004Dec.
2005Dec.
2006Dec.
2007
Mar. Jun. Jul. Aug.
1. Savings deposits 2,006.8 2,236.2 2,527.9 2,233.9 2,493.6 2,905.6 2,919.9 3,145.7 3,151.4 3,077.0
1.1. Local government 118.3 14.8 14.4 4.6 2.7 2.8 2.9 2.1 2.9 2.8
1.2. Enterprises 88.0 213.3 190.5 38.8 101.6 110.3 131.9 148.8 193.8 168.9
1.3. Households 1,712.2 1,996.3 2,288.8 2,190.5 2,388.3 2,792.4 2,785.0 2,989.7 2,949.7 2,900.3
1.4. Other banking institutions 20.8 0.0 – – – – – 5.0 5.0 5.0
1.5. Non-banking financial institutions 67.5 11.8 34.2 0.0 1.0 0.0 0.1 0.1 0.0 0.0
2. Time and notice deposits 8,206.3 10,764.9 15,842.9 20,245.4 25,498.4 41,931.3 43,846.0 46,686.3 47,212.9 48,220.6
2.1. Local government 340.7 482.8 551.6 550.8 508.7 491.8 865.8 1,012.7 1,136.9 1,210.3
2.2. Enterprises 3,618.3 4,633.6 7,165.3 8,698.5 8,222.5 14,715.4 15,837.4 16,805.2 17,139.0 18,574.9
2.3. Households 2,554.1 3,793.8 6,194.5 9,321.4 13,254.9 20,755.0 20,052.5 19,616.9 19,694.0 19,419.3
2.4. Other banking institutions 24.7 58.4 129.3 215.9 931.9 2,697.9 4,092.5 5,487.8 5,734.9 4,462.0
2.5. Non-banking financial institutions 1,668.5 1,796.3 1,802.2 1,458.8 2,580.4 3,271.3 2,997.7 3,763.6 3,508.1 4,554.1
Total (1+2) 10,213.1 13,001.1 18,370.7 22,479.2 27,992.1 44,836.8 46,765.9 49,832.0 50,364.3 51,297.6
Table D8: Foreign Currency Deposits with Banksend of period, million kuna
2001Dec.
2002Dec.
2003Dec.
2004Dec.
2005Dec.
2006Dec.
2007
Mar. Jun. Jul. Aug.
1. Savings deposits 23,748.8 21,074.4 21,547.0 22,144.6 22,641.0 22,698.6 22,177.8 22,030.7 22,969.0 24,198.4
1.1. Local government 13.2 12.2 14.7 15.6 11.9 30.8 13.5 26.9 13.6 13.5
1.2. Enterprises 2,884.2 3,346.7 3,620.2 4,273.2 4,408.3 4,589.7 4,625.3 4,414.8 5,038.5 5,323.6
1.3. Households 20,688.3 17,537.3 17,690.2 17,708.9 17,933.6 17,609.9 16,970.0 17,054.7 17,352.2 18,131.3
1.4. Other banking institutions 23.9 34.7 9.0 15.4 116.0 276.7 170.1 184.3 269.0 332.5
1.5. Non-banking financial institutions 139.2 143.5 212.9 131.6 171.3 191.4 399.0 350.0 295.7 397.4
2. Time deposits 48,088.1 50,980.3 54,488.4 59,598.3 64,119.7 65,558.1 68,521.8 70,011.0 72,981.8 77,519.5
2.1. Local government 1.7 9.5 3.8 0.3 3.2 1.9 2.2 2.2 2.2 2.2
2.2. Enterprises 4,619.1 6,009.6 7,154.0 8,518.6 8,154.2 7,086.2 7,210.4 7,620.3 9,297.9 10,322.7
2.3. Households 42,705.4 44,159.2 46,805.1 50,636.0 55,036.1 57,210.8 59,952.2 60,459.0 61,602.3 63,577.3
2.4. Other banking institutions 11.5 41.5 21.7 20.7 242.0 366.2 449.3 565.1 667.5 1,234.5
2.5. Non-banking financial institutions 750.3 760.5 503.7 422.7 684.2 892.9 907.7 1,364.4 1,412.0 2,382.8
Total (1+2) 71,836.9 72,054.6 76,035.3 81,742.9 86,760.8 88,256.7 90,699.6 92,041.8 95,950.9 101,717.9
Table D7: Time and Savings Deposits with Banks
The table shows kuna savings and time deposits by other domes-tic sectors, other banking institutions and non-banking financial in-stitutions with banks.
Table D8: Foreign Currency Deposits with Banks
The table shows foreign currency savings and time deposits by other domestic sectors, other banking institutions and non-banking
financial institutions with banks. Foreign currency savings deposits are all foreign currency sight deposits and foreign currency payment instruments issued, while foreign currency time deposits also include foreign currency notice deposits.

CNB BULLETIN • NUMBER 130 • STATISTICAL SURVEY • BANKS
64
Table D9: Bonds and Money Market Instrumentsend of period, million kuna
2001Dec.
2002Dec.
2003Dec.
2004Dec.
2005Dec.
2006Dec.
2007
Mar. Jun. Jul. Aug.
1. Money market instruments (net) – 5.1 – – – 0.8 0.8 0.8 0.8 0.8
2. Bonds (net) 104.4 92.8 151.9 170.5 164.9 340.9 395.2 582.8 579.0 548.6
3. Other domestic borrowing 213.4 118.4 446.5 993.0 912.1 502.5 406.7 428.0 217.3 86.4
3.1. Local government – – 0.9 – – – – – – –
3.2. Enterprises 158.1 46.3 92.7 40.3 40.8 0.0 44.2 25.6 0.0 0.0
3.3. Other banking institutions 4.6 10.0 222.1 842.8 828.1 492.8 321.2 360.8 203.7 66.3
3.4. Non-banking financial institutions 50.7 62.0 130.9 109.9 43.2 9.6 41.3 41.6 13.5 20.0
Total (1+2+3) 317.8 216.3 598.4 1,163.5 1,077.0 844.1 802.7 1,011.6 797.1 635.8
Table D10: Banks’ Foreign Liabilitiesend of period, million kuna
2001Dec.
2002Dec.
2003Dec.
2004Dec.
2005Dec.
2006Dec.
2007
Mar. Jun. Jul. Aug.
1. Foreign liabilities in f/c 21,692.7 34,198.5 44,574.3 54,536.7 52,073.3 55,114.3 55,275.1 51,520.3 49,280.1 45,565.9
1.1. Liabilities to foreign financial institutions 16,407.4 28,662.3 38,623.1 48,967.5 45,747.7 48,561.3 48,641.3 44,355.7 41,829.3 38,840.6
Demand deposits 147.1 130.9 266.6 127.6 156.3 195.0 149.5 137.9 158.9 196.2
Time and notice deposits 1,208.3 9,002.9 12,885.2 16,056.8 12,523.1 12,174.1 13,011.8 13,204.3 12,767.9 11,409.9
Loans and advances 15,052.1 19,528.5 25,471.4 29,369.5 29,775.6 32,903.9 32,169.3 27,736.8 25,628.1 23,950.0
o/w: Subordinated and hybrid instruments 2,558.3 2,801.4 2,949.2 2,399.4 1,167.4 820.7 824.9 816.0 163.6 164.1
Bonds – – – 3,413.6 3,292.6 3,288.3 3,310.7 3,276.8 3,274.5 3,284.6
1.2. Liabilities to foreign non-banks 5,285.2 5,536.2 5,951.2 5,569.2 6,325.6 6,553.0 6,633.8 7,164.5 7,450.9 6,725.2
Savings and time deposits 3,777.8 4,160.2 4,753.2 5,002.2 5,846.3 6,192.4 6,322.7 6,857.3 7,195.9 6,469.6
Sight deposits 873.7 875.6 898.6 1,052.5 1,172.9 1,635.8 1,393.4 1,806.9 2,221.8 1,622.7
Time and notice deposits 2,904.1 3,284.6 3,854.6 3,949.6 4,673.4 4,556.7 4,929.3 5,050.3 4,974.2 4,846.9
Loans and advances 1,507.4 1,376.0 1,198.0 567.1 479.3 360.5 311.1 307.3 254.9 255.6
o/w: Subordinated and hybrid instruments 39.3 39.7 39.1 0.2 – – – – – –
2. Foreign liabilities in kuna 165.1 825.0 5,357.7 6,627.0 15,039.1 20,961.8 21,790.4 20,995.9 17,975.6 16,655.4
2.1. Liabilities to foreign financial institutions 46.9 690.9 5,087.8 6,103.9 14,099.6 20,087.0 20,961.5 20,310.0 17,224.6 15,758.6
Demand deposits 38.2 53.6 86.4 145.1 179.6 1,438.1 1,443.0 1,083.6 509.7 423.0
Time and notice deposits 4.2 635.8 2,664.1 2,846.9 6,979.5 11,198.8 14,949.2 14,674.0 12,564.2 11,184.8
Loans and advances 4.5 1.5 2,337.3 3,111.9 6,940.5 7,450.2 4,569.3 4,552.5 4,150.8 4,150.8
o/w: Subordinated and hybrid instruments – 405.7 404.0 406.0 401.7 0.0 0.0
2.2. Liabilities to foreign non-banks 118.2 134.1 269.9 523.1 939.5 874.8 828.9 685.8 750.9 896.8
Demand deposits 60.1 56.2 76.8 95.9 180.3 170.1 274.9 229.0 326.0 218.8
Time and notice deposits 58.1 77.9 191.4 419.2 755.2 703.3 551.1 455.3 421.9 675.0
Loans and advances – – 1.7 8.0 4.0 1.4 2.9 1.5 3.0 3.0
o/w: Subordinated and hybrid instruments .... .... 1.7 8.0 4.0 1.4 2.9 1.5 3.0 3.0
Total (1+2) 21,857.8 35,023.5 49,932.0 61,163.7 67,112.3 76,076.0 77,065.5 72,516.2 67,255.7 62,221.3
Table D9: Bonds and Money Market Instruments
The table shows banks’ liabilities for securities issued (net) and loans received from other domestic sectors, other banking institu-tions and non-banking financial institutions.
Money market instruments (net) comprise banks’ net liabilities for CNB bills, bills of exchange (issued and accepted) and other se-
curities issued.Bonds (net) comprise banks’ net liabilities for kuna and foreign
currency bonds issued, as well as issued subordinated and hybrid instruments, excluding those purchased by foreign investors.
Other domestic borrowing comprises loans received, which are reported in the total amount and classified by institutional sectors.
Table D10: Banks’ Foreign Liabilities
The table shows banks’ total foreign currency and kuna liabilities to foreign legal and natural persons, with the exception of restricted kuna and foreign currency deposits by foreign legal and natural per-sons.
Banks’ foreign liabilities comprise foreign currency liabilities and
foreign kuna liabilities.Within foreign kuna and foreign currency liabilities, liabilities to
foreign banks are reported separately from liabilities to foreign non-banks (total and by financial instruments). Loans and advances also include issued subordinated and hybrid instruments purchased by foreign investors.

CNB BULLETIN • NUMBER 130 • STATISTICAL SURVEY • BANKS
65
Table D12: Restricted and Blocked Deposits with Banksend of period, million kuna
2001Dec.
2002Dec.
2003Dec.
2004Dec.
2005Dec.
2006Dec.
2007
Mar. Jun. Jul. Aug.
1. Restricted deposits 830.6 1,361.2 1,541.2 2,014.6 2,036.4 2,447.6 2,685.7 2,697.9 2,462.8 2,372.0
1.1. In kuna 100.3 789.6 730.1 1,267.4 1,277.1 1,427.0 1,551.1 1,440.6 1,335.2 1,348.9
1.2. In f/c 730.3 571.6 811.1 747.2 759.3 1,020.5 1,134.6 1,257.3 1,127.6 1,023.1
2. Blocked f/c deposits of housholds 770.2 319.3 167.8 40.0 – – – – – –
Total (1+2) 1,600.8 1,680.5 1,709.0 2,054.6 2,036.4 2,447.6 2,685.7 2,697.9 2,462.8 2,372.0
Table D11: Central Government and Funds’ Deposits with Banksend of period, million kuna
2001Dec.
2002Dec.
2003Dec.
2004Dec.
2005Dec.
2006Dec.
2007
Mar. Jun. Jul. Aug.
1. In kuna 3,335.1 4,036.8 4,104.4 5,627.2 7,596.1 9,030.0 9,097.7 10,322.0 10,367.5 10,419.1
1.1. Central government deposits 295.9 634.3 506.4 445.1 605.0 497.5 620.1 1,257.7 991.1 881.2
Demand deposits 33.9 476.4 448.0 373.3 458.1 366.2 430.6 438.6 423.4 417.5
Savings deposits 41.6 3.3 3.0 4.2 1.8 2.1 1.9 1.7 1.5 1.5
Time and notice deposits 217.6 153.6 54.2 66.5 144.0 128.1 186.5 816.4 565.2 461.2
Loans and advances 2.8 1.1 1.1 1.1 1.0 1.0 1.0 1.0 1.0 1.0
1.2. Central government funds' deposits 3,039.2 3,402.5 3,598.0 5,182.2 6,991.1 8,532.6 8,477.5 9,064.3 9,376.4 9,537.9
Demand deposits 214.6 553.2 294.8 266.3 580.2 254.6 227.2 189.5 352.8 375.1
Savings deposits 10.8 0.0 0.3 3.5 1.9 14.6 4.4 4.3 2.3 2.3
Time and notice deposits 195.2 144.3 156.2 262.3 251.7 496.7 229.9 331.3 251.8 204.9
Loans and advances 2,618.6 2,705.0 3,146.7 4,650.0 6,157.3 7,766.7 8,016.0 8,539.2 8,769.6 8,955.6
2. In f/c 2,299.6 2,058.1 1,178.9 1,194.6 1,690.9 1,770.4 1,415.8 2,486.2 1,962.7 1,903.1
2.1. Central government deposits 2,275.0 1,938.9 1,158.2 891.0 906.2 811.7 760.3 696.6 650.0 632.9
Savings deposits 329.8 263.0 198.5 189.7 340.6 264.8 318.7 317.4 305.0 300.6
Time and notice deposits 55.8 293.1 – 23.2 38.7 275.0 205.1 148.0 149.8 135.9
Refinanced loans and advances 1,889.5 1,382.8 959.6 678.1 527.0 271.9 236.4 231.3 195.2 196.4
2.2. Central government funds' deposits 24.5 119.2 20.8 303.6 784.7 958.6 655.5 1,789.6 1,312.7 1,270.2
Savings deposits 22.9 114.1 20.8 156.5 139.4 93.4 104.7 151.5 207.5 203.4
Time and notice deposits 1.6 5.0 – 147.1 25.8 356.2 163.9 474.7 232.1 195.4
Loans and advances – – – – 619.6 509.0 386.8 1,163.4 873.1 871.4
Total (1+2) 5,634.7 6,094.9 5,283.3 6,821.8 9,287.0 10,800.4 10,513.4 12,808.2 12,330.3 12,322.2
Table D11: Central Government and Funds’ Deposits with Banks
The table reports total banks’ kuna and foreign currency liabilities to the central government and funds, with the exception of restricted (kuna and foreign currency) deposits by the central government and funds with banks.
Kuna and foreign currency deposits by the Republic of Croatia and central government funds are shown separately. Kuna deposits comprise demand deposits, savings deposits, time and notice depos-its, and loans received from the central government and funds. For-eign currency deposits comprise savings deposits, time and notice deposits, and refinanced loans and advances.
Table D12: Restricted and Blocked Deposits with Banks
The table shows households’ restricted (kuna and foreign cur-rency) deposits and blocked deposits.
Blocked foreign currency deposits include households’ foreign currency deposits, regulated by the Act on Converting Households’ Foreign Currency Deposits into the Public Debt of the Republic of Croatia.

CNB BULLETIN • NUMBER 130 • STATISTICAL SURVEY • BANKS
66
August 2007
August 2007
DISTRIBUTION OF BANKS' LOANS BY
DOMESTIC INSTITUTIONAL SECTORS
DISTRIBUTION OF BANKS' DEPOSITS
BY DOMESTIC INSTITUTIONAL SECTORS
Figure D1
Figure D2
Non-monetary
financial
institutions
Non-monetary
financial
institutions
Government
Government
Households
Enterprises
Enterprises
Households
Note:Sector “Non-monetary financial institutions” includes other banking institutions and non-banking financial institutions.Sector “Government” includes the central government and funds and local government.

CNB BULLETIN • NUMBER 130 • STATISTICAL SURVEY • HOUSING SAVINGS BANKS
67
Table E1: Housing Savings Banks’ Accountsend of period, million kuna
2001Dec.
2002Dec.
2003Dec.
2004Dec.
2005Dec.
2006Dec.
2007
Mar. Jun. Jul. Aug.
ASSETS
1. Reserves with the CNB 15.5 19.1 0.0 0.0 0.0 0.0 0.0 0.0 0.0 0.0
2. Claims on central government and funds
1,208.8 1,983.9 3,033.5 3,779.1 4,274.3 4,674.8 4,350.3 4,111.1 4,102.1 4,085.6
3. Claims on other domestic sectors 11.6 93.3 187.9 373.2 575.5 1,296.0 1,492.0 1,712.4 1,799.6 1,877.4
o/w: Claims on households 11.6 91.3 187.9 373.2 575.5 1,296.0 1,492.0 1,712.4 1,799.6 1,877.4
4. Claims on banks 18.1 37.2 247.2 824.2 994.4 181.4 52.2 88.8 58.3 52.1
5. Claims on other banking institutions – – – – – – – – – –
Total (1+2+3+4+5) 1,254.0 2,133.6 3,468.6 4,976.6 5,844.2 6,152.3 5,894.6 5,912.2 5,960.0 6,015.1
LIABILITIES
1. Time deposits 1,137.5 2,012.9 3,265.2 4,728.2 5,514.7 5,803.6 5,588.1 5,555.4 5,589.1 5,643.9
2. Bonds and money market instruments 10.0 – 11.1 10.7 10.3 61.7 66.1 76.3 76.3 76.5
3. Capital accounts 124.0 141.1 159.7 206.7 258.0 244.7 223.0 242.5 254.7 231.6
4. Other items (net) –17.5 –20.4 32.6 30.8 61.1 42.2 17.5 37.9 40.0 63.1
Total (1+2+3+4) 1,254.0 2,133.6 3,468.6 4,976.6 5,844.2 6,152.3 5,894.6 5,912.2 5,960.0 6,015.1
Table E1: Housing Savings Banks’ Accounts
Housing savings banks’ accounts include data on claims and li-abilities of the Croatian housing savings banks. All housing savings banks’ claims and liabilities refer exclusively to domestic sectors.
Housing savings banks’ required reserves held at the central bank include funds in vaults. Until September 2003, they also included kuna funds held in accounts at the central bank.
Claims on central government and funds are claims in kuna on the Republic of Croatia and central government funds.
Claims on other domestic sectors include kuna loans to local gov-ernment and households.
Claims on banks include loans to banks, as well as deposits with banks, including, from October 2003 on, accounts for regular opera-
tions with banks.Claims on other banking institutions include investments in in-
vestment funds.Item Time deposits includes local government and households’
time deposits.Bonds and money market instruments are housing savings banks’
liabilities for securities issued (net) and loans received.Capital accounts are share capital, profit or loss for the previous
and current year, retained earnings (loss), legal reserves, reserves provided for by the articles of association and other capital reserves, hedging reserves, unrealised gains (losses) from financial assets classified as available-for-sale assets, value adjustments and specific reserves for unidentified losses. Other items (net) are unclassified liabilities decreased by unclassified assets.

CNB BULLETIN • NUMBER 130 • STATISTICAL SURVEY • MONETARY POLICY INSTRUMENTS AND LIQUIDITY
68
Table F1: Credit Rates of the Croatian National Bankin percentage, on annual basis
Year MonthCNB
discount rate
CNB repo rateb
Credit rates
On Lombard creditsb
On intervention
credits
On intra-day refinance facilityb
On short-term liquidity credits
On inaccurately calculated statutory
reservesbOn arrears
1 2 3 4 5 6 7 8 9 10
1994 December 8.50 – 18.00 19.00 17.00 14.00 19.00 22.00
1995 December 8.50 – 25.49 19.00 17.00 – 19.00 22.00
1996 December 6.50 – 11.00 19.00 17.00 – 19.00 18.00
1997 December 5.90 – 9.50 19.00 17.00 – 19.00 18.00
1998 December 5.90 – 12.00 19.00 7.00 14.00 19.00 18.00
1999 December 7.90 – 13.00 19.00 – 14.00 19.00 18.00
2000 December 5.90 – 12.00 18.00 – 13.00 18.00 18.00
2001 December 5.90 – 10.00 – – 11.00 15.00 18.00
2002 December 4.50 – 9.50 – – 10.50 15.00 15.00
2003 December 4.50 – 9.50 – – 10.50 15.00 15.00
2004 December 4.50 – 9.50 – – 10.50 15.00 15.00
2005 December 4.50 3.50 7.50c – – 8.50c 15.00 15.00
2006 September 4.50 3.50 7.50 – – 8.50 15.00 15.00
October 4.50 3.50 7.50 – – 8.50 15.00 15.00
November 4.50 3.50 7.50 – – 8.50 15.00 15.00
December 4.50 3.50 7.50 – – 8.50 15.00 15.00
2007 January 4.50 3.50 7.50 – – 8.50 15.00 15.00
February 4.50 3.50 7.50 – – 8.50 15.00 15.00
March 4.50 3.50 7.50 – – 8.50 15.00 15.00
April 4.50 3.50 7.50 – – 8.50 15.00 15.00
May 4.50 3.50 7.50 – – 8.50 15.00 15.00
June 4.50 3.50 7.50 – – 8.50 15.00 15.00
July 4.50 3.50 7.50 – – 8.50 15.00 15.00
August 4.50 3.50 7.50 – – 8.50 15.00 15.00a Weighted averages of weighted repo rates achieved at regular reverse repo auctions of the CNB in the reporting month.b Breaks in the series of data are explained in notes on methodology.c Since 14 December 2005.
Table F1: Credit Rates of the Croatian National Bank
The table shows interest rates used by the CNB to calculate and charge interest on credits from the primary issue and on all other claims.
Credit rates of the CNB are set by decisions of the Council of the Croatian National Bank, on a yearly basis. Exceptionally, from June 1995 interest rate charged by the CNB on Lombard credits was 1.5 percentage points higher than the weighted average interest rate on CNB bills on a voluntary basis (which serve as collateral for Lombard credits) in cases when the weighted average interest rate was higher than 16.5%. Congruently, from June 1995 to August 1996 the table reports the weighted average interest rate on Lombard credits.
Time series presented in the table contain certain breaks, due to changes in the CNB’s monetary policy instruments.
Data shown in column 4 refer to the weighted averages of the weighted repo rates achieved at regular reverse repo auctions of the CNB in the reporting month.
Data shown in column 7 refer, until September 1994, to interest rates on special credits for savings deposits’ payments and for pay-
ments from households’ current accounts, and from October 1994 until September 1997 to interest rates on daily credits for savings deposits and households’ current accounts in kuna. Daily credits, as opposed to special credits, are paid back on the same day. In October 1997, this instrument was replaced by daily credits for overcoming short-term liquidity problems that are collateralised by CNB bills. From December 1998 to April 1999, this credit is incorporated in Lombard credit, applying different interest rate for its usage within one day.
Data shown in column 8 refer, until December 1994, to inter-est rate on initial credits, and since 18 March 1998, to credits for overcoming liquidity problems of banks under evaluation for entry into rehabilitation and restructuring procedures and since February 1999, to interest rates on short-term liquidity credits. From Decem-ber 1999 on, data show interest rates on short-term liquidity credit with a maturity over 3 months which is 1 percentage point higher than interest rate on Lombard credits. Interest rate on short-term liquidity credit up to 3 months is 0.5 percentage point higher than interest rate on Lombard credits.

CNB BULLETIN • NUMBER 130 • STATISTICAL SURVEY • MONETARY POLICY INSTRUMENTS AND LIQUIDITY
69
Table F2: Deposit Rates of the Croatian National Bankin percentage, on annual basis
Year Month
Interest rates on statutory
reserves dep. with the CNB
Interest rates on CNB bills on an obligatory basis
Interest rates on CNB bills on a voluntary basisa Interest rates on f/c CNB bills on a voluntary basis Interest
rates on overnight deposits
Due in7 days
Due in35 days
Due in70 days
Due in105 days
Due in35 days
Due in63 days
Due in91 days
Due in182 days
Due in364 days
1 2 3 4 5 6 7 8 9 10 11 12 13 14
1994 December 5.15 – 9.00 12.00 14.00 – – – – – – –
1995 December 5.50 16.50 12.00 25.54 27.00 – – – – – – –
1996 December 5.50 – – 8.00 9.50 – – – – – – –
1997 December 4.50 – – 8.00 9.00 10.00 – – – – – –
1998 December 5.90 – – 9.50 10.50 11.00 – 4.60 3.12 3.08 – –
1999 December 5.90 – – 10.50 11.55 12.50 – 4.83 3.56 – – –
2000 December 4.50 – – 6.65 7.00 7.70 – 5.51 4.83 – – –
2001 December 2.00 – – 3.36 4.26 4.85 – 2.62 3.06 – – –
2002 December 1.75 – – 2.08 – – 2.30 2.68 – – – –
2003 December 1.25 0.50 – – – – 1.75 1.48 – – – –
2004 December 1.25 – – – – – – – – – – –
2005 December 0.75 – – – – – – – – – – 0.50
2006 September 0.75 – – – – – – – – – – 0.50
October 0.75 – – – – – – – – – – 0.50
November 0.75 – – – – – – – – – – 0.50
December 0.75 – – – – – – – – – – 0.50
2007 January 0.75 – – – – – – – – – – 0.50
February 0.75 – – – – – – – – – – 0.50
March 0.75 – – – – – – – – – – 0.50
April 0.75 – – – – – – – – – – 0.50
May 0.75 – – – – – – – – – – 0.50
June 0.75 – – – – – – – – – – 0.50
July 0.75 – – – – – – – – – – 0.50
August 0.75 – – – – – – – – – – 0.50a Breaks in the series of data are explained in notes on methodology.
Table F2: Deposit Rates of the Croatian National Bank
The table shows interest rates used by the CNB to calculate and pay interest on funds deposited with the CNB and on issued securi-ties.
Interest rates paid by the CNB for appropriated statutory reserve funds are set by a decision of the Council of the Croatian National Bank. Until April 2005, the appropriated statutory reserve funds in-cluded the calculated statutory reserve funds that were deposit in a special statutory reserve account with the CNB, or maintained (in average) in banks’ settlement accounts, or deposited in a special ac-count with the CNB for the settlement of net positions in the Na-tional Clearing System (NCS). From April 2005, they include the calculated statutory reserve funds allocated to a special statutory re-serve account with the CNB (column 3).
Interest rates on CNB bills on an obligatory basis are set by a decision of the Council of the Croatian National Bank.
Interest rates on CNB bills on a voluntary basis are set at CNB bills’ auction sales. Congruently, columns 5, 6 and 7 report the weighted average interest rates attained at auctions of CNB bills. From November 1994 through January 2001, columns 7 and 8 re-port interest rates on CNB bills on a voluntary basis due in 91 and 182 days respectively.
From April 1998 on, columns 9 through 13 report the weighted average interest rates on CNB bills on a voluntary basis in EUR and USD (until December 1998, in DEM and USD) attained at CNB bills’ auctions as a weighted average of subscribed amounts in those two currencies.
Column 14 reports the interest rate on overnight deposits with the CNB.

CNB BULLETIN • NUMBER 130 • STATISTICAL SURVEY • MONETARY POLICY INSTRUMENTS AND LIQUIDITY
70
Table F3: Banks’ Reserve Requirementsdaily averages and percentages, million kuna and %
Year Month
Weighted average res.
requirement in % on res. base
Reserve requirement (RR) Other obligatory deposits with the
CNB
Statutory reserves deposited with the CNB
Weighted avg. remuneration rate on
immobilised funds in kuna
Weighted avg. remuneration rate on allocated funds
in f/cTotal In kuna In f/c In kuna In f/c
1 2 3 4=5+6 5 6 7 8 9 10 11
1994 December 26.20 1,826.0 1,826.0 – 188.3 1,779.2 – 5.63 –
1995 December 30.90 2,431.8 2,431.8 – 826.5 2,215.9 – 7.93 –
1996 December 35.91 3,652.9 3,652.9 – – 3,312.0 – 4.99 –
1997 December 32.02 4,348.8 4,348.8 – – 3,914.2 – 4.05 –
1998 December 29.57 13,112.7 3,967.2 9,145.4 57.4 3,469.8 1,467.6 5.28 ....
1999 December 30.50 13,579.0 4,210.1 9,368.9 37.3 3,695.1 4,606.5 5.62 ....
2000 December 23.22 16,245.8 4,646.8 11,599.0 5.0 4,191.6 5,544.6 4.05 ....
2001 December 19.67 21,187.1 8,691.5 12,495.5 – 6,287.8 5,950.0 1.97 2.73
2002 December 19.00 25,985.1 11,447.1 14,538.0 – 8,156.7 7,139.9 1.72 2.16
2003 December 19.00 31,009.4 18,023.8 12,985.6 109.4 12,459.8 6,850.2 1.17 1.47
2004 December 18.00 33,615.7 20,040.9 13,574.8 430.1 14,664.1 10,171.3 1.22 1.36
2005 December 18.00 37,424.5 24,997.9 12,426.6 3,940.2 17,497.7 9,271.4 0.52 0.92
2006 September 17.00 38,846.4 27,505.8 11,340.6 8,182.6 19,253.8 8,510.9 0.52 0.91
October 17.00 39,293.6 27,951.4 11,342.1 6,324.0 19,565.8 8,450.1 0.52 0.91
November 17.00 40,131.9 28,519.5 11,612.4 6,584.1 19,963.5 8,654.2 0.52 0.85
December 17.00 40,736.4 28,966.1 11,770.4 7,332.5 20,257.0 8,780.9 0.52 1.06
2007 January 17.00 41,476.3 29,458.6 12,017.7 8,882.2 20,612.0 8,995.3 0.52 0.80
February 17.00 42,175.6 29,856.1 12,319.6 10,594.0 20,899.2 9,262.3 0.52 0.96
March 17.00 42,639.1 30,136.3 12,502.8 12,195.6 21,095.3 9,415.0 0.52 0.79
April 17.00 42,852.8 30,325.7 12,527.1 12,307.9 21,227.9 9,422.4 0.52 0.82
May 17.00 43,037.4 30,522.2 12,515.3 11,873.1 21,365.5 9,386.5 0.52 0.76
June 17.00 42,911.2 30,522.2 12,389.0 10,858.6 21,365.6 9,250.8 0.52 1.03
July 17.00 43,245.7 30,834.9 12,410.8 9,914.5 21,584.4 9,245.3 0.52 0.97
August 17.00 43,516.6 31,062.2 12,454.4 9,068.2 21,743.6 9,212.6 0.52 0.93
Table F3: Banks’ Reserve Requirements
This table shows data on monthly averages of day-to-day bal-ances of banks’ kuna and foreign currency reserve requirements with the CNB. Savings banks are included beginning in July 1999.
Column 3 shows the weighted average reserve requirement ratio as a percentage of the kuna and foreign currency reserve require-ments (column 4) in the reserve base.
Reserve requirement (column 4) represents the prescribed amount of funds banks are required to deposit in a special statutory reserve account with the CNB, or to maintain (in average) in their settlement accounts and in vaults, or in accounts of liquid foreign currency claims (which include foreign cash and checks in foreign currency, liquid foreign currency claims maintained in the accounts with the high-grade foreign banks and foreign currency CNB bills).
Column 5 shows the amount of kuna reserve requirements. Be-tween January 1995 and December 2000, this amount corresponded with the statutory reserve requirement instrument, while until De-cember 1994 it comprised two instruments: statutory reserves and liquid assets requirement – LAR (except for the part in which banks were conforming to this requirement by registering CNB bills on a voluntary basis). In December 2000, reserve requirements in kuna and in foreign currency were unified, i.e. reserve requirements rate, periods for calculating, allocating and maintaining reserve require-ments were unified, as well as a minimum percentage of the total re-serve requirements deposited with the Croatian National Bank. From September 2001 on, column 5 includes also the f/c component of reserve requirements that is set aside/maintained in kuna.
Column 6 shows the amount of foreign currency reserve require-ments, i.e. the prescribed amount of funds banks are required to deposit in the CNB’s foreign currency accounts, or to maintain (in average) in accounts of liquid claims. Until November 2000, the cal-
culation base consisted of the average daily balances of household foreign currency savings deposits with a remaining maturity of up to 3 months, while starting from December 2000 the base consists of foreign currency sources of funds, including: ordinary foreign cur-rency accounts, special foreign currency accounts, foreign currency accounts and foreign currency sight deposits, received foreign cur-rency deposits and received foreign currency loans, as well as obliga-tions arising from securities issued in foreign currency (excluding banks’ equity securities). From November 2001 on, the base includes also hybrid and subordinated instruments.
Column 7 shows the total amount of other obligatory deposits with the CNB, including CNB bills on an obligatory basis, those CNB bills on a voluntary basis used by banks to maintain the prescribed minimal liquidity (LAR), special statutory reserves until July 1995, special reserve requirement on liabilities arising from issued securi-ties from March 2006, statutory reserves on f/c deposits, f/c credits from foreign banks and guarantees for such credits and marginal reserve requirement (from August 2004).
Column 8 shows the portion of the kuna reserve requirement which banks deposit in a statutory reserve account with the CNB (until December 1994, this amount corresponded with the statutory reserve instrument, while since January 1995 a minimum percentage of the total reserve requirement banks are required to deposit in a special statutory reserve account with the CNB has been prescribed). In April 2005, this percentage was set at 70%.
Column 9 shows the portion of the foreign currency reserve requirement which banks deposit in the CNB’s foreign currency accounts. The percentage for allocating the foreign currency com-ponent of reserve requirements calculated on the basis of foreign currency funds of non-residents and foreign currency funds received from legal persons in a special relationship with a bank amounts to 100%, while the percentage for allocating the remaining portion of

CNB BULLETIN • NUMBER 130 • STATISTICAL SURVEY • MONETARY POLICY INSTRUMENTS AND LIQUIDITY
71
Table F4: Banks’ Liquidity Indicatorsdaily averages and percentages, million kuna and %
Year MonthFree reserves Primary liquidity
ratioSecondary liquidity
sources Kuna CNB bills F/c CNB bills Kuna MoF treasury billsIn kuna In f/c
1 2 3 4 5 6 7 8 9
1994 December 119.5 .... 1.72 393.7 210.2 – –
1995 December 49.4 .... 0.63 199.4 218.7 – –
1996 December 267.9 .... 2.63 98.5 780.9 – 183.8
1997 December 396.3 .... 2.92 32.7 728.9 – 260.7
1998 December 221.9 .... 1.65 445.5 850.4 1,377.4 141.3
1999 December 179.6 .... 1.30 1,183.6 1,311.1 1,507.6 373.9
2000 December 638.8 10,721.4 3.32 80.1 2,485.3 1,692.7 2,006.5
2001 December 794.4 17,247.4 3.23 2.6 2,656.2 2,630.8 3,360.9
2002 December 1,225.0 10,398.0 3.53 0.6 4,965.5 1,273.9 4,279.5
2003 December 451.6 20,561.4 0.98 501.6 0.0 4,316.0 3,073.2
2004 December 1,495.5 26,126.1 2.64 0.0 0.0 0.0 4,581.7
2005 December 672.5 20,493.4 0.96 0.2 0.0 0.0 4,163.3
2006 September 308.9 17,278.4 0.32 0.0 0.0 0.0 5,322.3
October 403.0 20,011.2 0.41 25.3 0.0 0.0 5,196.8
November 483.8 20,020.1 0.49 0.0 0.0 0.0 6,912.6
December 840.8 20,239.1 0.83 0.0 0.0 0.0 5,993.7
2007 January 560.9 19,754.3 0.55 0.1 0.0 0.0 6,830.1
February 465.9 17,987.7 0.45 5.8 0.0 0.0 5,731.7
March 599.2 17,066.6 0.58 5.7 0.0 0.0 4,954.9
April 523.5 17,941.3 0.50 5.8 0.0 0.0 3,990.1
May 604.4 18,619.1 0.57 5.7 0.0 0.0 2,954.1
June 862.0 20,836.6 0.81 30.6 0.0 0.0 3,629.0
July 948.2 22,189.3 0.87 61.0 0.0 0.0 2,502.7
August 756.4 24,793.4 0.69 5.7 0.0 0.0 3,766.6
the foreign currency component of reserve requirements amounts to 60%.
Column 10 shows the weighted average remuneration rate on all forms of immobilised kuna funds which include reserve requirements and other obligatory deposits with the CNB.
Column 11 shows the weighted average remuneration rate on allocated funds in foreign currency, including the marginal reserve requirement funds (from August 2004 on). From June 2005 on, the CNB pays remuneration equalling 50% of the US Federal Funds Tar-get Rate for the funds allocated in US dollars and 50% of the ECB Minimum Bid Refinance Rate for the funds allocated in euros. In both cases the rate in effect on the day of allocation is applied.
Table F4: Banks’ Liquidity Indicators
The table reports monthly averages of day-to-day balances of some indicators of banks’ liquidity. Savings banks are included be-ginning in July 1999.
Column 3 shows free reserves in kuna, defined as bank’s total re-serves (in settlement accounts and in vaults) decreased by the mini-mal average settlement account and vault balance, as prescribed by instruments of the CNB.
Column 4 shows free reserves in foreign currency, defined as
funds for the maintenance of foreign currency reserve requirements (foreign cash and checks in foreign currency, liquid foreign currency claims maintained in the accounts with the high-grade foreign banks and foreign currency CNB bills) decreased by the minimal required balance of these funds in the same period.
Column 5 shows the primary liquidity ratio as a percentage of monthly day-to-day kuna free reserves averages (column 3) in monthly day-to-day averages of deposits which constitute the reserve base.
Column 6 shows the monthly average of day-to-day balances of secondary liquidity sources used. Secondary liquidity sources com-prise: Lombard credits (since December 1994), short-term liquidity credits (since February 1999) and overdue liabilities to the CNB.
Column 7 reports the monthly average of day-to-day balances of kuna CNB bills on a voluntary basis (until December 1994, this amount is decreased by the portion of voluntarily registered CNB bills used by banks to maintain the prescribed minimal liquidity).
Column 8 reports the monthly average of day-to-day balances of foreign currency CNB bills on a voluntary basis (in EUR and USD).
Column 9 reports the monthly average of day-to-day balances of kuna MoF treasury bills. Until September 2002, it shows the dis-counted value of treasury bills, while starting from October 2002, it shows their nominal value.

CNB BULLETIN • NUMBER 130 • STATISTICAL SURVEY • FINANCIAL MARKETS
72
Table G1: Banks’ Interest Rates on Kuna Credits Not Indexed to Foreign Currencyweighted averages of monthly interest rates, in % on annual basis
Year Month
Money market interest rates Interest rates on kuna credits not indexed to foreign currency
On overnight
credits
On other credits
Total average
On short-term credits On long-term credits
Total average Enterprises
HouseholdsTotal
average Enterprises HouseholdsTotal average
Credit lines Other
1 2 3 4 5 6 7 8 9 10 11 12 13
1994 December 8.50 17.76 15.39 15.43 .... .... .... .... 13.82 .... ....
1995 December 27.26 27.15 22.32 22.56 22.23 23.81 23.75 25.58 13.48 13.39 14.38
1996 December 9.66 10.72 18.46 19.35 19.18 20.18 19.90 23.12 11.51 11.29 14.28
1997 December 8.46 9.49 14.06 14.12 13.17 19.26 19.34 18.11 13.24 12.98 13.75
1998 December 10.00 15.91 16.06 16.22 14.89 20.77 20.80 19.92 11.73 11.48 13.16
1999 December 9.92 12.78 13.54 13.52 10.55 20.83 20.84 20.39 15.14 15.31 14.16
2000 December 2.39 4.45 10.45 10.45 6.81 20.30 20.33 19.05 9.90 9.64 12.97
2001 December 2.49 2.18 9.51 9.49 5.43 18.81 18.85 14.88 11.42 10.06 13.14
2002 December 1.58 1.89 10.91 11.24 7.44 15.16 15.28 9.84 7.32 6.48 7.88
2003 December 5.47 7.02 11.45 11.80 8.02 14.89 15.01 12.38 8.51 6.14 10.69
2004 December 3.55 6.02 11.44 11.71 8.33 14.19 14.27 12.29 9.31 6.90 11.16
2005 December 2.29 3.61 9.91 9.99 7.71 11.26 13.18 5.35 8.75 6.48 10.35
2006 September 2.34 3.26 9.45 9.62 7.14 11.00 13.44 4.59 8.52 5.97 9.91
October 2.13 3.43 9.61 9.86 6.94 11.60 13.54 4.58 8.12 6.09 9.75
November 1.23 3.32 9.50 9.78 6.69 12.28 13.51 4.63 8.05 6.32 9.43
December 2.02 3.52 9.07 9.37 6.75 11.84 13.21 4.67 7.53 5.86 9.44
2007 January 1.79 3.57 9.56 9.72 6.92 11.96 13.10 4.54 8.54 6.35 9.45
February 2.19 3.79 9.59 9.83 7.03 12.10 13.18 4.71 8.40 6.79 9.39
March 2.68 3.60 8.99 9.45 6.68 12.14 13.17 4.82 7.44 5.79 9.17
April 3.24 3.76 9.36 9.64 6.80 12.22 13.16 5.08 8.11 6.38 9.07
May 3.84 4.27 9.21 9.52 6.74 12.23 13.16 5.55 7.96 6.54 8.79
June 5.11 5.54 9.28 9.69 7.03 12.29 13.18 5.12 7.84 6.52 8.77
July 4.87 6.50 9.13 9.51 6.77 12.30 13.17 5.34 7.75 6.64 8.45
August 2.85 4.25 9.46 10.02 7.12 12.16 13.23 4.95 7.42 6.53 7.95
Relative significancea – – 82.83 64.96 27.57 37.39 32.56 4.83 17.87 6.67 11.20a Relative significance is calculated as a percentage of corresponding credit category in total credits disbursed in the reporting month (according to data for the last period included in the table).Note: A break in the time series occurred due to changes in the methodology used in interest rate statistics as of 1 January 2001. This especially refers to interest rates shown in columns5, 6 and 7. Interbank credits, which bear relatively low interest rates, were, among others, excluded from short-term credits to enterprises. The increase in interest rates was also caused by the weighting method: all categories are weighted by the amounts of newly-granted credits, except credit lines whose relative share grew in the new coverage, which are weighted by book balances.
Table G1: Banks’ Interest Rates on Kuna Credits Not Indexed to Foreign Currency
The table contains the weighted averages of banks’ monthly in-terest rates on kuna credits not indexed to f/c, reported on a yearly basis.
Up to December 2001, data refer to the weighted averages of banks’ monthly interest rates on kuna credits not indexed to f/c granted to legal persons (which included enterprises, the public sec-tor, financial institutions, non-profit institutions and non-residents) and households, reported on a yearly basis. Savings banks are not covered.
From January 2002 on, data refer to the weighted averages of banks’ monthly interest rates on kuna credits not indexed to f/c granted only to enterprises (public and other) and households, re-ported on a yearly basis.
Up to February 1996, columns 3 and 4 show interest rates on the interbank money market, according to information published by
the Zagreb Money Market (ZMM). From March 1996 on, interest rates on the money market are calculated as the weighted monthly averages of the weighted daily interest rates and shown separately for trading in overnight credits and trading in other credits on the ZMM. In the period between May 1998 and January 2001, the repayment of credits granted on the interbank overnight market was guaranteed by banks’ required reserves with the CNB.
Columns 5 through 13 show the weighted averages of banks’ monthly interest rates classified by maturity and sectors. Interest rates on short-term credits to enterprises also include interest rates on callable loans.
Data on banks’ interest rates on kuna credits not indexed to f/c are based on banks’ periodic reports. The basis for the calculation of the weighted averages are amounts of credits bearing correspond-ing interest rates, which were disbursed during the reporting month, with the exception of interest rates on giro and current account credit lines, for which the weighted averages were calculated based on the balance of these loans at the end of the reporting month.

CNB BULLETIN • NUMBER 130 • STATISTICAL SURVEY • FINANCIAL MARKETS
73
Table G2: Banks’ Interest Rates on Kuna Credits Indexed to Foreign Currency and on Credits in Eurosweighted averages of monthly interest rates, in % on annual basis
Year Month
Interest rates on kuna credits indexed to foreign currency Interest rates on credits in euros
Total average
On short-term credits On long-term credits
Total average
On short-term
credits
On long-term
creditsTotal
average Enterprises Households Total average Enterprises
Households
Total average
Housing credits Other
1 2 3 4 5 6 7 8 9 10 11 12 13 14
1994 December 11.99 12.38 .... .... 11.65 .... .... .... .... .... .... ....
1995 December 19.56 21.62 21.09 18.10 14.33 15.79 10.48 .... .... 17.18 19.06 12.27
1996 December 18.97 22.56 22.40 27.00 12.12 13.15 11.30 .... .... 19.50 21.46 10.77
1997 December 14.40 16.92 17.00 14.02 12.25 13.00 11.02 .... .... 13.61 14.95 9.71
1998 December 13.04 14.28 14.25 13.64 11.15 10.55 12.12 .... .... 6.95 8.37 5.71
1999 December 12.53 13.66 13.54 17.21 10.81 10.46 11.65 .... .... 6.75 7.43 6.07
2000 December 10.74 11.17 11.10 13.59 10.52 9.41 11.64 .... .... 7.70 7.49 8.05
2001 December 9.29 9.45 9.45 11.30 9.20 7.52 10.79 .... .... 5.94 5.70 7.27
2002 December 8.25 9.34 8.72 11.37 7.98 6.37 9.50 7.42 10.11 5.91 6.66 5.44
2003 December 7.07 7.21 7.00 8.66 7.03 5.76 8.04 6.02 9.70 5.62 6.22 5.18
2004 December 6.89 7.25 7.09 8.47 6.77 5.55 7.73 5.71 8.79 5.34 5.92 4.83
2005 December 6.18 6.52 6.34 7.91 6.07 5.18 6.98 4.95 8.10 5.29 5.28 5.30
2006 September 6.40 6.31 6.09 7.36 6.42 5.80 6.73 4.86 8.15 5.22 5.24 5.19
October 6.38 6.79 6.33 7.98 6.26 6.18 6.31 4.84 7.81 5.52 5.24 5.75
November 6.20 5.99 5.74 7.33 6.26 6.14 6.33 4.74 7.74 6.08 5.95 6.33
December 6.30 6.56 6.29 8.33 6.22 6.21 6.22 4.75 7.57 5.65 6.19 5.34
2007 January 6.15 6.39 6.11 7.75 6.10 5.84 6.28 4.75 7.73 6.00 6.31 5.64
February 6.31 6.33 6.06 7.60 6.31 6.11 6.40 4.80 7.80 6.01 6.05 5.93
March 6.33 6.53 6.44 6.80 6.30 6.03 6.44 4.87 7.69 6.12 6.15 6.09
April 6.11 6.69 6.51 7.15 6.01 5.93 6.06 4.85 7.39 6.15 6.17 6.12
May 6.12 6.56 6.59 6.49 6.05 6.32 5.91 4.90 7.11 6.28 6.41 6.03
June 5.98 6.54 6.53 6.59 5.89 5.81 5.97 4.86 7.11 6.32 6.32 6.32
July 6.11 6.33 6.20 7.17 6.05 5.96 6.15 4.92 7.26 6.52 6.58 6.44
August 6.46 6.86 6.96 6.19 6.37 6.28 6.46 4.92 7.71 6.71 6.82 6.40
Relative significancea 13.66 2.53 2.20 0.33 11.13 5.16 5.97 2.68 3.29 3.51 2.63 0.88a Relative significance is calculated as a percentage of corresponding credit category in total credits disbursed in the reporting month (according to data for the last period included in the table).
Table G2: Banks’ Interest Rates on Kuna Credits Indexed to Foreign Currency and on Credits in Euros
The table contains the weighted averages of banks’ monthly in-terest rates on kuna credits indexed to f/c and on credits in euros, reported on a yearly basis.
Up to December 2001, data refer to the weighted averages of banks’ monthly interest rates on kuna credits indexed to f/c and on credits in euros (or German marks) granted to legal persons (which included enterprises, the public sector, financial institutions, non-profit institutions and non-residents) and households, reported on a yearly basis. Savings banks are not covered.
From January 2002 on, data refer to the weighted averages of banks’ monthly interest rates on kuna credits indexed to f/c and on credits in euros granted only to enterprises (public and other) and households, reported on a yearly basis.
Data on banks’ interest rates on kuna credits indexed to f/c and on credits in euros are based on banks’ periodic reports. The basis for the calculation of the weighted averages are amounts of credits bearing corresponding interest rates, which were disbursed during the reporting month.
Columns 3 through 11 show the weighted averages of banks’ monthly interest rates classified by maturity and sectors. Interest rates on short-term credits to enterprises also include interest rates on callable loans.
Up to December 2001, interest rates on credits in euros (columns 12, 13 and 14) refer to credits released in German marks in the re-porting month, and starting from January 2002, they refer to credits released in euros, while the weighted averages are calculated based on their kuna equivalent using the current exchange rate. Credits released in other currencies are not included in this table.

CNB BULLETIN • NUMBER 130 • STATISTICAL SURVEY • FINANCIAL MARKETS
74
Table G3: Banks’ Interest Rates on Kuna Deposits Not Indexed to Foreign Currencyweighted averages of monthly interest rates, in % on annual basis
Year Month
Interest rates on kuna deposits not indexed to foreign currency
Total average
In giro and current
accounts
On time deposits
Total average
On short-term deposits On long-term deposits
Total average Households Enterprises Total
average Households Enterprises
1 2 3 4 5 6 7 8 9 10 11
1994 December 5.03 3.55 9.65 .... .... .... .... .... ....
1995 December 6.10 3.88 13.65 13.80 10.56 14.28 9.88 10.67 9.62
1996 December 4.15 2.19 10.19 10.11 9.84 10.26 12.36 15.49 9.88
1997 December 4.35 2.19 9.10 9.08 9.30 8.96 9.48 11.24 8.06
1998 December 4.11 2.31 7.73 7.63 9.47 7.15 10.19 10.72 9.56
1999 December 4.27 2.24 8.87 8.79 9.62 8.38 10.96 11.56 10.18
2000 December 3.40 1.64 7.20 7.13 7.44 7.03 8.89 9.19 8.63
2001 December 2.76 1.40 5.68 5.60 6.35 5.38 7.35 7.93 6.70
2002 December 1.55 0.94 3.64 3.53 4.39 2.86 6.05 7.24 3.23
2003 December 1.66 0.75 4.46 4.46 3.62 4.69 4.58 4.90 2.82
2004 December 1.83 0.74 4.11 4.11 3.93 4.13 4.10 4.65 3.30
2005 December 1.58 0.61 3.36 3.34 3.89 3.23 4.12 5.04 3.49
2006 September 1.79 0.54 3.45 3.43 4.05 3.27 4.04 4.82 2.60
October 1.85 0.55 3.53 3.51 4.10 3.33 4.36 4.80 3.13
November 1.88 0.55 3.10 2.92 3.99 2.55 3.92 4.79 3.82
December 1.91 0.56 2.98 2.94 4.10 2.69 4.32 4.98 3.11
2007 January 2.06 0.54 3.56 3.43 4.15 3.12 4.07 4.72 3.97
February 2.07 0.53 3.46 3.41 4.13 3.12 4.46 4.85 3.65
March 2.05 0.54 3.48 3.34 4.04 3.10 4.13 4.82 4.02
April 2.06 0.54 3.58 3.44 4.03 3.24 4.28 5.20 4.14
May 2.16 0.55 3.75 3.65 4.12 3.50 4.32 5.20 4.16
June 2.40 0.55 4.55 4.52 4.12 4.63 4.75 5.15 4.68
July 2.45 0.49 4.95 4.86 4.20 5.02 5.88 5.30 6.03
August 2.37 0.48 4.25 4.14 4.31 4.10 5.20 5.51 5.13
Relative significancea 57.00 34.02 19.77 17.71 3.14 14.57 2.06 0.42 1.64a Relative significance is calculated as a percentage of corresponding deposit category in total deposits received in the reporting month (according to data for the last period included in the table).
Table G3: Banks’ Interest Rates on Kuna Deposits Not Indexed to Foreign Currency
The table contains the weighted averages of banks’ monthly inter-est rates on kuna deposits not indexed to f/c, reported on a yearly basis.
Up to December 2001, data refer to the weighted averages of banks’ monthly interest rates on kuna deposits not indexed to f/c received from legal persons (which included enterprises, the public sector, financial institutions, non-profit institutions and non-resi-dents) and households, reported on a yearly basis. Savings banks are not covered.
From January 2002 on, data refer to the weighted averages of banks’ monthly interest rates on kuna deposits not indexed to f/c re-ceived from enterprises (public and other) and households, reported on a yearly basis.
Data on banks’ interest rates on kuna deposits not indexed to f/c are based on banks’ periodic reports.
Column 3 reports the weighted averages of monthly interest rates
on total kuna deposits (giro and current accounts, household savings deposits and time deposits) not indexed to f/c.
Column 4 shows the weighted averages of monthly interest rates on deposits in giro and current accounts not indexed to f/c received from enterprises (until December 2001, all legal persons) and house-holds, and column 5 shows the weighted averages of monthly interest rates on total time deposits not indexed to f/c.
The basis for the calculation of the weighted averages for kuna time deposits not indexed to f/c are the amounts of those deposits received during the reporting month. The basis for the calculation of the weighted averages for deposits in giro and current accounts are the end-of-month book balances of those deposits. The averages of interest rates on total kuna deposits not indexed to f/c (column 3) are weighted by the end-of-month balances of all categories included in the calculation.
Kuna and foreign currency deposits used as collateral for credit are included, while restricted deposits (deposits used for payment of imports and other restricted deposits) are not included into the calculation of the weighted averages.

CNB BULLETIN • NUMBER 130 • STATISTICAL SURVEY • FINANCIAL MARKETS
75
Table G4a: Banks’ Interest Rates on Kuna Deposits Indexed to Foreign Currency and on Foreign Currency Depositsweighted averages of monthly interest rates, in % on annual basis
Year Month
Interest rates on savings and time deposits indexed to f/c
Interest rates on foreign currency deposits
Total average
Savings deposits
Total average
On short-term deposits
On long-term deposits
Total average
Households Enterprises
EUR USD EUR USD1 2 3 4 5 6 7 8 9 10 11
1994 December 6.95 .... .... .... .... .... .... .... ....
1995 December 12.69 11.46 19.36 4.57 2.82 3.53 4.20 1.10 1.53
1996 December 9.46 9.56 8.80 5.09 1.44 1.32 1.95 1.47 1.39
1997 December 7.63 7.24 11.77 4.77 1.75 1.89 2.43 0.83 1.40
1998 December 7.47 7.67 5.58 3.98 2.09 2.38 2.40 0.72 0.74
1999 December 6.62 6.91 1.10 4.23 1.80 1.95 2.04 0.78 1.30
2000 December 5.54 5.94 2.16 3.47 1.03 0.99 1.23 0.65 1.29
2001 December 4.58 4.92 2.56 2.60 0.71 0.71 0.81 0.82 0.40
2002 December 2.92 3.45 1.48 2.55 0.50 0.52 0.41 0.52 0.38
2003 December 3.48 3.74 5.55 2.22 0.31 0.35 0.23 0.23 0.15
2004 December 4.17 3.61 5.19 2.65 0.31 0.34 0.22 0.22 0.21
2005 December 3.99 3.63 4.77 2.61 0.27 0.27 0.17 0.27 0.76
2006 September 4.46 3.88 5.05 2.78 0.25 0.23 0.16 0.33 0.63
October 4.21 3.50 5.66 2.87 0.26 0.23 0.17 0.36 0.69
November 3.66 3.52 3.36 2.91 0.25 0.23 0.17 0.34 0.59
December 3.67 3.30 4.07 2.94 0.25 0.23 0.17 0.32 0.44
2007 January 3.85 3.98 4.22 2.99 0.25 0.23 0.16 0.37 0.40
February 3.96 3.56 4.31 3.01 0.25 0.23 0.17 0.34 0.46
March 4.15 3.52 4.46 3.04 0.25 0.23 0.16 0.33 0.45
April 3.85 3.54 4.37 3.13 0.25 0.23 0.16 0.35 0.43
May 3.71 3.58 4.51 3.11 0.25 0.24 0.17 0.36 0.40
June 3.89 3.74 4.58 3.08 0.26 0.24 0.17 0.35 0.59
July 3.68 3.89 4.76 3.22 0.25 0.23 0.17 0.34 0.48
August 3.96b 3.79 4.74 3.33 0.26 0.23 0.17 0.33 0.60
Relative significancea 1.36 1.11 0.24 41.64 22.74 15.84 2.01 4.35 0.53a Relative significance is calculated as a percentage of corresponding deposit category in total deposits received in the reporting month (according to data for the last period included in the table). b Of the total amount of deposits to which this interest rate refers, 23.12 percent refers to enterprises.
Table G4a and b: Banks’ Interest Rates on Kuna Deposits Indexed to Foreign Currency and on Foreign Currency Deposits
The table contains the weighted averages of banks’ monthly in-terest rates on kuna deposits indexed to f/c and on foreign currency deposits, reported on a yearly basis.
Up to December 2001, data refer to the weighted averages of banks’ monthly interest rates on kuna deposits indexed to f/c and on foreign currency deposits received from legal persons (which included enterprises, the public sector, financial institutions, non-profit institutions and non-residents) and households, reported on a yearly basis. Savings banks are not covered.
From January 2002 on, data refer to the weighted averages of banks’ monthly interest rates on kuna deposits indexed to f/c and on foreign currency deposits received from enterprises (public and other) and households, reported on a yearly basis.
Data on banks’ interest rates on kuna deposits indexed to f/c and on foreign currency deposits are based on banks’ periodic reports.
Column 3 reports the weighted averages of monthly interest rates on total kuna savings and time deposits indexed to f/c received from enterprises (until December 2001, all legal persons) and households, whereas the weighted averages of monthly interest rates on time de-posits are shown in column 4 (short-term deposits) and column 5 (long-term deposits) respectively.
Up to December 2001, interest rates on foreign currency deposits refer to deposits received in German marks or US dollars, and start-
ing from January 2002, they refer to deposits received in euros and US dollars, while the weighted averages are calculated based on their kuna equivalent using the current exchange rate. Deposits received in other currencies are not included in this table.
The basis for the calculation of the weighted averages for kuna time deposits indexed to f/c and foreign currency time deposits are the amounts of those deposits received during the reporting month. The basis for the calculation of the weighted averages for savings deposits indexed to f/c are the end-of-month book balances of those deposits. From January 2002 on, the averages of interest rates on total kuna deposits indexed to f/c (column 3) are weighted by the end-of-month balances of all categories included in the calculation.
The average interest rate on total foreign currency deposits (col-umn 6) refers to the weighted average of monthly interest rates on savings and time deposits indexed to f/c, which are weighted by the end-of-month balances of all categories included in the calculation.
The basis for the calculation of the weighted averages of monthly interest rates on total foreign currency savings deposits (column 7) are the end-of-month balances of those deposits.
The basis for the calculation of the weighted averages of monthly interest rates on total foreign currency time deposits (column 12) are the amounts of those deposits received during the reporting month. The same basis is applied in calculating the weighted averages of monthly interest rates on total short-term foreign currency deposits (column 13) and on total long-term foreign currency deposits (col-umn 18).

CNB BULLETIN • NUMBER 130 • STATISTICAL SURVEY • FINANCIAL MARKETS
76
Table G4b: Banks’ Interest Rates on Kuna Deposits Indexed to Foreign Currency and on Foreign Currency Depositsweighted averages of monthly interest rates, in % on annual basis
Year Month
Interest rates on foreign currency deposits
On time deposits
Total average
On short-term deposits On long-term deposits
Total average
Households Enterprises Total average
Households Enterprises
EUR USD EUR USD EUR USD EUR USD1 2 12 13 14 15 16 17 18 19 20 21 22
1994 December .... .... .... .... .... .... .... .... .... .... ....
1995 December 6.83 6.66 7.10 6.97 5.86 6.68 8.73 8.78 8.81 3.27 4.50
1996 December 7.77 6.95 5.65 6.21 9.86 5.47 12.24 7.71 7.97 19.92 1.50
1997 December 6.36 6.07 6.03 6.42 5.09 7.10 7.32 7.87 8.71 5.09 6.76
1998 December 4.89 4.49 5.42 6.16 2.84 5.37 7.29 7.68 8.59 4.93 6.92
1999 December 5.43 5.17 4.93 6.39 3.97 6.00 6.59 6.64 8.09 3.66 6.77
2000 December 4.57 4.36 3.65 5.15 4.59 6.62 5.56 5.17 6.61 5.97 8.53
2001 December 3.54 3.35 3.42 3.23 3.60 2.44 4.59 4.72 4.42 4.58 0.23
2002 December 3.13 2.96 3.27 2.21 2.89 1.43 4.59 4.69 3.84 3.46 2.30
2003 December 2.64 2.46 2.83 1.65 2.29 1.08 3.69 4.71 3.13 2.85 1.64
2004 December 2.85 2.65 3.01 1.69 2.46 2.28 4.20 4.85 3.13 3.61 2.65
2005 December 3.07 2.94 2.99 1.76 2.63 4.34 3.69 4.25 0.48 4.39 –
2006 September 3.53 3.50 3.09 1.89 3.83 5.66 3.74 4.55 1.01 4.06 –
October 3.71 3.63 3.19 2.02 3.99 5.68 4.25 4.58 2.07 4.37 6.86
November 3.77 3.69 3.20 2.03 4.09 5.68 4.31 4.62 1.79 4.34 4.89
December 3.82 3.76 3.16 2.05 4.24 5.84 4.25 4.47 2.26 4.79 4.61
2007 January 3.80 3.71 3.19 2.14 4.39 5.78 4.44 4.51 3.32 3.79 6.29
February 3.86 3.77 3.21 2.15 4.50 5.88 4.45 4.54 3.97 2.65 2.00
March 3.87 3.77 3.16 2.08 4.59 5.89 4.47 4.56 3.71 3.95 1.81
April 3.92 3.84 3.16 2.10 4.74 5.96 4.53 4.59 3.89 4.24 –
May 4.00 3.93 3.21 2.09 4.51 5.57 4.52 4.58 3.64 4.17 5.17
June 4.05 4.02 3.20 2.16 4.80 5.72 4.30 4.31 3.71 4.94 –
July 4.23 4.17 3.28 2.11 4.87 6.02 4.69 4.71 3.84 5.25 2.96
August 4.16 4.05 3.43 2.24 4.67 5.89 4.79 4.80 3.90 5.49 –
Relative significancea 18.90 16.24 8.29 0.61 5.89 1.44 2.67 2.45 0.12 0.10 –a Relative significance is calculated as a percentage of corresponding deposit category in total deposits received in the reporting month (according to data for the last period included in the table).

CNB BULLETIN • NUMBER 130 • STATISTICAL SURVEY • FINANCIAL MARKETS
77
Table G5: Banks’ Trade with Foreign Exchangemillion euros, current exchange rate
2001 2002 2003 2004 2005 20062007
Mar. Jun. Jul. Aug. Sep.a
A. Purchase of foreign exchange
1. Legal persons 5,012.4 4,727.8 6,433.1 7,465.3 8,443.5 14,442.7 1,362.0 1,511.1 2,339.2 1,663.7 1,790.3
2. Natural persons 3,339.9 3,342.6 3,571.6 3,934.4 4,931.8 6,262.7 418.0 452.6 639.3 551.0 843.3
2.1. Residents 2,684.5 2,842.0 3,103.3 3,586.1 4,662.6 5,909.4 393.0 385.0 533.3 – –
2.2. Non-residents 655.4 500.7 468.2 348.3 269.2 353.2 25.0 67.6 106.0 – –
3. Domestic banks 3,985.8 4,104.5 6,324.4 10,799.3 9,069.9 14,380.1 1,518.0 1,536.5 1,308.3 1,026.7 1,443.3
4. Foreign banks – 697.9 1,430.6 1,426.2 2,602.3 5,056.8 614.0 282.1 346.4 202.0 212.6
5. Croatian National Bank 481.7 294.3 438.3 33.0 0.0 125.5 – – – – –
Total (1+2+3+4) 12,819.8 13,167.1 18,197.9 24,110.1 25,106.0 40,439.5 3,912.0 3,782.3 4,633.1 3,443.4 4,289.4
B. Sale of foreign exchange
1. Legal persons 8,534.2 9,029.3 10,852.4 11,280.3 13,022.3 17,515.0 1,795.5 1,989.3 2,154.4 2,116.2 2,376.4
2. Natural persons 1,253.5 1,333.6 1,403.1 1,671.1 2,722.5 4,109.1 276.6 199.0 402.8 323.4 214.8
2.1. Residents 1,252.3 1,329.7 1,393.1 1,654.5 2,693.9 4,056.4 271.6 191.9 390.5 – –
2.2. Non-residents 1.2 3.9 10.0 16.6 28.6 52.6 5.0 7.0 12.3 – –
3. Domestic banks 3,985.8 4,104.5 6,324.4 10,799.3 9,069.9 14,380.1 1,518.0 1,536.5 1,308.3 1,026.7 1,443.3
4. Foreign banks – 334.3 765.3 1,001.1 1,407.1 3,526.1 168.4 371.7 529.4 251.2 359.3
5. Croatian National Bank 915.7 745.3 84.5 543.2 670.8 1,329.5 – 0.0 139.0 – –
Total (1+2+3+4) 14,689.2 15,547.0 19,429.7 25,295.0 26,892.7 40,859.7 3,758.5 4,096.5 4,533.9 3,717.5 4,393.7
C. Net purchase (A-B)
1. Legal persons –3,521.8 –4,301.5 –4,419.4 –3,815.1 –4,578.8 –3,072.3 –433.4 –478.2 184.7 –452.5 –586.2
2. Natural persons 2,086.4 2,009.0 2,168.4 2,263.3 2,209.3 2,153.6 141.4 253.7 236.5 227.6 628.5
2.1. Residents 1,432.2 1,512.3 1,710.2 1,931.6 1,968.7 1,853.0 121.4 193.1 142.8 – –
2.2. Non-residents 654.2 496.7 458.2 331.7 240.6 300.6 20.0 60.6 93.7 – –
3. Foreign banks – 363.6 665.3 425.1 1,195.2 1,530.7 445.6 –89.6 –183.0 –49.2 –146.7
4. Croatian National Bank –434.0 –451.0 353.8 –510.2 –670.8 –1,204.0 – – –139.0 – –
Total (1+2+3) –1,869.4 –2,379.9 –1,231.8 –1,636.9 –1,845.2 –592.1 153.5 –314.2 99.3 –274.1 –104.3
Memo items: Other Croatian National Bank transactions
Purchase of foreign exchange 536.8 197.5 570.9 145.1 – 3.1 0.2 0.6 0.2 – 0.3
Sale of foreign exchange 2.6 3.4 94.9 239.3 167.6 441.3 64.9 5.0 – 0.0 3.3a Preliminary data.Note: In the period from January 1994 to September 2001 all foreign exchange sale and purchase transactions in banks’ reports delivered to the CNB were recorded based on realised sale/purchase transaction regardless of the contracted term for realisation and were as such transferred into the Table on Banks’ Trade with Foreign Exchange. As of the of change in the reporting scope dated 1 October 2001 reports contain data on contracted sale and purchase of foreign exchange broken down by spot, forward and swap transactions. Based on the aforesaid the data for 2002, 2003 and 2004 have been revised so as to include only the data on contracted spot transactions with banks no longer included into the “legal persons” category.
Table G5: Banks’ Trade with Foreign Exchange
Data on trade with foreign exchange between banks comprise the spot purchase and sale of foreign exchange in domestic foreign ex-change market. Spot transactions are contracted obligations to buy/sell foreign currency within maximally 48 hours.
The transactions are classified by category of participants (legal and natural persons, domestic and foreign banks and the CNB). Sources of data are banks’ reports on trading with foreign exchange and statistical data on external payment operations.
Other Croatian National Bank transactions include foreign ex-change sales and purchases on behalf of the Ministry of Finance.

CNB BULLETIN • NUMBER 130 • STATISTICAL SURVEY • INTERNATIONAL ECONOMIC RELATIONS
78
Table H1: Balance of Payments – Summarymillion euros
2001a 2002a 2003a 2004a 2005a 2006a2007
Q1a Q2b
A. CURRENT ACCOUNT (1+6) –820.8 –2,098.7 –1,888.8 –1,453.6 –1,988.0 –2,646.5 –2,022.3 –1,349.7
1. Goods, services, and income (2+5) –1,920.3 –3,250.8 –3,133.3 –2,645.4 –3,171.8 –3,752.7 –2,267.7 –1,612.2
1.1. Credit 11,293.4 11,590.1 13,590.1 14,853.6 15,884.1 17,817.5 3,090.1 4,802.2
1.2. Debit –13,213.7 –14,841.0 –16,723.5 –17,499.1 –19,055.9 –21,570.2 –5,357.8 –6,414.4
2. Goods and services (3+4) –1,292.3 –2,673.1 –2,038.1 –1,955.3 –2,200.2 –2,633.8 –2,049.8 –1,014.7
2.1. Credit 10,808.8 11,127.9 13,140.6 14,243.5 15,272.9 16,997.7 2,819.4 4,492.6
2.2. Debit –12,101.1 –13,801.0 –15,178.7 –16,198.8 –17,473.2 –19,631.5 –4,869.1 –5,507.3
3. Goods –4,595.2 –5,957.9 –6,971.2 –6,724.2 –7,518.0 –8,344.2 –2,159.2 –2,534.7
3.1. Credit 5,327.5 5,295.6 5,574.7 6,606.8 7,220.3 8,463.6 2,046.3 2,295.2
3.2. Debit –9,922.6 –11,253.5 –12,545.9 –13,330.9 –14,738.3 –16,807.8 –4,205.5 –4,829.9
4. Services 3,302.8 3,284.8 4,933.0 4,768.9 5,317.7 5,710.4 109.4 1,520.0
4.1. Credit 5,481.3 5,832.3 7,565.9 7,636.7 8,052.6 8,534.1 773.0 2,197.4
4.2. Debit –2,178.5 –2,547.5 –2,632.8 –2,867.8 –2,734.9 –2,823.7 –663.6 –677.4
5. Income –627.9 –577.7 –1,095.2 –690.1 –971.5 –1,118.9 –218.0 –597.5
5.1. Credit 484.7 462.3 449.5 610.2 611.2 819.8 270.7 309.6
5.2. Debit –1,112.6 –1,040.0 –1,544.7 –1,300.3 –1,582.7 –1,938.7 –488.7 –907.1
6. Current transfers 1,099.5 1,152.2 1,244.5 1,191.8 1,183.8 1,106.2 245.5 262.5
6.1. Credit 1,333.3 1,453.2 1,538.7 1,584.6 1,628.4 1,638.3 356.1 391.9
6.2. Debit –233.8 –301.1 –294.2 –392.8 –444.6 –532.1 –110.6 –129.4
B. CAPITAL AND FINANCIAL ACCOUNT 1,005.1 2,538.0 2,716.9 2,597.3 3,002.3 3,692.9 1,233.1 1,338.6
B1. Capital account 158.3 521.6 101.9 31.4 53.8 –133.8 6.0 9.0
B2. Financial account, excl. reserves 2,395.8 2,758.3 3,850.5 2,608.9 3,770.3 5,238.9 2,035.2 993.7
1. Direct investment 1,257.7 530.8 1,656.9 670.8 1,275.8 2,549.0 1,223.4 794.2
1.1. Abroad –209.8 –607.1 –105.5 –278.8 –192.1 –164.0 –90.0 –41.6
1.2. In Croatia 1,467.5 1,137.9 1,762.4 949.6 1,467.9 2,713.0 1,313.4 835.7
2. Portfolio investment 687.1 –437.7 867.6 266.5 –1,187.9 –527.2 –378.6 7.7
2.1. Assets –143.2 –650.5 121.6 –756.7 –581.3 –459.7 –301.3 –337.7
2.2. Liabilities 830.3 212.9 746.0 1,023.2 –606.7 –67.5 –77.3 345.4
3. Financial derivatives 0.0 0.0 0.0 0.0 –88.4 0.0 0.0 0.0
4. Other investment 451.0 2,665.1 1,326.0 1,671.6 3,770.8 3,217.1 1,190.4 191.9
4.1. Assets 396.1 460.0 –2,216.9 –452.0 976.6 –673.9 328.0 –195.4
4.2. Liabilities 54.8 2,205.0 3,542.9 2,123.6 2,794.2 3,891.0 862.4 387.3
B3. Reserve assets –1,549.0 –741.9 –1,235.5 –43.0 –821.8 –1,412.2 –808.2 335.9
C. NET ERRORS AND OMISSIONS –184.4 –439.3 –828.1 –1,143.7 –1,014.3 –1,046.4 789.2 11.1a Revised data. b Preliminary data.Note: The item net errors and omissions also comprises the counter entry of a part of revenues from travel services which relates to such revenues not stated in the banks’ records.
Table: H1-H6: Balance of Payments
The balance of payments of the Republic of Croatia represents a systematic overview of the value of economic transactions performed by the Croatian residents with foreign countries within a particular period. It is compiled in accordance with the recommendations of the International Monetary Fund (Balance of Payments Manual, Fifth Edition, 1993). Data sources include: 1. reports of the government institutions (Central Bureau of Statistics and Croatian Institute for Health Insurance), 2. special reports of the Croatian National Bank (International Transaction Reporting System (ITRS), external debt relations, monetary statistics and reserve assets) and 3. estimates and statistical research carried out by the Croatian National Bank.
Balance of payments of the Republic of Croatia data are reported in three currencies: in euros (EUR), US dollars (USD) and domestic currency (HRK). In all cases, the same data sources are used and the same principles regarding the scope of transactions and the proce-dures for compiling particular items are applied. Since the original data are reported in different currencies, the transaction values are converted from the original currency into the reporting currency by applying the exchange rate from the CNB exchange rate list in one of the following manners:
by applying the midpoint exchange rate on the date of the trans-
action;by applying the average monthly or quarterly midpoint exchange
rate in the case the transaction date is not available;by applying the end-of-period exchange rate for the calculation
of a change in the transaction value between the two periods; the end-of-period balances reported in the original currency serve as a basis for calculating the change in the original currency value, which is converted, by applying the average midpoint exchange rate in the observed period, into the value of change in the report-ing currency.The Report of the Central Bureau of Statistics on foreign trade in
goods of the Republic of Croatia represents the basic data source for the balance of payments items related to exports and imports. These data are adjusted, in accordance with the recommended compilation method, for coverage and classification. Accordingly, goods exports and imports in the balance of payments are reported at f.o.b. parity. The value of exports at this parity is already contained in the previ-ously mentioned CBS Report, whereas the value of imports f.o.b. is estimated on the basis of research studies of the CNB on the strati-fied sample of importers. The resulting value serves as a basis for the estimate of the share of transportation and insurance services by

CNB BULLETIN • NUMBER 130 • STATISTICAL SURVEY • INTERNATIONAL ECONOMIC RELATIONS
79
Table H2: Balance of Payments – Goods and Servicesmillion euros
2001a 2002a 2003a 2004a 2005a 2006a2007
Q1a Q2b
Goods –4,595.2 –5,957.9 –6,971.2 –6,724.2 –7,518.0 –8,344.2 –2,159.2 –2,534.7
1. Credit 5,327.5 5,295.6 5,574.7 6,606.8 7,220.3 8,463.6 2,046.3 2,295.2
1.1. Exports (f.o.b.) in trade statistics 5,214.1 5,188.2 5,464.4 6,453.8 7,069.4 8,251.6 2,009.8 2,251.8
1.2. Adjustments for coverage 113.3 107.4 110.4 153.0 150.9 212.0 36.5 43.4
2. Debit –9,922.6 –11,253.5 –12,545.9 –13,330.9 –14,738.3 –16,807.8 –4,205.5 –4,829.9
2.1. Imports (c.i.f.) in trade statistics –10,244.8 –11,327.0 –12,538.0 –13,354.4 –14,949.5 –17,104.7 –4,270.3 –4,880.9
2.2. Adjustments for coverage –405.3 –348.9 –475.6 –474.7 –346.4 –341.1 –64.6 –96.9
2.3. Adjustments for classification 727.4 422.5 467.7 498.1 557.6 638.0 129.4 147.9
Services 3,302.8 3,284.8 4,933.0 4,768.9 5,317.7 5,710.4 109.4 1,520.0
1. Transportation 186.1 172.0 252.2 299.3 376.1 424.7 95.7 115.4
1.1. Credit 658.6 622.8 696.3 791.3 880.3 987.9 228.1 273.1
1.2. Debit –472.5 –450.8 –444.1 –492.0 –504.2 –563.2 –132.4 –157.7
2. Travel 3,072.9 3,138.6 4,976.6 4,822.3 5,394.9 5,708.7 104.9 1,452.3
2.1. Credit 3,749.3 3,960.8 5,572.7 5,505.6 5,998.9 6,293.3 262.4 1,621.5
2.1.1. Business 305.8 341.2 260.9 328.2 504.0 388.4 56.5 125.5
2.1.2. Personal 3,443.6 3,619.7 5,311.8 5,177.4 5,494.9 5,904.9 205.9 1,495.9
2.2. Debit –676.5 –822.2 –596.1 –683.3 –604.1 –584.6 –157.5 –169.2
2.2.1. Business –322.7 –482.6 –292.3 –297.3 –267.4 –229.5 –44.5 –60.2
2.2.2. Personal –353.8 –339.6 –303.8 –386.0 –336.7 –355.1 –113.1 –109.0
3. Other services 43.9 –25.9 –295.8 –352.7 –453.3 –422.9 –91.2 –47.7
3.1. Credit 1,073.4 1,248.6 1,296.9 1,339.8 1,173.4 1,252.9 282.5 302.8
3.2. Debit –1,029.5 –1,274.5 –1,592.7 –1,692.5 –1,626.6 –1,675.8 –373.7 –350.5a Revised data. b Preliminary data.
which the original value of imports c.i.f., stated in the CBS Report, is reduced. In the 1993-2001 period, this share stood at 7.10% (es-timated only on the basis of the largest and large importers), while from 2002 on it has amounted to 3.73%. The same research study, conducted by the CNB at the end of 2006 (comprising the imports in the previous year), showed that the share of transportation and insurance costs, after continuing to decrease, has reached 3.03%. This share was first applied in the calculations for the first quarter of 2007. In the period from 1993 to 1996, the value of imports was modified by estimates of imports in duty free zones, which have been included in the merchandise trade statistics since 1997. From 1996 on, goods exports and imports are modified by the data on repairs on goods and goods procured in ports by carriers. In addition, since 1999, based on the Survey on Consumption of Foreign Travellers in Croatia and Domestic Travellers Abroad, the item of goods exports has been modified by the estimated value of goods sold to foreign travellers and tourists and taken out of the Republic of Croatia. The item of goods imports is adjusted for the estimated value of goods imported personally by the Croatian citizens from the neighbouring countries (shopping expenditures).
Transportation, travel and other services are reported separately under service account. Revenues and expenditures on the basis of transportation, in the 1993-1998 period, were adopted from the ITRS. From 1999 on, revenues and expenditures arising from trans-portation of goods and passengers, as well as the value of accom-panying services, which together constitute the total value of these services, are compiled on the basis of the results of the Research on transactions related to international transportation services, carried out by the CNB. Owing to an exceptionally large population of road carriers, revenues and expenditures on the basis of road transporta-tion are not adopted from this research. They are compiled by using ITRS data. As regards transportation of goods, expenditures are sup-plemented by a portion of transportation and insurance costs related to imports of goods which belongs to non-residents and which is estimated by adjusting the value of imports at c.i.f. parity to the value of imports f.o.b.
Revenues from services rendered to foreign travellers and tourists, as well as expenditures incurred by domestic travellers and tourists abroad are shown under the position Travel. In the 1993-1998 pe-riod, this position was assessed by using various data sources which did not provide for a full coverage in accordance with the recom-mended methodology. Accordingly, in the second half of 1998, the Croatian National Bank started to carry out the Survey on Consump-tion of Foreign Travellers in Croatia and Domestic Travellers Abroad and use its results for compiling the Travel position. Since early 1999, the results of this Survey, based on carrying out a survey of travellers (stratified sample) at border crossings, have been combined with the Ministry of the Interior data on total number of foreign and domestic travellers, along with the data on distribution of foreign travellers by countries contained in the CBS Report on tourism, in order to assess the corresponding balance of payment items.
Other services position is complied by using different data sourc-es: apart from revenues and expenditures related to insurance and communication services, which have been determined by the CNB special statistical research since 2001, the values of all other services are adopted from the ITRS.
Transactions in the income account are classified into four main groups. Compensation of employees item is compiled on the basis of the ITRS. Income from direct investment, portfolio investment and other investment are reported separately. Data on reinvested earnings are reported separately, under direct investment income, calculated on the basis of the CNB Research on direct and other equity investment. In contrast to data on dividends, these data are not available for the 1993-1996 period, since at that time they were not reported separately. On the basis of statistical data on external debt relations, starting from 1997, income from direct investment in-cludes data on interest arising from credit relations between residents and non-residents directly related through ownership. Income from equity portfolio investment is compiled on the basis of the same re-search, whereas data on debt portfolio investment income have been compiled since 1999, based on statistics on foreign credit relations, which also encompass income related to debt securities owned by

CNB BULLETIN • NUMBER 130 • STATISTICAL SURVEY • INTERNATIONAL ECONOMIC RELATIONS
80
Table H3: Balance of Payments – Income and Current Transfersmillion euros
2001a 2002a 2003a 2004a 2005a 2006a2007
Q1a Q2b
Income –627.9 –577.7 –1,095.2 –690.1 –971.5 –1,118.9 –218.0 –597.5
1. Compensation of employees 143.1 167.6 183.9 233.9 259.7 373.2 118.1 122.7
1.1. Credit 157.4 187.2 217.3 268.3 289.2 404.3 125.4 130.5
1.2. Debit –14.3 –19.5 –33.4 –34.4 –29.5 –31.1 –7.3 –7.8
2. Direct investment income –340.0 –353.3 –854.7 –441.6 –739.0 –977.1 –195.3 –589.3
2.1. Credit 34.2 25.1 35.2 175.6 112.7 90.3 43.7 53.4
o/w: Reinvested earnings 19.8 8.3 31.7 165.8 63.8 72.6 38.3 45.1
2.2. Debit –374.1 –378.5 –889.9 –617.3 –851.8 –1,067.3 –239.0 –642.7
o/w: Reinvested earnings –187.9 –160.9 –587.9 –291.7 –570.5 –697.4 –76.0 –446.5
3. Portfolio investment income –262.9 –219.1 –238.7 –272.4 –258.8 –239.7 –60.6 –57.6
3.1. Credit 0.0 0.0 0.0 10.3 5.0 –6.4 –5.7 3.8
3.2. Debit –263.0 –219.1 –238.7 –282.7 –263.8 –233.3 –54.8 –61.4
4. Other investment income –168.1 –173.0 –185.7 –210.0 –233.4 –275.4 –80.2 –73.3
4.1. Credit 293.0 249.9 197.0 155.9 204.2 331.6 107.4 121.9
4.2. Debit –461.2 –422.9 –382.7 –365.9 –437.7 –607.0 –187.6 –195.2
Current transfers 1,099.5 1,152.2 1,244.5 1,191.8 1,183.8 1,106.2 245.5 262.5
1. General government 65.3 32.2 70.5 2.6 9.7 –8.6 –6.0 –4.2
1.1. Credit 142.7 143.4 213.1 180.1 219.6 255.7 54.6 65.6
1.2. Debit –77.4 –111.2 –142.6 –177.5 –209.9 –264.4 –60.7 –69.7
2. Other sectors 1,034.2 1,120.0 1,174.0 1,189.2 1,174.1 1,114.8 251.5 266.7
2.1. Credit 1,190.6 1,309.8 1,325.6 1,404.5 1,408.8 1,382.5 301.4 326.3
2.2. Debit –156.4 –189.8 –151.6 –215.3 –234.6 –267.7 –49.9 –59.6a Revised data. b Preliminary data.
non-residents. Income from other investments includes the calcula-tion of interest in accordance with the foreign credit relations statis-tics. The methodology for compiling the statistics on debt investment income has been changed in 2007 to include the reporting of income on an accrual basis. This basically means that income from debt in-vestment and interest are reported at the point in time when they accrue and not at the point in time when they mature or when they are paid. As a result, the historical data for the 1999-2006 period have been revised.
Current transfers are reported separately for the general govern-ment sector and other sectors. The ITRS is used as the main data source on current transfers for both sectors. In addition to taxes and excise duties, pensions, monetary support and donations, which are included in current transfers of both sectors, the government sector also encompasses data on multilateral cooperation, whereas other sectors include data on workers’ remittances. Current transfers of the general government sector also include data on exports and im-ports of goods without a payment obligation, provided by the CBS. In the 1993-1998 period, current transfers of other sectors also en-compassed an estimate of unregistered foreign currency remittances, which accounted for 15% of the positive difference between unclas-sified inflows and outflows of the household sector. From 1993 to the second quarter of 1996, the CNB also assessed a portion of the outflow based on current transfers. From 2002 on, inflows and out-flows based on current transfers of other sectors are supplemented by the data of the CNB special statistical research on international transactions related to insurance services.
Capital account is compiled on the basis of the ITRS, particularly on their part related to transfers of migrants. In addition, capital ac-count includes transfers that cannot be classified into current trans-fers, such as allocation of gold of the former SFRY or investments in patents and rights.
Foreign direct investments include equity capital, reinvested earnings and debt relations between ownership-related residents and non-residents. Direct investments are investments whereby a foreign owner acquires a minimum of 10% interest in equity capital of a
company, regardless of whether a resident invests abroad or a non-resident invests in Croatian residents. The CNB Research on foreign direct investments started in 1997 when companies included in the survey also delivered data on direct investments for the 1993-1996 period. For the same period, no data are available on reinvested earn-ings and other capital under direct investment position, where all debt relations between related residents and non-residents are classi-fied (excluding the banking sector). Such data actually became avail-able only after the stated research has been launched. Since 1999, data on debt relations within direct investments have been collected on the basis of external debt relations statistics. From 2007 on, the CNB Statistics Department conducts the research on the purchase and sale of the real estate by non-residents on the territory of the Republic of Croatia. Persons obliged to submit reports are the public notaries who learn about these transactions in the course of their business. Data on the purchase and sale of the real estate by Croatian non-residents abroad are compiled on the basis of the ITRS. These purchase and sale transactions are also a constituent part of direct investments.
Data on equity portfolio investments are collected from the same data source as the data on direct investments. Debt portfo-lio investments include all investments in short-term and long-term debt securities that cannot be classified under direct investments. In the 1997-1998 period, these data were collected through the CNB Research on direct and portfolio investments, and since 1999 data on external debt relations and monetary statistics data for bank in-vestment have been used. Starting from 2002 and 2004, this posi-tion has also been compiled for investment funds and pension funds, respectively.
Other investment encompasses all other debt investments that have not been mentioned, apart from investment constituting reserve assets. Other investments are classified by instruments, maturity and sectors. Trade credits, in the 1996–2002 period, included the CNB estimates of advance payment and deferred payments, made on the basis of the sample of the largest and large importers and export-ers. Data on advance payments have been estimated since 1996,
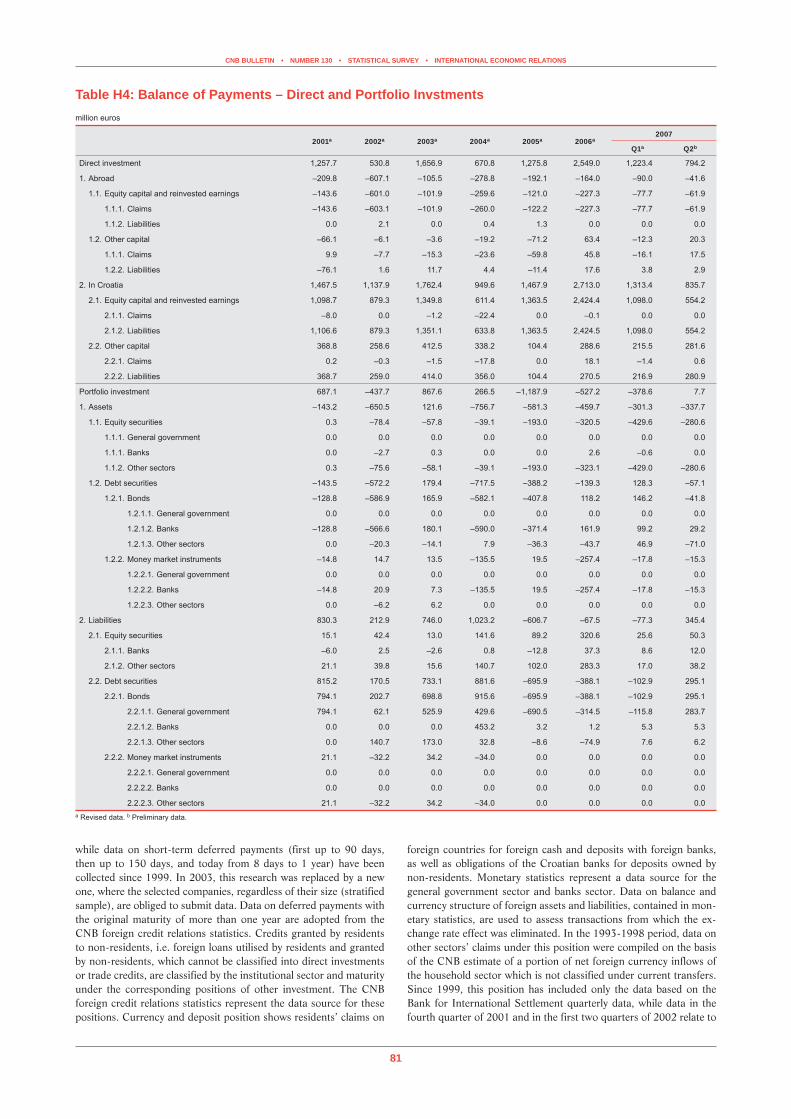
CNB BULLETIN • NUMBER 130 • STATISTICAL SURVEY • INTERNATIONAL ECONOMIC RELATIONS
81
Table H4: Balance of Payments – Direct and Portfolio Invstmentsmillion euros
2001a 2002a 2003a 2004a 2005a 2006a2007
Q1a Q2b
Direct investment 1,257.7 530.8 1,656.9 670.8 1,275.8 2,549.0 1,223.4 794.2
1. Abroad –209.8 –607.1 –105.5 –278.8 –192.1 –164.0 –90.0 –41.6
1.1. Equity capital and reinvested earnings –143.6 –601.0 –101.9 –259.6 –121.0 –227.3 –77.7 –61.9
1.1.1. Claims –143.6 –603.1 –101.9 –260.0 –122.2 –227.3 –77.7 –61.9
1.1.2. Liabilities 0.0 2.1 0.0 0.4 1.3 0.0 0.0 0.0
1.2. Other capital –66.1 –6.1 –3.6 –19.2 –71.2 63.4 –12.3 20.3
1.1.1. Claims 9.9 –7.7 –15.3 –23.6 –59.8 45.8 –16.1 17.5
1.2.2. Liabilities –76.1 1.6 11.7 4.4 –11.4 17.6 3.8 2.9
2. In Croatia 1,467.5 1,137.9 1,762.4 949.6 1,467.9 2,713.0 1,313.4 835.7
2.1. Equity capital and reinvested earnings 1,098.7 879.3 1,349.8 611.4 1,363.5 2,424.4 1,098.0 554.2
2.1.1. Claims –8.0 0.0 –1.2 –22.4 0.0 –0.1 0.0 0.0
2.1.2. Liabilities 1,106.6 879.3 1,351.1 633.8 1,363.5 2,424.5 1,098.0 554.2
2.2. Other capital 368.8 258.6 412.5 338.2 104.4 288.6 215.5 281.6
2.2.1. Claims 0.2 –0.3 –1.5 –17.8 0.0 18.1 –1.4 0.6
2.2.2. Liabilities 368.7 259.0 414.0 356.0 104.4 270.5 216.9 280.9
Portfolio investment 687.1 –437.7 867.6 266.5 –1,187.9 –527.2 –378.6 7.7
1. Assets –143.2 –650.5 121.6 –756.7 –581.3 –459.7 –301.3 –337.7
1.1. Equity securities 0.3 –78.4 –57.8 –39.1 –193.0 –320.5 –429.6 –280.6
1.1.1. General government 0.0 0.0 0.0 0.0 0.0 0.0 0.0 0.0
1.1.1. Banks 0.0 –2.7 0.3 0.0 0.0 2.6 –0.6 0.0
1.1.2. Other sectors 0.3 –75.6 –58.1 –39.1 –193.0 –323.1 –429.0 –280.6
1.2. Debt securities –143.5 –572.2 179.4 –717.5 –388.2 –139.3 128.3 –57.1
1.2.1. Bonds –128.8 –586.9 165.9 –582.1 –407.8 118.2 146.2 –41.8
1.2.1.1. General government 0.0 0.0 0.0 0.0 0.0 0.0 0.0 0.0
1.2.1.2. Banks –128.8 –566.6 180.1 –590.0 –371.4 161.9 99.2 29.2
1.2.1.3. Other sectors 0.0 –20.3 –14.1 7.9 –36.3 –43.7 46.9 –71.0
1.2.2. Money market instruments –14.8 14.7 13.5 –135.5 19.5 –257.4 –17.8 –15.3
1.2.2.1. General government 0.0 0.0 0.0 0.0 0.0 0.0 0.0 0.0
1.2.2.2. Banks –14.8 20.9 7.3 –135.5 19.5 –257.4 –17.8 –15.3
1.2.2.3. Other sectors 0.0 –6.2 6.2 0.0 0.0 0.0 0.0 0.0
2. Liabilities 830.3 212.9 746.0 1,023.2 –606.7 –67.5 –77.3 345.4
2.1. Equity securities 15.1 42.4 13.0 141.6 89.2 320.6 25.6 50.3
2.1.1. Banks –6.0 2.5 –2.6 0.8 –12.8 37.3 8.6 12.0
2.1.2. Other sectors 21.1 39.8 15.6 140.7 102.0 283.3 17.0 38.2
2.2. Debt securities 815.2 170.5 733.1 881.6 –695.9 –388.1 –102.9 295.1
2.2.1. Bonds 794.1 202.7 698.8 915.6 –695.9 –388.1 –102.9 295.1
2.2.1.1. General government 794.1 62.1 525.9 429.6 –690.5 –314.5 –115.8 283.7
2.2.1.2. Banks 0.0 0.0 0.0 453.2 3.2 1.2 5.3 5.3
2.2.1.3. Other sectors 0.0 140.7 173.0 32.8 –8.6 –74.9 7.6 6.2
2.2.2. Money market instruments 21.1 –32.2 34.2 –34.0 0.0 0.0 0.0 0.0
2.2.2.1. General government 0.0 0.0 0.0 0.0 0.0 0.0 0.0 0.0
2.2.2.2. Banks 0.0 0.0 0.0 0.0 0.0 0.0 0.0 0.0
2.2.2.3. Other sectors 21.1 –32.2 34.2 –34.0 0.0 0.0 0.0 0.0a Revised data. b Preliminary data.
while data on short-term deferred payments (first up to 90 days, then up to 150 days, and today from 8 days to 1 year) have been collected since 1999. In 2003, this research was replaced by a new one, where the selected companies, regardless of their size (stratified sample), are obliged to submit data. Data on deferred payments with the original maturity of more than one year are adopted from the CNB foreign credit relations statistics. Credits granted by residents to non-residents, i.e. foreign loans utilised by residents and granted by non-residents, which cannot be classified into direct investments or trade credits, are classified by the institutional sector and maturity under the corresponding positions of other investment. The CNB foreign credit relations statistics represent the data source for these positions. Currency and deposit position shows residents’ claims on
foreign countries for foreign cash and deposits with foreign banks, as well as obligations of the Croatian banks for deposits owned by non-residents. Monetary statistics represent a data source for the general government sector and banks sector. Data on balance and currency structure of foreign assets and liabilities, contained in mon-etary statistics, are used to assess transactions from which the ex-change rate effect was eliminated. In the 1993-1998 period, data on other sectors’ claims under this position were compiled on the basis of the CNB estimate of a portion of net foreign currency inflows of the household sector which is not classified under current transfers. Since 1999, this position has included only the data based on the Bank for International Settlement quarterly data, while data in the fourth quarter of 2001 and in the first two quarters of 2002 relate to
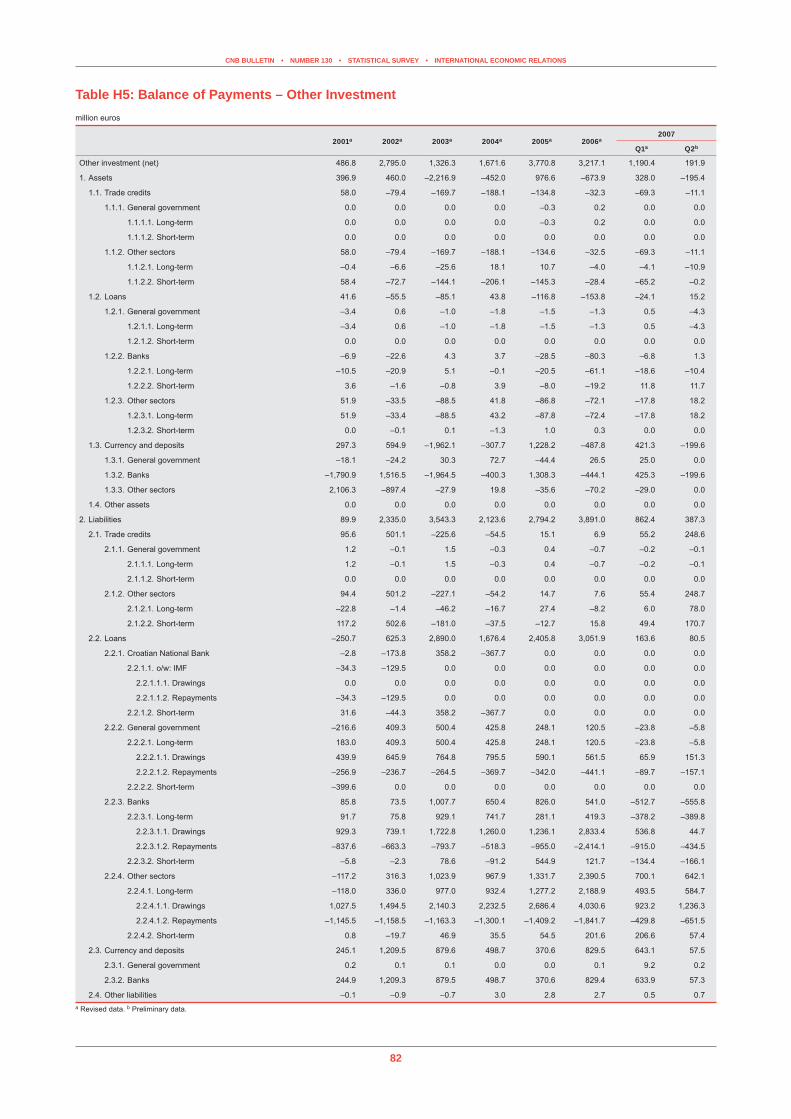
CNB BULLETIN • NUMBER 130 • STATISTICAL SURVEY • INTERNATIONAL ECONOMIC RELATIONS
82
Table H5: Balance of Payments – Other Investmentmillion euros
2001a 2002a 2003a 2004a 2005a 2006a2007
Q1a Q2b
Other investment (net) 486.8 2,795.0 1,326.3 1,671.6 3,770.8 3,217.1 1,190.4 191.9
1. Assets 396.9 460.0 –2,216.9 –452.0 976.6 –673.9 328.0 –195.4
1.1. Trade credits 58.0 –79.4 –169.7 –188.1 –134.8 –32.3 –69.3 –11.1
1.1.1. General government 0.0 0.0 0.0 0.0 –0.3 0.2 0.0 0.0
1.1.1.1. Long-term 0.0 0.0 0.0 0.0 –0.3 0.2 0.0 0.0
1.1.1.2. Short-term 0.0 0.0 0.0 0.0 0.0 0.0 0.0 0.0
1.1.2. Other sectors 58.0 –79.4 –169.7 –188.1 –134.6 –32.5 –69.3 –11.1
1.1.2.1. Long-term –0.4 –6.6 –25.6 18.1 10.7 –4.0 –4.1 –10.9
1.1.2.2. Short-term 58.4 –72.7 –144.1 –206.1 –145.3 –28.4 –65.2 –0.2
1.2. Loans 41.6 –55.5 –85.1 43.8 –116.8 –153.8 –24.1 15.2
1.2.1. General government –3.4 0.6 –1.0 –1.8 –1.5 –1.3 0.5 –4.3
1.2.1.1. Long-term –3.4 0.6 –1.0 –1.8 –1.5 –1.3 0.5 –4.3
1.2.1.2. Short-term 0.0 0.0 0.0 0.0 0.0 0.0 0.0 0.0
1.2.2. Banks –6.9 –22.6 4.3 3.7 –28.5 –80.3 –6.8 1.3
1.2.2.1. Long-term –10.5 –20.9 5.1 –0.1 –20.5 –61.1 –18.6 –10.4
1.2.2.2. Short-term 3.6 –1.6 –0.8 3.9 –8.0 –19.2 11.8 11.7
1.2.3. Other sectors 51.9 –33.5 –88.5 41.8 –86.8 –72.1 –17.8 18.2
1.2.3.1. Long-term 51.9 –33.4 –88.5 43.2 –87.8 –72.4 –17.8 18.2
1.2.3.2. Short-term 0.0 –0.1 0.1 –1.3 1.0 0.3 0.0 0.0
1.3. Currency and deposits 297.3 594.9 –1,962.1 –307.7 1,228.2 –487.8 421.3 –199.6
1.3.1. General government –18.1 –24.2 30.3 72.7 –44.4 26.5 25.0 0.0
1.3.2. Banks –1,790.9 1,516.5 –1,964.5 –400.3 1,308.3 –444.1 425.3 –199.6
1.3.3. Other sectors 2,106.3 –897.4 –27.9 19.8 –35.6 –70.2 –29.0 0.0
1.4. Other assets 0.0 0.0 0.0 0.0 0.0 0.0 0.0 0.0
2. Liabilities 89.9 2,335.0 3,543.3 2,123.6 2,794.2 3,891.0 862.4 387.3
2.1. Trade credits 95.6 501.1 –225.6 –54.5 15.1 6.9 55.2 248.6
2.1.1. General government 1.2 –0.1 1.5 –0.3 0.4 –0.7 –0.2 –0.1
2.1.1.1. Long-term 1.2 –0.1 1.5 –0.3 0.4 –0.7 –0.2 –0.1
2.1.1.2. Short-term 0.0 0.0 0.0 0.0 0.0 0.0 0.0 0.0
2.1.2. Other sectors 94.4 501.2 –227.1 –54.2 14.7 7.6 55.4 248.7
2.1.2.1. Long-term –22.8 –1.4 –46.2 –16.7 27.4 –8.2 6.0 78.0
2.1.2.2. Short-term 117.2 502.6 –181.0 –37.5 –12.7 15.8 49.4 170.7
2.2. Loans –250.7 625.3 2,890.0 1,676.4 2,405.8 3,051.9 163.6 80.5
2.2.1. Croatian National Bank –2.8 –173.8 358.2 –367.7 0.0 0.0 0.0 0.0
2.2.1.1. o/w: IMF –34.3 –129.5 0.0 0.0 0.0 0.0 0.0 0.0
2.2.1.1.1. Drawings 0.0 0.0 0.0 0.0 0.0 0.0 0.0 0.0
2.2.1.1.2. Repayments –34.3 –129.5 0.0 0.0 0.0 0.0 0.0 0.0
2.2.1.2. Short-term 31.6 –44.3 358.2 –367.7 0.0 0.0 0.0 0.0
2.2.2. General government –216.6 409.3 500.4 425.8 248.1 120.5 –23.8 –5.8
2.2.2.1. Long-term 183.0 409.3 500.4 425.8 248.1 120.5 –23.8 –5.8
2.2.2.1.1. Drawings 439.9 645.9 764.8 795.5 590.1 561.5 65.9 151.3
2.2.2.1.2. Repayments –256.9 –236.7 –264.5 –369.7 –342.0 –441.1 –89.7 –157.1
2.2.2.2. Short-term –399.6 0.0 0.0 0.0 0.0 0.0 0.0 0.0
2.2.3. Banks 85.8 73.5 1,007.7 650.4 826.0 541.0 –512.7 –555.8
2.2.3.1. Long-term 91.7 75.8 929.1 741.7 281.1 419.3 –378.2 –389.8
2.2.3.1.1. Drawings 929.3 739.1 1,722.8 1,260.0 1,236.1 2,833.4 536.8 44.7
2.2.3.1.2. Repayments –837.6 –663.3 –793.7 –518.3 –955.0 –2,414.1 –915.0 –434.5
2.2.3.2. Short-term –5.8 –2.3 78.6 –91.2 544.9 121.7 –134.4 –166.1
2.2.4. Other sectors –117.2 316.3 1,023.9 967.9 1,331.7 2,390.5 700.1 642.1
2.2.4.1. Long-term –118.0 336.0 977.0 932.4 1,277.2 2,188.9 493.5 584.7
2.2.4.1.1. Drawings 1,027.5 1,494.5 2,140.3 2,232.5 2,686.4 4,030.6 923.2 1,236.3
2.2.4.1.2. Repayments –1,145.5 –1,158.5 –1,163.3 –1,300.1 –1,409.2 –1,841.7 –429.8 –651.5
2.2.4.2. Short-term 0.8 –19.7 46.9 35.5 54.5 201.6 206.6 57.4
2.3. Currency and deposits 245.1 1,209.5 879.6 498.7 370.6 829.5 643.1 57.5
2.3.1. General government 0.2 0.1 0.1 0.0 0.0 0.1 9.2 0.2
2.3.2. Banks 244.9 1,209.3 879.5 498.7 370.6 829.4 633.9 57.3
2.4. Other liabilities –0.1 –0.9 –0.7 3.0 2.8 2.7 0.5 0.7a Revised data. b Preliminary data.

CNB BULLETIN • NUMBER 130 • STATISTICAL SURVEY • INTERNATIONAL ECONOMIC RELATIONS
83
Table H6: Balance of Payments – Summarymillion kuna
2001a 2002a 2003a 2004a 2005a 2006a2007
Q1a Q2b
A. CURRENT ACCOUNT (1+6) –6,108.9 –15,744.2 –14,637.6 –11,315.3 –14,921.4 –19,548.0 –14,917.2 –9,961.4
1. Goods, services, and income (2+5) –14,301.8 –24,275.5 –24,051.3 –20,242.1 –23,679.5 –27,648.0 –16,724.5 –11,891.1
1.1. Credit 84,238.8 85,611.4 102,483.3 110,782.5 117,208.4 130,275.5 22,749.9 35,285.7
1.2. Debit –98,540.6 –109,886.9 –126,534.6 –131,024.5 –140,888.0 –157,923.6 –39,474.4 –47,176.8
2. Goods and services (3+4) –9,885.7 –19,986.2 –15,671.7 –15,083.2 –16,508.1 –19,478.8 –15,120.1 –7,478.1
2.1. Credit 80,385.2 82,206.3 99,192.2 106,225.6 112,693.7 124,269.8 20,757.0 33,011.0
2.2. Debit –90,270.9 –102,192.6 –114,863.9 –121,308.8 –129,201.8 –143,748.6 –35,877.1 –40,489.1
3. Goods –34,258.8 –44,117.7 –52,759.8 –50,327.5 –55,568.1 –61,083.9 –15,897.8 –18,638.2
3.1. Credit 39,760.0 39,216.5 42,190.2 49,507.8 53,397.7 61,988.6 15,065.6 16,871.8
3.2. Debit –74,018.9 –83,334.1 –94,949.9 –99,835.3 –108,965.8 –123,072.5 –30,963.4 –35,510.0
4. Services 24,373.1 24,131.4 37,088.0 35,244.3 39,060.0 41,605.1 777.7 11,160.1
4.1. Credit 40,625.2 42,989.9 57,002.0 56,717.8 59,296.0 62,281.2 5,691.4 16,139.2
4.2. Debit –16,252.1 –18,858.5 –19,914.0 –21,473.5 –20,236.0 –20,676.1 –4,913.7 –4,979.1
5. Income –4,416.1 –4,289.2 –8,379.5 –5,158.9 –7,171.4 –8,169.2 –1,604.4 –4,413.0
5.1. Credit 3,853.5 3,405.1 3,291.2 4,556.8 4,514.7 6,005.7 1,992.9 2,274.7
5.2. Debit –8,269.7 –7,694.3 –11,670.7 –9,715.7 –11,686.1 –14,175.0 –3,597.3 –6,687.7
6. Current transfers 8,192.9 8,531.3 9,413.6 8,926.8 8,758.1 8,100.0 1,807.3 1,929.7
6.1. Credit 9,934.0 10,761.2 11,639.9 11,872.9 12,047.2 11,996.6 2,621.5 2,881.0
6.2. Debit –1,741.1 –2,229.9 –2,226.3 –2,946.1 –3,289.1 –3,896.5 –814.2 –951.3
B. CAPITAL AND FINANCIAL ACCOUNT 9,432.1 18,920.4 20,752.3 19,004.6 21,975.4 27,069.9 9,074.7 9,848.1
B1. Capital account 1,176.6 3,847.2 771.3 235.5 396.8 –980.3 44.1 66.1
B2. Financial account, excl. reserves 19,752.5 20,561.8 29,333.4 19,105.6 27,654.1 38,363.6 14,982.9 7,320.2
1. Direct investment 11,670.0 4,183.5 12,706.4 4,452.8 9,093.0 18,675.4 9,003.8 5,861.0
1.1. Abroad –1,520.5 –4,486.9 –801.9 –2,077.2 –1,415.4 –1,200.6 –662.8 –305.3
1.2. In Croatia 13,190.5 8,670.4 13,508.3 6,530.0 10,508.5 19,876.0 9,666.7 6,166.3
2. Portfolio investment 5,217.7 –3,260.4 6,593.2 1,942.8 –8,797.1 –3,908.1 –2,786.5 54.4
2.1. Assets –1,081.8 –4,839.6 938.6 –5,718.8 –4,267.9 –3,391.3 –2,217.4 –2,481.4
2.2. Liabilities 6,299.5 1,579.2 5,654.5 7,661.6 –4,529.2 –516.8 –569.2 2,535.8
3. Financial derivatives 0.0 0.0 0.0 0.0 –659.4 0.0 0.0 0.0
4. Other investment 2,864.9 19,638.7 10,033.7 12,710.0 28,017.5 23,596.3 8,765.6 1,404.8
4.1. Assets 2,584.6 3,322.5 –16,854.7 –3,331.7 7,370.2 –4,993.1 2,415.2 –1,424.0
4.2. Liabilities 280.2 16,316.1 26,888.4 16,041.7 20,647.4 28,589.4 6,350.4 2,828.8
B3. Reserve assets (CNB) –11,497.0 –5,488.5 –9,352.4 –336.5 –6,075.4 –10,313.4 –5,952.3 2,461.8
C. NET ERRORS AND OMISSIONS –3,323.2 –3,176.2 –6,114.7 –7,689.3 –7,054.0 –7,521.9 5,842.5 113.2a Revised data. b Preliminary data.Note: The item net errors and omissions also comprises the counter entry of a part of revenues from travel services which relates to such revenues not stated in the banks’ records.
the effect of the EMU countries’ currencies changeover to the euro.In the period from 1993 to 1998, the estimate of reserve assets
transactions was made by converting the changes in the original currencies into the US dollars by applying the average monthly ex-
change rate of the currencies contained in the reserves. Since 1999, the changes in reserve assets balance have been calculated on the basis of the CNB accounting data.

CNB BULLETIN • NUMBER 130 • STATISTICAL SURVEY • INTERNATIONAL ECONOMIC RELATIONS
84
Table H7: International Reserves and Banks’ Foreign Currency Reservesa
end of period, million euros
Year Month
International reserves of the Croatian National BankBanks’ foreign
currency reservesTotal Special drawing
rights
Reserve position in the Fund
GoldForeign currency
Total Currency and deposits
Bonds and notes
1994 December 1,145.7 3.7 – – 1,142.0 1,142.0 – 716.6
1995 December 1,479.0 109.1 – – 1,369.9 1,288.4 81.4 1,038.1
1996 December 1,867.7 101.3 0.0 – 1,766.3 1,627.6 138.7 1,549.2
1997 December 2,303.7 133.4 0.1 – 2,170.2 1,825.2 345.0 2,078.9
1998 December 2,400.2 197.1 0.1 – 2,203.0 1,642.6 560.4 1,607.0
1999 December 3,012.7 188.7 0.2 – 2,823.7 2,449.8 373.9 1,344.7
2000 December 3,783.2 158.5 0.2 – 3,624.5 2,763.0 861.5 2,310.7
2001 December 5,333.6 122.9 0.2 – 5,210.5 3,469.7 1,740.7 4,056.0
2002 December 5,651.3 2.3 0.2 – 5,648.8 3,787.8 1,861.0 2,581.6
2003 December 6,554.1 0.7 0.2 – 6,553.2 3,346.0 3,207.2 3,927.1
2004 December 6,436.2 0.6 0.2 – 6,435.4 3,173.3 3,262.0 4,220.1
2005 December 7,438.4 0.9 0.2 – 7,437.3 3,834.5 3,602.8 2,938.4
2006 October 8,516.3 1.2 0.2 – 8,514.9 4,308.0 4,206.9 2,953.5
November 8,983.7 0.7 0.2 – 8,982.8 4,537.8 4,445.0 2,915.8
December 8,725.3 0.7 0.2 – 8,724.4 4,526.9 4,197.5 3,315.0
2007 January 9,172.6 1.3 0.2 – 9,171.1 4,909.3 4,261.8 3,237.7
February 9,565.4 0.8 0.2 – 9,564.5 5,271.0 4,293.4 2,936.8
March 9,519.7 0.8 0.2 – 9,518.8 5,237.3 4,281.5 2,882.6
April 9,488.4 1.3 0.2 – 9,486.9 5,229.6 4,257.4 2,743.7
May 9,451.5 0.8 0.2 – 9,450.5 5,171.7 4,278.9 2,705.4
June 9,170.4 0.8 0.2 – 9,169.4 4,901.4 4,268.0 3,084.8
July 9,412.1 1.3 0.2 – 9,410.7 5,055.3 4,355.4 3,025.1
August 9,223.0 0.7 0.2 – 9,222.1 4,823.7 4,398.4 3,418.5
Septembera 8,795.1 0.7 0.2 – 8,794.2 4,404.6 4,389.6 3,839.8a International reserves of the Republic of Croatia consist only of the Croatian National Bank’s foreign currency reserves.b Preliminary data.
Table H7: International Reserves and Banks’ Foreign Currency Reserves
Data on the international reserves of the Croatian National Bank are compiled in accordance with the methodology set out in the Bal-ance of Payments Manual (International Monetary Fund, 1993), and include those foreign claims of the Croatian National Bank that can be used to bridge imbalances in international payments. International
reserves include special drawing rights, reserve position in the Fund, gold, foreign currency and deposits with foreign banks, as well as bonds and debt instruments.
The foreign currency reserves of banks include foreign currency and deposits of domestic banks with foreign banks. These foreign currency reserves represent an additional source of liquidity for bridging imbalances in international payments.

CNB BULLETIN • NUMBER 130 • STATISTICAL SURVEY • INTERNATIONAL ECONOMIC RELATIONS
85
Table H8: International Reserves and Foreign Currency Liquidityend of period, million euros
2001Dec.b
2002Dec.
2003Dec.
2004Dec.
2005Dec.
2006Dec.
2007
Mar. Jun. Jul. Aug.
I. Official reserve assets and other f/c assets (approximate market value)
A. Official reserve assets 5,333.6 5,651.3 6,554.1 6,436.2 7,438.4 8,725.3 9,519.7 9,170.4 9,412.1 9,223.0
(1) Foreign currency reserves (in convertible f/c) 3,877.9 4,246.9 5,740.1 6,235.4 7,337.3 8,162.8 8,513.9 8,249.2 8,610.6 8,322.1
(a) Securities 1,740.7 1,861.0 3,207.2 3,262.0 3,602.8 4,197.5 4,281.5 4,268.0 4,355.4 4,398.4
o/w: Issuer headquartered in reporting country but located abroad
– – – – – – – – – –
(b) Total currency and deposits with: 2,137.2 2,385.9 2,532.9 2,973.3 3,734.5 3,965.3 4,232.4 3,981.2 4,255.2 3,923.7
(i) Other national central banks, BIS and IMF 461.3 325.1 271.1 233.1 407.3 198.7 197.8 196.9 195.9 196.1
(ii) Banks headquartered in the reporting country – – – – – – – – – –
o/w: Located abroad – – – – – – – – – –
(iii) Banks headquartered outside the reporting country 1,675.9 2,060.8 2,261.8 2,740.3 3,327.2 3,766.6 4,034.6 3,784.3 4,059.4 3,727.7
o/w: Located in the reporting country – – – – – – – – – –
(2) IMF reserve position 0.2 0.2 0.2 0.2 0.2 0.2 0.2 0.2 0.2 0.2
(3) SDRs 122.9 2.3 0.7 0.6 0.9 0.7 0.8 0.8 1.3 0.7
(4) Gold – – – – – – – – – –
(5) Other reserve assets 1,332.6 1,401.9 813.1 200.0 100.0 561.6 1,004.9 920.2 800.0 900.0
– Reverse repo 1,332.6 1,401.9 813.1 200.0 100.0 561.6 1,004.9 920.2 800.0 900.0
B. Other foreign currency assets (specify) – – – – – – – – – –
– Time deposits – – – – – – – – – –
C. Total (A+B) 5,333.6 5,651.3 6,554.1 6,436.2 7,438.4 8,725.3 9,519.7 9,170.4 9,412.1 9,223.0
II. Predetermined short-term net drains on f/c assets (nominal value)
1. F/c loans, securities, and deposits (total net drains up to one year)
–1,350.7 –740.9 –1,538.0 –988.6 –899.7 –650.5 –644.9 –779.4 –535.4 –541.3
(a) Croatian National Bank –443.4 –167.4 –646.9 –1.8 –1.1 –1.6 –1.9 –2.0 –2.0 –2.5
Up to 1 month Principal –196.1 –136.9 –355.9 – – – – – – –
Interest –3.2 –2.2 –1.9 –1.8 –1.1 –1.6 –1.9 –2.0 –2.0 –2.5
More than 1 and up to 3 months Principal –203.7 –26.5 –288.3 – – – – – – –
Interest –2.1 –0.1 –0.7 – – – – – – –
More than 3 months and up to 1 year Principal –34.5 –1.6 – – – – – – – –
Interest –3.8 –0.1 – – – – – – – –
(b) Central government (excl. central government funds)
–907.4 –573.5 –891.1 –986.8 –898.6 –648.9 –643.0 –777.5 –533.4 –538.9
Up to 1 month Principal –101.7 –98.1 –85.9 –76.5 –77.9 –48.3 –11.3 –292.7 –2.5 –7.7
Interest –55.6 –42.8 –34.4 –13.8 – – – – – –
More than 1 and up to 3 months Principal –351.6 –8.6 –9.3 –510.1 –603.0 –138.4 –78.7 –69.8 –80.5 –93.5
Interest –125.7 –148.1 –168.3 –169.0 – – – – – –
More than 3 months and up to 1 year Principal –170.8 –176.2 –495.2 –143.7 –160.2 –399.8 –415.1 –291.2 –333.5 –336.2
Interest –102.0 –99.7 –98.0 –73.8 –57.5 –62.3 –137.9 –123.9 –116.9 –101.5
2. Aggregate short and long positions in forwards and futures in f/c vis-a-vis the domestic currency (including the forward leg of currency swaps)
– – – – – – – – – –
(a) Short positions (–) – – – – – – – – – –
Up to 1 month – – – – – – – – – –
More than 1 and up to 3 months – – – – – – – – – –
More than 3 months and up to 1 year – – – – – – – – – –
(b) Long positions (+) – – – – – – – – – –
Up to 1 month – – – – – – – – – –
More than 1 and up to 3 months – – – – – – – – – –
More than 3 months and up to 1 year – – – – – – – – – –
3. Other –75.2 –21.5 –363.5 – – – – – – –
– Outflows related to repos (–) –75.2 –21.5 –363.5 – – – – – – –
Up to 1 month Principal –75.1 –21.5 –363.1 – – – – – – –
Interest –0.1 0.0 –0.4 – – – – – – –
More than 1 and up to 3 months Principal – – – – – – – – – –
Interest – – – – – – – – – –
More than 3 months and up to 1 year Principal – – – – – – – – – –
Interest – – – – – – – – – –
4. Total predetermined short-term net drains on f/c assets (1+2+3)
–1,426.0 –762.4 –1,901.5 –988.6 –899.7 –650.5 –644.9 –779.4 –535.4 –541.3
III. Contingent short-term net drains on f/c assets (nominal value)
1. Contingent liabilities in foreign currency –1,088.8 –1,631.0 –1,300.4 –1,772.9 –2,273.1 –2,734.9 –3,364.5 –3,110.8 –3,201.0 –2,946.0
(a) Collateral guarantees on debt falling due within 1 year –315.9 –685.9 –426.8 –370.9 –443.8 –478.9 –437.4 –549.7 –559.3 –560.4

CNB BULLETIN • NUMBER 130 • STATISTICAL SURVEY • INTERNATIONAL ECONOMIC RELATIONS
86
– Croatian National Bank – – – – – – – – – –
– Central government (excl. central government funds) –315.9 –685.9 –426.8 –370.9 –443.8 –478.9 –437.4 –549.7 –559.3 –560.4
Up to 1 month –49.4 –52.3 –55.8 –62.7 –59.6 –71.9 –20.5 –51.6 –8.6 –15.4
More than 1 and up to 3 months –24.7 –35.2 –94.9 –33.9 –53.0 –84.8 –76.5 –38.3 –69.2 –79.2
More than 3 months and up to 1 year –241.7 –598.3 –276.1 –274.4 –331.2 –322.2 –340.4 –459.8 –481.6 –465.8
(b) Other contingent liabilities –772.9 –945.1 –873.6 –1,402.0 –1,829.3 –2,256.0 –2,927.2 –2,561.1 –2,641.7 –2,385.6
– Croatian National Bank –772.9 –945.1 –873.6 –1,402.0 –1,829.3 –2,256.0 –2,927.2 –2,561.1 –2,641.7 –2,385.6
Up to 1 month – – – – – – – – – –
More than 1 and up to 3 months –772.9 –945.1 –873.6 –1,402.0 –1,829.3 –2,256.0 –2,927.2 –2,561.1 –2,641.7 –2,385.6
More than 3 months and up to 1 year – – – – – – – – – –
– Central government (excl. central government funds) – – – – – – – – – –
2. Foreign currency securities issued with embedded options (puttable bonds)
– – – – – – – – – –
3. Undrawn, unconditional credit lines provided by: 170.8 – – – – – – – – –
– BIS (+) – – – – – – – – – –
– IMF (+) 170.8 – – – – – – – – –
4. Aggregate short and long positions of options in f/c vis-a-vis the domestic currency
– – – – – – – – – –
5. Total contingent short-term net drains on f/c assets (1+2+3+4) –918.0 –1,631.0 –1,300.4 –1,772.9 –2,273.1 –2,734.9 –3,364.5 –3,110.8 –3,201.0 –2,946.0
IV. Memo items
(a) Short-term domestic currency debt indexed to the exchange rate
– – – – – – – – – –
o/w: Central government (excl. central government funds) – – – – – – – – – –
(b) Financial instruments denominated in foreign currency and settled by other means (e.g., in domestic currency)
– – – – – – – – – –
(c) Pledged assets – – – – – – – – – –
(d) Securities lent and on repo – – – – – –
– Lent or repoed and included in Section I –70.0 –20.0 –351.0 – – – – – –6.3 –9.1
– Lent or repoed but not included in Section I – – – – – – – – – –
– Borrowed or acquired and included in Section I – – – – – – – – – –
– Borrowed or acquired but not included in Section I 1,235.1 1,330.3 785.1 180.7 88.5 559.5 972.4 900.7 840.3 883.5
(e) Financial derivative assets (net, marked to market) – – – – – – – – – –
(f) Currency composition of official reserves assetsa
– Currencies in SDR basket 5,333.6 5,651.3 6,554.1 6,436.2 7,438.1 8,725.0 9,519.5 9,170.1 9,411.8 9,222.7
– Currencies not in SDR basket 0.0 0.0 0.0 0.0 0.3 0.3 0.3 0.3 0.3 0.3
– By individual currencies USD 1,738.4 1,600.8 1,937.6 1,609.1 1,104.5 1,266.0 1,239.2 1,254.2 1,285.0 1,294.8
EUR 3,471.6 4,047.9 4,615.6 4,826.3 6,332.5 7,458.0 8,276.7 7,912.2 8,122.7 7,924.3
Other 123.6 2.6 0.9 0.8 1.3 1.3 3.9 4.0 4.4 3.9a Until January 2001: Currency structure of official reserve assets and other foreign currency assets. b In accordance with the recommendation made by the IMF, time deposits with a maturity over 3 months were also included in Official reserve assets (I.A.). These deposits were previously included in Other foreign currency assets (I.B.).
Table H8: International Reserves and Foreign Currency Liquidity
International reserves and foreign currency liquidity are shown in accordance with a Template on international reserves and foreign currency liquidity, drawn up by the IMF. A detailed explanation of the Template is given in “International Reserves and Foreign Cur-rency Liquidity – Guidelines for a Data Template, 2001”.
The first part of the Template shows total assets of the Croatian National Bank in convertible foreign currency. Official reserve assets (I.A.) show those types of assets that are readily available to the CNB at any moment for bridging imbalances in international payments. Official international reserves include: short-term foreign negotiable debt securities, foreign cash, foreign currency sight deposits, foreign currency time deposits which can be withdrawn before maturity, for-eign currency time deposits with a remaining maturity of up to 1 year, reserve position with the IMF, special drawing rights, gold, and reverse repos with foreign negotiable debt securities.
The second part of the Template shows fixed predetermined for-eign currency net liabilities of the Croatian National Bank and the central government (excluding central government funds) that fall due in the next 12 months. Foreign currency loans, securities and deposits (II.1.) include future interest payments on banks’ foreign currency reserve requirements with the CNB (only interest payments for the next month are included), payments of future maturities of foreign currency CNB bills, future principal and interest payments on loans from the IMF, and future principal and interest payments on
the central government’s foreign currency debts (excluding central government funds). Aggregate short and long positions in forwards and futures in foreign currencies (II.2.) include future collections (+) or payments (–) arising from currency swaps between the CNB and domestic banks (temporary sale or purchase of foreign curren-cy). Item Other (II.3.) includes future payments arising from repo transactions with foreign negotiable debt securities.
The third part of the Template shows predetermined contingent foreign currency net liabilities of the Croatian National Bank and the central government (excluding central government funds), which fall due in the following 12 months. Contingent liabilities in foreign currency (III.1.) include future principal and interest payments on foreign loans guaranteed by the central government, and banks’ for-eign currency reserve requirements with the CNB. (The inclusion of reserve requirements in foreign currency is based on the assump-tion that there will be no changes in ratios or in the base of foreign currency reserve requirements, which comprises foreign currency sources of funds, including ordinary foreign currency accounts, spe-cial foreign currency accounts, foreign currency accounts and for-eign currency sight deposits, received foreign currency deposits and received foreign currency loans, as well as obligations arising from securities issued in foreign currency (excluding banks’ equity secu-rities) and hybrid and subordinated instruments). Undrawn credit lines show potential inflows (+) or outflows (–) which would arise from drawdowns under these credits.
The fourth part of the Template lists memo items. Short-term,

CNB BULLETIN • NUMBER 130 • STATISTICAL SURVEY • INTERNATIONAL ECONOMIC RELATIONS
87
Table H9: Midpoint Exchange Rates of the Croatian National Bank (period average)
Year Month HRK/EUR HRK/ATS HRK/FRF HRK/100 ITL HRK/CHF HRK/GBP HRK/USD HRK/DEM
1994 7.087680 0.524825 1.079616 0.371511 4.381907 9.166621 5.994736 3.692176
1995 6.757247 0.518724 1.047746 0.321349 4.425013 8.250868 5.229850 3.649215
1996 6.805527 0.513812 1.062870 0.352204 4.407070 8.476847 5.433979 3.614716
1997 6.960719 0.505335 1.056368 0.362049 4.248502 10.089408 6.161849 3.556098
1998 7.139159 0.514631 1.080018 0.366853 4.396452 10.537622 6.362284 3.620795
1999 7.581823 0.550993 1.155840 0.391568 4.739965 11.514804 7.122027 3.876528
2000 7.633852 0.554774 1.163773 0.394256 4.903244 12.530514 8.287369 3.903127
2001 7.471006 0.542939 1.138947 0.385845 4.946810 12.010936 8.339153 3.819865
2002 7.406976 5.049125 11.793108 7.872490
2003 7.564248 4.978864 10.943126 6.704449
2004 7.495680 4.854986 11.048755 6.031216
2005 7.400047 4.780586 10.821781 5.949959
2006 7.322849 4.656710 10.740292 5.839170
2006 October 7.393049 4.649986 10.983203 5.861821
November 7.344346 4.612789 10.901289 5.710001
December 7.355022 4.608204 10.930893 5.565730
2007 January 7.367082 4.562119 11.096595 5.662532
February 7.362568 4.540010 11.033457 5.639683
March 7.356923 4.563893 10.825095 5.559130
April 7.396197 4.520671 10.892890 5.482475
May 7.329989 4.442055 10.756935 5.422621
June 7.328786 4.430674 10.840476 5.467952
July 7.291804 4.400808 10.816511 5.321551
August 7.311674 4.464012 10.788705 5.366679
September 7.313069 4.440287 10.637593 5.275187
domestic currency debt indexed to foreign currency (IV.(a)) shows obligations arising from the Act on Converting Households’ Foreign Currency Deposits into the Public Debt of the Republic of Croatia, which fall due in the next 12 months. Pledged assets (IV.(c)) show time deposits in foreign currency with a maturity over 3 months list-ed in item I.B. which are also used as collateral. Repo transactions with securities show the value of collateral that is subject to repo and reverse repo transactions with securities as well as how these transac-tions are registered in the Template. Until December 2000, the cur-rency structure of international and other foreign currency reserves showed the currency structure of the total foreign currency assets of the CNB (Section I.). From January 2001, the currency structure refers to official reserve assets (Section I.A).
Table H9: Midpoint Exchange Rates of the Croatian National Bank (period average)
The annual averages of CNB midpoint exchange rates are calcu-
lated based on the midpoint exchange rates effective on the working days in a year, using CNB exchange rate lists whose application dates pertain to the calculation period.
The monthly averages of CNB midpoint exchange rates are calcu-lated based on the midpoint exchange rates effective on the working days in a month, using CNB exchange rate lists whose application dates pertain to the calculation period.
The data show the annual and monthly averages of CNB mid-point exchange rates for selected currencies from 1992 to date, in kuna terms. The averages related to the calculation periods from the beginning of 1992, when the legal tender in the Republic of Croatia was the Croatian dinar, until the introduction of the kuna on 30 May 1994, are shown in kuna equivalent, and are denominated by divid-ing their values by one thousand (1,000).
The annual and monthly averages of midpoint exchange rates for the euro from 1992 until end 1998 are the averages of midpoint exchange rates applied for the ECU.

CNB BULLETIN • NUMBER 130 • STATISTICAL SURVEY • INTERNATIONAL ECONOMIC RELATIONS
88
Table H10: Midpoint Exchange Rates of the Croatian National Bank (end of period)
Year Month HRK/EUR HRK/ATS HRK/FRF HRK/100 ITL HRK/CHF HRK/GBP HRK/USD HRK/DEM
1994 6.902400 0.516285 1.052510 0.346500 4.288893 8.784200 5.628700 3.632100
1995 6.812200 0.526742 1.085365 0.335800 4.618693 8.234500 5.316100 3.705900
1996 6.863600 0.506253 1.055662 0.362600 4.098835 9.359000 5.539600 3.562200
1997 6.947200 0.499445 1.050510 0.357700 4.332003 10.475600 6.303100 3.514000
1998 7.329100 0.531546 1.114954 0.377700 4.567584 10.451000 6.247500 3.739700
1999 7.679009 0.558055 1.170657 0.396588 4.784268 12.340257 7.647654 3.926215
2000 7.598334 0.552192 1.158359 0.392421 4.989712 12.176817 8.155344 3.884966
2001 7.370030 0.535601 1.123554 0.380630 4.977396 12.101856 8.356043 3.768237
2002 7.442292 5.120256 11.451442 7.145744
2003 7.646909 4.901551 10.860544 6.118506
2004 7.671234 4.971314 10.824374 5.636883
2005 7.375626 4.744388 10.753209 6.233626
2006 7.345081 4.571248 10.943208 5.578401
2006 October 7.369343 4.636848 11.003947 5.792143
November 7.333542 4.613451 10.861289 5.574718
December 7.345081 4.571248 10.943208 5.578401
2007 January 7.373400 4.541390 11.185376 5.691108
February 7.345292 4.540016 10.923992 5.562929
March 7.382466 4.543615 10.853375 5.542808
April 7.372840 4.486060 10.797950 5.414438
May 7.308634 4.439430 10.752735 5.439591
June 7.303218 4.407494 10.859804 5.422645
July 7.297330 4.435528 10.817269 5.337427
August 7.319403 4.458972 10.787624 5.372433
September 7.281634 4.388906 10.418707 5.136955
Table H10: Midpoint Exchange Rates of the Croatian National Bank (end of period)
The table shows CNB midpoint exchange rates applied on the last day of the observed period.
The data show CNB midpoint exchange rates for selected curren-cies from 1992 to date, in kuna terms. The end of period midpoint
exchange rates related to the periods from the beginning of the time series in 1992 until the introduction of the kuna on 30 May 1994 are shown in kuna equivalent and are denominated by dividing their values by one thousand (1,000).
The midpoint exchange rates for the euro applied on the last days of the observed periods from 1992 until end 1998 are the end of period midpoint exchange rates applied for the ECU.

CNB BULLETIN • NUMBER 130 • STATISTICAL SURVEY • INTERNATIONAL ECONOMIC RELATIONS
89
Table H11: Indices of the Effective Exchange Rate of the Kunaindices 2001=100
Year Month Nominal effective exchange rate of the kuna
Real effective exchange rate of the kuna; deflator
Producer price index Consumer price index
1996 December 83.88 90.19 96.70
1997 December 87.77 93.06 98.84
1998 December 91.09 95.99 95.39
1999 December 99.25 102.78 102.09
2000 December 101.63 100.07 101.91
2001 December 99.07 98.63 98.89
2002 December 95.99 95.65 96.26
2003 December 94.18 94.55 94.71
2004 December 90.42 90.61 90.85
2005 December 91.52 94.33 90.99
2006 September 89.68 93.75 89.88
October 90.02 93.65 90.18
November 88.95 92.91 88.59
December 88.42 92.51 87.96
2007 January 88.97 92.14 88.21
February 88.82 92.45 88.17
March 88.41 92.13 87.82
April 88.41 92.39 87.65
May 87.56 91.67 86.76
June 87.75 91.62 87.35
July 86.79 90.81a 86.78a
August 87.17 90.16a 86.71a
September 86.75a Preliminary data.Note: From 1 January 2001, the eurozone related price series includes Greece as well. Slovenia became an EMU member on 1 January 2007. Accordingly, the weight assigned to the Slovenian tolar (0.2%) has been added to the euro weight (70.6%), which now amounts to 70.8%. The weights assigned to the US dollar, pound sterling and Swiss franc have been kept at 27.2%, 1.0% and 1.0% respectively.
Table H11: Indices of the Effective Exchange Rate of the Kuna
The index of the nominal effective exchange rate of the kuna is a weighted geometric average of the index of bilateral nominal ex-change rates of the kuna against the euro, US dollar, Swiss franc, pound sterling and Slovenian tolar. The series of the indices of the effective exchange rate of the kuna, calculated in accordance with the modified CNB methodology for calculating the nominal and real effective kuna exchange rates (see Box 2, Bulletin No. 64, Octo-ber 2001), were first published in the CNB Bulletin No. 94 (June 2004). The weights are determined on the basis of the average share of a particular foreign currency in the structure of the current ac-count – ITRS data between January 2000 and December 2003 (i.e. between July 1996 and January 2000 in the previous version of the notes on methodology under Table H10). The new weights have been assigned to the euro (70.6%), US dollar (27.2%), Swiss franc (1.0%) and pound sterling (1.0%), and thus replaced the old weights of 66.2%, 30.7%, 1.6% and 1.2% for the euro, US dollar, Swiss franc and pound sterling respectively. The weight assigned to the Slovenian tolar remained unchanged at 0.2%. The year 2001 is a base period for calculating the indices of the effective exchange rate
of the kuna (1995 in the previous version of the notes on methodol-ogy under Table H10). The index of the nominal effective exchange rate is an aggregate indicator of the average value of the domestic currency against a basket of currencies. An increase in the index of the nominal effective exchange rate of the kuna in a certain period indicates that the kuna has depreciated against the basket of curren-cies, and vice versa. The index of the real effective exchange rate is a weighted geometric average of the index of bilateral exchange rates of the kuna adjusted for the corresponding indices of relative price (the ratio of price indices in partner countries and domestic prices). Producer price and consumer price indices, and the total harmonised consumer price index for the eurozone countries are used as defla-tors. The time series for consumer prices in Croatia is constructed in the following manner: retail price indices are used until December 1997 inclusive, and consumer price indices are used as of January 1998. Data for the last two months are preliminary. The historical data may be corrected for the subsequent changes in the data pub-lished by the statistical offices of the countries whose prices are in-cluded in the calculation of the index of the real effective exchange rate of the kuna.
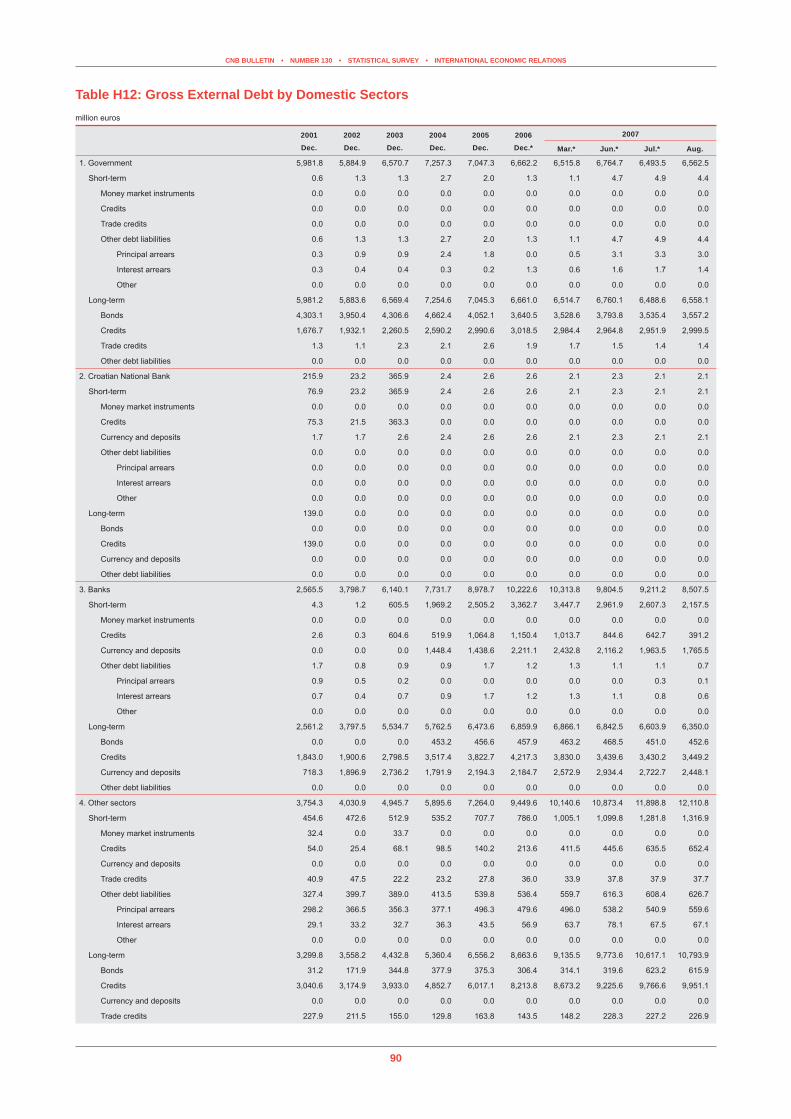
CNB BULLETIN • NUMBER 130 • STATISTICAL SURVEY • INTERNATIONAL ECONOMIC RELATIONS
90
Table H12: Gross External Debt by Domestic Sectorsmillion euros
2001Dec.
2002Dec.
2003Dec.
2004Dec.
2005Dec.
2006Dec.*
2007
Mar.* Jun.* Jul.* Aug.
1. Government 5,981.8 5,884.9 6,570.7 7,257.3 7,047.3 6,662.2 6,515.8 6,764.7 6,493.5 6,562.5
Short-term 0.6 1.3 1.3 2.7 2.0 1.3 1.1 4.7 4.9 4.4
Money market instruments 0.0 0.0 0.0 0.0 0.0 0.0 0.0 0.0 0.0 0.0
Credits 0.0 0.0 0.0 0.0 0.0 0.0 0.0 0.0 0.0 0.0
Trade credits 0.0 0.0 0.0 0.0 0.0 0.0 0.0 0.0 0.0 0.0
Other debt liabilities 0.6 1.3 1.3 2.7 2.0 1.3 1.1 4.7 4.9 4.4
Principal arrears 0.3 0.9 0.9 2.4 1.8 0.0 0.5 3.1 3.3 3.0
Interest arrears 0.3 0.4 0.4 0.3 0.2 1.3 0.6 1.6 1.7 1.4
Other 0.0 0.0 0.0 0.0 0.0 0.0 0.0 0.0 0.0 0.0
Long-term 5,981.2 5,883.6 6,569.4 7,254.6 7,045.3 6,661.0 6,514.7 6,760.1 6,488.6 6,558.1
Bonds 4,303.1 3,950.4 4,306.6 4,662.4 4,052.1 3,640.5 3,528.6 3,793.8 3,535.4 3,557.2
Credits 1,676.7 1,932.1 2,260.5 2,590.2 2,990.6 3,018.5 2,984.4 2,964.8 2,951.9 2,999.5
Trade credits 1.3 1.1 2.3 2.1 2.6 1.9 1.7 1.5 1.4 1.4
Other debt liabilities 0.0 0.0 0.0 0.0 0.0 0.0 0.0 0.0 0.0 0.0
2. Croatian National Bank 215.9 23.2 365.9 2.4 2.6 2.6 2.1 2.3 2.1 2.1
Short-term 76.9 23.2 365.9 2.4 2.6 2.6 2.1 2.3 2.1 2.1
Money market instruments 0.0 0.0 0.0 0.0 0.0 0.0 0.0 0.0 0.0 0.0
Credits 75.3 21.5 363.3 0.0 0.0 0.0 0.0 0.0 0.0 0.0
Currency and deposits 1.7 1.7 2.6 2.4 2.6 2.6 2.1 2.3 2.1 2.1
Other debt liabilities 0.0 0.0 0.0 0.0 0.0 0.0 0.0 0.0 0.0 0.0
Principal arrears 0.0 0.0 0.0 0.0 0.0 0.0 0.0 0.0 0.0 0.0
Interest arrears 0.0 0.0 0.0 0.0 0.0 0.0 0.0 0.0 0.0 0.0
Other 0.0 0.0 0.0 0.0 0.0 0.0 0.0 0.0 0.0 0.0
Long-term 139.0 0.0 0.0 0.0 0.0 0.0 0.0 0.0 0.0 0.0
Bonds 0.0 0.0 0.0 0.0 0.0 0.0 0.0 0.0 0.0 0.0
Credits 139.0 0.0 0.0 0.0 0.0 0.0 0.0 0.0 0.0 0.0
Currency and deposits 0.0 0.0 0.0 0.0 0.0 0.0 0.0 0.0 0.0 0.0
Other debt liabilities 0.0 0.0 0.0 0.0 0.0 0.0 0.0 0.0 0.0 0.0
3. Banks 2,565.5 3,798.7 6,140.1 7,731.7 8,978.7 10,222.6 10,313.8 9,804.5 9,211.2 8,507.5
Short-term 4.3 1.2 605.5 1,969.2 2,505.2 3,362.7 3,447.7 2,961.9 2,607.3 2,157.5
Money market instruments 0.0 0.0 0.0 0.0 0.0 0.0 0.0 0.0 0.0 0.0
Credits 2.6 0.3 604.6 519.9 1,064.8 1,150.4 1,013.7 844.6 642.7 391.2
Currency and deposits 0.0 0.0 0.0 1,448.4 1,438.6 2,211.1 2,432.8 2,116.2 1,963.5 1,765.5
Other debt liabilities 1.7 0.8 0.9 0.9 1.7 1.2 1.3 1.1 1.1 0.7
Principal arrears 0.9 0.5 0.2 0.0 0.0 0.0 0.0 0.0 0.3 0.1
Interest arrears 0.7 0.4 0.7 0.9 1.7 1.2 1.3 1.1 0.8 0.6
Other 0.0 0.0 0.0 0.0 0.0 0.0 0.0 0.0 0.0 0.0
Long-term 2,561.2 3,797.5 5,534.7 5,762.5 6,473.6 6,859.9 6,866.1 6,842.5 6,603.9 6,350.0
Bonds 0.0 0.0 0.0 453.2 456.6 457.9 463.2 468.5 451.0 452.6
Credits 1,843.0 1,900.6 2,798.5 3,517.4 3,822.7 4,217.3 3,830.0 3,439.6 3,430.2 3,449.2
Currency and deposits 718.3 1,896.9 2,736.2 1,791.9 2,194.3 2,184.7 2,572.9 2,934.4 2,722.7 2,448.1
Other debt liabilities 0.0 0.0 0.0 0.0 0.0 0.0 0.0 0.0 0.0 0.0
4. Other sectors 3,754.3 4,030.9 4,945.7 5,895.6 7,264.0 9,449.6 10,140.6 10,873.4 11,898.8 12,110.8
Short-term 454.6 472.6 512.9 535.2 707.7 786.0 1,005.1 1,099.8 1,281.8 1,316.9
Money market instruments 32.4 0.0 33.7 0.0 0.0 0.0 0.0 0.0 0.0 0.0
Credits 54.0 25.4 68.1 98.5 140.2 213.6 411.5 445.6 635.5 652.4
Currency and deposits 0.0 0.0 0.0 0.0 0.0 0.0 0.0 0.0 0.0 0.0
Trade credits 40.9 47.5 22.2 23.2 27.8 36.0 33.9 37.8 37.9 37.7
Other debt liabilities 327.4 399.7 389.0 413.5 539.8 536.4 559.7 616.3 608.4 626.7
Principal arrears 298.2 366.5 356.3 377.1 496.3 479.6 496.0 538.2 540.9 559.6
Interest arrears 29.1 33.2 32.7 36.3 43.5 56.9 63.7 78.1 67.5 67.1
Other 0.0 0.0 0.0 0.0 0.0 0.0 0.0 0.0 0.0 0.0
Long-term 3,299.8 3,558.2 4,432.8 5,360.4 6,556.2 8,663.6 9,135.5 9,773.6 10,617.1 10,793.9
Bonds 31.2 171.9 344.8 377.9 375.3 306.4 314.1 319.6 623.2 615.9
Credits 3,040.6 3,174.9 3,933.0 4,852.7 6,017.1 8,213.8 8,673.2 9,225.6 9,766.6 9,951.1
Currency and deposits 0.0 0.0 0.0 0.0 0.0 0.0 0.0 0.0 0.0 0.0
Trade credits 227.9 211.5 155.0 129.8 163.8 143.5 148.2 228.3 227.2 226.9

CNB BULLETIN • NUMBER 130 • STATISTICAL SURVEY • INTERNATIONAL ECONOMIC RELATIONS
91
Other debt liabilities 0.0 0.0 0.0 0.0 0.0 0.0 0.0 0.0 0.0 0.0
5. Direct investment 1,091.7 1,405.4 1,861.4 2,046.1 2,455.0 2,847.1 2,985.6 3,329.9 3,261.3 3,453.0
Short-term 56.7 79.8 122.3 124.1 184.6 260.5 313.5 373.5 370.7 367.5
Money market instruments 0.0 0.0 0.0 0.0 0.0 0.0 0.0 0.0 0.0 0.0
Credits 4.5 29.9 38.7 33.0 36.5 53.2 91.0 123.9 133.5 120.8
Trade credits 1.6 0.0 0.0 0.0 0.0 0.0 0.0 0.0 0.0 0.0
Other debt liabilities 50.6 49.9 83.6 91.2 148.1 207.3 222.4 249.6 237.2 246.7
Principal arrears 42.7 42.0 73.4 78.1 128.7 179.6 196.5 218.3 212.6 222.3
Interest arrears 7.9 7.9 10.2 13.1 19.4 27.7 26.0 31.3 24.6 24.4
Other 0.0 0.0 0.0 0.0 0.0 0.0 0.0 0.0 0.0 0.0
Long-term 1,035.0 1,325.7 1,739.1 1,921.9 2,270.4 2,586.6 2,672.2 2,956.4 2,890.5 3,085.5
Bonds 0.0 0.0 0.0 0.0 0.0 0.0 0.0 0.0 0.0 0.0
Credits 1,013.4 1,291.6 1,707.6 1,892.2 2,236.8 2,559.7 2,647.0 2,932.0 2,866.3 3,061.9
Trade credits 21.6 34.1 31.5 29.8 33.6 26.8 25.2 24.4 24.2 23.6
Other debt liabilities 0.0 0.0 0.0 0.0 0.0 0.0 0.0 0.0 0.0 0.0
Total (1+2+3+4+5) 13,609.3 15,143.1 19,883.8 22,933.0 25,747.7 29,184.2 29,958.0 30,774.8 30,867.0 30,635.9
Table H12: Gross External Debt by Domestic Sectors
External debt is defined as the external debt liabilities of resi-dents on the basis of debt securities issued in the foreign markets (at face value), credits (repo agreements included) regardless of their contractual maturity, deposits of non-residents, and trade credits granted by non-residents with contractual maturity of more than 180 days (90 days up to 11 July 2001 and 150 days up to 31 December 2002).
External debt by domestic sectors is shown in the same manner as in the Capital and Financial Account of the BOP. Item Govern-ment shows the external debt of the general government, compris-ing the Republic of Croatia, central government funds (including the Croatian Bank for Reconstruction and Development, the State Agency for Deposit Insurance and Bank Rehabilitation, the Croatian Roads and the Croatian Motorways), and local government. Item Croatian National Bank shows the debt of the central bank. Item Banks shows the debt of banks. Item Other sectors shows the debt of other banking institutions, non-banking financial institutions, enter-prises, non-profit institutions and households, including craftsmen. Item Direct investment shows borrower – lender transactions of other sectors that are interrelated by ownership (borrower or lender owns more than 10% of the other).
Each sector data are further shown by contractual (short-term or long-term) maturity and by debt instrument. From the beginning of 2004, instruments included in item Currency and deposits (3. Banks) are reported in accordance with their maturity. Data for the previous periods are reported only on a long-term basis.
Outstanding gross external debt includes principal and interest
arrears, as well as accrual interest and future principal payments.Outstanding debt data are shown at the CNB’s midpoint ex-
change rate at the end of the period.Data are considered preliminary until after publication of the final
BOP data for the reporting quarter.
Table H13: Public Sector Gross External Debt, and Publicly Guaranteed and Non-Publicly Guaranteed Private Sector Gross External Debt
The gross external debt position presented in this Table highlights the role of the public sector.
Public sector includes the general government (comprising the Republic of Croatia, central government funds and local govern-ment), the central bank, public enterprises and mixed enterprises. Public enterprises are defined as enterprises in 100% ownership of business entities from the public sector. Mixed enterprises are de-fined as enterprises in which business entities from the public sector have a share larger than 50%.
Publicly guaranteed private sector gross external debt is defined as the external debt liabilities of business entities not covered by the definition of the public sector, the servicing of which is guaranteed by a business entity from the public sector.
Non-publicly guaranteed private sector gross external debt is de-fined as the external debt liabilities of business entities not covered by the definition of the public sector, the servicing of which is not guaranteed by the public sector.
Items are valued in the same manner as in Table H12.

CNB BULLETIN • NUMBER 130 • STATISTICAL SURVEY • INTERNATIONAL ECONOMIC RELATIONS
92
Table H13: Public Sector Gross External Debt, and Publicly Guaranteed and Non-Publicly Guaranteed Private Sector Gross External Debtmillion euros
2001Dec.
2002Dec.
2003Dec.
2004Dec.
2005Dec.
2006Dec.*
2007
Mar.* Jun.* Jul. Aug.
1. Public sector 7,542.4 7,211.5 8,327.6 8,580.3 8,500.4 8,250.2 8,174.7 8,553.3 8,662.0 8,728.3
Short-term 178.4 60.8 415.8 29.5 23.1 43.1 34.9 37.2 37.8 38.6
Money market instruments 26.7 0.0 0.0 0.0 0.0 0.0 0.0 0.0 0.0 0.0
Credits 98.5 21.9 391.2 0.7 2.3 15.2 12.4 12.2 13.6 14.4
Currency and deposits 1.7 1.7 2.6 2.4 2.6 2.6 2.1 2.3 2.1 2.1
Trade credits 26.4 0.0 0.0 0.0 0.0 0.0 0.0 0.0 0.0 0.0
Other debt liabilities 25.1 37.2 22.1 26.4 18.2 25.3 20.4 22.6 22.1 22.0
Principal arrears 23.0 35.0 20.5 25.4 17.1 21.9 19.2 19.2 19.0 19.0
Interest arrears 2.1 2.1 1.6 1.0 1.1 3.4 1.2 3.5 3.1 3.1
Other 0.0 0.0 0.0 0.0 0.0 0.0 0.0 0.0 0.0 0.0
Long-term 7,363.4 7,150.2 7,911.5 8,549.6 8,476.3 8,205.7 8,138.2 8,514.6 8,622.3 8,687.9
Bonds 4,303.1 3,950.4 4,306.6 4,662.4 4,052.1 3,640.5 3,528.6 3,793.8 3,836.3 3,852.6
Credits 2,967.5 3,118.5 3,554.4 3,833.2 4,314.5 4,478.5 4,509.5 4,565.6 4,631.4 4,683.9
Currency and deposits 0.0 0.0 0.0 0.0 0.0 0.0 9.6 7.4 11.0 7.3
Trade credits 92.8 81.4 50.6 54.1 109.7 86.6 90.6 147.8 143.6 144.0
Other debt liabilities 0.0 0.0 0.0 0.0 0.0 0.0 0.0 0.0 0.0 0.0
Direct investment 0.6 0.5 0.3 1.2 1.0 1.5 1.5 1.5 1.8 1.8
2. Publicly guaranteed private sector 622.1 559.5 433.7 334.1 290.8 204.0 177.5 174.5 150.4 151.2
Short-term 11.4 21.8 21.1 23.5 22.1 17.2 16.4 15.8 16.7 16.8
Money market instruments 0.0 0.0 0.0 0.0 0.0 0.0 0.0 0.0 0.0 0.0
Credits 0.0 0.0 0.0 0.0 0.0 0.0 0.0 0.0 0.0 0.0
Currency and deposits 0.0 0.0 0.0 0.0 0.0 0.0 0.0 0.0 0.0 0.0
Trade credits 0.0 0.0 0.0 0.0 0.0 0.0 0.0 0.0 0.0 0.0
Other debt liabilities 11.4 21.8 21.1 23.5 22.1 17.2 16.4 15.8 16.7 16.8
Principal arrears 7.0 13.9 14.3 15.6 14.5 14.4 13.9 13.3 14.7 14.7
Interest arrears 4.4 7.9 6.8 7.9 7.6 2.8 2.4 2.5 2.1 2.1
Other 0.0 0.0 0.0 0.0 0.0 0.0 0.0 0.0 0.0 0.0
Long-term 610.7 537.8 412.6 310.6 268.8 186.9 161.1 158.7 133.6 134.5
Bonds 31.2 31.2 31.2 0.0 0.0 0.0 0.0 0.0 0.0 0.0
Credits 573.6 502.5 378.9 309.1 267.0 186.9 161.1 158.7 133.6 134.5
Currency and deposits 0.0 0.0 0.0 0.0 0.0 0.0 0.0 0.0 0.0 0.0
Trade credits 5.9 4.0 2.5 1.5 1.8 0.0 0.0 0.0 0.0 0.0
Other debt liabilities 0.0 0.0 0.0 0.0 0.0 0.0 0.0 0.0 0.0 0.0
Direct investment 0.0 0.0 0.0 0.0 0.0 0.0 0.0 0.0 0.0 0.0
3. Non-publicly guaranteed private sector 5,444.7 7,372.1 11,122.4 14,018.6 16,956.4 20,729.9 21,605.8 22,047.0 22,054.6 21,756.3
Short-term 346.6 415.8 1,048.6 2,456.4 3,172.3 4,092.4 4,404.7 4,015.7 3,841.5 3,425.6
Money market instruments 5.6 0.0 33.7 0.0 0.0 0.0 0.0 0.0 0.0 0.0
Credits 33.4 25.4 644.8 617.7 1,202.7 1,348.9 1,412.7 1,278.0 1,264.6 1,029.3
Currency and deposits 0.0 0.0 0.0 1,448.4 1,438.6 2,211.1 2,432.8 2,116.2 1,963.5 1,765.5
Trade credits 14.6 47.5 22.2 23.2 27.8 36.0 33.9 37.8 37.9 37.7
Other debt liabilities 293.1 342.9 347.9 367.1 503.2 496.5 525.3 583.6 575.6 593.0
Principal arrears 269.5 318.9 322.6 338.5 466.4 443.3 463.4 508.8 510.7 529.0
Interest arrears 23.6 24.0 25.3 28.6 36.8 53.2 62.0 74.9 64.8 64.0
Other 0.0 0.0 0.0 0.0 0.0 0.0 0.0 0.0 0.0 0.0
Long-term 4,007.0 5,551.4 8,212.8 9,517.3 11,330.1 13,792.0 14,217.0 14,702.9 14,953.7 14,879.6
Bonds 0.0 140.7 313.7 831.1 831.8 764.3 777.3 788.1 773.3 773.2
Credits 3,158.2 3,386.6 5,058.6 6,817.9 8,249.0 10,784.2 10,807.4 10,898.3 11,372.8 11,574.1
Currency and deposits 718.3 1,896.9 2,736.2 1,791.9 2,194.3 2,184.7 2,572.9 2,934.4 2,722.7 2,448.1
Trade credits 130.5 127.1 104.3 76.3 55.0 58.8 59.4 82.0 84.9 84.2
Other debt liabilities 0.0 0.0 0.0 0.0 0.0 0.0 0.0 0.0 0.0 0.0
Direct investment 1,091.1 1,404.9 1,861.1 2,044.9 2,454.0 2,845.6 2,984.1 3,328.4 3,259.4 3,451.1
Total (1+2+3) 13,609.3 15,143.1 19,883.8 22,933.0 25,747.7 29,184.2 29,958.0 30,774.8 30,866.9 30,635.9

CNB BULLETIN • NUMBER 130 • STATISTICAL SURVEY • INTERNATIONAL ECONOMIC RELATIONS
93
Table H14: Gross External Debt by Domestic Sectors and Projected Future Paymentsmillion euros
Outstanding debt
31/8/2007Immediate
Projected future principal payments
Q3/07 Q4/07 Q1/08 Q2/08 2007 2008 2009 2010 2011 2012 2013 2014 Other
1. Government 6,562.5 4.4 115.4 106.6 86.6 406.5 222.0 706.5 1,049.3 839.5 1,483.3 276.6 229.5 698.0 1,053.5
Short-term 4.4 4.4 0.0 0.0 0.0 0.0 0.0 0.0 0.0 0.0 0.0 0.0 0.0 0.0 0.0
Money market instruments 0.0 0.0 0.0 0.0 0.0 0.0 0.0 0.0 0.0 0.0 0.0 0.0 0.0 0.0 0.0
Credits 0.0 0.0 0.0 0.0 0.0 0.0 0.0 0.0 0.0 0.0 0.0 0.0 0.0 0.0 0.0
Trade credits 0.0 0.0 0.0 0.0 0.0 0.0 0.0 0.0 0.0 0.0 0.0 0.0 0.0 0.0 0.0
Other debt liabilities 4.4 4.4 0.0 0.0 0.0 0.0 0.0 0.0 0.0 0.0 0.0 0.0 0.0 0.0 0.0
Principal arrears 3.0 3.0 0.0 0.0 0.0 0.0 0.0 0.0 0.0 0.0 0.0 0.0 0.0 0.0 0.0
Interest arrears 1.4 1.4 0.0 0.0 0.0 0.0 0.0 0.0 0.0 0.0 0.0 0.0 0.0 0.0 0.0
Other 0.0 0.0 0.0 0.0 0.0 0.0 0.0 0.0 0.0 0.0 0.0 0.0 0.0 0.0 0.0
Long-term 6,558.1 0.0 115.4 106.6 86.6 406.5 222.0 706.5 1,049.3 839.5 1,483.3 276.6 229.5 698.0 1,053.5
Bonds 3,557.2 0.0 78.1 0.0 27.3 156.8 78.1 228.8 726.3 566.0 1,057.1 45.7 28.4 523.1 303.8
Credits 2,999.5 0.0 37.3 106.4 59.1 249.6 143.7 477.1 322.9 273.5 426.1 230.8 201.0 174.9 749.6
Trade credits 1.4 0.0 0.0 0.2 0.2 0.2 0.2 0.5 0.1 0.1 0.1 0.1 0.1 0.1 0.2
Other debt liabilities 0.0 0.0 0.0 0.0 0.0 0.0 0.0 0.0 0.0 0.0 0.0 0.0 0.0 0.0 0.0
2. Croatian National Bank 2.1 0.0 2.1 0.0 0.0 0.0 2.1 0.0 0.0 0.0 0.0 0.0 0.0 0.0 0.0
Short-term 2.1 0.0 2.1 0.0 0.0 0.0 2.1 0.0 0.0 0.0 0.0 0.0 0.0 0.0 0.0
Money market instruments 0.0 0.0 0.0 0.0 0.0 0.0 0.0 0.0 0.0 0.0 0.0 0.0 0.0 0.0 0.0
Credits 0.0 0.0 0.0 0.0 0.0 0.0 0.0 0.0 0.0 0.0 0.0 0.0 0.0 0.0 0.0
Currency and deposits 2.1 0.0 2.1 0.0 0.0 0.0 2.1 0.0 0.0 0.0 0.0 0.0 0.0 0.0 0.0
Other debt liabilities 0.0 0.0 0.0 0.0 0.0 0.0 0.0 0.0 0.0 0.0 0.0 0.0 0.0 0.0 0.0
Principal arrears 0.0 0.0 0.0 0.0 0.0 0.0 0.0 0.0 0.0 0.0 0.0 0.0 0.0 0.0 0.0
Interest arrears 0.0 0.0 0.0 0.0 0.0 0.0 0.0 0.0 0.0 0.0 0.0 0.0 0.0 0.0 0.0
Other 0.0 0.0 0.0 0.0 0.0 0.0 0.0 0.0 0.0 0.0 0.0 0.0 0.0 0.0 0.0
Long-term 0.0 0.0 0.0 0.0 0.0 0.0 0.0 0.0 0.0 0.0 0.0 0.0 0.0 0.0 0.0
Bonds 0.0 0.0 0.0 0.0 0.0 0.0 0.0 0.0 0.0 0.0 0.0 0.0 0.0 0.0 0.0
Credits 0.0 0.0 0.0 0.0 0.0 0.0 0.0 0.0 0.0 0.0 0.0 0.0 0.0 0.0 0.0
Currency and deposits 0.0 0.0 0.0 0.0 0.0 0.0 0.0 0.0 0.0 0.0 0.0 0.0 0.0 0.0 0.0
Other debt liabilities 0.0 0.0 0.0 0.0 0.0 0.0 0.0 0.0 0.0 0.0 0.0 0.0 0.0 0.0 0.0
3. Banks 8,507.5 0.7 1,428.3 820.0 183.1 314.3 2,248.3 1,251.7 1,590.7 272.2 741.3 376.4 93.8 73.9 1,858.5
Short-term 2,157.5 0.7 1,331.2 493.4 79.0 164.7 1,824.6 332.2 0.0 0.0 0.0 0.0 0.0 0.0 0.0
Money market instruments 0.0 0.0 0.0 0.0 0.0 0.0 0.0 0.0 0.0 0.0 0.0 0.0 0.0 0.0 0.0
Credits 391.2 0.0 305.5 0.0 0.0 85.7 305.5 85.7 0.0 0.0 0.0 0.0 0.0 0.0 0.0
Currency and deposits 1,765.5 0.0 1,025.7 493.4 79.0 79.0 1,519.1 246.5 0.0 0.0 0.0 0.0 0.0 0.0 0.0
Other debt liabilities 0.7 0.7 0.0 0.0 0.0 0.0 0.0 0.0 0.0 0.0 0.0 0.0 0.0 0.0 0.0
Principal arrears 0.1 0.1 0.0 0.0 0.0 0.0 0.0 0.0 0.0 0.0 0.0 0.0 0.0 0.0 0.0
Interest arrears 0.6 0.6 0.0 0.0 0.0 0.0 0.0 0.0 0.0 0.0 0.0 0.0 0.0 0.0 0.0
Other 0.0 0.0 0.0 0.0 0.0 0.0 0.0 0.0 0.0 0.0 0.0 0.0 0.0 0.0 0.0
Long-term 6,350.0 0.0 97.1 326.6 104.2 149.7 423.7 919.5 1,590.7 272.2 741.3 376.4 93.8 73.9 1,858.5
Bonds 452.6 0.0 2.6 0.0 0.0 0.0 2.6 0.0 450.0 0.0 0.0 0.0 0.0 0.0 0.0
Credits 3,449.2 0.0 51.8 188.8 54.0 99.5 240.6 681.4 876.7 164.9 741.3 376.4 93.8 73.9 200.4
Currency and deposits 2,448.1 0.0 42.7 137.9 50.1 50.1 180.6 238.1 264.0 107.4 0.0 0.0 0.0 0.0 1,658.1
Other debt liabilities 0.0 0.0 0.0 0.0 0.0 0.0 0.0 0.0 0.0 0.0 0.0 0.0 0.0 0.0 0.0
4. Other sectors 12,110.8 626.7 321.9 1,009.2 538.2 392.5 1,331.1 1,894.4 1,656.5 1,329.9 1,426.7 1,037.2 325.3 293.5 2,189.6
Short-term 1,316.9 626.7 60.4 327.8 207.3 37.2 388.2 302.0 0.0 0.0 0.0 0.0 0.0 0.0 0.0
Money market instruments 0.0 0.0 0.0 0.0 0.0 0.0 0.0 0.0 0.0 0.0 0.0 0.0 0.0 0.0 0.0
Credits 652.4 0.0 60.4 327.8 169.6 37.2 388.2 264.2 0.0 0.0 0.0 0.0 0.0 0.0 0.0
Currency and deposits 0.0 0.0 0.0 0.0 0.0 0.0 0.0 0.0 0.0 0.0 0.0 0.0 0.0 0.0 0.0
Trade credits 37.7 0.0 0.0 0.0 37.7 0.0 0.0 37.7 0.0 0.0 0.0 0.0 0.0 0.0 0.0
Other debt liabilities 626.7 626.7 0.0 0.0 0.0 0.0 0.0 0.0 0.0 0.0 0.0 0.0 0.0 0.0 0.0
Principal arrears 559.6 559.6 0.0 0.0 0.0 0.0 0.0 0.0 0.0 0.0 0.0 0.0 0.0 0.0 0.0
Interest arrears 67.1 67.1 0.0 0.0 0.0 0.0 0.0 0.0 0.0 0.0 0.0 0.0 0.0 0.0 0.0
Other 0.0 0.0 0.0 0.0 0.0 0.0 0.0 0.0 0.0 0.0 0.0 0.0 0.0 0.0 0.0
Long-term 10,793.9 0.0 261.6 681.3 330.9 355.3 942.9 1,592.4 1,656.5 1,329.9 1,426.7 1,037.2 325.3 293.5 2,189.6
Bonds 615.9 0.0 19.9 0.0 0.0 0.0 19.9 6.5 6.5 7.4 124.8 9.3 9.3 11.1 421.1
Credits 9,951.1 0.0 231.3 662.9 310.4 337.4 894.2 1,498.5 1,571.8 1,297.5 1,297.6 1,027.5 314.6 282.0 1,767.5
Currency and deposits 0.0 0.0 0.0 0.0 0.0 0.0 0.0 0.0 0.0 0.0 0.0 0.0 0.0 0.0 0.0
Trade credits 226.9 0.0 10.4 18.4 20.5 17.9 28.8 87.5 78.1 25.0 4.4 0.5 1.4 0.3 0.9

CNB BULLETIN • NUMBER 130 • STATISTICAL SURVEY • INTERNATIONAL ECONOMIC RELATIONS
94
Other debt liabilities 0.0 0.0 0.0 0.0 0.0 0.0 0.0 0.0 0.0 0.0 0.0 0.0 0.0 0.0 0.0
5. Direct investment 3,453.0 246.7 129.6 234.8 196.5 104.6 364.5 531.4 426.6 298.2 363.9 236.9 52.8 95.8 836.3
Short-term 367.5 246.7 21.0 52.0 22.9 18.8 73.0 47.8 0.0 0.0 0.0 0.0 0.0 0.0 0.0
Money market instruments 0.0 0.0 0.0 0.0 0.0 0.0 0.0 0.0 0.0 0.0 0.0 0.0 0.0 0.0 0.0
Credits 120.8 0.0 21.0 52.0 22.9 18.8 73.0 47.8 0.0 0.0 0.0 0.0 0.0 0.0 0.0
Trade credits 0.0 0.0 0.0 0.0 0.0 0.0 0.0 0.0 0.0 0.0 0.0 0.0 0.0 0.0 0.0
Other debt liabilities 246.7 246.7 0.0 0.0 0.0 0.0 0.0 0.0 0.0 0.0 0.0 0.0 0.0 0.0 0.0
Principal arrears 222.3 222.3 0.0 0.0 0.0 0.0 0.0 0.0 0.0 0.0 0.0 0.0 0.0 0.0 0.0
Interest arrears 24.4 24.4 0.0 0.0 0.0 0.0 0.0 0.0 0.0 0.0 0.0 0.0 0.0 0.0 0.0
Other 0.0 0.0 0.0 0.0 0.0 0.0 0.0 0.0 0.0 0.0 0.0 0.0 0.0 0.0 0.0
Long-term 3,085.5 0.0 108.7 182.8 173.6 85.8 291.5 483.6 426.6 298.2 363.9 236.9 52.8 95.8 836.3
Bonds 0.0 0.0 0.0 0.0 0.0 0.0 0.0 0.0 0.0 0.0 0.0 0.0 0.0 0.0 0.0
Credits 3,061.9 0.0 107.0 181.1 172.3 85.0 288.1 479.2 420.0 291.6 362.6 236.4 52.6 95.4 836.1
Trade credits 23.6 0.0 1.6 1.8 1.3 0.8 3.4 4.4 6.6 6.6 1.4 0.6 0.2 0.5 0.1
Other debt liabilities 0.0 0.0 0.0 0.0 0.0 0.0 0.0 0.0 0.0 0.0 0.0 0.0 0.0 0.0 0.0
Total (1+2+3+4+5) 30,635.9 878.6 1,997.3 2,170.6 1,004.5 1,218.0 4,167.9 4,384.0 4,723.0 2,739.8 4,015.3 1,927.1 701.3 1,161.1 5,937.8
Supplement: Projected interest payments
0.0 264.7 261.6 225.2 264.7 878.0 792.8 608.8 528.1 293.2 242.9 231.9 704.6
Table H14: Gross External Debt by Domestic Sectors and Projected Future Payments
The Table shows outstanding gross external debt, projected prin-cipal payments and estimated interest payments according to the CNB’s midpoint exchange rate at the end of the period. Principal payments on Currency and deposits of non-residents are projected according to the available monetary statistics data on original and remaining maturity.
Estimated interest payments do not include interest on deposits from non-residents, repo transactions and hybrid and subordinated instruments, as well as late interest on these instruments. Future interest payments are estimated on the basis of contractual interest rates and do not reflect changes of variable interest rates.
Projected payments of accrual interest, which are an integral part of the gross external debt, increase the projected principal payments in the first quarter period and, consequently, decrease the interest payments estimated for the same period.

CNB BULLETIN • NUMBER 130 • STATISTICAL SURVEY • INTERNATIONAL ECONOMIC RELATIONS
95
Table H15: International Investment Position – Summarymillion euros
2001 2002a 2003a 2004a 2005a 2006a2007
Q1a Q2b
1. International investment position (net) –4,204.4 –7,185.3 –10,827.2 –15,526.7 –20,387.5 –30,084.3 –35,284.4 –37,947.3
2. Assets 12,720.6 12,492.1 14,237.1 14,962.5 15,888.5 18,080.8 18,792.5 19,260.0
2.1. Direct investment abroad 1,008.0 1,606.8 1,626.7 1,563.4 1,729.7 1,831.6 1,895.4 2,190.7
2.2. Portfolio investment 251.1 876.5 737.4 1,506.0 2,136.8 2,575.9 2,873.0 3,243.7
2.2.1. Equity securities 23.6 105.6 174.9 202.9 481.3 828.1 1,205.8 1,589.7
2.2.2. Debt securities 227.5 770.9 562.5 1,303.1 1,655.6 1,747.8 1,667.2 1,654.1
Bonds 196.4 761.0 560.0 1,142.6 1,508.4 1,356.4 1,262.1 1,232.5
Money market instruments 31.1 9.9 2.4 160.4 147.1 391.4 405.1 421.5
2.3. Financial derivatives 0.0 0.0 0.0 0.0 0.0 0.0 0.0 0.0
2.4. Other investment 6,127.9 4,357.4 5,319.0 5,456.9 4,583.7 4,947.9 4,504.3 4,655.2
2.4.1. Trade credits 249.3 222.5 253.4 221.6 263.0 236.7 225.5 198.8
2.4.2. Loans 95.6 108.9 102.1 102.2 146.1 240.4 252.0 253.5
2.4.3. Currency and deposits 5,782.9 4,026.0 4,963.5 5,133.1 4,174.5 4,470.5 4,026.8 4,202.9
2.4.4. Other assets 0.0 0.0 0.0 0.0 0.0 0.4 0.0 0.0
2.5. Reserve assets (CNB) 5,333.6 5,651.3 6,554.1 6,436.1 7,438.4 8,725.3 9,519.7 9,170.3
3. Liabilities 16,925.0 19,677.3 25,064.3 30,489.1 36,276.1 48,165.0 54,076.9 57,207.2
3.1. Direct investment in Croatia 4,414.0 5,790.8 6,808.6 9,114.2 12,336.9 20,753.1 26,014.9 28,606.2
3.2. Portfolio investment 4,474.5 4,347.4 4,918.4 5,981.6 5,530.4 5,450.0 5,388.0 5,760.8
3.2.1. Equity securities 144.1 238.7 233.4 488.1 646.5 1,037.5 1,080.4 1,198.2
3.2.2. Debt securities 4,330.4 4,108.7 4,685.1 5,493.5 4,883.9 4,412.5 4,307.6 4,562.6
Bonds 4,299.3 4,108.7 4,651.4 5,493.5 4,883.9 4,412.5 4,307.6 4,562.6
Money market instruments 31.1 0.0 33.7 0.0 0.0 0.0 0.0 0.0
3.3. Financial derivatives 0.0 0.0 0.0 0.0 0.0 0.0 0.0 0.0
3.4. Other investment 8,036.5 9,539.1 13,337.3 15,393.4 18,408.7 21,961.9 22,674.0 22,840.2
3.4.1. Trade credits 268.4 258.4 179.5 155.1 194.2 181.3 183.5 257.7
3.4.2. Loans 6,722.9 6,981.2 10,027.9 11,578.7 14,035.5 16,833.6 16,902.4 16,846.6
3.4.3. Currency and deposits 719.9 1,898.6 2,738.8 3,242.7 3,635.6 4,398.3 5,007.8 5,053.0
3.4.4. Other assets 325.3 400.9 391.2 417.0 543.5 548.7 580.2 683.0a Revised data. b Preliminary data.
Table H15: International Investment Position
This table is made in accordance with the recommendations of the IMF (Balance of Payments Manual, Fifth Edition, 1993). Data sources include: reports from banks, enterprises, the Croatian Na-tional Bank, and the Zagreb Stock Exchange (ZSE).
Data on international investments of the Republic of Croatia and international investments into the Republic of Croatia are recorded in euros (EUR) and US dollars (USD). Depending on the sources of data available, the conversion of values from the original currencies into the reporting currencies is performed:
by applying the current rate of exchange or the average monthly
midpoint exchange rate of the Croatian National Bank to trans-actions;by applying the midpoint exchange rate of the Croatian National
Bank on the reporting date to balances.The source of data on foreign direct and portfolio equity invest-
ment is the statistical research of the Croatian National Bank. The equity investments have been monitored since the beginning of 2001 and are corrected for changes in the official index of the Zagreb Stock Exchange (CROBEX).
Portfolio debt investment and other investment are classified ac-cording to the following institutional sectors: the Croatian National Bank, government, banks and other sectors. The government sector comprises the central government and funds and local government authorities. The banking sector comprises banks.
Item Portfolio debt investment – Assets and liabilities comprises data on investments of residents into debt securities issued by non-residents (assets) and investments of non-residents into debt securi-
ties issued by residents (liabilities). The source of data is the register of foreign credit relations kept by the Croatian National Bank, which also comprises claims and liabilities arising from bonds and money market instruments.
Item Other investment – Trade credits – Assets and liabilities comprises foreign claims and foreign liabilities of the said sectors arising from trade credits. The source of data is the register of for-eign credit relations kept by the Croatian National Bank.
Item Other investment – Loans – Assets and liabilities comprises data on loans granted and received between residents and non-resi-dents classified according to institutional sectors. The source of data is the register of foreign credit relations kept by the Croatian National Bank.
Item Other investment – Currency and deposits – Assets shows the total liquid foreign currency assets of banks authorised to do business abroad reduced by the amount of foreign currency depos-ited by banks with the CNB in fulfilment of a part of their reserve requirements. In addition to banks’ foreign claims, foreign claims of the government sector are also shown. The sources of data are reports from the government and banks.
Item Other investment – Currency and deposits – Liabilities shows the total foreign currency and kuna liabilities of the said sec-tors abroad arising from current accounts, time and notice deposits, sight deposits and demand deposits. The sources of data for this item are reports from banks.
Item International reserves of the CNB is compiled on the basis of the CNB Accounting Department reports which contain data on their balances and changes.

CNB BULLETIN • NUMBER 130 • STATISTICAL SURVEY • INTERNATIONAL ECONOMIC RELATIONS
96
Table H16: International Investment Position – Direct Investmentmillion euros
2001 2002 2003 2004 2005 2006a2007
Q1a Q2b
Direct investment (net) –3,406.0 –4,183.9 –5,181.9 –7,550.8 –10,607.2 –18,921.4 –24,119.5 –26,415.5
1. Abroad 1,008.0 1,606.8 1,626.7 1,563.4 1,729.7 1,831.6 1,895.4 2,190.7
1.1. Equity capital and reinvested earnings 975.0 1,569.1 1,587.0 1,502.3 1,610.4 1,725.0 1,770.6 2,068.6
1.1.1. Claims 975.0 1,569.1 1,587.0 1,502.3 1,610.4 1,725.0 1,770.6 2,068.6
1.1.2. Liabilities 0.0 0.0 0.0 0.0 0.0 0.0 0.0 0.0
1.2. Other capital 33.0 37.7 39.7 61.2 119.3 106.7 124.9 122.2
1.1.1. Claims 43.4 49.9 63.4 89.6 137.9 143.3 165.3 166.9
1.2.2. Liabilities 10.4 12.2 23.7 28.4 18.6 36.6 40.4 44.7
1.3 Financial derivatives (net) 0.0 0.0 0.0 0.0 0.0 0.0 0.0 0.0
2. In Croatia 4,414.0 5,790.8 6,808.6 9,114.2 12,336.9 20,753.1 26,014.9 28,606.2
2.1. Equity capital and reinvested earnings 3,339.4 4,400.6 4,972.7 7,116.4 9,920.6 17,961.3 23,095.4 25,318.4
2.1.1. Claims 0.0 0.0 0.0 0.0 0.0 0.0 0.0 0.0
2.1.2. Liabilities 3,339.4 4,400.6 4,972.7 7,116.4 9,920.6 17,961.3 23,095.4 25,318.4
2.2. Other capital 1,074.7 1,390.2 1,835.9 1,997.8 2,416.3 2,791.8 2,919.5 3,287.9
2.2.1. Claims 0.0 0.3 1.8 19.9 20.1 3.6 5.0 4.4
2.2.2. Liabilities 1,074.7 1,390.5 1,837.7 2,017.7 2,436.4 2,795.4 2,924.5 3,292.3
2.3. Financial derivatives (net) 0.0 0.0 0.0 0.0 0.0 0.0 0.0 0.0a Revised data. b Preliminary data.
Table H17: International Investment Position – Portfolio Investmentmillion euros
2001 2002a 2003a 2004a 2005a 2006a2007
Q1a Q2b
Portfolio investment (net) –4.223.3 –3.511.3 –4.281.2 –4.565.6 –3.393.6 –2.874.1 –2.515.0 –2.517.1
1. Assets 251.1 801.5 599.8 1,334.9 2,136.8 2,575.9 2,873.0 3,243.7
1.1. Equity securities 23.6 30.6 37.4 31.9 481.3 828.1 1,205.8 1,589.7
1.1.1. Banks 7.5 7.4 4.7 5.1 5.9 6.7 7.2 7.5
1.1.2. Other sectors 16.2 23.2 32.6 26.8 475.3 821.4 1,198.6 1,582.2
1.2. Debt securities 227.5 770.9 562.5 1,303.1 1,655.6 1,747.8 1,667.2 1,654.1
2. Liabilities 4,474.5 4,312.8 4,881.0 5,900.5 5,530.4 5,450.0 5,388.0 5,760.8
2.1. Equity securities 144.1 204.1 196.0 407.0 646.5 1,037.5 1,080.4 1,198.2
2.1.1. Banks 40.7 44.5 46.3 64.7 84.0 156.7 182.7 191.0
2.1.2. Other sectors 103.4 159.6 149.6 342.3 562.6 880.8 897.7 1,007.2
2.2. Debt securities 4,330.4 4,108.7 4,685.1 5,493.5 4,883.9 4,412.5 4,307.6 4,562.6
2.2.1. Bonds 4,299.3 4,108.7 4,651.4 5,493.5 4,883.9 4,412.5 4,307.6 4,562.6
2.2.1.1. General government 4,268.2 3,947.6 4,306.6 4,662.4 4,052.1 3,648.2 3,530.3 3,775.1
2.2.1.2. Banks 0.0 0.0 0.0 453.2 456.6 457.9 463.2 468.0
2.2.1.3. Other sectors 31.2 161.2 344.8 377.9 375.3 306.4 314.1 319.6
2.2.2. Money market instruments 31.1 0.0 33.7 0.0 0.0 0.0 0.0 0.0
2.2.2.1. Other sectors 31.1 0.0 33.7 0.0 0.0 0.0 0.0 0.0a Revised data. b Preliminary data.

CNB BULLETIN • NUMBER 130 • STATISTICAL SURVEY • INTERNATIONAL ECONOMIC RELATIONS
97
Table H18: International Investment Position – Other Investmentmillion euros
2001 2002 2003 2004 2005 2006a2007
Q1a Q2b
Other investment (net) –1,908.7 –5,181.7 –8,018.4 –9,936.5 –13,825.1 –17,014.0 –18,169.6 –18,185.0
1. Assets 6,127.9 4,357.4 5,319.0 5,456.9 4,583.7 4,947.9 4,504.3 4,655.2
1.1. Trade credits 249.3 222.5 253.4 221.6 263.0 236.7 225.5 198.8
1.1.1. General government 0.0 0.0 0.0 0.0 0.3 0.1 0.1 0.0
Long-term 0.0 0.0 0.0 0.0 0.3 0.1 0.1 0.0
1.1.2. Other sectors 249.3 222.5 253.4 221.6 262.7 236.6 225.4 198.7
Long-term 243.3 216.3 211.5 181.4 190.6 181.8 184.8 194.3
Short-term 6.0 6.2 41.9 40.2 72.1 54.8 40.6 4.5
1.2. Loans 95.6 108.9 102.1 102.2 146.1 240.4 252.0 253.5
1.2.1. Croatian National Bank 0.7 0.7 0.6 0.6 0.6 0.6 0.6 0.6
Long-term 0.7 0.7 0.6 0.6 0.6 0.6 0.6 0.6
1.2.2. General government 6.1 4.8 5.3 7.0 8.7 9.5 9.0 12.5
Long-term 6.1 4.8 5.3 7.0 8.7 9.5 9.0 12.5
1.2.3. Banks 83.4 97.5 87.1 81.6 113.2 188.9 194.8 191.9
Long-term 58.3 72.9 63.1 62.6 85.3 140.5 158.3 167.2
Short-term 25.1 24.6 23.9 19.0 27.9 48.5 36.5 24.7
1.2.4. Other sectors 5.4 5.9 9.1 13.0 23.6 41.3 47.7 48.5
Long-term 5.4 5.8 9.1 11.7 23.3 41.3 47.6 48.4
Short-term 0.0 0.1 0.0 1.3 0.3 0.1 0.1 0.1
1.3. Currency and deposits 5,782.9 4,026.0 4,963.5 5,133.1 4,174.5 4,470.5 4,026.8 4,202.9
1.3.2. General government 94.7 115.7 81.9 8.9 54.2 26.4 1.4 0.0
1.3.3. Banks 4,438.8 2,754.3 3,806.3 4,164.6 2,958.2 3,332.2 2,897.7 3,087.7
1.3.4. Other sectors 1,249.4 1,156.0 1,075.4 959.7 1,162.1 1,111.9 1,127.7 1,115.2
1.4. Other assets 0.0 0.0 0.0 0.0 0.0 0.4 0.0 0.0
2. Liabilities 8,036.5 9,539.1 13,337.3 15,393.4 18,408.7 21,961.9 22,674.0 22,840.2
2.1. Trade credits 268.4 258.4 179.5 155.1 194.2 181.3 183.5 257.7
2.1.1. General government 1.3 1.1 2.3 2.1 2.6 1.9 1.7 1.5
Long-term 1.3 1.1 2.3 2.1 2.6 1.9 1.7 1.5
Short-term 0.0 0.0 0.0 0.0 0.0 0.0 0.0 0.0
2.1.2. Other sectors 267.1 257.4 177.2 153.0 191.6 179.4 181.8 256.1
Long-term 226.7 209.9 155.0 129.8 163.8 143.4 147.9 223.1
Short-term 40.4 47.5 22.2 23.2 27.8 36.0 33.9 33.0
2.2. Loans 6,722.9 6,981.2 10,027.9 11,578.7 14,035.5 16,833.6 16,902.4 16,846.6
2.2.1. Croatian National Bank 213.8 21.5 363.3 0.0 0.0 0.0 0.0 0.0
o/w: IMF 138.7 0.0 0.0 0.0 0.0 0.0 0.0 0.0
2.2.2. General government 1,672.7 1,950.8 2,260.5 2,590.2 2,990.6 3,018.4 2,983.4 2,962.7
Long-term 1,672.7 1,950.8 2,260.5 2,590.2 2,990.6 3,018.4 2,983.4 2,962.7
Short-term 0.0 0.0 0.0 0.0 0.0 0.0 0.0 0.0
2.2.3. Banks 1,813.5 1,878.7 3,403.0 4,037.3 4,887.5 5,367.7 4,843.9 4,283.9
Long-term 1,810.8 1,878.4 2,798.5 3,517.4 3,822.7 4,217.3 3,830.3 3,439.2
Short-term 2.6 0.3 604.6 519.9 1,064.8 1,150.4 1,013.7 844.6
2.2.4. Other sectors 3,022.9 3,130.1 4,001.0 4,951.3 6,157.3 8,447.5 9,075.1 9,600.0
Long-term 2,969.0 3,103.0 3,933.0 4,852.7 6,017.1 8,205.4 8,641.2 9,139.8
Short-term 53.9 27.2 68.1 98.5 140.2 242.1 434.0 460.2
2.3. Currency and deposits 719.9 1,898.6 2,738.8 3,242.7 3,635.6 4,398.3 5,007.8 5,053.0
2.3.1. Croatian National Bank 1.7 1.7 2.6 2.4 2.6 2.6 2.1 2.3
2.3.2. Banks 718.3 1,896.9 2,736.2 3,240.3 3,632.9 4,395.7 5,005.7 5,050.7
2.4. Other liabilities 325.3 400.9 391.2 417.0 543.5 548.7 580.2 683.0a Revised data. b Preliminary data.

CNB BULLETIN • NUMBER 130 • STATISTICAL SURVEY • GOVERNMENT FINANCE – SELECTED DATA
98
Table I1: Consolidated Central Government According to the Government Levelmillion kuna
2004 2005 20062006
2007
Mar. Jun. Sep. Dec. Jan. Feb. Mar. Apr. May
1. REVENUE (A+B) 87,019.3 92,642.5 100,392.6 7,628.9 8,246.0 8,474.3 9,124.2 8,548.4 8,143.3 8,076.5 10,701.2 9,219.6
A) Budgetary central government 80,463.5 85,653.0 95,234.1 7,356.8 7,864.6 8,052.8 8,362.3 8,250.8 7,797.0 7,800.9 10,345.3 8,757.0
B) Extrabudgetary users 6,555.8 6,989.5 5,158.5 272.0 381.4 421.5 761.9 297.5 346.4 275.6 356.0 462.6
1. Croatian Pension Insurance Administration 129.9 38.0 293.5 0.0 8.4 0.3 181.9 – – – – –
2. Croatian Institute for Health Insurance 663.1 863.9 848.7 75.7 105.8 68.5 97.0 – – – – –
3. Croatian Employment Service 15.5 18.9 18.4 1.4 0.6 0.7 12.1 – – – – –
4. Croatian Waters 1,224.4 1,227.8 1,526.9 61.8 88.6 139.5 270.4 141.9 88.0 161.3 154.7 145.8
5. Fund for Environmental Protection and Energy Efficiency
170.7 214.7 659.8 53.0 39.8 51.4 83.5 38.3 82.3 53.9 53.6 125.4
6. Croatian Motorways Ltd. 2,295.4 2,547.0 1,271.1 71.2 118.2 126.5 92.5 87.7 95.9 54.1 124.2 108.0
7. Croatian Roads Ltd. 1,417.8 1,474.7 64.7 6.8 14.6 2.7 12.6 4.5 4.0 3.3 3.7 3.9
8. State Agency for Deposit Insurance and Bank Rehabilitation
575.9 367.4 409.6 1.5 2.8 4.3 7.4 15.6 73.7 2.4 16.2 78.1
9. Croatian Privatisation Fund 62.9 237.0 65.9 0.6 2.7 27.8 4.6 9.5 2.5 0.6 3.5 1.4
2. EXPENSE (A+B) 86,941.4 92,332.1 98,751.4 8,280.1 7,736.7 7,939.9 10,668.7 7,851.1 8,698.2 8,811.9 8,659.3 8,272.0
A) Budgetary central government 81,861.2 86,715.6 91,979.7 7,806.1 7,158.1 7,373.1 9,568.0 7,477.1 8,336.9 8,481.0 8,270.9 7,804.2
B) Extrabudgetary users 5,080.3 5,616.5 6,771.7 474.0 578.5 566.7 1,100.6 374.0 361.3 331.0 388.4 467.8
1. Croatian Pension Insurance Administration 587.4 382.2 565.9 33.7 39.9 32.1 201.6 – – – – –
2. Croatian Institute for Health Insurance 831.3 914.3 931.6 76.9 87.8 95.6 70.5 – – – – –
3. Croatian Employment Service 141.3 145.9 155.0 12.6 12.5 11.9 14.3 – – – – –
4. Croatian Waters 1,426.3 1,489.5 1,779.1 109.2 150.3 179.0 372.6 142.0 86.4 104.1 103.9 117.4
5. Fund for Environmental Protection and Energy Efficiency
32.4 172.0 734.8 58.0 59.8 78.8 102.5 47.0 74.4 72.9 59.8 102.5
6. Croatian Motorways Ltd. 752.3 1,085.1 1,272.7 85.6 115.7 57.3 181.6 79.1 123.2 72.2 135.7 147.3
7. Croatian Roads Ltd. 934.6 1,062.4 1,226.9 88.0 101.4 103.5 142.9 79.6 70.3 75.6 76.9 92.0
8. State Agency for Deposit Insurance and Bank Rehabilitation
314.5 183.0 27.4 3.3 1.1 1.6 2.9 19.8 1.2 1.1 2.8 2.2
9. Croatian Privatisation Fund 60.1 182.1 78.4 6.7 10.0 6.8 11.7 6.5 5.9 5.0 9.2 6.4
NET/GROSS OPERATING BALANCE (1–2) 77.8 310.3 1,641.2 –651.3 509.3 534.4 –1,544.4 697.3 –554.8 –735.4 2,041.9 947.6
3. CHANGE IN NET WORTH: TRANSACTIONS (3.1.+3.2.–3.3.)
77.8 310.3 1,641.2 –651.3 509.3 534.4 –1,544.4 697.3 –554.8 –735.4 2,041.9 947.6
3.1. CHANGE IN NET ACQUISITION OF NON-FINANCIAL ASSETS
8,373.5 6,699.4 6,108.6 281.2 412.4 459.2 1,061.8 215.8 283.2 412.3 450.4 564.0
Acquisition 8,648.4 7,024.2 6,836.4 351.6 456.2 491.0 1,408.0 420.0 328.7 459.0 484.3 587.9
A) Budgetary central government 1,663.9 1,828.8 1,908.5 93.5 97.9 74.7 556.7 88.5 142.2 101.7 173.2 130.4
B) Extrabudgetary users 6,984.5 5,195.4 4,927.9 258.1 358.4 416.3 851.3 331.5 186.5 357.3 311.1 457.4
Disposals 274.9 324.8 727.7 70.4 43.8 31.8 346.2 204.2 45.5 46.8 33.9 23.8
A) Budgetary central government 244.4 275.1 352.7 32.9 37.5 24.1 44.1 170.3 45.4 32.3 33.3 23.7
B) Extrabudgetary users 30.5 49.6 375.1 37.5 6.3 7.7 302.2 33.8 0.1 14.5 0.6 0.1
NET LENDING/BORROWING (1-2–3.1.) –8,295.6 –6,389.1 –4,467.4 –932.4 96.9 75.2 –2,606.2 481.5 –838.0 –1,147.7 1,591.5 383.6
TRANSACTIONS IN FINANCIAL ASSETS AND LIABILITIES (FINANCING) (3.3.–3.2.)
8,295.6 6,389.1 4,467.4 932.4 –96.9 –75.2 2,606.2 –481.5 838.0 1,147.7 –1,591.5 –383.6
3.2. CHANGE IN NET ACQUISITION OF FINANCIAL ASSETS
28.4 1,609.8 –2,576.7 –352.0 –307.8 –92.1 –3,355.6 –71.4 974.6 –755.0 1,267.8 –5.0
3.2.1. Domestic 18.6 1,614.6 –2,593.4 –352.0 –310.5 –92.1 –3,362.6 –71.4 974.6 –755.0 1,267.8 –10.3
A) Budgetary central government 138.6 1,747.7 –3,063.9 –308.7 –125.1 –218.0 –3,553.8 150.0 981.6 –785.6 1,306.8 –181.7
B) Extrabudgetary users –120.0 –133.1 470.5 –43.3 –185.4 125.9 191.2 –221.4 –6.9 30.6 –39.0 171.4
3.2.2. Foreign 9.8 –4.9 16.7 0.0 2.7 0.0 7.0 0.0 0.0 0.0 0.0 5.3
A) Budgetary central government 9.8 –4.9 16.7 0.0 2.7 0.0 7.0 0.0 0.0 0.0 0.0 5.3
B) Extrabudgetary users 0.0 0.0 0.0 0.0 0.0 0.0 0.0 0.0 0.0 0.0 0.0 0.0
3.2.3. Monetary gold and SDRs 0.0 0.0 0.0 0.0 0.0 0.0 0.0 0.0 0.0 0.0 0.0 0.0
3.3. CHANGE IN NET INCURRENCE OF LIABILITIES
8,324.0 7,998.8 1,890.7 580.5 –404.7 –167.3 –749.4 –552.8 1,812.7 392.6 –323.7 –388.5
3.3.1. Domestic 4,107.7 12,041.7 5,282.8 2,575.9 –276.1 –345.3 –803.0 6.2 1,822.5 472.3 –79.2 –745.5
A) Budgetary central government 4,038.7 10,591.6 3,166.3 2,597.4 –335.5 –539.0 –1,463.0 12.4 1,824.5 277.8 –222.3 –819.2
B) Extrabudgetary users 69.0 1,450.1 2,116.5 –21.5 59.5 193.7 659.9 –6.3 –1.9 194.5 143.2 73.7
3.3.2. Foreign 4,216.3 –4,042.8 –3,392.1 –1,995.4 –128.7 178.0 53.6 –559.0 –9.9 –79.6 –244.5 357.0
A) Budgetary central government 270.3 –5,080.6 –3,943.2 –2,154.5 –127.9 59.3 48.2 –468.5 –9.9 –93.6 –166.3 68.1
B) Extrabudgetary users 3,946.0 1,037.8 551.2 159.1 –0.8 118.6 5.4 –90.5 0.0 14.0 –78.2 288.8
The Notes on Methodology can be found in the Ministry of Finance Monthly Statistical Review.Note: On a cash basis. Source: MoF.

CNB BULLETIN • NUMBER 130 • STATISTICAL SURVEY • GOVERNMENT FINANCE – SELECTED DATA
99
Table I2: Budgetary Central Government Operationsmillion kuna
2004 2005 20062006
2007
Mar. Jun. Sep. Dec. Jan. Feb. Mar. Apr. May
1. REVENUE 80,463.5 85,653.0 95,235.6 7,356.8 7,864.6 8,054.3 8,362.3 8250.84 7,797.1 7,803.2 10,346.8 8,757.8
1.1. Taxes 47,149.9 50,687.6 58,469.1 4,417.1 4,826.4 5,012.9 4,784.4 5020.15 4,495.4 4,502.2 6,813.9 5,315.2
1.2. Social contributions 29,477.6 31,301.3 33,877.1 2,703.8 2,843.8 2,852.6 3,161.9 2891.14 2,921.3 2,929.4 3,117.3 3,069.0
1.3. Grants 10.1 27.5 196.0 1.2 8.5 2.4 155.6 0.98 0.5 10.8 43.1 18.4
1.4. Other revenue 3,825.9 3,636.6 2,693.3 234.7 185.9 186.4 260.4 338.57 379.9 360.7 372.6 355.2
2. EXPENSE 83,131.1 87,857.5 95,950.0 8,047.8 7,463.2 7,742.0 9,981.7 7726.61 8,533.3 8,703.5 8,511.5 8,076.3
2.1. Compensation of employees 22,268.3 23,182.6 24,313.9 1,960.8 1,993.6 2,012.5 2,214.5 2183.45 2,171.8 2,152.2 2,441.1 2,209.9
2.2. Use of goods and services 4,358.7 4,951.9 6,069.1 465.8 390.9 389.9 1,217.5 387.40 541.4 521.9 603.6 494.3
2.3. Consumption of fixed capital 0.0 0.0 0.0 0.0 0.0 0.0 0.0 0.00 0.0 0.0 0.0 0.0
2.4. Interest 3,972.5 4,387.0 4,713.6 803.5 361.1 319.2 413.1 362.48 602.3 715.5 291.8 273.7
2.5. Subsidies 4,968.1 5,248.7 5,670.8 659.5 334.1 382.9 678.6 418.07 652.2 582.6 479.7 436.8
2.6. Grants 3,420.3 3,796.8 6,653.0 371.5 435.0 574.0 924.4 512.56 325.2 379.6 450.5 486.4
2.7. Social benefits 39,730.9 41,358.5 43,444.6 3,497.5 3,545.3 3,653.5 3,928.7 3699.75 3,843.0 4,013.5 3,755.7 3,803.4
2.8. Other expense 4,412.4 4,931.9 5,085.0 289.1 403.4 410.0 604.9 162.89 397.4 338.2 489.1 371.9
3. CHANGE IN NET WORTH: TRANSACTIONS –2,667.6 –2,204.5 –714.4 –690.9 401.4 312.3 –1,619.4 524.23 –736.2 –900.3 1,835.3 681.4
3.1. Change in net acquisition of non-financial assets
1,419.5 1,553.7 1,555.8 60.6 60.4 50.6 512.6 –81.87 96.8 69.5 139.9 106.7
3.1.1. Fixed assets 1,384.6 1,517.0 1,595.1 62.5 70.7 50.8 510.0 66.68 120.3 62.1 133.1 101.5
3.1.2. Inventories 0.0 0.0 –80.2 –3.7 –11.1 –1.7 –18.1 –148.91 –23.6 –1.3 –3.4 1.5
3.1.3. Valuables 7.5 7.2 7.8 1.1 0.3 0.1 2.1 0.09 0.3 0.9 0.9 0.9
3.1.4. Non-produced assets 27.3 29.5 33.1 0.7 0.5 1.4 18.6 0.27 –0.3 7.8 9.2 2.8
3.2. Change in net acquisition of financial assets 222.0 1,752.8 –3,047.2 –308.7 –122.4 –218.0 –3,546.8 150.00 981.6 –785.6 1,306.8 –176.3
3.2.1. Domestic 212.2 1,757.7 –3,063.9 –308.7 –125.1 –218.0 –3,553.8 150.00 981.6 –785.6 1,306.8 –181.7
3.2.2. Foreign 9.8 –4.9 16.7 0.0 2.7 0.0 7.0 0.00 0.0 0.0 0.0 5.3
3.2.3. Monetary gold and SDRs 0.0 0.0 0.0 0.0 0.0 0.0 0.0 0.0 0.0 0.0 0.0 0.0
3.3. Change in net incurrence of liabilities 4,309.0 5,510.9 –777.0 442.8 –463.4 –479.7 –1,414.7 –456.1 1,814.6 184.2 –388.7 –751.1
3.3.1. Domestic 4,038.7 10,591.6 3,166.3 2,597.4 –335.5 –539.0 –1,463.0 12.4 1,824.5 277.8 –222.3 –819.2
3.3.2. Foreign 270.3 –5,080.6 –3,943.2 –2,154.5 –127.9 59.3 48.2 –468.5 –9.9 –93.6 –166.3 68.1
The Notes on Methodology can be found in the Ministry of Finance Monthly Statistical Review.Note: On a cash basis. Source: MoF.

CNB BULLETIN • NUMBER 130 • STATISTICAL SURVEY • GOVERNMENT FINANCE – SELECTED DATA
100
Table I3: Central Government Debtend of period, million kuna
2001Dec.
2002Dec.a
2003Dec.
2004Dec.
2005Dec.*
2006Dec.*
2007
Mar.* Jun.* Jul. Aug.
1. Domestic debt of central government 24,907.3 31,421.5 34,736.4 41,517.0 55,028.8 59,732.5 62,292.6 62,437.5 63,801.0 64,084.6
1.1. Domestic debt of the Republic of Croatia 21,467.9 23,320.0 28,160.8 37,223.7 50,559.5 54,216.7 56,553.6 56,616.2 57,622.1 57,811.7
Treasury bills 4,892.3 5,632.7 6,548.1 9,022.5 12,533.4 12,662.2 13,556.6 12,956.3 12,129.6 12,326.3
Money market instruments 7.4 0.1 0.3 – 0.9 – – – – –
Bonds 15,415.8 15,887.9 17,422.0 23,080.1 30,716.0 34,827.9 37,256.9 36,732.6 36,788.8 36,733.1
Credits from the CNB – 0.5 1.4 3.3 1.4 0.9 – – – 0.8
Credits from banks 1,152.4 1,798.8 4,189.1 5,117.8 7,307.8 6,725.7 5,740.1 6,927.4 8,703.7 8,751.4
1.2. Domestic debt of central government funds 3,439.4 8,101.5 6,575.5 4,293.3 4,469.2 5,515.8 5,739.0 5,821.2 6,179.0 6,272.9
Money market instruments – – – – – – – – – –
Bonds 1,636.1 4,460.7 3,616.4 2,040.1 176.9 253.1 277.1 202.4 160.7 161.0
Credits from banks 1,803.3 3,640.7 2,959.1 2,253.2 4,292.3 5,262.6 5,461.9 5,618.8 6,018.2 6,111.9
2. External debt of central government 43,600.8 43,399.6 49,924.7 55,437.5 51,769.5 48,793.2 47,933.8 49,243.0 47,233.6 47,880.8
2.1. External debt of the Republic of Croatia 39,732.6 37,432.1 41,041.9 42,231.2 36,414.5 32,540.9 31,782.8 31,165.8 29,011.8 29,404.4
Money market instruments – – – – – – – – – –
Bonds 30,984.2 28,719.3 32,115.1 32,919.3 27,020.1 22,836.9 22,204.0 21,950.1 20,031.5 20,249.7
Credits 8,748.4 8,712.8 8,926.8 9,311.9 9,394.5 9,704.0 9,578.8 9,215.6 8,980.2 9,154.7
2.2. External debt of central government funds 3,868.2 5,967.6 8,882.8 13,206.3 15,354.9 16,252.3 16,151.0 18,077.2 18,221.9 18,476.3
Money market instruments – – – – – – – – – –
Bonds 730.1 680.4 816.9 2,846.8 2,866.5 3,903.1 3,845.8 5,756.5 5,767.2 5,787.2
Credits 3,138.1 5,287.2 8,066.0 10,359.5 12,488.4 12,349.2 12,305.2 12,320.7 12,454.7 12,689.1
3. Total (1+2) 68,508.1 74,821.1 84,661.1 96,954.5 106,798.2 108,525.7 110,226.4 111,680.5 111,034.6 111,965.4
Supplement: Central government guaranteed debt
– guarantees for domestic debt 6,025.6 7,528.1 6,895.4 4,642.0 5,345.9 7,312.8 8,216.3 8,106.8 8,031.1 8,112.5
– guarantees for external debt 9,288.7 8,764.6 8,713.0 7,787.7 7,248.8 6,875.1 6,809.1 6,885.7 6,765.5 6,804.5a Irrespective of the note under the heading “Classification and presentation of data on claims and liabilities”, the debt of the Croatian Roads, the Croatian Motorways and the State Agency for Depo-sit Insurance and Bank Rehabilitation, presented in this table under headings 2. External debt of central government and 1. Domestic debt of central government, was reclassified from the subsector Republic of Croatia to the subsector central government funds in December 1998 and December 2002 respectively.
Table I3: Central Government Debt
Data on the central government debt are based on the available data and are not reconciled with the Ministry of Finance of the Re-public of Croatia. The central government debt comprises the do-mestic and external debt. The Ministry of Finance Monthly Statisti-cal Review, Monetary Authorities Accounts and Banks’ Accounts are
the sources of data on the domestic central government debt. The external debt statistics compiled by the CNB is the source of data on the central government external debt. The supplement contains the data on the central government guaranteed debt. Banks are the source of data on domestic debt guarantees, while the external debt statistics compiled by the CNB is the source of data on external debt guarantees.

CNB BULLETIN • NUMBER 130 • STATISTICAL SURVEY • NON-FINANCIAL STATISTICS – SELECTED DATA
101
Table J1: Consumer Price and Producer Price Indices
Year Month
Basic indices, 2005 = 100
Chain indices
Monthly year-on-year indices
Consumer price indices Consumer price indicesaProducer
pricesConsumer price indicesb
Producer pricesTotal Goods Services Total Goods Services Total Goods Services
1994 December .... .... .... 100.2 100.1 100.8 100.2 97.0 95.0 108.1 94.5
1995 December .... .... .... 100.2 100.2 99.8 100.5 103.7 102.4 109.3 101.6
1996 December .... .... .... 100.0 100.2 99.5 100.3 103.4 102.3 108.7 101.5
1997 December .... .... .... 100.7 100.3 102.3 99.9 103.8 102.7 108.2 101.6
1998 December 82.1 84.6 73.7 100.3 100.4 100.0 100.0 105.4 104.3 109.2 97.9
1999 December 85.3 87.2 78.5 100.6 100.8 100.0 100.3 103.9 103.1 106.5 105.9
2000 December 90.0 92.0 82.8 100.4 100.4 100.1 100.2 105.5 105.5 105.5 111.2
2001 December 92.1 93.2 88.5 100.4 100.4 100.5 99.0 102.4 101.3 106.8 96.9
2002 December 93.8 94.2 92.6 100.4 100.6 99.6 99.9 101.8 101.1 104.6 102.3
2003 December 95.4 95.7 94.6 100.3 100.2 100.5 100.0 101.7 101.6 102.2 101.0
2004 December 98.0 98.0 98.0 100.7 100.9 100.2 99.3 102.7 102.5 103.6 104.8
2005 December 101.6 101.4 102.0 100.5 100.5 100.5 99.7 103.6 103.5 104.1 102.7
2006 October 102.9 102.1 105.9 100.0 100.1 99.6 100.0 102.1 101.2 105.1 101.5
November 103.6 102.8 106.1 100.6 100.8 100.2 100.1 102.5 101.9 104.5 101.6
December 103.7 102.8 106.4 100.0 100.0 100.2 100.0 102.0 101.4 104.2 101.9
2007 January 104.0 102.7 107.8 100.3 100.0 101.4 100.8 101.8 100.9 104.4 102.2
February 104.3 102.9 108.5 100.3 100.2 100.6 100.2 101.2 100.4 103.7 101.7
March 104.9 103.8 108.6 100.6 100.8 100.1 100.6 101.8 101.1 103.7 102.0
April 105.7 104.8 108.3 100.7 101.0 99.7 100.4 102.3 101.8 103.5 102.3
May 106.2 105.5 108.1 100.5 100.6 99.9 100.4 102.2 101.9 103.0 102.3
June 105.8 104.9 108.3 99.6 99.4 100.2 100.4 101.9 101.6 102.7 102.9
July 105.1 103.8 109.3 99.4 98.9 100.8 100.2 102.1 101.9 102.8 103.0
August 105.7 104.4 109.9 100.6 100.6 100.5 100.8 102.6 102.6 102.6 103.6
September 107.0 106.4 108.7 101.2 101.9 98.9 100.6 103.9 104.3 102.2 104.5a Data from January 1992 to December 1997 relate to the retail price index. b Data from January 1992 to December 1998 relate to the retail price index.Source: CBS.
Table J1: Consumer Price and Producer Price Indices
The Central Bureau of Statistics (CBS) introduced the consumer price index (CPI) in early 2004. This indicator of price movements was compiled in accordance with the methodological principles laid down by the ILO and Eurostat. In its First Release, issued on 17 February 2004, the CBS published the data on movements in the CPI in January 2004 and the time series for the CPI as of January 2001. The CBS subsequently constructed the time series for the con-
sumer price index encompassing the period from January 1998 to December 2000. As expected following the introduction of the new index, the CBS ceased to publish the retail price index (RPI) and the cost of living index, whose calculation methodologies have not been adequately harmonised with internationally accepted standards. The main features of the CPI are described in the CNB Bulletin No. 91 (see Box 1). The data on the average year-on-year consumer price inflation rate are shown in the Bulletin table on Economic Indica-tors.

CNB BULLETIN • NUMBER 130 • STATISTICAL SURVEY • NON-FINANCIAL STATISTICS – SELECTED DATA
102
Table J2: Core Consumer Price Indices
Year MonthBasic indices, 2005 = 100a
Chain indices
Monthly year-on-year indices
Total Goods Services Total Goods Services Total Goods Services
1998 December 87.3 88.6 80.0 99.9 99.9 100.0 .... .... ....
1999 December 89.8 91.1 82.3 100.1 100.1 100.1 102.9 102.9 103.0
2000 December 92.8 93.9 86.5 100.4 100.4 100.2 103.3 103.0 105.0
2001 December 93.9 94.6 89.8 99.8 99.7 100.3 101.2 100.8 103.8
2002 December 95.0 95.6 91.9 100.0 100.1 99.4 101.2 101.0 102.4
2003 December 96.2 96.4 94.7 100.2 100.1 101.0 101.2 100.9 103.0
2004 December 98.4 98.5 97.4 100.1 100.1 100.4 102.3 102.2 102.9
2005 December 101.3 101.4 101.0 100.1 100.0 100.5 103.0 102.9 103.7
2006 September 103.2 103.1 104.1 100.7 101.1 98.4 102.7 102.6 103.5
October 103.7 103.8 103.2 100.4 100.7 99.1 102.7 102.7 102.6
November 103.8 103.9 103.2 100.1 100.1 100.1 102.5 102.5 102.7
December 103.6 103.6 103.6 99.8 99.7 100.3 102.3 102.2 102.5
2007 January 103.2 103.0 104.3 99.6 99.4 100.7 102.4 102.3 103.0
February 103.5 103.2 104.9 100.2 100.2 100.6 102.3 102.1 103.2
March 104.0 103.7 105.1 100.5 100.5 100.2 102.5 102.2 104.0
April 104.6 104.5 104.9 100.6 100.8 99.9 102.6 102.5 103.5
May 105.4 105.3 105.7 100.7 100.8 100.7 102.8 102.7 103.4
June 105.5 105.2 106.7 100.1 99.9 101.0 102.4 102.2 103.1
July 105.0 104.3 108.9 99.6 99.1 102.1 102.4 102.1 103.4
August 105.6 104.7 110.1 100.6 100.5 101.1 103.0 102.8 104.1
September 106.3 106.1 107.6 100.7 101.3 97.7 103.0 102.9 103.3a Since January 2007, the CPI has been calculated and published by the CBS on the new base 2005 = 100. Source: CBS.
Table J3: Average Monthly Net Wagesin current prices, in kuna
Year Month Nominal amount in kuna Chain indices Monthly year-on-year
indicesCumulative
year-on-year indices
1994 December 1,646.0 119.0 153.4 233.2
1995 December 1,883.0 99.4 114.4 145.7
1996 December 2,217.0 104.4 117.7 111.8
1997 December 2,544.0 100.8 114.8 116.9
1998 December 2,935.0 104.6 115.4 112.8
1999 December 3,262.0 100.9 111.2 114.0
2000 December 3,499.0 99.9 107.3 108.9
2001 December 3,582.0 96.6 102.4 106.5
2002 December 3,839.0 98.0 107.2 105.0
2003 December 4,045.0 99.8 105.4 105.9
2004 December 4,312.0 99.1 106.6 105.9
2005 December 4,473.0 97.3 103.7 104.9
2006 August 4,633.0 101.7 104.9 105.0
September 4,542.0 98.0 104.4 104.9
October 4,585.0 100.9 105.7 105.0
November 4,883.0 106.5 106.3 105.1
December 4,735.0 97.0 105.9 105.2
2007 January 4,739.0 100.1 106.3 106.3
February 4,649.0 98.1 105.6 105.9
March 4,788.0 103.0 104.0 105.3
April 4,750.0 99.2 105.7 105.4
May 4,875.0 102.6 104.0 105.1
June 4,848.0 99.5 104.5 105.0
July 4,855.0 100.1 106.6 105.2
Source: CBS.
Table J2: Core Consumer Price Indices
The core consumer price index is calculated by the Central Bu-reau of Statistics (CBS) in the manner that agricultural products prices and administrative prices (which among others include the prices of electricity and refined petroleum products) are excluded
from the basket of goods and services used in the calculation of the total index. These two groups of products accounted for a total of 30.06% in the basket in 2005 (agricultural products 6.93 percentage points, and administrative products 23.13 percentage points). A total of 111 goods and services are excluded from the coverage of the CPI basket and assigned a zero weight.

CNB BULLETIN • NUMBER 130 • STATISTICAL SURVEY • NON-FINANCIAL STATISTICS – SELECTED DATA
103
Table J4: Consumer Confidence Index, Consumer Expectations Index and Consumer Sentiment Indexindex points, original data
Year Month Composite indices Response indices (I)
Consumer confidence index
Consumer expectations index
Consumer sentiment index I1 I2 I3 I4 I7 I8 I11
1999 October –33.7 –14.9 –46.3 –38.4 –12.1 –49.9 –17.6 35.5 –50.7 –69.7
2000 October –20.9 3.5 –32.2 –26.2 1.2 –22.0 5.7 26.9 –48.3 –63.6
2001 October –27.0 –11.4 –35.6 –29.6 –10.0 –35.9 –12.7 22.9 –41.3 –62.3
2002 October –25.2 –8.3 –29.3 –22.6 –5.1 –31.2 –11.5 20.1 –34.1 –64.0
2003 October –22.2 –4.5 –25.0 –21.5 –2.6 –26.5 –6.4 14.7 –27.1 –65.2
2004 October –23.9 –7.9 –22.0 –19.1 –4.1 –30.5 –11.6 22.5 –16.5 –57.3
2005 December –26.4 –13.7 –25.6 –16.4 –5.9 –34.4 –21.5 27.6 –25.9 –50.6
2006 September –20.9 –6.4 –19.3 –16.6 –2.6 –25.7 –10.2 20.2 –15.5 –50.7
October –19.2 –6.2 –18.8 –11.6 –3.2 –22.7 –9.1 15.0 –22.1 –49.3
November –20.0 –7.6 –18.1 –12.5 –2.3 –21.6 –12.9 15.7 –20.2 –49.0
December –18.9 –4.7 –15.4 –10.9 1.1 –22.4 –10.5 16.9 –12.9 –49.4
2007 January –14.6 –0.5 –15.1 –12.6 1.3 –20.2 –2.2 11.0 –12.5 –46.3
February –15.9 –3.4 –16.5 –13.8 –0.1 –18.6 –6.6 11.5 –17.0 –45.3
March –16.7 –5.0 –17.8 –13.0 –1.4 –21.7 –8.6 9.7 –18.7 –47.2
April –14.5 –1.6 –15.6 –11.7 1.8 –18.9 –4.9 5.6 –16.2 –49.4
May –16.8 –2.2 –18.1 –15.5 0.5 –21.0 –4.8 10.1 –17.7 –52.7
June –15.6 –3.5 –14.2 –12.2 –0.5 –18.0 –6.5 9.3 –12.5 –46.2
July –13.9 0.3 –12.7 –12.3 2.5 –13.8 –2.0 8.3 –11.9 –47.8
August –14.7 –1.6 –13.0 –9.9 0.2 –15.9 –3.4 9.6 –13.2 –45.8
September –17.9 –4.5 –18.6 –14.4 –1.2 –22.0 –7.8 14.4 –19.5 –48.2
October –15.3 –1.0 –15.8 –12.8 1.3 –17.2 –3.2 12.1 –17.3 –47.2
Table J4: Consumer Confidence Index, Consumer Expectations Index and Consumer Sentiment Index
The CNB Consumer Confidence Survey has been carried out regularly since April 1999 in accordance with the methodology of the European Commission, the Joint Harmonised EU Programme of Business and Consumer Surveys. Until April 2005, the CNB con-ducted the survey once a quarter (in January, April, July and Octo-ber). As of May 2005, the CNB carries out the survey in monthly frequency in cooperation with the European Commission, using its technical and financial assistance. The Croatian National Bank bears sole responsibility for the creation and conduct of the survey.
The questionnaire contains 23 questions, examining consumer perception of the changes as regards every-day economic issues. The value of the response index is determined in line with the set meth-odology, based on the responses to the questions from the Consumer Confidence Survey. The movements of three composite indices, con-sumer confidence index (CCI), consumer sentiment index (CSI) and consumer expectations index (CEI), are calculated and monitored based on the value of the response indices. Each of the said com-posite indices is calculated as the arithmetic average of the response indices (I), i.e. as the average of previously quantified responses to individual questions from the survey:
where: r is the value of the response, w is the share of respondents opting for a particular response (weight), i question from the ques-
tionnaire, z is the offered/chosen response, k is the number of offered responses to a particular question.
The value of the said indices ranges –100<Ii<100. Higher in-dex values than those recorded over the previous period point to an increase in expectations (optimism) as regards the specific segment covered by the particular question.
The table shows the values of chosen response indices for the following questions:
I1: How has the financial situation of your household changed over the last 12 months?
I2: How do you expect the financial position of your household to change over the next 12 months?
I3: How do you think the general economic situation in Croatia has changed over the past 12 months?
I4: How do you expect the general economic situation in Croatia to develop over the next 12 months?
I7: How do you expect the number of people unemployed in Croatia to change over the next 12 months?
I8: In view of the general economic situation, do you think now is the right moment for people to make major purchases such as furniture, electrical/electronic devices, etc.?
I11: Over the next 12 months, how likely is it that you will save any money?
The components of composite indices are as follows:CCI: I2, I4, I7×(–1), I11CEI: I2, I4CSI: I1, I3, I8.


CNB BULLETIN • NUMBER 130
105
List of Banks and Savings Banks1 October 2007
Licensed Banks
1. Banco Popolare Croatia d.d., Zagreb 2. Banka Brod d.d., Slavonski Brod 3. Banka Kovanica d.d., Varaždin 4. Banka Splitsko-Dalmatinska d.d., Split 5. Centar banka d.d., Zagreb 6. Credo banka d.d., Split 7. Croatia banka d.d., Zagreb 8. Erste & Steiermärkische Bank d.d., Rijeka 9. Hrvatska poštanska banka d.d., Zagreb10. Hypo Alpe-Adria-Bank d.d., Zagreb11. Imex banka d.d., Split12. Istarska kreditna banka Umag d.d., Umag13. Jadranska banka d.d., Šibenik14. Karlovačka banka d.d., Karlovac15. Kreditna banka Zagreb d.d., Zagreb16. Kvarner banka d.d., Rijeka17. Međimurska banka d.d., Čakovec18. Nava banka d.d., Zagreb19. OTP banka Hrvatska d.d., Zadar20. Partner banka d.d., Zagreb 21. Podravska banka d.d., Koprivnica 22. Primorska banka d.d, Rijeka23. Privredna banka Zagreb d.d., Zagreb24. Raiffeisenbank Austria d.d., Zagreb 25. Samoborska banka d.d., Samobor26. Slatinska banka d.d., Slatina27. Slavonska banka d.d., Osijek28. Société Générale – Splitska banka d.d., Split29. Štedbanka d.d., Zagreb30. Vaba d.d. banka Varaždin, Varaždin31. Veneto banka d.d., Zagreb32. Volksbank d.d., Zagreb33. Zagrebačka banka d.d., Zagreb
Licensed Housing Savings Banks
1. HPB – Stambena štedionica d.d., Zagreb2. PBZ Stambena štedionica d.d., Zagreb3. Prva stambena štedionica d.d., Zagreb4. Raiffeisen stambena štedionica d.d., Zagreb5. Wüstenrot stambena štedionica d.d., Zagreb
Other Licensed Institutions with Full Authorisation
1. Hrvatska banka za obnovu i razvitak, Zagreb
Representative Offices of Foreign Banks
1. Bank für Kärnten und Steiermark AG, Zagreb
2. Commerzbank Aktiengesellschaft, Zagreb3. Deutsche Bank AG, Zagreb4. Komercijalna banka a.d., Zagreb5. LHB Internationale Handelsbank AG, Zagreb6. San Paolo IMI S.p.A., Zagreb7. Union de Banques Arabes et Françaises – UBAF, Zagreb
Banks and Savings Banks Undergoing Bankruptcy Proceedings Date of bankruptcyName of bank/savings bank proceedings initiation
1. Agroobrtnička banka d.d., Zagreb 14/6/2000 2. Alpe Jadran banka d.d., Split 15/5/2002 3. Cibalae banka d.d., Vinkovci 20/10/2000 4. Glumina banka d.d., Zagreb 30/4/1999 5. Gospodarska štedionica d.d., Vrbovec 3/4/2003 6. Gradska banka d.d., Osijek 3/5/1999 7. Hrvatska gospodarska banka d.d., Zagreb 19/4/2000 8. Ilirija banka d.d., Zagreb 6/4/1999 9. Invest štedionica d.o.o., Zagreb 30/6/199910. Komercijalna banka d.d., Zagreb 30/4/199911. Međimurska štedionica d.d., Čakovec 17/3/200412. Neretvansko gospodarska banka d.d., Ploče 10/5/199913. Štedionica Groš banak d.o.o., Zagreb 23/4/200114. Štedionica Mediteran d.o.o., Split 5/12/200115. Trgovačko-turistička banka d.d., Split 8/9/200016. Županjska banka d.d., Županja 3/5/1999
Banks and Savings Banks Undergoing Winding-up Proceedings Date of winding-upName of bank/savings bank proceedings initiation
1. Investicijsko-komercijalna štedionica d.d., Zagreb 31/5/20002. Križevačka banka d.d., Križevci 3/1/20053. Primus banka d.d., Zagreb 23/12/20044. Štedionica Dora d.d., Zagreb 1/1/20025. Štedionica Zlatni vrutak d.d., Zagreb 28/12/2001
Banks and Savings Banks whose License Was Revoked, but Have Not Initiated Winding-up Proceedings Date of revokingName of bank/savings bank operating license
1. Hibis štedionica d.d., Zagreb 7/3/20012. Marvil štedionica d.d., Zagreb 8/6/20013. Zagrebačka štedionica d.d., Zagreb 22/3/2000

CNB BULLETIN • NUMBER 130
106
Management of the Croatian National Bank1 October 2007
Members of the Council of the Croatian National Bank
Chairman of the Council Željko Rohatinski
Members of the Council Boris Cota Davor Holjevac Vlado Leko Branimir Lokin Željko Lovrinčević Relja Martić Adolf Matejka Silvije Orsag Tomislav Presečan Jure Šimović Sandra Švaljek Mladen Vedriš Boris Vujčić
Management of the CNB
Governor Željko Rohatinski Deputy Governor Boris Vujčić Vicegovernor Davor Holjevac Vicegovernor Relja Martić Vicegovernor Adolf Matejka Vicegovernor Tomislav Presečan
Executive Directors
Research and Statistics Area Ljubinko Jankov Central Banking Operation Area Irena Kovačec Foreign Exchange Operations Area Prudential Regulation and Bank Supervision Area Željko Jakuš Planning, Analysis and Accounting Area Diana Jakelić Payment Operations Area Neven Barbaroša Information Technology Area Mario Žgela Support Services Area Boris Ninić International Relations Area Michael Faulend

CNB BULLETIN • NUMBER 130
107
List of Abbreviations and Symbols
bn – billionb.p. – basis pointsBOP – balance of paymentsc.i.f. – cost, insurance and freightCBRD – Croatian Bank for Reconstruction and DevelopmentCBS – Central Bureau of Statistics CCI – consumer confidence indexCDA – Central Depository AgencyCEE – Central East EuropeanCEFTA – Central European Free Trade AgreementCEI – consumer expectations indexCES – Croatian Employment ServiceCM – Croatian MotorwaysCIHI – Croatian Institute for Health InsuranceCLVPS – Croatian Large Value Payment SystemCNB – Croatian National Bankconsump. – consumptionCPF – Croatian Privatisation FundCPI – consumer price indexCPIA – Croatian Pension Insurance AdministrationCR – Croatian RoadsCSI – consumer sentiment indexDAB – State Agency for Deposit Insurance and Bank Rehabilitationdep. – depositDVP – delivery versus paymentECB – European Central BankEFTA – European Free Trade AssociationEMU – European Monetary UnionEPF – Environment Protection FundESI – economic sentiment indexEU – European Unionexcl. – excludingf/c – foreign currency FDI – foreign direct investmentFED – Federal Reserve SystemFina – Financial Agencyf.o.b. – free on boardGDP – gross domestic productGVA – gross value addedHanfa – Croatian Financial Services Supervisory AgencyHICP – harmonised index of consumer pricesIEMP – index of exchange market pressureILO – International Labour Organization
IMF – International Monetary FundIPO – initial public offeringm – millionMIGs – main industrial groupingsMM – monthly maturityMoF – Ministry of FinanceNCS – National Clearing Systemn.e.c. – not elsewhere classifiedOG – Official GazetteR – Republico/w – of whichPPI – producer price indexRTGS – Real-Time Gross SettlementQ – quarterlyRR – reserve requirementSAL – Structural Adjustment LoanSDR – special drawing rightsSITC – Standard International Trade ClassificationZMM – Zagreb Money MarketZSE – Zagreb Stock ExchangeVAT – value added taxWTO – World Trade Organization
Abbreviations for currencies
ATS – Austrian schillingCHF – Swiss francDEM – German markEUR – euroFRF – French francGBP – pound sterlingHRK – Croatian kunaITL – Italian liraJPY – Japanese yenUSD – US dollar
Symbol
– – no entry.... – data not available0 – value is less than 0.5 of the unit of measure being used∅ – averagea, b, c,... – indicates a note beneath the table and figure* – corrected data( ) – incomplete or insufficiently verified data


issn 1331–6028