Embed Size (px)
Citation preview

Public Transportation and theNation’s Economy
A Quantitative Analysis ofPublic Transportation’s Economic Impact
Prepared byCambridge Systematics, Inc.
with
Economic Development Research Group
This study by Cambridge Systematics wasunderwritten by the private sector BusinessMembers of the American Public TransitAssociation, 1201 New York Avenue N.W.,Washington, DC 20005. The findings are thoseof the authors.
October 1999

Public Transportation and the Nation’s Economy
Cambridge Systematics, Inc. i
Table of Contents
Executive Summary ........................................................................................................... E-1Summary of Findings................................................................................................. E-1Why the Study Results are Important....................................................................... E-2How Transportation Investment and Expenditure Affects the Economy.............. E-3Other Economic Benefits ............................................................................................ E-6The Context for Transit Investment and Impact Analysis....................................... E-8
1.0 Analytical Approach.................................................................................................. 1-1Analysis Framework .................................................................................................. 1-1Analysis Tools............................................................................................................. 1-4Impacts Not Included in Analysis............................................................................. 1-9
2.0 Capital Investment Analysis ................................................................................... 2-1Capital Investment Assumptions .............................................................................. 2-1Results ......................................................................................................................... 2-4
3.0 Operating Expenditure Analysis ............................................................................. 3-1Operating Expenditure Assumptions ....................................................................... 3-1Results ......................................................................................................................... 3-3
4.0 Transportation Analysis ........................................................................................... 4-1Determine Current and Future Year Highway Conditions Under a“Base” Case.................................................................................................................. 4-1Estimate the Impact of Capital Spending on Transit Service Levels ...................... 4-3Estimate the Multimodal Impacts of Changes in Transit Service Levels ............... 4-3Estimate Transportation Costs................................................................................... 4-5Estimate the Impacts of Changes in Travel Costs to Business Sales,Employment, and Income.......................................................................................... 4-7
5.0 Fiscal Analysis............................................................................................................ 5-1Collect National Data on Spending and Revenue Generating Patterns ................. 5-1Develop Relationships Between Revenue and Spending Patterns ......................... 5-3Apply the Relationships Developed to the Results of the TransportationScenario ....................................................................................................................... 5-5
6.0 Techniques for Analyzing Economic Impacts at the Regional Level.................. 6-1Introduction ................................................................................................................ 6-1Framing the Issues and Analysis............................................................................... 6-3Analytical Methods and Applications ...................................................................... 6-11Applying the Results of Recent Analyses ................................................................. 6-15Findings from Other Studies ..................................................................................... 6-16
7.0 References................................................................................................................... 7-1

Public Transportation and the Nation's Economy
ii Cambridge Systematics, Inc.
List of Tables
2.1 Maintain Current Service Transit Capital Funding Needs from APTA Study ...... 2-2
2.2 Capital Spending Mix by System Component ......................................................... 2-3
2.3 Capital Spending Mix by REMI Variable Category ................................................. 2-3
2.4 Impacts of Capital Expenditures by Year ................................................................. 2-4
2.5 Industry-Specific Employment Impacts of Transit Capital Investment ................. 2-5
3.1 Operating Expenditure Mix by Object Class ............................................................ 3-2
3.2 Impacts of Operating Expenditures by Year ............................................................ 3-3
3.3 Industry-Specific Employment Impacts of Operating Expenditures ..................... 3-4
4.1 Selected Transportation Model Inputs...................................................................... 4-5
4.2 Shifts in Transit Mode for Selected Cities ................................................................. 4-6
4.3 Transportation Cost Estimates................................................................................... 4-7
4.4 Impacts of a 25 Percent Increase in Capital Expenditures by Year......................... 4-8
4.5 Industry-Specific Employment Impacts of a 25 Percent Increasein Capital Expenditures by Year ............................................................................... 4-9
5.1 Categories of Local and State Government Revenues Used in Analysis ............... 5-2
5.2 Direct Local and State Government Expenditures Used in the Analysis............... 5-2
5.3 Rates Used in Revenue Estimation............................................................................ 5-3
5.4 Factors Determining Taxable Base ............................................................................ 5-4
5.5 Rates Used in Expenditure Estimates ....................................................................... 5-4
5.6 Expenditure Estimates from Transportation Scenario............................................. 5-5
5.7 Revenue Estimates from Transportation Scenario ................................................... 5-6

Public Transportation and the Nation’s Economy
Cambridge Systematics, Inc. iii
List of Figures
E.1 The Multiplier Effect................................................................................................... E-3
E.2 Relationship Between Transportation and Economic Impacts ............................... E-5
E.3 Transportation-Environmental Linkages.................................................................. E-7
1.1 General Framework.................................................................................................... 1-3
1.2 Transportation Economic Modeling Framework..................................................... 1-6
1.3 Model Linkages........................................................................................................... 1-8
3.1 Allocation of Operating Expenditures by Object Class (1985-1995) ....................... 3-2
6.1 Framework for Analyzing the Economic Impacts of Transit .................................. 6-6

Public Transportation and the Nation’s Economy
Cambridge Systematics, Inc. E-1
Executive Summary
n Summary of Findings
This report addresses three objectives:
• Update earlier analyses of the job creation and business revenue impacts of investmentin public transit at the national level using state-of-the art analytical techniques;
• Examine and expand estimates of transit’s economic impacts in other key dimensions;and
• Assess the value to the economy of each dollar invested in transit.
The new analysis reaffirms the significant positive economic impact of transitinvestment on jobs and business revenues and affirms a variety of broader indirectbenefits.
Key Findings
• Transit capital investment is a significant source of job creation. This analysisindicates that in the year following the investment 314 jobs are created for each$10 million invested in transit capital funding.
• Transit operations spending provides a direct infusion to the local economy. Over 570jobs are created for each $10 million invested in the short run.
• Businesses would realize a gain in sales 3 times the public sector investment in transitcapital; a $10 million investment results in a $30 million gain in sales.
• Businesses benefit as well from transit operations spending, with a $32 millionincrease in business sales for each $10 million in transit operations spending.
• The additional economic benefits from the transportation impacts of transitinvestment in major metropolitan areas are substantial. For every $10 million invested,over $15 million is saved in transportation costs to both highway and transit users.These costs include operating costs, fuel costs, and congestion costs.
• Business output and personal income are positively impacted by transit investment,growing rapidly over time. These transportation user impacts create savings to businessoperations, and increase the overall efficiency of the economy, positively affectingbusiness sales and household incomes. A sustained program of transit capital

Public Transportation and the Nation’s Economy
E-2 Cambridge Systematics, Inc.
investment will generate an increase of $2 million in business output and $0.8 million inpersonal income for each $10 million in the short run (during year one). In the long term(during year 20), these benefits increase to $31 million and $18 million for businessoutput and personal income respectively.
• Transit capital and operating investment generates personal income and businessprofits that produce positive fiscal impacts. On average, a typical state/localgovernment could realize a 4 to 16 percent gain in revenues due to the increases in incomeand employment generated by investments in transit.
• Additional economic benefits which would improve the assessment of transit'seconomic impact are difficult to quantify and require a different analytical methodologyfrom that employed in this report. They include "quality of life" benefits, changes inland use, social welfare benefits and reductions in the cost of other public sectorfunctions.
• The findings of this report compliment studies of local economic impacts, which carrya positive message that builds upon the body of evidence that shows transit is a soundpublic investment. Summarized in Section 6.0, local studies have shown benefit/costratios as high as 9 to 1.
n Why the Study Results are Important
The relationship between the strength and competitiveness of the nation’s economy andthe extent, condition and performance of the nation’s transportation system is a topic ofcritical interest. There is mounting evidence that we, as a nation, are severely under-investing in the transportation network that is so vital to our economic interests, and thatwe are paying inadequate attention to the development of transit and other forms ofhigh-capacity surface transportation.
• The economic benefits of transit investment must be clear to compete for limitedresources. Even during a booming economy and times of declining budget deficits,competition for resources is fierce. The substantial economic benefits of transitinvestment and use and the urgency of increased investment in transit andtransportation must be clear and well-documented.
• Transportation is critical to business and personal economic security. Transpor-tation accounts for approximately 17 percent of our Gross Domestic Product, and forAmerican families transportation represents 18 percent of household spending, thesecond largest household expenditure after housing.
• Travel demand and congestion is increasing dramatically. From 1975 to 1995,our nation’s population grew 22 percent. In contrast, registered vehicles increased49 percent and vehicle-miles of travel rose 83 percent. Over this same period, streetand roadway mileage increased by 28 percent.

Public Transportation and the Nation’s Economy
Cambridge Systematics, Inc. E-3
• The cost of congestion is enormous. Time and money lost to households andbusinesses from congestion and delay on our highway system is estimated at $40billion to $100 billion per year and are projected to grow, increasing costs and reducingbusiness profitability and economic competitiveness.
• Environmental and quality of life concerns related to transportation are on therise. The environmental consequences of accommodating increases in motor vehicleuse are imposing increasingly unacceptable costs and constraints on economic growthand development.
• Economic opportunities are being lost for a growing segment of Americans.The high cost and poor quality of transportation links between willing workers, jobs,training and human services reduces individual economic opportunities and access tolabor for business and industry.
• Global economic competitors are investing in transit. Around the world, countriesare investing billions to provide high-capacity passenger transportation systems andservices using state-of-the-art technologies as part of aggressive global economicgrowth strategies.
n How Transportation Investment and Expenditure Affectsthe Economy
Investment in transportation is a fundamental element in the economic strategies beingformulated by local, regional and state officials and community leaders nationwide. Atthe national level, however, there is a continuing, unresolved debate over how much toinvest in transportation generally, and what the balance of investment should be amongmodes.
Direct Dollar Effects and “Multipliers”
In highlighting results from the analysis, it is important to illustrate the fundamentaleconomic relationships that are being measured. Investment in transportation, includingpublic transit, provides economic benefits in several basic ways:
• “Direct” investment supports jobs for the immediate project or activity;
• “Indirect” investment or spending by suppliers whose goods and services are used inthe project or activity also supports jobs;
• Both these investment streams provide business revenue and personal income; and
• Income is spent throughout the economy and supports other jobs and relatedspending, referred to as “induced” impacts.

Public Transportation and the Nation’s Economy
E-4 Cambridge Systematics, Inc.
In combination, direct, indirect and induced spending – the “multiplier effect” –stimulates the economy, resulting in expansion of existing businesses and attraction ofnew businesses.
Figure E.1 The Multiplier Effect
Earlier Studies
In 1984 APTA carried out analyses of the employment and business revenue impacts ofinvestment in public transit.1 The results from these landmark studies demonstrated forthe first time that investment in public transit supports significant job creation andincreases in business revenues at the national, state and local level, creating substantialeconomic benefits in addition to the more obvious mobility benefits provided to ridersand the traveling public.
The analytical techniques used in the current study have been applied by CambridgeSystematics (CSI), Inc., in several major metropolitan areas across the country in recentyears to gauge both regional and state-wide economic benefits of investment in publictransit. In each of these cases, the economic return to both the regions and to the stateswas many times greater than the initial investment. The analyses also showed that thelong-term negative economic impacts of underinvesting were severe. Several of thesestudies, including descriptions of their assumptions and analytical techniques as well astheir results, are summarized in Part 6.0 of this report.
The economic impacts reported in this analysis are derived from the use of a forecastingeconomic and simulation model. This model was validated to 1992 economic conditionsat the national level, thus all monetary impacts are expressed in 1992 dollars. This type of
1 Employment Impacts of Transit Capital Investment and Operating Expenditures. American PublicTransit Association, April 1983. National Impacts of Transit Capital and Operating Expenditures onBusiness Revenues. American Public Transit Association, January 1984.
EconomicStimulation
Businessexpansion
and attraction
InducedImpact
Income spentbroadly in the
economy
IndirectImpact
Investment bysuppliers
DirectImpact
Investment inthe project or
activity

Public Transportation and the Nation’s Economy
Cambridge Systematics, Inc. E-5
model allows the estimation of income, employment impacts, business revenue impacts,generative impacts, and labor cost and tax impacts of investment. It does not provide asummary measurement of all possible benefits to all possible costs which would becalculated from a separate “benefit-cost analysis” procedure.
Transportation Benefits
Increased transit services affect travel patterns in a variety of ways. Changes in travelpatterns, in turn, have consequences for the economy. A vehicle removed from the trafficstream through transit use produces travel time savings for both transit and highwayusers. Savings in fuel cost may be realized as well. These savings have value in dollar oreconomic terms. These impacts reflect real improvements in mobility and access at apersonal, neighborhood and community level.
Intuitively, the fact that businesses and workers have a limited budget of time and dollarsis the driving fact behind understanding the economic impacts of transit investment. Awell-functioning transit system whose operations are well maintained or improved, andin a fully functioning state, saves time and reduces costs related to travel for the millionsof transit and highway users daily. Businesses benefit by devoting less of their resourcesto logistic costs and having access to a relatively larger work force. Lower costs meanthese businesses can offer more competitive products and services in the long run andgrow to benefit themselves and supporting businesses. Figure E.2 presents the flow oftravel benefits to transportation system users resulting from transit capital investment.
Figure E.2 Relationship Between Transportation and Economic Impacts
The economic stimulation brought about by increased personal and business incomeresulting from transit investment and use increases government revenues from increasedsales taxes, income taxes and property taxes.
Economic Stimulation
Business expansion andattraction
Decreased transportation costsDecreased business costsDecreased cost of living
Increased businessproductivity
Lower prices and costs
Decreased travel time
Decreased congestionIncreased safety

Public Transportation and the Nation’s Economy
E-6 Cambridge Systematics, Inc.
n Other Economic Benefits
In addition to the transportation and economic benefits highlighted in Figures E.1 andE.2, there are other benefits that result from increased transit investment and use that aremore difficult to quantify or express in dollar terms. In many cases, we do not knowenough about detailed cause and effect relationships, or about the monetary value ofvarious impacts, to estimate these benefits in the quantitative analytical models beingused. We do know through indirect observation and judgment, however, that there areadditional benefits that have significant economic value. These include:
• Environmental benefits that are difficult to estimate or place a dollar value on;
• Energy impacts that are difficult to put a dollar value on; and
• Reduced costs for a variety of public services that are difficult to estimate.
Figure E.3 illustrates in concept how increased transit investment and use may impactenvironmental quality in broad terms, and how resulting changes in environmental qualityimpact the economy of a region. The figure suggests that:
• Increased transit investment and use will impact travel behavior, construction andbuilding activity, and the organization of land uses and development;
• These effects, in turn, will impact various environmental conditions; and
• Changes in environmental conditions will affect the economic prospects of a region.
While the direction of each impact is predictable – positive or negative, as shown by thearrows in Figure E.3 – the actual numerical change may be difficult to estimate, or thedollar value associated with that change may be difficult to establish. Increased transitinvestment and use has been shown to have positive effects on various aspects ofenvironmental quality, and improved environmental quality has a positive effect on aregion’s economic prospects.
In some cases, these relationships and values can be estimated, but in many cases theycannot. Similar relationships can be illustrated for a variety of impacts wherequantification is difficult.
The estimates of economic benefit emerging from the current study are conservative. Theadded positive economic impacts of factors that have not been incorporated in the formalanalytical procedure represent an additional economic value above and beyond those forwhich estimates have been made. More importantly, the economic impacts of transitinvestment and use are truly national in scope. They run through the entire economyand affect the entire transportation network.

Public Transportation and the Nation’s Economy
Cambridge Systematics, Inc. E-7
Figure E.3 Transportation-Environmental Linkages
Travel Behavior
Stress
Property Value
Health Tax Revenue
Productivity Cost of Care
PavingRequirements
Run Off
Contamination
TreatmentCost
Health
Emissions
Property Damage Stationary SourcesCost of Compliance
Transit Investment/Use
Supporting Policies
(H, B)
Noise
Regional Economic Prospects
Gross Regional Product
Income Profit
Government Fiscal Position
(C)
(B)(H)
(C)(B)
(H)
(C)
(H, B)
(C)
(G)
(B, G)
(H)
(H) (G)
(G)
(H, B) (H, B, C)
(H)
Change in level of activity
Increase in activity/effect
Decrease in activity/effect
H,B,G,C Most pronounced effect(Household/Business/Government/Community)
Well-developed analyticalprocedures

Public Transportation & the Nation’s Economy
E-8 Cambridge Systematics, Inc.
n The Context for Transit Investment and Impact Analysis
The Multiple Missions of Transit in Metropolitan, Small Urban and RuralSettings
Public transit systems are expected or required to pursue missions and goals that are oftencontradictory. Financial constraints force managers to live within limited budgets, while stra-tegic goals call for service expansion and initiatives to increase ridership and market share.
Similarly, communities of varying size have different expectations and goals for transit. Inlarger communities, transit represents one of the few acceptable options available to addcapacity to the regional transportation system during rush hours – when the street andhighway system is at or over capacity. In serving this function, transit is playing a funda-mental role in the provision of transportation capacity essential to sustain economicgrowth and expansion. The economic benefits of transit in this scenario are substantialand relatively easy to estimate.
In smaller urban and rural communities, the role of transit may be fundamentally differ-ent. Transit may play a smaller role in preserving or adding to highway capacity, but alarge role in guaranteeing mobility and access for individuals and households that haveno transportation options. In providing a transportation option, there are clearly economicbenefits accruing to individuals, the community, and local governments as well as busi-ness and industry, but these remain difficult to measure in quantitative terms. Measur-able economic benefits may also be less important in these settings than the moreintangible quality of life benefits afforded by transit. The economic benefit in traditionalterms in small urban and rural areas does not suggest however, that the transit servicesare of less importance than in areas where economic benefits are substantial and can beeasily measured.
Measuring Economic Benefits at the Local and Regional Level
The economic impact of transit investment and use will vary from region to region,because the structure of regional economies varies. For example, the region with a busmanufacturing plant will retain more of its transit investment in the local economy than aregion whose transit vehicles are supplied from another area of the country.
This variability in regional impacts underscores two important points. First, there is a highdegree of economic interdependence between regions and how they serve transit needsand make transit investments. Investments in one region provide direct and indirect eco-nomic stimulus to other regions. Second, this interdependence extends far beyond thelocal and regional transit investment transactions. Substantial transit investment andeconomic benefit in one region of the country is likely to be matched by other, non-transit,federal investments in other regions. In both senses, this economic interdependence at thelocal and regional level indicates that there is a shared interest in promoting economic andsocial well-being in all areas of the country through investment in public transit.

Public Transportation and the Nation’s Economy
Cambridge Systematics, Inc. 1-1
1.0 Analytical Approach
n Analysis Framework
In this study, economic analyses were carried out to evaluate the costs and benefits oftransit investment to the nation’s economy. The study builds upon previous workconducted by the American Public Transit Association (APTA) in the early 1980s and usesanalytical approaches that were not available at that time.1
Types of Investments
The study considered the economic impacts of both capital and operating investmentsaggregated to the national level. Capital investments mainly comprise the “hardware” ofthe nation’s transit systems, their vehicles, maintenance facilities, and in the case of railtransit, track, tunnels and other system components. There are several different types oftransit capital investments, each with a different mix of capital expenditures andsomewhat different economic impacts. These types of investments include:
• New System investments, with expenditures for land acquisition, engineering and allsystem components;
• Modernization, with expenditures for replacement or rehabilitation of systemcomponents at the end of their useful lives; and
• Expansion, with expenditures for additions to existing service. The scope and range ofexpenditures for expansion projects vary greatly.
Historical information was used to determine the appropriate mix of expenditure types ineach of these categories. Allocations of capital expenditures to specific categories weredeveloped for bus, light rail, commuter rail and heavy rail transit. The benefits of acapital investment to any local economy depends in part on the degree to which thematerials consumed are produced locally. In a national study such as this one, benefitsare realized to the extent that the materials consumed are produced domestically.
1 Employment Impacts of Transit Capital Investment and Operating Expenditures. American PublicTransit Association, April 1983. National Impacts of Transit Capital and Operating Expenditures onBusiness Revenues. American Public Transit Association, January 1984.

Public Transportation and the Nation’s Economy
1-2 Cambridge Systematics, Inc.
Typically, operating expenditures include labor, maintenance and supplies. Operatingexpenditures provide direct benefits to the local economy since salaries and wagestypically comprise two-thirds of total operating expenditures.
Range of Impacts Considered
Consistent with previous studies, Public Transportation and the Nation’s Economy describeseconomic impacts in terms of employment generation. In addition, the study examinesimpacts to income and business sales as additional measures of economic gain.Employment figures indicate the growth of an economy, but increasingly, measuresindicating increasing productivity are sought by decision-makers as well. Most directly,business sales place a dollar value on the overall production of the economy, whileincome indicates whether individuals are “better off” than previously. In addition, theyare indirect indicators of productivity change, since an economy that grows in output andwealth is likely to be growing in productivity as well.
Sources of Impacts Considered
This study approached the analysis of economic impacts from two perspectives. First, theinfusion of significant amounts of capital and operating dollars into the economyproduces a demand for goods and services that has direct, indirect and induced effects,which can be measured in terms of jobs, business sales and income. Figure 1.1 portraysthis investment in the analysis framework as the Spending-Economic Linkage. The dollarsinvested in the construction, operation and maintenance of transit services spur jobcreation and other effects because dollars are spent time and time again in the localeconomy. From the perspective of an economist, these impacts are known as transferimpacts – the shifting of dollars from one source to another. Transfer impacts may ormay not produce a net economic gain to society, since it is often difficult to establishwhether or not dollars spent in another fashion – say for education, would yield superioreconomic results. However, from the perspective of a policy-maker, it is important torecognize and be able to articulate transit’s value as a source of economic stimulation.
Second, the study also examined the implications to the transportation system and itsusers of these capital investments and analyzed the economic ramifications of thoseimpacts, in terms of these same indicators – jobs, business sales and income. Figure 1.1depicts this as the Spending-Transportation-Economic Linkage. This linkage is an example ofa generative impact, one which produces net economic growth in the economy. Thegenerative and transfer impacts are described and discussed separately in the report.
The linkage between transportation and economic impacts is an explicit recognition of thefact that increased mobility can produce economic benefits. Conversely, a decrease inmobility places barriers to economic growth and productivity. The transportation costmodels developed for the study produced estimates of congestion impacts resulting fromtransit investment in metropolitan areas in the United States. These congestion impactswere translated into changes in business costs, that result from changes in accessibilityboth for workers and for industries which rely on the transportation system for the

Public Transportation and the Nation’s Economy
Cambridge Systematics, Inc. 1-3
Figure 1.1 General Framework
PROJECTSExpansionNew Starts
ModernizationPURCHASESRight-of-way Equipment
Rolling Stock
Capital Investment
Change in:Modal UsesHighway Travel TimesTravel CostSafety CostsAir Quality
Transportation Impacts
LaborMaintenance
Repairs Supplies
Operations Investment
Economic Impact AnalysisChanges in: Cost of BusinessBusiness DeliveryShippingOn-the Clock Business Travel
Changes in: Employment Business Sales Income
Spending-Economic Linkage
Spending-Transportation-Economic Linkage

Public Transportation and the Nation’s Economy
1-4 Cambridge Systematics, Inc.
provision of the goods and services they offer. Through linkages with the economicmodel used in the study, the changes to business costs create short-term and long-termimpacts to income, business sales and jobs separate and distinct from the jobs createdfrom the cash infusion to the economy.
Analysis Timeframe
The analysis considered the economic impacts of transit from both a short-term and long-term perspective, over a twenty year period, starting in 1998 and ending in 2017.Consideration of multiple year impacts allows for consideration of the cumulativeimpacts of sustained investment and the many interactions and economic adjustmentsthat result.
Use of Baseline and Alternative Scenarios
The transportation and the economic analyses used in this study estimate impacts relativeto a baseline scenario. This scenario represents the status quo, the forecast levels of futureeconomic activity that would occur in the absence of any change in national policy orinvestment activity. These results are held constant throughout the analysis and are usedas a point of comparison against changes in capital and operating expenditures.Developing these scenarios involved the following steps:
• Formulate the Scenario: Determinations were made of which critical variables wouldbe tested and how those variables would be represented in an analytical framework.The scope of the analysis in terms of time frame and range of impacts to consider wasalso determined.
• Data Collection: Data for the inputs of the analysis were gathered from severalsources, including APTA reports on transit funding needs and the Federal TransitAdministration’s National Transit Database.
• Refine/Develop Analysis Tools: The analysis framework described below requiredsome finetuning to ensure that the baseline inputs and assumptions were consistentwith the national-level scale of the analysis.
n Analysis Tools
A series of interrelated models which are appropriate to this study has been adapted andrefined. Cambridge Systematics, Inc., (CSI) has developed an integrated set ofprocedures to apply to evaluation of regional transit investments which incorporatesthree related areas: transportation agency and user models, regional economic models,and air quality models. The transportation and air quality models have been merged byCSI into an integrated model which produces air quality pollutant results and costs, alongwith other impacts such as transit, highway, and multimodal costs and benefits by

Public Transportation and the Nation’s Economy
Cambridge Systematics, Inc. 1-5
category (operating, capital, user travel time, parking, auto ownership, accident, servicequality, etc.).
The technical approach used in carrying out the transportation/economic analysis can bebroadly described as an “integrated transportation/economic model” or approach. Thetechnique was developed by CSI and has been applied at both the regional and state-widescale in recent years to assess the economic impacts of transit investment scenarios.
The CSI/Regional Economic Models Incorporated (REMI) technique used in thetransportation/economic analysis provides both a sound theoretical base for the largescale economic impact analysis of transportation investment, as well as a degree ofsophistication that is appropriate to the scale of the analysis.
The technique allows for estimation of: 1) the economic impacts or value of changes intravel behavior that result from transit investment and use, i.e., value to both transitusers and highway users; and 2) estimates of the direct, indirect and induced effects oftransit investment on the economy as a whole, in addition to the transportation effects.The CSI/REMI framework provides for true multimodal and comprehensive economicanalysis without double-counting and without speculative assumptions about broadereconomic impacts. Figure 1.2 depicts the transportation economic modeling framework.
Economic Model
This study employed a simulation model which estimated the effects of changes in costs tobusiness competitiveness, profitability and expansion. The model system, REMI, hasmany features which provide a strong theoretical basis for its use:
• It is a dynamic model, as it simulates interactions among sectors of the economy on ayear by year basis.
• It does not assume a constant relationship between labor and capital inputs, as doinput/output models. It estimates substitutions among factors of production inresponse to changes in relative factor costs.
• It has several feedback mechanisms. Changes in transportation costs among thescenarios being analyzed impact each industry sector and households, causingdifferences in costs and in competitiveness of industries. In response, business salesincrease or decrease, and household income increases or decreases. The REMI modelin each year estimates the consumption, investment, and local government demandwhich are driven by income. The national model predicts exports and imports to othercountries depending on the success of its industries, which is dependent on prices. Incontrast, I/O models do not simulate the tendency of the economy to adjust tochanging demand and supply conditions towards a balance, or equilibrium betweenthe two.
In Public Transportation and the Nation’s Economy, economic inputs have been defined tomodel the overall economic consequences of several “direct economic effects”:

Public Transportation and the Nation’s Economy
1-6 Cambridge Systematics, Inc.
Figure 1.2 Transportation Economic Modeling Framework
• Travel Change Factor Relative to Base Case• Transit Service Changes Relative to Base Case• Capital Budget• Operating Budget
TransportationModel Alternative Cases
Cost of Service Changes
• In-Vehicle Travel Time• Walk/ Wait Tim e• Passenger Comfort
Highway VMT Impacts
Changes inTransportation Costs
Highway User Impacts
• Congestion Effects• Fuel Cost Impacts• Parking Cost Impacts
Transit User Impacts
• Travel Time Costs• Out-of-Pocket Costs• Quality of Services
Transit Utility Impacts
• Capital Cost Impacts• Operating Cost Impacts• Subsidy Changes
Economic Model
Changes in Economy
Purchasing Power Changes Transit Utility Impacts
• Capital Cost Impacts• Operating Cost Impacts• Subsidy Changes
Emissions Impacts
• NWHC • CO• NOx • PM10
Change in Taxes
Changes in Disposable Income
Changes in Employmentand Population
Fiscal ImpactModel Changes in Fiscal Position

Public Transportation and the Nation’s Economy
Cambridge Systematics, Inc. 1-7
• Construction and Operation – additional spending associated with project construc-tion and maintenance, generating “demand” (i.e., purchases) of labor, equipment andmaterials for selected years; and
• Direct Travel Costs – reduction in business costs associated with worker time, safetyand expense savings for business-related travel including freight flows via trucks, aswell as “on-the-clock” and commuting travel via car and bus; plus any increase inpersonal disposable income associated with household savings on fuel and vehiclemaintenance.
Together, these direct effects lead to “secondary effects” on the economy, in terms ofbusiness sales (output), employment and income. They include:
• Indirect Economic Effects result from additional business sales (and associated jobsand income) generated by orders for products (materials, supplies, equipment andservices) needed to serve the directly expanded or attracted business activities; and
• Induced Economic Effects result from additional business sales (and associated jobsand income) which are generated by consumer spending of workers at directly orindirectly attracted businesses. This spending is dispersed throughout the economy,on food, clothing, shelter, recreation, education and personal services.
The REMI economic simulation model is used to estimate the total (including indirect andinduced) economic effects associated with given changes in the flow of dollars – spending(demand), income levels and business sales, as well as the broader impacts on regionalcosts, competitiveness, productivity, profitability and population changes over time.
Direct effects of policy changes are input into REMI through a large set of policyvariables. Industry-specific variables are input for each of 49 specific nonfarm industries,cohort-specific variables for 202 age-sex cohorts, and final demand variables for 25 finaldemand sectors.
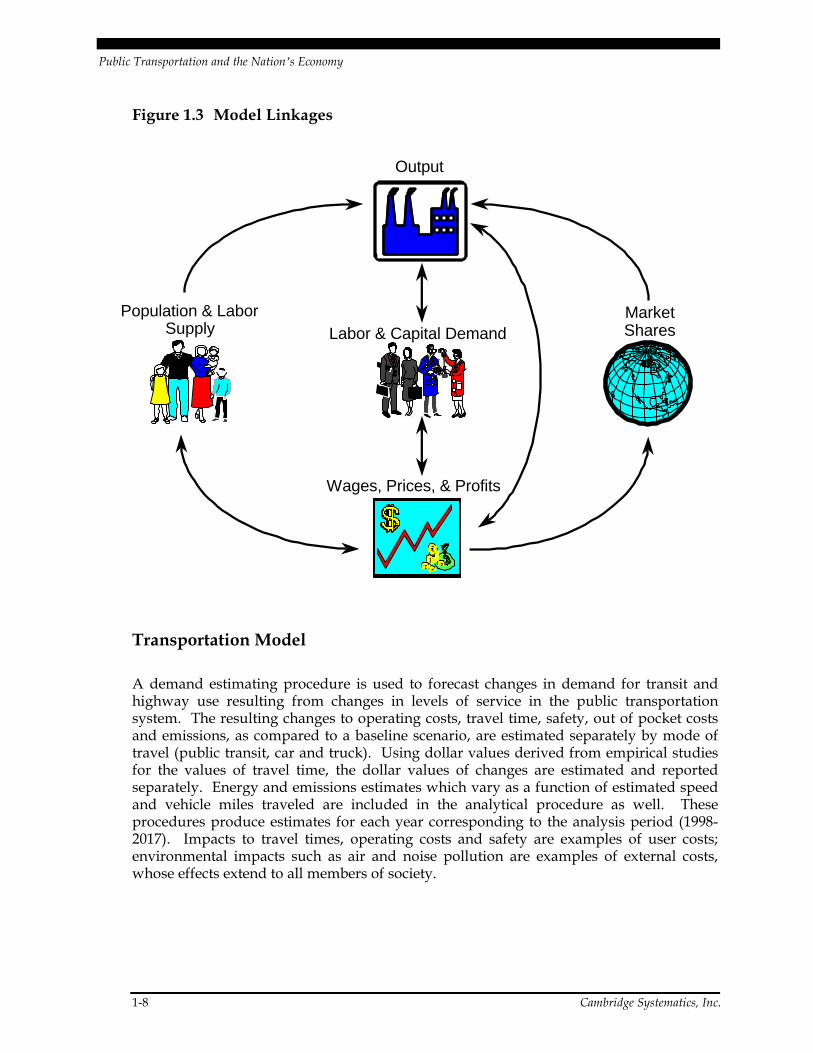
In operation, REMI simulates economic activities in five sectors: 1) output; 2) labor andcapital demand; 3) population and labor supply; 4) wage, price and profit; and 5) marketshares. Figure 1.3 illustrates the linkages among these models. The transportationprojects affect the model in the following ways:
• In the output module, transit spending affects government spending patterns;
• In the output module, transportation cost savings for individuals affects realdisposable income levels;
• In the wage/price/profit module, cost savings for business affect overall productioncosts (i.e., cost of doing business); and
• In the market shares module, the changes in business cost and individual income leadto changes in regional competitiveness and business market shares. Although notedhere, this linkage does not occur in a model that simulates economic activity at thenational level.
Public Transportation and the Nation’s Economy
1-8 Cambridge Systematics, Inc.
Figure 1.3 Model Linkages
Transportation Model
A demand estimating procedure is used to forecast changes in demand for transit andhighway use resulting from changes in levels of service in the public transportationsystem. The resulting changes to operating costs, travel time, safety, out of pocket costsand emissions, as compared to a baseline scenario, are estimated separately by mode oftravel (public transit, car and truck). Using dollar values derived from empirical studiesfor the values of travel time, the dollar values of changes are estimated and reportedseparately. Energy and emissions estimates which vary as a function of estimated speedand vehicle miles traveled are included in the analytical procedure as well. Theseprocedures produce estimates for each year corresponding to the analysis period (1998-2017). Impacts to travel times, operating costs and safety are examples of user costs;environmental impacts such as air and noise pollution are examples of external costs,whose effects extend to all members of society.
Output
MarketSharesLabor & Capital Demand
Population & LaborSupply
Wages, Prices, & Profits

Public Transportation and the Nation’s Economy
Cambridge Systematics, Inc. 1-9
n Impacts Not Included in Analysis
Though the framework for analysis in this study is broader and more inclusive than prioranalytical approaches have allowed, the results are still conservative, since manyimportant economic impacts of transit investment and use are not incorporated into themodel. In some cases, quantifying these impacts is very difficult and the subject ofcontinued research. In others, the effort involved would be beyond the scope of thisanalysis. Other research efforts have attempted to enumerate many of these addedeconomic benefits, including:
• Added benefits which accrue only to the transit-dependent population, including low-income, elderly and disabled populations. These are examples of social welfarebenefits whose monetization is the subject of continued study.
• Changes in land values due to the increased accessibility afforded by high-qualitytransit services. Numerous studies in large metropolitan areas have shown a positivecorrelation between proximity to rail service and property values, although themagnitude of the increase varies from study to study. Land values are generally notconsidered in studies of this type, as any travel time savings from transit investmentpresumably capture the accessibility benefits. Adding travel time savings and landvalue increases together would likely double-count benefits.
• “Quality of life” benefits, including amenities such as recreational and culturalopportunities, absence of crime or quality of education that make an area an attractiveone to live in. Attempts to quantify and measure these impacts have occurred at theregional level. The aggregate nature of the analysis did not permit for such a variableto be considered here.
• Benefits from increased reliability in the transit system due to system rehabilitationand modernization. A reliable system experiences fewer breakdowns andmalfunctions, and instills confidence that a trip can be made within the time budgetedby travelers. Some studies have indicated that travelers are willing to pay 1.3 timesthe hourly wage rate for increased reliability in their work commutes, as measured bythe variability of travel time for their trip.
• The effect of transit investment and use in reducing the cost of other public sectorfunctions, such as education, healthcare, welfare or public safety.

Public Transportation and the Nation’s Economy
Cambridge Systematics, Inc. 2-1
2.0 Capital Investment Analysis
Transit capital investment is a significant source of job creation. This analysis indicatesthat in the short run 314 jobs are created for each $10 million invested in transit capitalfunding. Businesses would realize a gain in sales 3 times the public sector investment intransit capital; a $10 million investment results in a $30 million gain in sales. Thesefindings are based on the application of an economic simulation model to estimate theimpacts of needs-level funding over 20 years.
In this study, the employment impacts of two types of capital investments across fourvehicle modes were analyzed using the economic model. The capital investmentcategories are:
• New System investments, with expenditures for land acquisition, engineering and allsystem components;
• Modernization, with expenditures for replacement or rehabilitation of systemcomponents at the end of their useful lives; and
• Expansion, with expenditures for additions to existing service. The scope and range ofexpenditures for expansion projects vary greatly.
New project and modernization expenditures were allocated among heavy rail, light rail,commuter rail and motor bus. These modes are fundamentally different in the types andmagnitudes of expenditures they require, and thus will affect the economy in differentways, depending on the amount of labor required to produce the goods or servicesneeded. For example, commuter rail typically operates on existing rights-of-way and at-grade, while heavy rail operates on its own dedicated right-of-way, sometimesunderground. One would expect that the funds needed for construction in heavy railprojects generate somewhat greater employment impacts per dollar expended sinceconstruction is labor-intensive. These categories of capital expenditures were formulatedto arrive at the most accurate investment totals possible, and not to compare theemployment generating capabilities of various modes.
n Capital Investment Assumptions
The analysis assumed a 20-year program of capital expenditures consistent with theresults of APTA’s Transit Funding Needs 1995-2004, conducted in 1993 and released in1994. In that survey, transit providers were asked to provide their best estimates offuture needs under both a maintain current service scenario, and an expand current servicescenario. The results of the maintain current service scenario were used in this study.Table 2.1 shows the results of the study in annual needs over two five-year periods, 1995-

Public Transportation and the Nation’s Economy
2-2 Cambridge Systematics, Inc.
1999 and 2000-2004. Annual needs are considerably higher in the first five-year period($10.5 billions vs. $7.0 billion) due to a backlog of unfunded and planned projects whichthe respondents listed as necessary to maintain current levels of service. To extend theanalysis over a 20-year period, the annual average for the 10 years’ needs as reported bythe APTA needs study was used for years 11 to 20.
Table 2.1 Maintain Current Service Transit Capital Funding Needs fromAPTA Study (Millions of Constant 1993 Dollars)
1995-1999 2000-2004 Ten Year TotalAssumed SecondTen-Year Period
Annual $10,480.5 $7,043.4 $8,761.9 $8,761.9Total $52,403.4 $35,217.2 $87,619.4 $87,619.4
Source: Transit Funding Needs, 1995-2004, American Public Transit Association.
Allocation of Capital Expenditures
The allocation of capital funding dollars to specific categories of funding was based onspecific project experience from data collected by the Federal Transit Administration(FTA).
Light rail construction data were derived from the 1991 Urban Mass TransportationAdministration report Light Rail Transit Capital Cost Study. The study collected “as built”cost data from seven light rail systems in the United States: San Diego, Buffalo, Portland,Sacramento, San Jose, Los Angeles, and Pittsburgh. Average expenditures for all systemscited in the study were aggregated to nine categories of spending for this study.
New heavy rail (rapid rail and commuter rail) and bus data were derived from the 1994FTA report, Fixed Guideway Capital Costs: Heavy Rail and Busway/HOV Lane. Capital costdata from completed projects in seven cities – Atlanta, Baltimore, Boston, Chicago, LosAngeles, Miami, and Washington, D.C. were collected and summarized. Averages of allsystems were used for this study, since it did not appear that any one project wassignificantly more or less representative of national experience than any other.
Rail modernization project information was derived from the 1992 FTA reportModernization of the Nation’s Rail Transit Systems: A Status Report. This study is an updateof a 1984 study which estimated costs to bring heavy rail systems in thirteen majormetropolitan areas to a state of good repair. Cost estimates by major system componentwere provided.
The cost break outs are shown in Table 2.2. Note that these figures represent nationalaverages collected over several years and are not representative of any one particulartransit project.

Public Transportation and the Nation’s Economy
Cambridge Systematics, Inc. 2-3
Table 2.2 Capital Spending Mix by System Component(As a Percentage of Total Expenditures)
CategoryNew
Heavy RailNew
Light RailRail
ModernizationBus
Purchases
Vehicles 9.5 12.7 16.7 100Guideway (Structure andEarthwork) 22.7 18.0 22.7Stations (Construction) 23.5 5.7 17.4Yards and Shops (RepairFacility Construction) 3.0 5.2 8.3Tracks 2.6 2.3 8.5Electric and ControlSystems 8.3 10.8 26.5Utility Relocations 3.0 8.2 N/ALand Acquisition (ROW) 5.0 7.3 N/AEngineering andManagement 22.4 29.8 N/A
Total 100 100 100 100
In the economic analysis, the products and services that are required to develop thetransit projects for the study must be identified, and the level of expenditures specified.The REMI economic model provides for entry of these expenditures via a general set ofgoods and services categories, which are then translated into specific products by themodel. This feature was utilized in this analysis. The categories of expenditures used inthis analysis and the allocation by categories are shown in Table 2.3 below:
Table 2.3 Capital Spending Mix by REMI Variable Category(As a Percentage of Total Expenditures)
New ModernizationREMI
Variable MeaningHeavy Rail
LightRail Bus
HeavyRail
LightRail
PVID38 Guideway construction 22.70% 18.00% 21.60% 7.40%PVID59 Rolled steel product 2.60% 2.30% 5.20% 23.40%PVID41 Maint & repair bldg 3.00% 5.20% 27.30% 31.00%PVID86 Industrial electrical equip 8.30% 10.80% 19.10% 6.30%PVID29 Station building 23.50% 5.70%PVID313 Vehicles 9.50% 12.70% 100.00% 17.10% 25.40%PVID210 Engineering 22.40% 29.80%DEM673 Construction work 3.00% 8.20%DEM691 Maint./repair service 9.60% 6.60%
Total* 95.00% 92.70% 100.00% 90.30% 93.50%* Totals may not add up to 100% primarily due to exclusion of Right-of-Way spending which is a transfer of dollars, not a
source of new economic activity.

Public Transportation and the Nation’s Economy
2-4 Cambridge Systematics, Inc.
n Results
Table 2.4 below presents the employment and business output impacts of a sustainednational program of transit capital funding to maintain current condition needs.
In the short term, an investment of $10 billion produces over 314,000 jobs, or over 3,100jobs for every $100 million invested. As Table 2.5 shows, the majority of these jobs arecreated in the services and construction sectors, with the former accounting for 32 percentand the latter accounting for 18 percent of all new jobs. Business output, or total profits,generated from all activity generated by the investment reaches $30.3 billion in the firstyear, for a return three times greater than the investment.
Indirect and induced employment generation account for the majority of short-termemployment impacts. Indirect employment accounts for 132,000 jobs or 42 percent of thetotal, as local suppliers benefit from the increase in demand for their goods and services.Induced demand accounts for 77,000 jobs or 24 percent of the total. Direct employmentgeneration accounts for another 24 percent of the total. The remainder – attributable toinvestment activity (10 percent) accrues to employment generating activities which arenot produced by static input/output models.
In the long term, the return on investment remains positive, diminishing significantlyhowever. A $7.3 billion investment in the year 2017 produces over 86,000 jobs, or 1,177jobs for every $100 million invested. As was the case in the short term, the sectorsshowing the greatest gains are the services and construction sectors. Business output, ortotal profits, generated by the investment reaches $12.5 billion in year twenty, for a return1.7 times the investment.
In contrast to the short-term impacts, direct effects account for the majority of long-termemployment impacts. Direct employment accounts for 45,000 jobs or 52 percent of year20 impacts. Indirect job creation accounts for 46 percent of the total, while inducedimpacts produce only 2,400 jobs, 2.7 percent of the total.
Table 2.4 Impacts of Capital Expenditures by Year1
1998 2005 2012 2017Employment(Thousands) 316.2 115.1 93.9 86.3Business Output($1992 Billions) 30.3 13.7 13.0 12.5Investment Level($1992 Billions) 10.09 6.99 7.33 7.33
Jobs per $100Million 3,135 1,648 1,281 1,177
1 Amounts shown in Table 2.1.

Public Transportation and the Nation’s Economy
Cambridge Systematics, Inc. 2-5
Table 2.5 Industry-Specific Employment Impacts of Transit CapitalInvestment (Jobs in Thousands)
Sector 1998 2005 2012 2017
Manufacturing 61.1 21.1 14.6 12.0Durables 47.4 17.4 12.3 10.1
Non-Durables 13.7 3.7 2.3 1.9Non-Manufacturing 255.1 94.0 79.2 74.3
Mining 1.9 0.5 0.3 0.2Construction 57.4 27.4 25.6 24.9
Transport and Public Utility 14.7 4.8 3.3 2.7FIRE 13.9 2.8 1.5 1.2
Retail Trade 48.7 10.9 7.0 6.0Wholesale Trade 15.5 4.9 3.4 2.8
Services 100.4 42.1 37.6 36.1Agriculture/Forestry/Fishing 2.7 0.7 0.5 0.5
Total 316.2 115.1 93.9 86.3
The declining rates of return over time reflect the economy’s need to balance employmentwith the available supply. The initial market response to an increase in demand for laboris to increase wages. Businesses respond to this upward pressure on wages in a numberof ways, including investing in equipment and machinery as a substitute for labor.Capital is substituted for labor such that costs are minimized and profits maximized.This ability to substitute capital for labor varies by industry. Attaining a balance betweenthe supply and demand for labor is a fundamental concept in macroeconomic theory, andis embedded in REMI’s algorithmic structure.
Is it realistic to expect that the impacts per unit investment will decrease due to animbalance between the supply of and demand for labor? Some people point to the lack ofinflation over the past 15 years as a reason to believe that numerous adjustmentmechanisms exist to keep wages from rising to the point where capital is substituted forlabor. Such mechanisms might include:
• Changes in the labor force participation rate. More individuals, mostly women, havesought employment, thus increasing the supply of labor;
• Shifts in workers’ part-time to full-time status; and
• Immigration policy, which can affect the supply of low or highly-skilled labor.
These trends are not reflected in the REMI model. Thus, the equilibrium-seekingbehavior of the REMI model may overstate the drop in employment to some extent.

Public Transportation and the Nation’s Economy
2-6 Cambridge Systematics, Inc.
The REMI model also adjusts employment forecasts based on projections of technologicaladvances. The transit capital investment industry has traditionally produced many jobsdue to the labor-intensive nature of the work involved. Advances in manufacturing andconstruction techniques may indeed change the number of jobs per dollar invested overtime, as the model indicates.

Public Transportation and the Nation’s Economy
Cambridge Systematics, Inc. 3-1
3.0 Operating ExpenditureAnalysis
Transit operations spending provides a direct infusion to the local economy. Over 570jobs are created for each $10 million invested in the short run. Operating expendituresgenerate a significant number of local jobs directly, as all maintenance and operatingfunctions are performed by the local labor force. The estimation of the employmenteffects of transit operating expenditures was based on the results of economicsimulations.
The analysis of operating expenditure impacts focused on employment generation andbusiness sales potential on a national basis. Businesses realize a $32 million increase inbusiness sales for each $10 million in operations spending.
n Operating Expenditure Assumptions
As was the case with Capital Investment assumptions, APTA’s Transit Funding Needs1995-2004 provided input data on aggregate levels of operating expenditures for thisstudy. The survey found annual transit operating needs at $20.9 billion over 10 years. Inthis analysis, operating expenditures were assumed to hold steady at that rate over years11 to 20. Historical levels of operating expenditures varied between $22 billion and$25 billion between 1985 and 1995, when adjusted for inflation.
Allocation of Operating Expenditures
In this analysis, it was assumed that a dollar spent for operations and maintenance wouldproduce the same employment and business sales impacts for any transit mode. It wasfelt that this simplifying assumption would not seriously distort the results in a nationalstudy examining all transit expenditures.
Figure 3.1 presents the distribution of operating expenditures by “object class” between1985 and 1995. Labor costs account for over 71 percent of all operating expenditures, byfar the greatest category of expense among operating expenditures. Labor’s share of totaloperating expenses changed little between 1985 and 1995, showing no discernable trendeither upward or downward.

Public Transportation and the Nation’s Economy
3-2 Cambridge Systematics, Inc.
The funding allocations derived from APTA’s analysis of historical expenditure patternstranslates almost directly into variable definitions used by the economic model. Table 3.1below shows the variables used and the allocations of total expenditures. All variablesare expressed in millions of dollars, with the exception of the transit employmentvariable, EMP 26. That variable is expressed in terms of full-time equivalentemployment. An equivalent annual salary of $33,900 dollars ($1992) was assumed as theaverage salary among all transit workers nationally, and was used to arrive at the totalnumber of employees used. The distribution of the operating budget among the objectclasses was assumed to remain constant over the 20-year timeframe of the study.
Table 3.1 Operating Expenditure Mix by Object Class (As a Percentage ofTotal Expenditures)
REMI Variable Meaning Percentage
EMP26 Transit On-Site Labor 71.40DEM669 Fuel 3.00DEM656 Materials and Parts 7.10DEM680 Utilities 3.80DEM696 Professional Services 4.80DEM682 Insurance 4.10DEM676 Miscellaneous Transportation 7.10
Figure 3.1 Allocation of Operating Expenditures by Object Class (1985-1995)
Salaries and Wages46%
Fringe Benefits
25%
Materials and Supplies
7%
Services5%
Fuels and Lubricants
3%
Other6%Utilities
4%
Casualty and Liability Loss
4%
Source: American Public Transit Association.

Public Transportation and the Nation’s Economy
Cambridge Systematics, Inc. 3-3
n Results
In the short-term, an investment of $20.9 billion produces over 1,192 million jobs, or over5,700 jobs for every $100 million invested. Business sales generated by operatingexpenditures total over $66 billion in the first year, three times greater than theinvestment. These results are shown in Table 3.2. As Table 3.3 shows, direct labor in thetransit industry comprises almost 50 percent of the jobs created. Jobs in the retail tradeand services sectors, stimulated by the demand created by the transportation jobs,account for 30 percent of the total.
In the operating expenditure analysis, direct employment generation accounts for50 percent of short-term employment impacts as most jobs created are directly related totransit operations. Indirect employment accounts for 257,625 jobs or 22 percent of thetotal, as local suppliers benefit from the increase in demand for their goods and services.Induced demand accounts for 246,375 jobs or 21 percent of the total. Eight percent oftotal job creation is attributable to increases in investment activities.
Table 3.2 Impacts of Operating Expenditures by Year
1998 2005 2012 2017
Employment(Thousands) 1,192.3 775.6 671.6 645.6Business Output(1992 Billions) 66.0 37.2 32.7 32.3Investment Level(1992 Billions) 20.9 20.9 20.9 20.9
Jobs per $100 Million 5,703.0 3,711.0 3,213.4 3,089.0

Public Transportation and the Nation’s Economy
3-4 Cambridge Systematics, Inc.
Table 3.3 Industry-Specific Employment Impacts of Operating Expenditures(Jobs in Thousands)
Sector 1998 2005 2012 2017
Manufacturing 94.3 24.5 7.8 3.4Durables 61.4 15.6 5.2 2.6
Non-Durables 32.9 8.9 2.5 0.8Non-Manufacturing 1,098.0 751.1 663.9 642.4
Mining 6.3 2.8 1.7 1.2Construction 62.1 14.0 5.6 4.5
Transport and Public Utility 594.1 582.8 576.0 573.8FIRE 56.5 26.1 16.2 12.7
Retail Trade 137.8 40.6 18.3 13.3Wholesale Trade 31.3 9.5 2.6 0.7
Services 203.0 73.4 42.6 35.6Agriculture/Forestry/Fishing 7.0 1.9 1.0 0.8
Total 1,192.3 775.6 671.6 645.8
In the long term, the return on investment remains positive, but is reduced to almost halfthe level in the first year. As discussed in the section on capital investments above, thereasons for the diminishing returns relates to long term economic adjustments thatreduce the need for indirect and induced jobs in the retail and service sectors. A$7.3 billion investment in the year 2017 produces over 574 million jobs, over 2,400 jobs forevery $100 million expended. Job creation in the transit industry assumes an even greaterproportion of total job creation, 89 percent of the total. Induced and indirect employmentimpacts are almost negligible, accounting for only nine percent of the total. Businesssales or total profits generated by the investment, reach $31.8 billion in year 20, for areturn 1.5 times the investment.

Public Transportation and the Nation’s Economy
Cambridge Systematics, Inc. 4-1
4.0 Transportation Analysis
The additional economic benefits from the transportation impacts of transit investmentin major metropolitan areas are substantial. For every $10 million invested, over$15 million is saved in transportation costs to both highway and transit users. Thesecosts include operating costs, fuel costs and congestion costs.
Business output and personal income are positively impacted by transit investments,growing rapidly over time. These transportation user impacts create savings to businessoperations, and increase the overall efficiency of the economy, positively affectingbusiness sales and household incomes. A sustained program of capital investment willgenerate an increase of $2 million in business output and $0.8 million in personal incomefor each $10 million in the short run (during year one). In the long term (during year 20),these benefits increase to $31 million and $18 million for business output and personalincome respectively.
The analysis of the benefits of transit investment to the nation’s economy focused on thebenefits of a shift in mode from automobile travel to transit caused by changes in servicelevels from increased capital spending. In order to develop these estimates, the followingsteps were followed:
• Determine current and future year highway conditions under a “base” case;• Estimate the impact of capital spending on transit service levels;• Estimate the multimodal impacts of changes in transit service levels;• Estimate transportation costs; and• Estimate the impacts to business sales, employment and income of changes in travel
costs to businesses and individuals.
Each of these steps is described in turn below.
n Determine Current and Future Year Highway ConditionsUnder a “Base” Case
The scope of the transportation analysis was limited to urban areas with significantcongestion levels. Current and future year data needed for the analysis included twotasks:
• Estimate the number of auto and transit travelers in the urban area; and
• Estimate the level of congestion in the urban area.

Public Transportation and the Nation’s Economy
4-2 Cambridge Systematics, Inc.
Current year congestion levels were derived from the Texas Transportation Institute’s(TTI) annual estimates of urban roadway congestion in 50 or more urban areasnationwide. The TTI congestion estimates are based on data available from the HighwayPerformance Monitoring System (HPMS). The HPMS database includes statistics onhighway condition, extent and usage. Each state submits HPMS data to the FederalHighway Administration (FHWA) annually according to prescribed reporting guidelines.The data are used to develop numerous reports, including submissions to Congress onhighway funding needs. The congestion estimates developed by TTI are based on averagevolume to capacity ratios weighted by vehicle miles traveled for interstate facilities andarterial roadways. Congestion levels greater than 1.0 are an indicator of significantcongestion, especially during peak hours.
Several sources of data were used to estimate the total number of auto and transit trips inthe 50 urbanized areas analyzed in the study. From the FHWA 1990 Nationwide PersonalTravel Survey (NPTS), an average trip length for all trips was applied to vehicle mile oftravel estimates (VMT) provided by TTI for each area, in the case of highway trips.Estimates of passenger transit trips were derived from the Federal TransitAdministration’s National Transit Database for these urbanized areas. That databasereports unlinked trips, that is, each transfer is counted as a separate trip. An assumptionof 1.5 transfers per trip was applied to the FTA data, to arrive at a definition of a trip ascomprising travel from door to door with no intermediate stops.
Estimates for future levels of congestion in the base scenario were produced by theHighway Economic Requirements System (HERS). HERS is a decision support systemdesigned to analyze the effects of alternative funding levels on highway performance.HERS uses data describing an extensive sample of the nation’s highway system as thebasis for analyses of the benefits and costs of alternative improvements. HERS is used bythe U.S. Department of Transportation (U.S. DOT) to perform financial programminganalyses used in U.S. DOT’s biennial report to Congress: Status of the Nation’s Highway andTransit System: Condition and Performance. Cambridge Systematics, Inc., is one of thecreators of the HERS, and is currently under contract with U.S. DOT to design andimplement enhancements to the model. HERS is capable of estimating the cost of highwayimprovements based on the user’s specification of the desired levels of performance. Inorder to use HERS to arrive at future baseline levels of congestion, a desired highway“level of service” must be specified.
The levels of service specified in this analysis were based upon data contained in theU.S. DOT's 1995 Condition and Performance report. That report compared the model’sestimates of projected funding needs to achieve a status quo level of service as againstcurrent funding levels. Current funding levels amount to 60 percent of the needsprojected by the model. Therefore, the HERS model was set to produce the highwayconditions that would result if current funding levels were maintained into the future, thatis, at the 60 percent of-projected-needs level.
Highway trips were calculated exactly as they were for the base year estimates, based onVMT and an assumed trip length of nine miles. Transit trips were held constant to baseyear levels, a conservative estimate.

Public Transportation and the Nation’s Economy
Cambridge Systematics, Inc. 4-3
n Estimate the Impact of Capital Spending on Transit ServiceLevels
In order to arrive at a relationship between capital spending and benefits to the transituser, a simple estimate of dollars per unit travel time was developed. This estimate wasproduced to develop a rough estimate of the relationship between spending levels andlevels of transit service provided. Averages of capital expenditures for two periods in time(adjusted to reflect 1992 dollars), 1985 and 1995, were calculated for each of 33 urbanizedareas (where data were available for the two time periods) used in the TTI study, based onNational Transit Database data. System-wide speeds for these urban areas were comparedbetween these two time periods as well. Next, average capital expenditures and traveltime differences weighted by passenger miles of travel were calculated. The result – $82thousand per minute of travel time improvement per urban area – was used in the nextstage of the capital investment impact analysis to predict impacts after 20 years of capitalinvestment.
Behind the estimate of dollars per minute of time savings lies an important assumption.The analysis assumes that all time savings came as a result of sustained investment insystem modernization, replacement and other forms of investment. While the investmentin better and more reliable equipment and implementation of higher-speed technologiesundoubtedly had a large part in producing these historical overall improvements, othercauses may have contributed as well. For example, better personnel management andsystem management, route-restructuring and other operations-oriented actions may haveplayed a role in overall speed gains. However, in the sketch-level nature of the exercise,obtaining reasonable correlations between variables as proxies for unambiguous cause andeffect relationships was the focus of the analysis.
n Estimate the Multimodal Impacts of Changes in TransitService Levels
To convert dollars per minute saved into actual transit time savings, a capital fundinglevel was assumed. A 25 percent increase over the investment levels cited in the needsanalysis was chosen as the basis for estimating the multimodal transportation impacts oftransit investment. Average transit times for each of the 50 urban areas were adjusted toreflect the assumed change in capital investment. Travel time savings were scaled up ordown based on historical levels of funding.
The model used for the analysis is an adaptation of the Sketch Planning Analysis Model(SPASM) developed for the Federal Highway Administration by CSI. This model wasderived from work originally conducted for a project to assess the economic benefits ofpublic transportation renewal in the Philadelphia and New York regions. The trans-portation model is a simplified version of a regional transportation model, and producesimpact estimates on the basis of intra-regional travel patterns. The estimates of publictransportation system travel times resulting from changes in investment levels alter therelative attractiveness of the transit mode relative to the highway mode in the model, and

Public Transportation and the Nation’s Economy
4-4 Cambridge Systematics, Inc.
changes in demand for each mode are estimated based on these changes. Changes inmode are estimated via an adaptation of the multinomial pivot-point logit modeldeveloped by the Federal Highway Administration for use in sketch-level planningapplications. Once new demand for highway and transit travel is estimated, highwaytravel times are estimated using equations relating volumes on highway networks to delayon the highway system. These equations, which account for the buildup and dissipationof traffic queues under congested conditions, were developed for the Federal HighwayAdministrations’ HERS model by CSI. These highway times are used as the basis for anew set of demand estimates. This procedure is repeated until the difference between oneiteration and the next is negligible. Once this process is completed, final user and externalcosts are estimated for the two modes.
The transportation model used in Public Transportation and the Nation’s Economy estimateschanges in transportation costs including:
• Direct user costs, incurred as a result in travel time changes, or as a result of changes inout-of-pocket expenses for travel, including fuel use. These costs are estimated in termsof on-the-clock costs (work-related travel), off-the-clock costs and other travel costs forwork and non-work purposes; and
• External costs, including changes in accident costs and emissions.
Input Assumptions
The magnitude of economic impacts of capital investment is greatly affected by the unitcost assumptions used in the transportation analysis. This section presents the valuesassumed for the most critical variables used in the transportation cost analysis:
User costs for travel time include both in-vehicle and out of vehicle time. A value of$10.00 per hour is assigned to transit and highway users, which is the figure used in thisanalysis. This figure is based on average local wages and the proportion of travel that iswork-related (on-the-clock and commuting) and non-work related. The value of mediumand heavy truck travel is a proportional factoring of the figure used by the HERS. The$39.42 figure for the heaviest trucks is consistent with the $10 per hour figure used forauto and light truck users.
Excess, or out-of-vehicle, time includes time spent walking and waiting. Such times aretypically valued at 1.5 to 2.0 times the value of in-vehicle time. In this study, highway andtransit excess times are valued at $15 per hour. This is a very conservative estimate, at thelow range of the values of excess travel times compared to the values of in-vehicle traveltimes.

Public Transportation and the Nation’s Economy
Cambridge Systematics, Inc. 4-5
Table 4.1 Selected Transportation Model Inputs
Value of Travel Time($ per person-hour) Auto Truck Carpool Bus Rail
In-Vehicle Time $10.00 $39.00 $10.00 $10.00 $10.00
Excess Time 15.00 39.00 15.00 15.00 15.00
Fuel Cost per Gallon ($) 1.25 1.25 1.25 0 0
Non-Fuel User Cost Per Vehicle Mile ($) 0.034 0.1 0.034 0 0
Out-of-Pocket Costs per Trip 0 0 0 1.00 1.75
External Costs (excluding emissions) ($)
Per Vehicle Mile $0.07 $0.1 $0.07 $0 $0
Emissions Costs (all vehicles) per ton
HC $1,615
CO $3,540
NOX $3,397
Out-of-pocket costs per trip include expenditures for tolls, transit fares and parking. Inthis analysis no costs for parking or tolls was assumed, since the vast majority of highwayusers nationally pay nothing for parking or tolls. For transit fares, an average transit fareper rail trip of $1.75 and per bus trip of $1.00 were derived from statistics contained in theFederal Transit Administration’s National Transit Database.
Non-fuel user costs comprise the costs of depreciation, insurance and maintenance. Thesefigures were derived from the FHWA report Estimating the Impacts of TransportationAlternatives.
External costs include safety and the costs of vehicle emissions, and are presentedseparately in Table 4.1 above. Safety costs vary with vehicle miles traveled, whileemissions costs per ton are applied to vehicle miles traveled and emissions rates that varywith speed. Cost assumptions for the analysis were derived from the FHWA reportEstimating the Impacts of Transportation Alternatives.

Public Transportation and the Nation’s Economy
4-6 Cambridge Systematics, Inc.
n Estimate Transportation Costs
Transit and Highway Trips
Changes in mode of travel were based on these changes in travel times and the originalnumber of highway and transit trips. Although the percentage of trips which changemodes in the analysis is modest – less than two percent when all urban areas areconsidered – urban areas with relatively high congestion levels tend to be affected most bythe shifts. Table 4.2 below presents shifts in transit modes for a selected number of urbanareas. Transit riders in New York City show the largest single shift in ridership among theurban areas studied.
Table 4.2 Shifts in Transit Mode for Selected Cities
Percent Changein Modal Trips
Number of PeakHour Trips Affected
per Day
New York 7.7 195,217Baltimore 1.7 1,626Houston 4.1 23,269Dallas 3.9 15,196Minneapolis/St. Paul 2.6 16,137
Transportation Cost Estimates
The average annual increase over "maintain current service" funding needs, assuming a25 percent increase in funding over 20 years is $2.04 billion. The actual totals for each yearare based on the APTA Transit Funding Needs 1995-2004 report. Additional investment inyears 1-5 are based on the $10.5 billion figure, and years 6-10 based on the $7.1 billionestimate. An annual investment of $7.6 billion was used for years 11-20, based on theassumption that some system replacement and rehabilitation would necessitateexpenditures above the year 6-10 level. Annual funding assumptions were factored by25 percent to arrive at the funding increment for each year.
User costs savings for transit users amount to $29.6 billion over 20 years, as shown inTable 4.3. Highway users gain as well, as the decreased travel times cause a shift in tripsfrom the highway to the transit mode. This shift causes a decrease in congestion belowwhat would have occurred in the base case condition. Highway user benefits total$33.9 billion over the 20-year period. In total, transportation user benefits equal$15.5 million for every $10 million in additional capital expenditures.
External costs, including emissions and safety costs, amount to $11.2 billion over the20-year period. Emissions costs are presented as a transportation cost but are not used bythe economic model because their impacts are dispersed across both transportation users

Public Transportation and the Nation’s Economy
Cambridge Systematics, Inc. 4-7
and non-users. The economic analysis in this study is focused on impacts to the users ofthe nation’s transportation system.
Over the 20-year analysis period, transportation savings are projected to total over$74.6 billion, as against an investment of $40.9 billion. Thus the analysis shows a positivebenefit cost ratio of 1.8 when transportation effects only are considered. In addition toresults for the 20-year period, impacts for selected years are shown in Table 4.3 as well.
Table 4.3 Transportation Cost Estimates
Name Units 20-Year Total 1998 2005 2017
Capital Investment $ millions 40,946 2,411 1,620 1,751Chg. User Costs - Hwys $ millions -33,883 -149 -1,333 -5,754Chg. User Costs - Transit $ millions -29,599 -160 -1,194 -4,451Chg. Pollution/External Costs $ millions -11,159 -58 -448 -1,723Chg. Total User Benefits $ millions 74,641 367 2,975 11,927Chg. Pnger. Trips - Hwys Millions -3,662 -21 -149 -537Chg. Pnger. Trips - Transit Millions 3,930 22 159 581Chg. Pnger. Minutes - Hwys Millions -155,964 -685 -6,134 -26,486Chg. Pnger. Minutes - Transit Millions -153,689 -831 -6,200 -23,142
n Estimate the Impacts to Business Sales, Employment andIncome to Businesses and Individuals
The economic impact analysis, based on transportation costs, proceeded along the samelines as the capital investment and operating cost analysis. Transportation costs, with theexception of air quality impacts, were translated into REMI variables for use by the model.For business costs, this translation is based upon the degree to which transportationservices are used in the production or distribution of goods for the industry in question.The percentages which were used to allocate transportation costs for industry sectorsrepresented in the REMI model used for this study were derived from the U.S. Censustransportation satellite accounts and other data from the Bureau of Economic Analysis.
Shipping costs, on-the-clock costs and commuting savings (or costs) are all represented inthe REMI model as business costs. The corresponding REMI variable, COSPOL, accountsfor increasing costs to business of producing goods or providing services for each industrysector. The analysis assumes that increased on-the-clock costs and shipping costs arepassed directly to businesses. Commuter travel costs are not fully passed on tobusinesses, however. This analysis assumes that 50 percent of the change in commutertravel costs are passed on to the employer who must offer higher wages to compensate.Recent research on wage gradients (the change in wages with respect to distance from thecity center) suggests that employers do compensate for longer commuter travel times byoffering higher wages. The remainder of the commuting costs are represented asreductions in household purchasing power.

Public Transportation and the Nation’s Economy
4-8 Cambridge Systematics, Inc.

Public Transportation and the Nation’s Economy
Cambridge Systematics, Inc. 4-9
Results of Transportation-Economic Analysis
In the short term, the impacts to the economy of an increase in transit investment based onreduced transportation costs only, are modest. This is because the transportation impactsgrow steadily over time. That is to say, the cumulative effects of increased capitalspending cause transit travel times to improve steadily over time. Highway timesdecrease as well, leading to increasing business cost benefits. In year one, only 5,800 jobsare created, and business sales register a modest $0.5 billion as shown in Table 4.4.Incomes rise as well, but only by $0.2 billion.
Table 4.4 Impacts of a 25 Percent Increase in Capital Expenditures by Year
1998 2005 2012 2017Employment(Thousands) 5.8 31.7 48.4 57.9Business Output($1992 Billions) 0.5 2.8 4.5 5.6Investment Level($1992 Billions) 2.5 1.6 1.6 1.8Income($1992 Billions) 0.2 1.4 2.5 3.3
Impacts per $10 million of InvestmentBusiness Output $2.0 $17.5 $28.2 $31.1Personal Income $0.8 $8.8 $15.6 $18.3
In the long-term, the return on investment based on transportation impacts alone ispositive and significant, substantially greater than in the short-term. By year 20,employment gains reach 58,000. Forty-five percent of this gain is realized by the servicesector, which includes delivery services; another two percent is gained in the retail sector.Industry specific employment impacts are shown on Table 4.5. Business sales top$5.6 billion, more than three times greater than the additional $1.8 billion invested thatyear. Personal income registers a modest gain as well, over $3.3 billion in year 20.
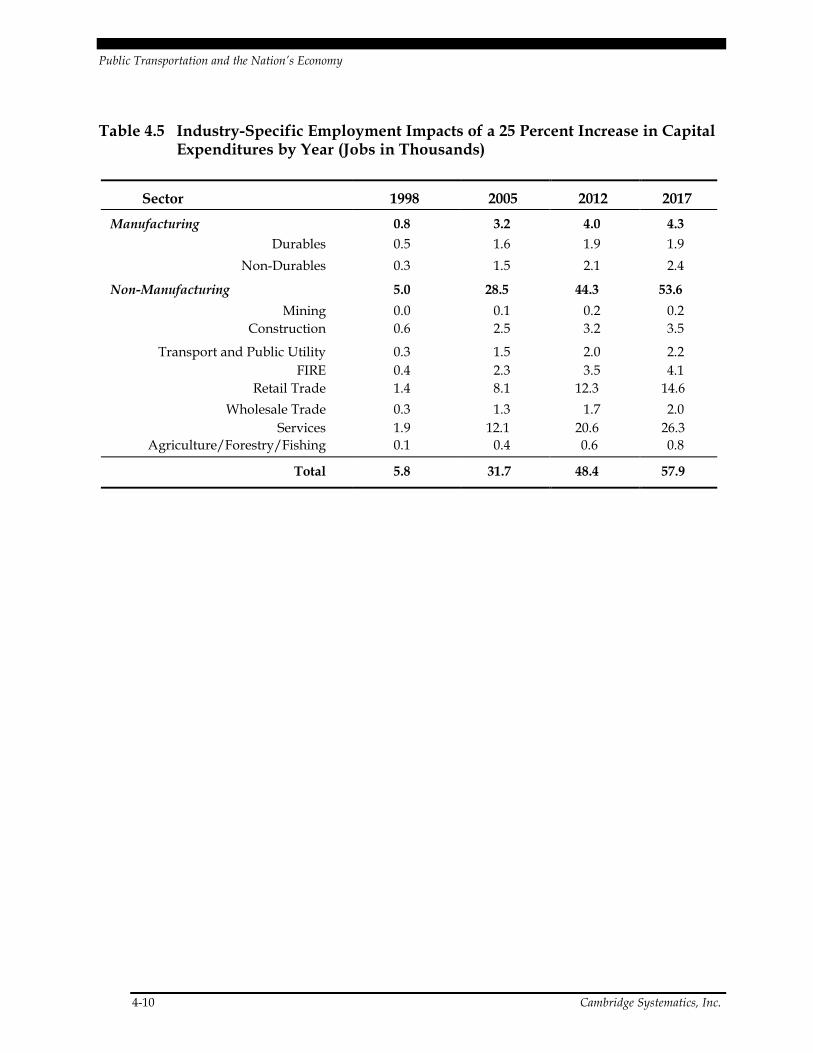
Public Transportation and the Nation’s Economy
4-10 Cambridge Systematics, Inc.
Table 4.5 Industry-Specific Employment Impacts of a 25 Percent Increase in CapitalExpenditures by Year (Jobs in Thousands)
Sector 1998 2005 2012 2017Manufacturing 0.8 3.2 4.0 4.3
Durables 0.5 1.6 1.9 1.9Non-Durables 0.3 1.5 2.1 2.4
Non-Manufacturing 5.0 28.5 44.3 53.6Mining 0.0 0.1 0.2 0.2
Construction 0.6 2.5 3.2 3.5Transport and Public Utility 0.3 1.5 2.0 2.2
FIRE 0.4 2.3 3.5 4.1Retail Trade 1.4 8.1 12.3 14.6
Wholesale Trade 0.3 1.3 1.7 2.0Services 1.9 12.1 20.6 26.3
Agriculture/Forestry/Fishing 0.1 0.4 0.6 0.8
Total 5.8 31.7 48.4 57.9

Public Transportation and the Nation’s Economy
Cambridge Systematics, Inc. 5-1
5.0 Fiscal Analysis
Transit capital and operating investments generate personal income and business profitsthat produce positive fiscal impacts. On average, a typical state/local government couldrealize a four to 16 percent gain in revenues due to the increases in income andemployment generated by investments in transit. For this study, a simple fiscal model toillustrate the linkage between transit investment and fiscal outcomes was developed andapplied.
The fiscal analysis described in this section demonstrates that local/state government canrealize tangible fiscal benefits from transit capital investment. The approach taken forthis analysis was to adapt national data on spending patterns and revenue generation tothe results of the transportation analysis, described in the previous chapter. As such, thefiscal impacts estimated are illustrative of the revenue-generating potential of transit insupport of a growing community.
The fiscal impact analysis comprised several steps:
• Collect national data on spending and revenue-generating patterns;
• Develop relationships between national revenue spending patterns and the inputs ofthe transportation/economic analysis; and
• Apply the relationships developed to the results of the transportation scenario.
n Collect National Data on Spending and Revenue-Generating Patterns
Data pertaining to aggregate local and state expenditures and revenues were gatheredfrom readily available sources, including the U.S. Statistical Abstract. When state andlocal revenue sources are considered together, four sources account for over two-thirds ofthe total dollars collected: property taxes, general sales taxes and specific taxes imposedon goods such as tobacco products and motor fuel, various charges and fees andintergovernmental transfers. Consistent with this sketch-level analysis, the variousrevenue sources were combined into seven general categories: Personal income tax,corporate income tax, sales tax, gross receipts (from taxes charged for certain goods),property tax, intergovernmental revenue and fees, charges and miscellaneous. In thislatter category, consisting of many ‘small’ fees and charges from various sources, thelargest single item is the insurance trust revenue, which alone accounts for over12 percent of all revenues generated. Likewise, available expenditure categories from thenational data were collapsed to six: General government, public safety, welfare, publichealth, education and transportation. Among these categories, general government is the

Public Transportation and the Nation’s Economy
5-2 Cambridge Systematics, Inc.
single largest, accounting for over 40 percent of all expenditures. General governmentincludes parks and recreation, bond payments and water treatment facilities and servicesand many other small categories. The next largest expenditure is education. Together,expenditures for education and general government services account for over 70 percentof the total.
Table 5.1 Categories of Local and State Government Revenues Used inAnalysis
Revenue Category(in $ millions)
Total State Local Percent
Income Tax $128,810 $117,128 $ 11,682 9.7%Corporate Tax 28,319 25,692 2,627 2.1Sales Tax 149,040 123,006 26,034 11.2Gross Receipts 74,588 62,865 11,723 5.6Property Tax 197,140 8,386 188,754 14.8Inter-government Revenue (a) 215,445 240,518 242,027 16.2Fees, Charges and Miscellaneous $538,100 $300,107 $237,993 40.4
Total $1,331,442 $841,702 $720,840 100%
(a) Total Equals net of transfers between state and local governments.Source: Statistical Abstract of the United States, 1997.
Table 5.2 Direct Local and State Government Expenditures Used in theAnalysis
Expenditure Category(in $ millions)
Total State Local Percent
General Government $ 467,991 $189,737 $278,254 37.1%Public Safety 87,038 26,591 60,447 6.9Welfare 179,829 148,244 31,585 14.3Public Health 100,430 46,996 53,434 8.0Education 353,287 94,896 258,391 28.0Transportation 72,067 43,812 28,255 5.7Total $1,260,642 $550,276 $710,366 100.0%
Source: Statistical Abstract of the United States, 1997.

Public Transportation and the Nation’s Economy
Cambridge Systematics, Inc. 5-3
n Develop Relationships Between Revenue and SpendingPatterns
The economic model produces estimates of changes to business sales, income andemployment. In order to use the results of the economic model in the fiscal analysis,relationships between changes in the economic variables and those used in the fiscalanalysis must be developed.
Tables 5.3 through 5.5 present these relationships. Where there is not a directcorrespondence between a result from the economic model and the variables used in thefiscal analysis, intermediate rates or factors were developed. For example, to generateestimates of sales tax revenues, a factor converting income to retail purchases, retail salesportion of personal income, was developed. The sources for these factors are the StatisticalAbstract of the United States (1997) and the County and City Data Book (1994).
The rates and factors developed were validated against the national-level data. Wherenecessary, the rates were adjusted slightly to obtain a reasonable match against thenational data.
The relationships between economic and fiscal outcomes developed reflect nationaltrends, consistent with the national scope of the overall analysis. Since governmentexpenditures and revenue generation vary greatly from one community to another, therates and factors presented here can be considered illustrative, rather than representativeof any one particular community.
Table 5.3 Rates Used In Revenue Estimation
Rate REMI Variable UsedState Revenue (Basis) Income Tax (Percent of Personal Income) 4.51% Income Corporate Taxes (Percent of Net Corporate Income) 4.63% Business Sales Sales Tax (Percent of retail sales receipts) 4.87% Business Sales and Income Gross Receipts (Percent of Personal Income) 1.09% Income Residential Property Tax Rate (Percent of Assessed Value) 2.18% Employment Commercial Property Taxes (per employee) $101 Employment Fees, Charges and Miscellaneous (per capita) $1,145 Employment Other Taxes & Fees (per capita) $568 EmploymentLocal/County Revenue (Basis) Income or Wage Tax (Percent of Personal Income) 0.20% Income Corporate Taxes (Percent of Net Corporate Income) 0.47% Business Sales Residential Property Tax Rate (Percent of Assessed Value) 2.53% Employment Commercial Property Tax (per employee) $101 Employment Sales Tax (Percent of retail sales receipts) 1.03% Personal Income & Business
Sales Gross Receipts 0.20% Employment Fees, Charges and Miscellaneous (per capita) $908 Employment Intergovernmental Revenue (per capita) $822 Employment

Public Transportation and the Nation’s Economy
5-4 Cambridge Systematics, Inc.
Table 5.4 Factors Determining Taxable Base
Description Factor Conversion Taxable Personal Income/Total Personal Income 45.09% Income to Income Tax Taxable Corp. Income/Total Business Sales 5.55% Business Sales to Income Tax Retail Sales Portion of Personal Income 38.65% Income to Sales Tax Retail Sales Portion of Business Sales 3.00% Business Sales to Sales Tax Percentage of Property Value Assessed (local) 57% Employees to Residential
Property Tax Percentage of Property Value Assessed (state) 3% Employees to Residential
Property Tax Avg. Assessed Taxable Value (per household) $118,000 Employees to Residential
Property Tax Avg. Change in Population Change in Employment 2.07 Per Capita Calculations Percentage of Employees Owning Home 0.57 Employment to Residential
Property Tax
Table 5.5 Rates Used in Expenditure Estimates
Rate REMI Variable
State Expenditures ($1,000’s) General Government (per capita) $1,152 Employment Public Safety (per capita) $102 Employment Welfare (per capita) $569 Employment Public Health (per capita) $180 Employment Education (per capita) $364 Employment Transportation (per capita) $170 EmploymentLocal/County Expenditures ($1,000’s) General Government (per capita) $663 Employment Public Safety (per capita) $231 Employment Welfare (per capita) $121 Employment Public Health (per capita) $205 Employment Education (per capita) $991 Employment Transportation (per capita) $109 Employment

Public Transportation and the Nation’s Economy
Cambridge Systematics, Inc. 5-5
There are two principal assumptions which underlie the analysis. The first is thatgovernment expenditures are proportional to the variables used in the analysis. Thismeans that the fixed costs of providing public services are built into the expenditure ratesused, rather than considered separately. To consider the fixed costs of public servicesseparately would have required substantial additional analysis beyond the scope of thissketch-level analysis. To illustrate, consider the problem of determining at what pointadding a student to a community creates a demand for new school construction. Toavoid this problem, we simply assume that each student adds to school expenditures inproportion to current per capita spending for education. Secondly, all governmentexpenditures are assumed to increase as employment (resulting from transit investment)increases, with the exception of welfare expenditures. Specifically, each additional employeeis assumed to generate no additional public spending for welfare services. This isreasonable, since most employed persons and their dependents do not receive welfarebenefits.
n Apply the Relationships Developed to the Results of theTransportation Scenario
The fiscal analysis provides an estimate of how the predicted gains in jobs, businessactivity and income resulting from the transportation scenario would affect local/stategovernment finances. In the first year, there is a modest surplus of $2.4 million in 1992dollars. The surplus grows roughly in proportion with the steady increases in income,employment and business sales. Net revenues are predicted to grow to $27.0 million by2005, reaching $88.3 million in the final year, 2017.
These findings indicate that local/state governments can realize a fiscal benefit frominvestment in transit, although the magnitude of that benefit is likely to vary widely fromone community to another. So too would the likely uses of any surplus vary amongcommunities, reflecting as it should, local priorities and the desires of local constituencies.
Table 5.6 Expenditure Estimates from Transportation Scenario
Combined State and Local/County Expenditures(in thousands of 1992 dollars)
1998 2005 2017 General Government 21,580 119,040 217,203 Public Safety 3,959 21,840 39,850 Public Health 4,577 25,251 46,073 Education 16,110 88,870 162,154 Transportation 3,317 18,299 33,388 Miscellaneous 3,971 21,906 39,970
Total 53,515 295,206 538,638

Public Transportation and the Nation’s Economy
5-6 Cambridge Systematics, Inc.
Table 5.7 Revenue Estimates from Transportation Scenario
Combined State and Local Revenues (in thousands of 1992 dollars)1998 2005 2017
Income Tax 4,694 30,754 69,579 Corporate Tax 1,344 7,815 16,100 Sales Tax 5,877 37,888 84,731 Gross Receipts 2,861 18,744 42,407 Property Tax 6,948 38,325 69,929 Intergovernmental Revenue 9,777 53,933 98,406 Fees, Charges and Miscellaneous 24,419 134,703 245,782 Total 55,920 322,162 626,934
Net Revenue 2,405 26,956 88,296
Net Revenue as Percentage of Expenditures on Table 5.6.
4.5% 9.1% 16.4%

Public Transportation and the Nation’s Economy
Cambridge Systematics, Inc. 6-1
6.0 Techniques for Analyzing EconomicImpacts of Transit at the RegionalLevel
n Introduction
The purpose of Section 6.0 is to assist individuals and organizations that are interested inmore fully analyzing – or simply better understanding – the economic benefits of invest-ment in public transit. While the need for and the benefits of public transit are widelyrecognized and well-established in terms of improved accessibility and mobility,estimating the economic benefits of infrastructure investment, including transportationgenerally and transit specifically, has received major attention only in the past decade.
The Importance of Assessing the Economic Benefits of Transit
A number of significant trends and changes have taken place over the past two decadesor more that point to the increasing importance of public transit as an element of oururban and rural transportation networks. Among these trends is a well-documentedcontinuing backlog of critical investment in a wide range of public services and facilities.There is mounting evidence that we, as a nation, are severely under-investing in thetransportation network that is so vital to our economic interests, and that we are payinginadequate attention to the development of transit and other forms of high-occupancysurface transportation.1
Despite the continuing strength of the American economy and the projected surpluses inFederal as well as state budgets, funding for all types of public services and facilitiesremains tight and competition among worthy goals, programs and projects remainsstrong. This fiscal environment, coupled with the pursuit of economic growth andcompetitiveness on a global scale, requires that the benefits of competing investments –including transit – be expressed in economic terms. To be effective, the effort to do somust be rigorous and credible from an analytical standpoint and readily understandableby both technical and non-technical actors and audiences. The reasons for doing so arecompelling:
1 The Status of the Nations Highways, Bridges and Transit: Condition and Performance,
U.S. Department of Transportation, Washington, D.C., 1995.

Public Transportation and the Nation’s Economy
6-2 Cambridge Systematics, Inc.
• Transportation is critical to business and personal economic security. Transportationaccounts for approximately 17 percent of our Gross Domestic Product, and forAmerican families transportation represents 18 percent of household spending, thesecond largest household expenditure after housing.
• Travel demand and congestion is increasing dramatically. From 1973 to 1993 ournation’s population grew 22 percent. In contrast, registered vehicles increased49 percent and vehicle-miles of travel rose 83 percent. Over this same period, streetand roadway mileage increased less than 28 percent.
• The cost of congestion is enormous. Time and money lost to households andbusinesses from congestion and delay on our highway system are estimated at $40billion to $100 billion per year and are projected to grow, increasing costs and reducingbusiness profitability and economic competitiveness.
• Environmental and quality of life concerns related to transportation are on the rise.The environmental consequences of accommodating increased motor vehicle use areimposing increasingly unacceptable costs and constraints on economic growth anddevelopment.
• Economic opportunities are being lost for a growing segment of Americans. The highcost and poor quality of transportation links between willing workers, jobs, trainingand human services reduces individual economic opportunities and access to labor forbusiness and industry.
• Global economic competitors are investing in transit. European and Asian countriesare investing billions to provide high-capacity passenger transportation systems andservices using state-of-the-art technologies as part of aggressive global economicgrowth strategies.
Chapter Overview
This section is intended to: 1) point the way toward credible, comprehensive applicationof analytical techniques and/or findings at the local and regional level; and 2) enhancegeneral understanding of the linkages that exist between transit investment and use, andbenefits to the economy.
This section is organized into the following sub-sections:
• “Framing the Issues and Analysis” provides an overview on how the issues associatedwith estimating transit’s economic benefits might be framed.
• “Analytical Methods and Applications” highlights various analytical approaches thatcan be applied to capture a full range of benefits.

Public Transportation and the Nation’s Economy
Cambridge Systematics, Inc. 6-3
• “Applying the Results of Recent Analyses” highlights how these results might beapplied, as well as other factors and data developed from other sources that may be ofvalue in local efforts to carry out similar analyses.
• “Choosing the Correct Analytical Techniques” outlines analytical methods to considerwhen estimating transit impacts.
• “Factors and Findings from Other Sources” summarizes the results of recent analysesof the economic benefits of transit.
At various points throughout this section, explicit recommendations are highlighted toassist in conducting local analyses.
n Framing the Issues and Analysis
Tracing and estimating the economic consequences of public infrastructure investment,including transit investment, is a complicated task. While complex modeling andestimating techniques lie at the heart of the analysis, it is critically important that bothanalysts and non-technical decision makers “see” the broad dimensions involved inassessing transit’s economic benefits. Framing the issues and identifying cause and effectlinkages are an important first step in making sure that analytical results are fullyappreciated and understood. In general, it is useful to define three types of impactmeasures:
Travel impacts refer to the travel time, cost and safety improvements that are realized bytravelers. These benefits may be expressed in terms of their dollar value to travelers.Effects on non-travelers are not counted in the analysis of user benefits. This is themeasure of benefit traditionally used by transportation agencies for project evaluation.
Economic impacts are defined as impacts on the flow of dollars in the economy. They aremost commonly described in terms of dollars of income for people, including bothtravelers and non-travelers. It is important to recognize that economic impactsencompass only money flows and do not necessarily capture all aspects of benefits thatcan affect the quality of life for people.
Total societal impacts are measured, in theory, as the value of all impacts regardless ofwhether or not they affect flows of dollars. They can encompass both flows of dollars(income impacts) and the equivalent value of additional quality-of-life impacts that do notaffect flows of dollars. Care must be taken to avoid double-counting of total societalbenefits.
This guide focuses specifically on the assessment of economic impacts, although the needfor recognizing other societal impacts is also discussed.

Public Transportation and the Nation’s Economy
6-4 Cambridge Systematics, Inc.
Illustrating the Linkages Between Transit and Economic Benefits
Until recently, analysis of the economic benefits of transit has been limited in scope andgeographic scale. Most analyses have been conducted for individual corridor improve-ments, notably proposed rail transit investments. Little has been done historically toassess the system-wide, long-range regional economic benefits of transit investment anduse. This “gap” in our documentation of transit’s impacts was identified in a recentTransit Cooperative Research Program (TCRP) study and led to an examination ofalternative analytical approaches that allow better, more comprehensive estimates to bemade of transit’s economic benefits at the regional scale.2
As part of that effort, a new, broad framework was developed that identifies in simpleand direct terms both the recognized and assumed links between transit investment anduse, and key regional economic variables or indicators. The framework is based on thenotion that if we can chart linkages, or the chain of cause and effect relationships betweenkey variables, we can then determine whether:
1. Data exists about those variables;
2. A technical or mathematical expression of the relationships has been developed for usein an analysis; and
3. Analytical results can be credibly translated into dollar or monetary terms.
As one would expect, in the case of some cause and effect relationships between transitinvestment and economic consequences, reliable data does exist, models of therelationships between variables have been established, and we know how non-monetaryimpacts (e.g., minutes of delay) can affect the flow of dollars in the economy. In manycases, however, one or more of these critical components are missing. As a result, itremains necessary to make educated or informed guesses based on logic and professionaljudgment. The result is that not all presumed economic benefits can be calculatedprecisely or expressed in monetary terms.
Despite the frailties of current analytical approaches, techniques are being improved.Because our knowledge of analytical technique is incomplete, however, it is important toillustrate in other ways that the framework for analysis – the scope of transit’s economicbenefits – is far broader than has been noted or measured in the past. A first step in theanalysis, therefore, should be development of a simple, graphic depiction of theframework that can both guide subsequent analysis and inform non-technical audiencesabout the scope of transit’s economic benefits. One such framework is illustrated inFigure 6.1.
2 Cambridge Systematics, Inc. Measuring and Valuing Transit Benefits and Disbenefits, TCRP Report
20, Transit Cooperative Research Program, Transportation Research Board, Washington, DC,1996.

Public Transportation and the Nation’s Economy
Cambridge Systematics, Inc. 6-5
Figure 6.1 illustrates the basic linkages between transit investment and use and the per-formance of a region’s economy. Transit investment and use (together with supportivepublic policies) result in a combination of three basic effects:
1. Changes in travel behavior and cost, as travelers switch from personal motor vehiclesto transit;
2. Changes in spending, including construction and building activity influenced bytransit (particularly rail transit); and
3. Changes in other social and environmental factors including the organization of landuses.
These impacts, in turn, have an effect on variables that traditionally are used to measurethe economic health of a region, including Gross Regional Product (GRP), householdincome, business revenue or profit and fiscal impacts on area governments.
The basic relationships captured in Figure 6.1 represent a “logic diagram” intended toillustrate broad cause and effect relationships that are logically or intuitively sound. Thelines that connect boxes in the diagrams represent the relationships (known andunknown) that must be measured, i.e., a change in one variable causes a specific changein another. As indicated earlier, in some cases we can be confident of these relationships,describe them mathematically and have access to large amounts of data. In otherinstances, we do know the direction of the linkages, but we can only make educatedguesses about their exact nature, i.e., an increase in one variable is bound to result in anincrease or decrease in another, though the amount of change may be uncertain.
In this framework, however, it is important to note that while transit investment and usecan and does represent a positive influence, there are factors that may have a strongereffect on a region’s economic performance, both positive and negative. In addition,transit investment and use by itself is neither an absolute prerequisite for regionaleconomic growth, nor can transit investment and use by itself necessarily counter-balanceor compensate for the negative effects of other factors that may be part of a region’seconomic profile.
Logic diagrams have been drawn at a much greater level of detail. As one example,Figure E.3 (see page E-7) illustrates that linkages exist between transit investment anduse, changes in travel behavior, effects on the natural environment and their economicconsequence for the region. We can accurately estimate, for instance, the change in tailpipe emissions from a shift from personal vehicles to transit. A decline in emissionsreduces the cost of compliance with air quality standards for business and industry and itreduces property damage and health risks and costs from air pollution. These effects alsocan be estimated, although with somewhat less precision and certainty. Each, in turn, hasa positive effect on household income, the cost of doing business and businessprofitability in a region, as well as other dimensions of economic performance.

Public Transportation and the Nation’s Economy
6-6 Cambridge Systematics, Inc.
Figure 6.1 Framework for Analyzing the Economic Impacts of Transit
Transit Investment/Use
Supporting Policies
Construction and Building Activity Land Use OrganizationTravel Behavior
(H, B) (B, G) (H, B)
Regional Economic Prospects
Gross Regional Product
Income Profit
Government Fiscal Position
(C)
(B)(H)
(G)
Change in level of activity Increase in activity/effect Decrease in activity/effect
H,B,G,C Most pronounced effect (Household/Business/ Government/Community) Well-developed analytical procedures

Public Transportation and the Nation’s Economy
Cambridge Systematics, Inc. 6-7
In addition to the framework described above, there have been other efforts in recentyears to illustrate the full scope of transit’s impacts – social, economic andenvironmental.3
None, however, have focused as extensively on the long-term, region-wide economicimpacts of transit investment and use as is shown in the approach highlighted above.
The importance of properly framing and illustrating the full scope of transit’s economicimpacts cannot be overstated. While the concepts and relationships to be measured,assessed and communicated are complex, logic diagrams can provide simple insight intothe heart of a complex set of relationships and analyses, regardless of what technicalmethods may be used. Even if the actual analytical concepts to be applied do not coverthe full range of impacts noted on Page 6-3, an effort should be made to illustrate themconceptually to help audiences develop an understanding of the full extent of transit’seconomic benefits.
Types of Impacts
While the logic diagrams described on Page 6-5 provide a way to frame and illustrate keylinkages issues in the broadest possible terms, the types of economic impacts resultingfrom transit investment (or any public investment for that matter) can be describedtechnically in a variety of ways. Fundamentally, transit investments provide impactthrough two primary effects:
• Transportation spending effects on the economy, leading to changes in jobs; and• Travel-related impacts leading to travel time and cost changes for people and business.
These direct effects lead to further impacts on many different levels, affecting therevenues and costs for households, for businesses and for governments (the latter arereferred to as “fiscal impacts”). Thus, we distinguish between direct, indirect andinduced economic effects.
• Direct Economic Impacts are those changes in flows of dollars that result directly fromthe initial spending in the transit project or activity, and the effect of the transit serviceon travelers. The spending effect includes the wages paid to workers on the project orworking on the transit system, and revenue accruing to companies participating in theproject or activity. Cost effects include changes in out-of-pocket expenditures forpersonal and business travel, which may affect business revenue and sales.
3 Litman, T.A., Transportation Cost Analysis: Techniques, Estimates and Implications, Victoria
Transport Policy Institute, Victoria, BC, Canada, 1995.Delucchi, M., The Annualized Social Cost of Motor-Vehicle Use in the U.S., 1990-1991: Summary ofTheory, Methods, Data and Results, Institute of Transportation Studies, University of California-Davis, Davis, CA, 1996.Lee, D., Full Cost Pricing of Highways, Volpe National Transportation Systems Center, U.S.Department of Transportation, Cambridge, MA, 1995.

Public Transportation and the Nation’s Economy
6-8 Cambridge Systematics, Inc.
• Indirect Economic Impacts cover additional changes in economic activity forbusinesses that supply services or materials to the directly affected businesses.
• Induced Economic Impacts result as household income changes (created by direct andindirect effects on wages) lead to further effect on consumer spending throughout theeconomy.
Indirect and induced impacts can represent “multiplier” effects that increase totaleconomic impact. Such “multiplier effects” can make the overall economic impactssubstantially larger than the direct effects alone. They occur insofar as the local area orstate has the ability to provide additional workers and capital resources, or attract themfrom elsewhere, without taking them away from other existing economic activities withinthe area. The extent and size of multiplier effects depends on the specific area beingstudied. Estimates of the multiplier effects for any given county or state are availablethrough economic “input-output” tables provided by the U.S. Department of Commerceand other private sources.4
Other Issues to Keep in Mind
Enumerating, Summing and Double-Counting Benefits. Stakeholders and othersinvolved in deciding public investment priorities are frequently interested in differenttypes of impacts. Local officials may be interested in population and employmentimpacts. Regional planners may be most interested in travel time savings and congestionreduction. State legislators may be most interested in impacts on their state’s revenueand fiscal position. Developers may be interested in potential impacts on local landvalues. Transit investment benefits include:
• Time savings – motorists and transit users;
• Parking and travel cost savings – motorists;
• Avoided job loss;
• Avoided welfare payments;
• Avoided motor vehicle accidents;
• Avoided congestion and pollution;
• Central city labor market opportunities;
• Central city business attraction and retention;
• Local education – college attraction; and
• Other aspects of mobility for those without cars (poor, elderly, kids, etc.)
4 Weisbrod, Glen and Burton Weisbrod, Assessing the Economic Impact of Transportation Projects:
How to Match the Appropriate Technique for Your Project, Transportation Research Circular 477,Transportation Research Board, Washington, DC, 1997.

Public Transportation and the Nation’s Economy
Cambridge Systematics, Inc. 6-9
Each of these interests is legitimate. Each has an economic dimension that can beexpressed in monetary terms. Each can and should be measured to provide decisionmakers a basis for informed decisions. The result of all these “enumerated” impacts,however, cannot be simply summed and presented as a statement of the cumulativeeconomic impact of investment in transit (or any other public facility or service). Simplysumming these economic impacts would result in double-counting and an over-estimation of the economic benefit of transit investment. The following example waspresented in a TCRP study on economic impact analysis of transit investment preparedby Cambridge Systematics, Inc.
“As an example of double-counting, consider a case in which a transit investment is found to haveyielded travel time savings worth $2 million annually, and property value increases (measured interms of lease rates and sale prices) of $3 million annually. While it may be appropriate to discusseach of these impacts separately, it would be inaccurate to conclude that the transit investmentproduced a total annual benefit of $5 million. This is because the increase in property values isdue, in large measure, to the travel time savings. That is, the value of the improved access toproperties in the transit corridor is capitalized into the lease rates and sales prices of the properties.Thus, adding together the travel time benefits and the property value benefits would be countingthe same impact twice, and would exaggerate the benefits of the transit investment.”5
Enumerating and measuring individual types of economic benefit is an important andlegitimate step. Simply summing them, however, is not and can invite legitimatechallenges to the credibility of the analysis. Fortunately, there are analytical techniquesavailable that can reduce the chance of double-counting while still providing a broad-based expression of transit’s economic benefits.
The Present Value of Future Costs and Benefits. An analysis of benefits often involves acomparison of a multi-year stream of monetized benefits and costs, with the objective ofdetermining whether, over time, benefits outweigh costs. Because the value of a benefitreceived in the future is not as great as the value today, future benefits and costs must bediscounted to arrive at an expression of present value. Selection of the appropriatediscount rate is an important and controversial analytical issue, reflecting political valuesand policy orientation. The lower the discount rate selected, the more likely it will bethat investments with high initial costs but benefits far off in the future, like transit, willhave higher or more favorable benefit/cost ratios. The principal criterion in settingdiscount rates is the “opportunity cost of capital”, which may be judged to be any one ofthe following:
• the actual cost of borrowing money by the public sector agency (which is typically alow interest rate due to its tax free status); or
• the rate of return that the money could have earned in the private sector (the “socialopportunity cost”); this is normally similar to the cost of borrowing in the privatesector; or
5 Cambridge Systematics, Inc. with Robert Cervero and David Aschauer, Economic Impact Analysis
of Transit Investments, TCRP Report 35, Transit Cooperative Research Program, TransportationResearch Board, Washington, DC, 1998.

Public Transportation and the Nation’s Economy
6-10 Cambridge Systematics, Inc.
• the rate at which people effectively value receiving money now rather than in the future(the “social rate of time preference”).
Among these choices, an important consideration is the available alternatives for use ofthe real resources (labor, machinery, etc.) which can be paid for by the available money.
The “real” (constant dollar) discount rates used for benefit-cost analysis of transportationinvestments are typically in the range of four to eight percent. The U.S. Office ofManagement and Budget (OMB) recommends a seven percent discount rate, asrepresenting the private sector rate of return on capital investment. Other agencies,recognizing the social rate of time preference, have adopted lower discount rates. Fordecades, the Army Corps of Engineers used a four percent rate, which had the effect offavoring long-lived projects with net benefits many years into the future. The State ofWisconsin adopted a five percent rate. The UK Department of Transport’s NESAbenefit/cost procedures call for a seven percent rate. Analyses for major projects inMassachusetts have generally used a seven percent rate. The BC Ministry ofTransportation and Highways uses an eight percent rate.
The Multiple Missions of Transit in Metropolitan, Small Urban and Rural Settings.Public transit systems are expected or required to pursue missions and goals that are veryoften contradictory. Financial constraints force managers to live within limited budgets,while strategic goals call for service expansion and initiatives to increase ridership andmarket share.
Similarly, communities of varying size have different expectations and goals for transit.In larger communities, transit represents one of the few acceptable options available toadd capacity to the regional transportation system during rush hours – when the streetand highway system is at or over capacity. In serving this function, transit is playing afundamental role in the provision of transportation capacity essential to sustain economicgrowth and expansion. The economic benefits of transit in this scenario are substantialand relatively easy to estimate.
In smaller urban and rural communities, the role of transit may be fundamentallydifferent. Transit may play a smaller role in preserving or adding to highway capacity,but a large role in guaranteeing mobility and access for individuals and households thathave no transportation options. In providing a transportation option, there are clearlysocial benefits accruing to individuals, the community and local governments as well asbusiness and industry, but these remain difficult to measure in quantitative terms.Measurable economic benefits may also be less important in these settings than the moreintangible quality of life benefits afforded by transit. The economic benefit in traditionalterms in small urban and rural areas does not suggest, however, that these transitservices are of less importance than transit services are in areas where economic benefitsare substantial and can be easily measured.
Measuring Economic Benefits at the Local and Regional Level. The economic impact oftransit investment and use will vary from region to region, because the structures ofregional economies vary. For example, the region with a bus manufacturing plant willretain more of its transit investment in the local economy than a region whose transitvehicles are supplied from another area of the country.

Public Transportation and the Nation’s Economy
Cambridge Systematics, Inc. 6-11
This variability in regional impacts underscores two important points. First, there is ahigh degree of economic interdependence between regions and how they serve transitneeds and make transit investments. Investments in one region provide direct andindirect economic stimuli to other regions. Second, this interdependence extends farbeyond the local and regional transit investment transactions. Substantial transitinvestment and economic benefit in one region of the country, where it is consideredcritical, is likely, through federal assistance, to be matched by equally critical investmentsof another type in regions where transit needs are not as great. In both senses, thiseconomic interdependence at the local and regional level indicates that there is a sharedinterest in promoting economic and social well-being in all areas of the country throughinvestment in public transit.
n Analytical Methods and Applications
Analysis of the economic benefits of transit investment is generally conducted for one oftwo reasons – to predict the consequences of investments yet to be made, or to evaluatethe consequences of investments already made. A variety of methods are commonlyused to assess the economic benefits of transit investment.
TCRP Report 35, Economic Impact Analysis of Transit Investments: Guidebook for Practitioners,provides an in-depth description of the characteristics of many such methods andtechniques, with examples of where and how the techniques have been applied, and withwhat result. The most significant points from those descriptions are summarized below.
Travel Demand Models Used basically for predictive purposes; among the best
tools for measuring changes in regional system per-formance and travel behavior; complex, data-intensive,costly software requiring high levels of expertise; lesseffective in forecasting changes in transit performance;and used in virtually all major system and corridorplanning programs.
Benefit-Cost Analysis Primarily for predictive purposes; widely accepted,well-developed procedures; use travel demand modeloutputs; balance of benefits/costs dependent on keyassumptions (value of time, specification of other vari-ables, discount rates, analysis period, etc.); potentialbias against long-term benefits; and cost-effectivenessanalysis is an alternative when monetizing benefits isdifficult.
Input-Output Models Primarily for predictive purposes; used to estimatetransit’s economic benefits; measure job and dollarflows between industries as demand and consumptionchange; several widely available models; limited tointer-industry transactions, impacts; static – do notaccount for long-term changes; and key features of I-Omodels included in other tools.

Public Transportation and the Nation’s Economy
6-12 Cambridge Systematics, Inc.
Forecasting Economic andSimulation Models
Primarily for predictive purposes; used to re-estimateemployment and business revenue impacts (techniquesused in Public Transportation and the Nation’s Economy);typically include I-O inter-industry links and morefeatures that allow a larger range of benefits to beestimated; somewhat costly to purchase or rent; oftenrequire extensive data acquisition efforts; provide shortand long-term impact assessment; and provideestimates of generative impacts, labor costs and taxes.
Multiple Regression Models Primarily for evaluative purposes; measure causalrelationships between a dependent variable andvarious explanatory variables; used for evaluatinggenerative impacts; may reveal cause and effectrelationships for predictive analyses using othermethods; well-established software packages exist;difficult to include and get data on all relevant vari-ables; and sensitive to sampling and measurementerrors.
Statistical Comparisons Primarily for evaluative purposes; include before/aftercomparisons (“longitudinal”), and place comparisons(“cross-sectional”) for redistributive impacts; provideprobabilities and evaluations of differences as a surro-gate for cause and effect; low data, budget, skillrequirements; and use of actual cases enhancestransparency.
Case Comparisons Primarily for predictive purposes; often used for publicinformation purposes; inputs include literaturereviews, interviews, surveys, etc.; low data, budget,skill requirements; and use of actual cases enhancestransparency.
Interviews, Focus Groups,Delphi Methods
For both predictive and evaluative purposes; used toelicit insights from personal experience; provide obser-vations on redistributive and transfer effects (directionand magnitude of effects); low data, budget, skillrequirements; based on opinion and perception, i.e.,limited accuracy; and results potentially compromisedby personalities.
Physical Conditions Analysis For both predictive and evaluative purposes; providesa basis for assessing developmental impacts; low data,budget, skill requirements; and results are speculative.
Real Estate Market Analysis Used to predict development potential and redistri-butive and transfer effects; low cost with potential datashortcomings; and results are speculative.
Fiscal Impact Analysis Primarily for predictive purposes; spreadsheet modelsavailable for estimating public revenue and expendi-ture effects; provides long-term cost implications andproportion costs and benefits; often difficult to conduct

Public Transportation and the Nation’s Economy
Cambridge Systematics, Inc. 6-13
on a multi-jurisdictional basis; and risks implying thatinvestment decisions be based on fiscal impacts alone.
Development SupportAnalysis
Primarily for predictive purposes; combines conditionsanalysis, market analysis, interviews and highwaycapacity analysis to gauge development capacity; mosteffective at corridor, subarea or site level; as acomposite approach, shares disadvantages of severaltechniques; and reliant on assumptions and consensus.
Selecting the Best Methods
The selection of appropriate and effective analytical techniques for use in assessing theeconomic benefits of transit investment depends on two sets of considerations. The firstis how well the various techniques satisfy four basic criteria intrinsic to all analyticalprocedures:
Validity How accurately does the method represent the featurein question?
Does it identify/imply cause and effect (internalvalidity)?
Are findings generalizable (external validity)? Reliability Does the method yield consistent results in comparable
circumstances? Resources Requirements What level of money, time, skill, and data is required?
Transparency The ease with which methods, assumptions and resultscan be understood.
The second set of considerations has to do with how well various analytical methodsmatch up with the concerns, capabilities and requirements of the organization conductingthe analysis.
• Data Requirements. Considerable time and expense can be involved in the develop-ment of data necessary to support the use of selected analytical techniques. Theavailability and quality of data should be reviewed, and the level of effort to be madein the development of supporting data should be decided prior to selecting analyticaltechniques.
• Analyst Skills. The level of technical expertise required to apply various techniquesvaries considerably. Staff skills and capabilities and those of contractors should becarefully assessed before selecting analytical techniques to be applied.

Public Transportation and the Nation’s Economy
6-14 Cambridge Systematics, Inc.
• Technical Requirements. Available analytical techniques require a wide range oftechnical skills. Technical requirements should be fully understood before analyticaltechniques are selected.
• Cost. There is a fundamental trade-off between the validity and usefulness of theanalytical results and the cost of applying various techniques. Simple, less costlytechniques generally have more obvious shortcomings; more rigorous analyticaltechniques generally provide more credible results, but at significantly higher cost.
• Time Required. A similar trade-off exists between the degree of complexity and cost ofvarious techniques and the time required to apply them and validate results. A clearsense of the analytical timetable will help determine what techniques might beselected.
• Ability to Differentiate Between Types of Impacts. Various analytical methodsprovide varying ability to distinguish between types of impacts (generative,redistributive or financial transfers). The importance of these types of impacts will, inturn, reflect the motives for the analysis.
• Scale of Analysis. Some methodologies are most effectively used at the national,regional or county-wide scale; others can be effectively used at the corridor or site-specific scale. The techniques to be applied must be matched to scale and the purposeof the analysis.
Over time, it has become obvious that no single analytical technique can satisfy all of thecriteria or characteristics of every situation for which analysis of transit’s economicbenefits is desired. As a result, it is increasingly common for more than one analyticaltechnique to be used, particularly in analyzing the region-wide, long-term economicimpacts of transit investment.
Other Sources of Information on Transit Impact Analysis
This section has presented an overview of the many issues to consider when framing atransit impact study. There are other sources of information available, including,TCRP 35, Economic Impact Analysis of Transit Investments (1999): Guidebook for Practitioners,and Economic Benefits of Transit in Indiana: Technical Report (1994). The Indiana study,produced by McDonald Transit Associates for the Indiana Transit Association, is a verypractical guide that offers a “cookbook” approach to the estimation of transit impacts.Worksheets to estimate the effects of transit investments in a number of discrete impactareas are provided. For organizations considering conducting their own study of transitimpacts, both of these publications are worth taking a look at. Transit agencies planningeconomic studies can obtain further information about these and other volumes from theAmerican Public Transit Association, 1201 New York Avenue, N.W., Washington, DC,20005; telephone (202) 898-4000.

Public Transportation and the Nation’s Economy
Cambridge Systematics, Inc. 6-15
n Applying the Results of Recent Analyses
At the federal, state and local levels of government, decision makers face the challenge ofidentifying and prioritizing the needs of their constituents and generating the supportand resources to meet those needs. Transit investment is but one of many potentialbudget items on the fiscal balance sheet. When the prevailing perception of transitfunding is that such investments will take away valuable resources from other pressingneeds, create financial liabilities and not address problems for which it is designed,initiatives to promote transit are unlikely to succeed. Bringing to the table credibleevidence supporting claims of an economic pie that can grow rather than shrink throughtransit investment, however, can counter those perceptions or prevent them fromdeveloping.
Public Transportation and the Nation’s Economy adds to the body of evidence that transitinvestment sustains and enhances the economic well-being of communities that makethose investments. Policy-makers at all levels of government can use the findings of thisreport to rally support for continued or enhanced funding for a variety of transit projects.
The findings of the study can and should be cited as representative of the positiveeconomic impacts that can be achieved through proper planning, design, engineering andimplementation. The study focused upon data and analysis at the national level. Ofcourse transit projects vary considerably in their scope, purpose, funding level and anumber of other key dimensions, so no single community can claim that precisely thesame results found in the study will apply to their project.
It is contingent upon policy-makers to make the case why the transit investments theysupport are likely to yield benefits along the lines cited in Public Transportation and theNation’s Economy. The likelihood of these benefits being realized depends directly uponthe presence of certain background conditions and complementary actions which fosterthe success of transit investment. Citing the background conditions and complementaryfactors relevant to a particular investment scenario make the results of the PublicTransportation and the Nation’s Economy more appropriate to their situation and willstrengthen claims of economic benefits similar to those found in this report. Several ofthese background conditions and actions are briefly cited below:
The economic impacts associated with transportation investments are likely to begreatest:
• In urban areas with moderate to high congestion in corridors designated for transitinvestment;
• Where there is limited ability for highway capacity improvements;
• There is good access to significant land use activity at the destination end andresidences at the origin end;
• There are public policies that support and abet transit usage such as zoning and landuse policies, transit-supportive parking policies and employer-based commuteoptions; and

Public Transportation and the Nation’s Economy
6-16 Cambridge Systematics, Inc.
• The transit service is competitive with the highway alternative in terms of time andcost. Systems operating on dedicated rights-of-way, for example are likely to be moretime-competitive with auto times as compared to bus systems running in mixedtraffic.
The economic impacts of capital investment are likely to be greatest when:
• For existing systems, there are opportunities to increase reliability of service throughrehabilitation/replacement; and
• Manufacturers and suppliers of goods and services needed for expansion/newsystem are located within the region.
The economic impacts of operating system investments are likely to be greatest when:
• The investment creates direct employment to operate and manage the system. In thislight, more labor-intensive operations, such as new bus systems, would create therelatively more economic impacts than other types of transit investments.
n Findings from Other Studies
Over the past decade, studies examining transit’s worth from several perspectives haveshown that transit provides measurable economic and transportation benefits. It isemphasized that each of those studies was conducted under unique circumstances andassumptions, and cannot always be used for comparative purposes. The studies wesummarize below, however, examine transit systems in all sizes and shapes and fromseveral different angles, and carry a consistent positive message that builds upon thebody of evidence showing that transit is a sound public investment.
The economic impact studies are grouped by: large metropolitan areas, mediummetropolitan areas, small and rural areas and national studies.

Public Transportation and the Nation’s Economy
Cambridge Systematics, Inc. 6-17
Economic Impacts – Large Metropolitan Areas
The Philadelphia metropolitan area is a large, economically diverse region with a largecentral business district and a transit network of nearly 3,000 vehicles. This studyexamined the region-wide transportation and economic impacts of diminishedinvestment levels in the transit system. Employing sophisticated dynamic simulationmodels similar to the one used in Public Transportation and the Nation’s Economy, theresearch focused on several “shutdown” scenarios: immediate, gradual and partial. Theresults above present year 2020 annual impacts from the immediate shutdown scenario,compared to a base case transit system in a state of good repair.
The Chicago Regional Transportation Authority operates commuter rail, subway and busservice in the third largest metropolitan area in the United States. The RTA studyinvestigated the impact of a disinvestment scenario as well as a scenario that wouldrestore the system to a state of good repair. The study employed sophisticatedtransportation and economic analysis techniques similar to the ones used in the SEPTAstudy, and received substantial review and input by all partners in their respectivetechnical review committees. The study affirmed the vital regional and state economiccontribution of transit – and the interdependence between the central business districtand the surrounding region.
Philadelphia, PA, Southeastern Pennsylvania TransportationAuthority (SEPTA), Public Transportation Renewal as anInvestment, Urban Institute and Cambridge Systematics, Inc.(1991). Scenario: Immediate Shutdown • 175,000 loss in employment• $10.1 billion loss in annual personal income• $16.3 billion loss in annual business sales• $632 million loss in combined state and local revenues• 9:1 Benefit/cost ratio
Chicago, IL, Regional Transportation Authority (RTA),Investment in Public Transportation, Cambridge Systematics,Inc. (1995). Scenario: Restore System to State of Good Repair • 41,209 gain in jobs (2020)• $4.6 billion gain in business sales (2020)• 6:1 Benefit/cost ratio

Public Transportation and the Nation’s Economy
6-18 Cambridge Systematics, Inc.
Roughly a quarter of all U.S. transit boardings occur somewhere on the New YorkMetropolitan Area’s vast system of transit services. Transit is especially vital inManhattan and the inner boroughs, where transit is a necessity, not an option, for manypeople. The MTA study examined the impacts, over a 20-year time horizon, of a 50percent reduction in spending for capital needs. The study estimated the decreasedreliability in constituent system components, such as rolling stock, tracks and signals, theresulting loss in ridership and the ripple effect on the highway system, includingcommuters, taxi drivers and truck operators and tourists. The study found that the lossin regional economic competitiveness, through the loss of accessibility, resulted in asubstantial loss of business profits, jobs and income.
Los Angeles is looking at transit investment as one approach to addressing the regions’formidable congestion and air quality issues. This study, conducted by CambridgeSystematics, Inc. and Economic Development Research, Inc., examined the benefits offour funding scenarios, ranging from a “status-quo” to an aggressive funding strategy.The results shown above represent the projected impacts of a $24 billion investment incapital and $50 billion investment in operating expenditures over 20 years. The scenarioincludes substantial rail expansion, and completion of the 1996 High Occupancy VehicleIntegration Plan. The REMI model was the primary analytical tool used in the analysis,similar to the other studies cited above. In contrast to those studies however, highwayand transit investments – those comprising the long-rang plan – were included in theanalysis.
New York, NY, Metropolitan Transportation Authority (MTA),Lasting Economic Benefits of Public Transportation Investment -Phase 2, Cambridge Systematics, Inc. (1997). Scenario: System Disinvestment • 319,800 loss in jobs (2016)• $18.9 billion loss in business sales (2016)• 4.3:1 Benefit/cost ratio
Los Angeles, CA, Los Angeles County MetropolitanTransportation Authority (LACMTA), Economic Impacts of theLong Range Transportation Plan, Cambridge Systematics, Inc.(1999). Scenario: System Investment with Rail/Bus Improvements • 131,200-261,700 increase in jobs (2020)• $8.9-16.0 billion increase in personal income• 4.47-7.51:1 Benefit/cost ratio

Public Transportation and the Nation’s Economy
Cambridge Systematics, Inc. 6-19
Like New York, London is one of the economic and cultural centers of the world. To aneven greater extent than New York, London is built around an efficient and extensiveunderground transit system. This study examined the impact of a $1.2 billion annualexpenditure to modernize the underground system. The study looked at a fullinvestment scenario, one that held service levels constant, and a third that held spendingconstant and caused service levels to deteriorate. Similar to the New York MTA study,economic impacts followed a chain of events, starting from changing conditions ofindividual system components, and leading to transportation and economic impacts. Thestudy found that a sustained investment to modernize the underground system between1990 and 1993 would yield positive net benefits both for London and the UnitedKingdom.
Economic Impacts - Medium-Size Metropolitan Areas
The Miami Valley Regional Transit Authority (MVRTA) manages the regional transitsystem in the greater Dayton Area. This analysis looked at the value of transit to theeconomy by projecting a scenario in which all transit services were halted. The studylooked at earnings and spending patterns of MVRTA employees living in MontgomeryCounty, and used simple multipliers to estimate the indirect effects to the local economyof a loss of that employment.
London, United Kingdom, The Economic Impact of the LondonUnderground Core Investment Program, Center for Economicsand Business Research (1993). Scenario: Modernization • $6.9 billion increase in GDP (2003)• $2.2 billion increase in fiscal revenues• 36,000 increase in employment
Dayton, OH, Miami Valley Regional Transit Authority(MVRTA), Economic Impacts of the Miami Valley RegionalTransit Authority on Montgomery County, University of DaytonCenter for Business and Economic Research (1995). Scenario: Immediate Shutdown • $3.8 million loss in annual direct and indirect spending• 985 loss in direct and indirect jobs from RTA expenditures
and employee purchases

Public Transportation and the Nation’s Economy
6-20 Cambridge Systematics, Inc.
Economic Impacts - Small and Rural Areas
HART, a regional transit authority serving western Connecticut, operates a fleet of 55buses with fixed route and paratransit services. The role of transit in serving work trips isrelatively small – accounting for 2.5 percent of all such trips. For this study, informationabout passengers from on-board surveys was augmented with Census data and datafrom the transit agency itself. Alternative modes chosen in the absence of transit serviceas indicated by survey respondents and their associated costs were the basis fordeveloping cost estimates. The costs of foregone trips, and increased accidents, airpollution, employment, lost operating funds and employment, were considered in theanalysis as well. Despite the modest role of transit in the region, the study found abenefit/cost ratio of 9.7 to 1, when accounting for local government expenditures againstall financial benefits. Even when state and local subsidies are accounted for, benefitsremained positive – amounting to $1.3 million per year. The $1.8 million represents thedirect and indirect income impacts lost to resident workers and those who benefit fromtheir spending in the local economy resulting from a total loss of transit services in theregion. They would suffer a loss from the absence of HART expenditures in the region,amounting to $1.3 million annually. The wage and expenditure figures were estimated asnet impacts, accounting for the benefits of welfare and unemployment payments thatpartially offset the loss of wages and local spending.
Rural communities are by definition low-density areas where access to transportation canmean the difference between isolation and having connections to jobs and services,
Danbury, CT, Housatonic Area Regional Transit (HART), TheEconomic Impact of HART to the Housatonic Valley Region, JackFaucett Associates (1997). Scenario: Immediate Shutdown
• $1.8 million loss in wages• $1.3 million loss in direct HART expenditures• 9.7:1 Benefit/cost ratio
Rural Areas, Assessment of the Economic Impacts of RuralPublic Transportation, Ecosometrics (1998). Scenario: Detailed Case Studies • 1.67:1 to 4.22:1 Benefit/cost ratios for all systems• 3.03:1 to 3.55:1 Benefit/cost ratios for four of eight systems• 3.12:1 Average benefit/cost ratio Scenario: Correlation of Transit Service to Economic Growth • Net earnings in counties with rural transit systems are 16
percent higher than counties without transit systems

Public Transportation and the Nation’s Economy
Cambridge Systematics, Inc. 6-21
especially for disabled, low-income and elderly persons. Almost one-third of thepopulation of rural communities is transit-dependent. The majority of transit serviceoperated in rural areas is demand-responsive, or a combination of demand-responsiveand fixed-route service. The service emphasis varies from an almost exclusive emphasison work trips to a primary focus on human service trips. The importance of transit torural communities has not received the kind of attention reserved for urban areas.Economic indicators at the county-level were compared to the availability of publictransportation in rural commuting zones. The researchers examined the types of tripsserved in various communities, ascribed (with a combination of actual and assumed data)a value and cost to them, and compared that value to the cost of private sector servicecosts. These results were extrapolated to the nation’s rural communities as a whole.
Economic Impacts - National Studies
Nearly fifty percent of the American workforce lives in the suburbs. Commuter railservices provide a critical link between suburban residential areas and employmentcenters concentrated in cities. In presenting facts and findings on congestion, taxes, jobimpacts and numerous other indicators of the positive benefits of commuter railinvestment, this study provides a compelling case for its continued support.
Areas with Commuter Railroad Service, Commuter Rail: ServingAmerica’s Emerging Suburban/Urban Economy, The CarmenGroup (1997). Scenario: Value of Current Services • 420,000 increase in jobs over 1986-1996 (capital investment)• $3.5 billion increase in federal, state and local tax revenue,
1885-1996• $300-$450 million savings to truck and freight industry from
reduced congestion• $247-$865 annual time and fuel cost savings to each commuter
rail rider.

Public Transportation and the Nation’s Economy
Cambridge Systematics, Inc. 7-1
7.0 References
American Public Transit Association, Employment Impacts of Transit Capital Investment andOperating Expenses, Washington, DC, 1983.
American Public Transit Association, National Impacts of Transit Capital and OperatingExpenditure on Business Revenues, Washington, DC, 1984.
American Public Transit Association, Transit Funding Needs, 1995-2004: Findings of anAPTA Membership Survey, Washington, DC, 1994.
Bureau of the Census, Statistical Abstract of the United States 1997, Washington, DC, 1997.
Cambridge Systematics, Inc., Measuring and Valuing Transit Benefits and Disbenefits, TCRPReport 20, Transit Cooperative Research Program, Transportation Research Board,Washington, DC, 1996.
Cambridge Systematics, Inc., and Economic Development Research, Inc., Economic Impactsof the Long Range Transportation Plan, Los Angeles County Metropolitan TransportationAuthority, Los Angeles, CA, 1999.
Cambridge Systematics, Inc., et al., Investment in Public Transportation: The EconomicImpacts of the RTA System on the Regional and State Economies, Regional TransportationAuthority, Chicago, IL, 1995.
Cambridge Systematics, Inc. with Raytheon-Ebasco, Lasting Economic Benefits of PublicTransit Investment – Phase 2 Final Report, Metropolitan Transportation Authority, NewYork, NY, 1997.
Cambridge Systematics, Inc., with Robert Cervero and David Aschauer, Economic ImpactAnalysis of Transit Investments: Guidebook for Practitioners, TCRP Report 35, TransitCooperative Research Program, Transportation Research Board, Washington, DC, 1998.
The Carmen Group, Commuter Rail: Serving America’s Emerging Suburban/Urban Economy,American Public Transit Association, Washington, DC, 1997.
Camph, Donald H., Dollars and Sense – The Economic Case for Public Transportation inAmerica, Campaign for Efficient Passenger Transportation, Washington, DC, 1997.
Center for Economics and Business Research, Ltd., The Economic Impact of the LondonUnderground Core Investment Program, London, UK, 1993.

Public Transportation and the Nation's Economy
7-2 Cambridge Systematics, Inc.
Delucchi, Mark A., The Annualized Social Cost of Motor-Vehicle Use in the U.S., 1990-1991:Summary of Theory, Methods, Data and Results, Institute of Transportation Studies,University of California-Davis, Davis, CA, 1996.
Ecosometrics, Inc., Assessment of the Economic Impacts of Rural Public Transportation, TCRPReport 34, Transit Cooperative Research Program, Transportation Research Board,Washington, DC, 1998.
E. D. Hovee and Company, Socio-Economic Benefits and Impacts on Transit, OregonDepartment of Transportation, Salem, OR, 1997.
Federal Highway Administration, Estimating the Impacts of Transportation Alternatives,Participants Notebook, Washington, DC, 1995.
Federal Highway Administration, Nationwide Personal Transportation Survey: 1990 NPTSDatabook, Washington, DC, 1993.
Federal Transit Administration, Fixed Guideway Capital Costs: Heavy Rail and Busway/HOVLane, Washington, DC, 1994.
Federal Transit Administration, Modernization of the Nation’s Rail Transit Systems: A StatusReport, Washington, DC, 1992.
Federal Transit Administration, National Transit Database, Washington, DC, annual.
Jack Faucett Associates, The Economic Impact of HART to the Housatonic Valley Region,Housatonic Area Regional Transit, Danbury, CT, 1997.
Lee, Douglass B., Full Cost Pricing of Highways, Volpe National Transportation SystemsCenter, U.S. Department of Transportation, Cambridge, MA, 1995.
Litman, Todd, Defining and Quantifying Public Transit Benefits, Victoria Transport PolicyInstitute, Victoria, BC, 1998.
Litman, Todd, Public Transit Benefits in the Victoria Region, BC Transit, Victoria, BC, 1996.
Litman, Todd, Transportation Cost Analysis: Techniques, Estimates and Implications, VictoriaTransport Policy Institute, Victoria, BC, 1995.
McDonald Transit Associates, Inc., Economic Benefits of Transit in Indiana: Technical Report,Indiana Transportation Association, Bloomington, IN, 1994.
Skolnik, Jonathan, and Richard Schreiner, “The Benefits of Transit in Small Urban Areas:A Case Study,” paper presented at the 77th Annual Meeting of the Transportation ResearchBoard, Washington, DC, 1998.
Texas Transportation Institute, Urban Roadway Congestion Annual Report, Texas A&MUniversity, College Station, TX, annual.

Public Transportation and the Nation’s Economy
Cambridge Systematics, Inc. 7-3
U.S. Department of Transportation, Status of the Nation’s Surface Transportation System:Condition and Performance, Washington, DC, biennial.
University of Dayton Center for Business and Economic Research, The Economic Impacts ofthe Miami Valley Regional Transit Authority on Montgomery County: A Quantitative andQualitative Assessment, Miami Valley Regional Transit Authority, Dayton, OH, 1995.
The Urban Institute and Cambridge Systematics, Inc., Public Transportation renewal as anInvestment: The Economic Impacts of SEPTA on the Regional and State Economy, DelawareValley Regional Planning Commission, Philadelphia, PA, 1991.
Urban Mass Transportation Administration, Light Rail Transit Capital Cost Study,Washington, DC, 1991.
Weisbrod, Glen and Burton Weisbrod, Assessing the Economic Impact of TransportationProjects: How to Choose the Appropriate Technique for Your Project, Transportation ResearchCircular 477, Transportation Research Board, Washington, DC, 1997.

Public Transportation and the Nation's Economy
7-4 Cambridge Systematics, Inc.