Embed Size (px)
Citation preview
Public Transport, Urban Design and Walking
Professor Graham CurrieInstitute of Transport StudiesMonash University, Australia
MAV Smart Urban Futures National ConferenceMarch 26th 2015Rydges, 186 Exhibition Street, Melbourne
"1 flinders st station melb" by Adam.J.W.C. - Own work. Licensed under CC BY-SA 2.5 via Wikimedia Commons - http://commons.wikimedia.org/wiki/File:1_flinders_st_station_melb.jpg#/media/File:1_flinders_st_station_melb.jpg

Institute of Transport Studies (Monash)The Australian Research Council Key Centre in Transport Management
1 Introduction
2 Important Strides?
3 How Tracking?
4 The Right Steps?
2
Agenda
Copyright 2005 - 2015 © Marcus Wong

Institute of Transport Studies (Monash)The Australian Research Council Key Centre in Transport Management
The importance of PT and walking is reviewed plus current performance and good practice
3
Important Strides?
How Tracking?
The Right Steps?

Institute of Transport Studies (Monash)The Australian Research Council Key Centre in Transport Management
1 Introduction
2 Important Strides?
3 How Tracking?
4 The Right Steps?
Agenda
Copyright 2005 - 2015 © Marcus Wong
4

Institute of Transport Studies (Monash)The Australian Research Council Key Centre in Transport Management
5
What share of rail, tram and bus users walk to/from PT?
0 10 20 30 40 50 60 70 80 90 100
Rail
Tram
Bus
Share that Walk to/from Public Transport
Source:
Access/Egress from Melbourne Public Transport
Pu
blic
Tra
nsp
ort
Ma
in M
od
e

Institute of Transport Studies (Monash)The Australian Research Council Key Centre in Transport Management
6
What share of rail, tram and bus users walk to/from PT?
Source: Common Sense!
0 10 20 30 40 50 60 70 80 90 100
Rail
Tram
Bus
Share that Walk to/from Public Transport
Access/Egress from Melbourne Public Transport
Pu
blic
Tra
nsp
ort
Ma
in M
od
e 100
100
100

Institute of Transport Studies (Monash)The Australian Research Council Key Centre in Transport Management
7
What share walk and use no other mode?
52
80
74
0 10 20 30 40 50 60 70 80 90 100
Rail
Tram
Bus
Share that Walk to Public Transport and Use No Other Access Mode
Source: PTV OD-Surveys
Access to Melbourne Public Transport
Pu
blic
Tra
nsp
ort
Ma
in M
od
e

Institute of Transport Studies (Monash)The Australian Research Council Key Centre in Transport Management
Think like a passenger; a typical trip…
Access WalkAccess Walk 5 Mins5 Mins
Actual Time (mins)Actual Time (mins)
Expected WaitExpected Wait 10 Mins10 Mins
Unexpected WaitUnexpected Wait 1 Mins1 Mins
In-Vehicle Travel 1In-Vehicle Travel 1 10 Mins10 Mins
Transfer Time 1Transfer Time 1 8 Mins8 Mins
In-Vehicle Travel 2In-Vehicle Travel 2 5 Mins5 Mins
Egress WalkEgress Walk 5 Mins5 Mins
Total Time 44 Mins
Note: 1Includes a walk and wait 2See TransFund NZ June 2000 3June 2004 DoI Guideline on economic, social and environmental cost-benefit analysis 2005
2.02.0
Perceptual Weightings2
Perceptual Weightings2
2.02.0
5.05.0
1.01.0
2.0 plus a 10 min transfer penalty
2.0 plus a 10 min transfer penalty
1.01.0
2.02.0
10 Mins10 Mins
Percieved Time (mins)
Percieved Time (mins)
20 Mins20 Mins
5 Mins5 Mins
10 Mins10 Mins
26 Mins26 Mins
5 Mins5 Mins
10 Mins10 Mins
86 Mins
Institute of Transport Studies (Monash)The Australian Research Council Key Centre in Transport Management
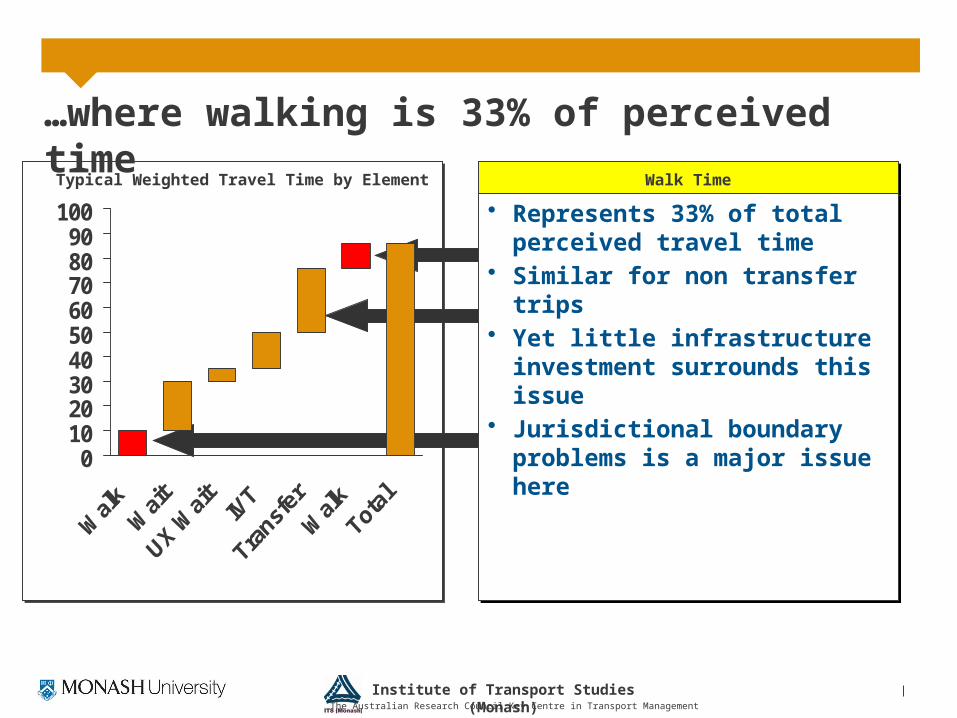
0102030405060708090
100Typical Weighted Travel Time by Element Walk TimeWalk Time
• Represents 33% of total perceived travel time
• Similar for non transfer trips• Yet little infrastructure
investment surrounds this issue• Jurisdictional boundary
problems is a major issue here
• Represents 33% of total perceived travel time
• Similar for non transfer trips• Yet little infrastructure
investment surrounds this issue• Jurisdictional boundary
problems is a major issue here
…where walking is 33% of perceived time

Institute of Transport Studies (Monash)The Australian Research Council Key Centre in Transport Management
10
Perceived Weighting of Walk Time: Typical average = 2.0
MVA (1987); = 2.0; retired people have higher values
HCG (1990); = 1.3 (under 50 years of age) = 3.0 (over 50 years of age)
SDG (1990) = 0.9 (short trips)
= 1.9 (long trips)
Ryan LT (1990) = 4.4 (Stairs walk up) = 3.0 (Stairs walk down) = 1.5 (Riding on Escalators) = 2.8 (Escalators not working walk down) = 4.2 (Escalators not working walk up)
Source: TransFund NZ June 2000 Valuation of Public Transport Attributes
Institute of Transport Studies (Monash)The Australian Research Council Key Centre in Transport Management
11
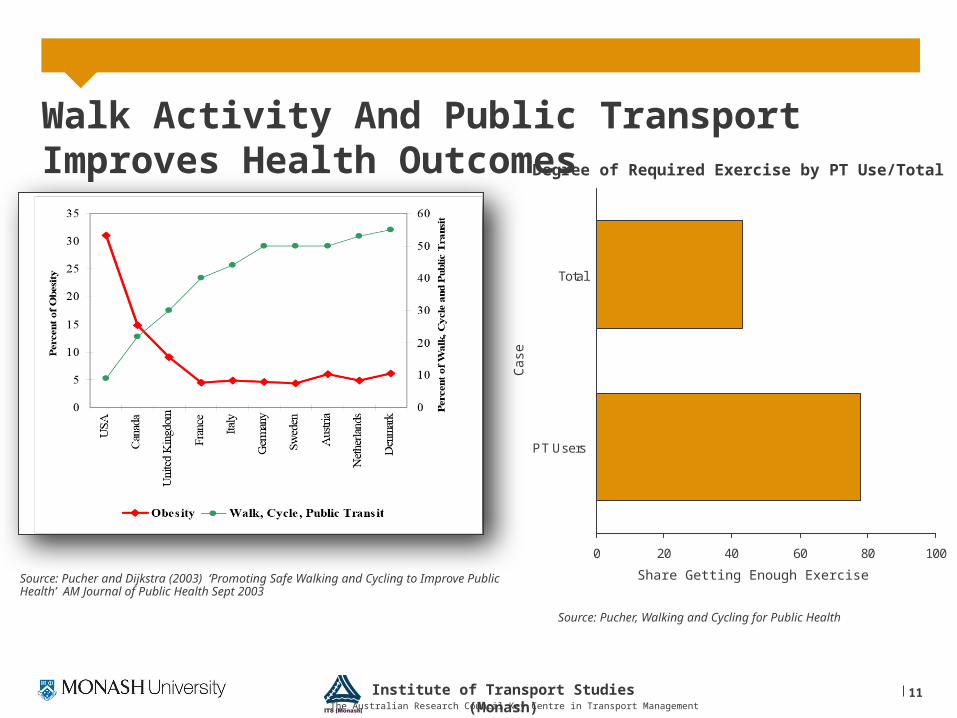
Walk Activity And Public Transport Improves Health Outcomes
Source: Pucher and Dijkstra (2003) ‘Promoting Safe Walking and Cycling to Improve Public Health’ AM Journal of Public Health Sept 2003
0 20 40 60 80 100
Total
PT Users
Degree of Required Exercise by PT Use/Total
Share Getting Enough Exercise
Cas
e
Source: Pucher, Walking and Cycling for Public Health
Institute of Transport Studies (Monash)The Australian Research Council Key Centre in Transport Management
How much of Melbourne walk activity does PT represent?
Institute of Transport Studies (Monash)The Australian Research Council Key Centre in Transport Management
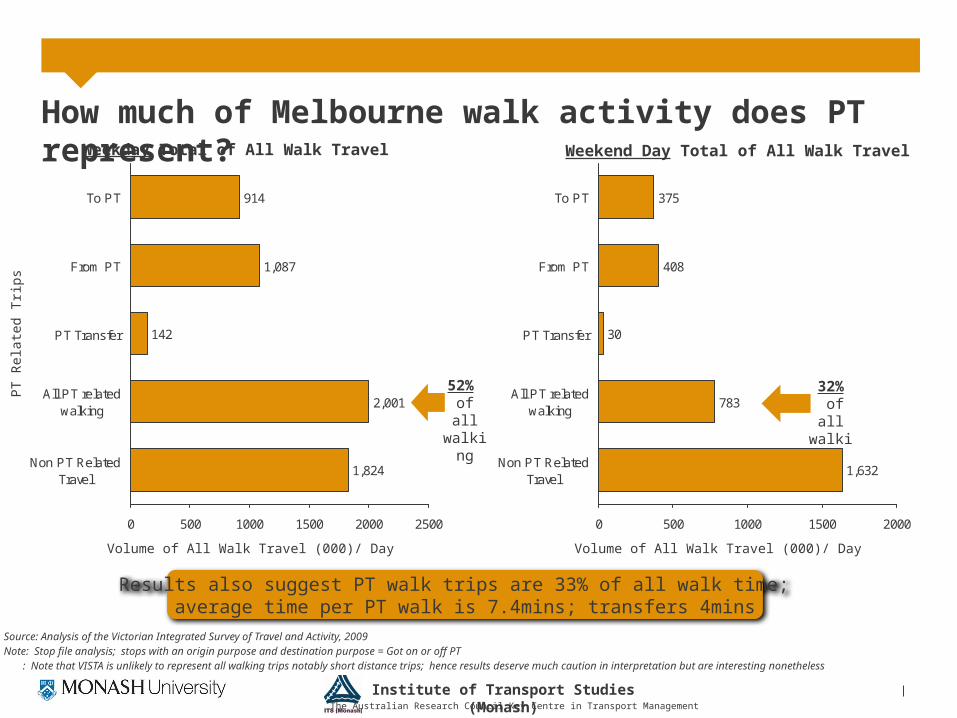
How much of Melbourne walk activity does PT represent?
Source: Analysis of the Victorian Integrated Survey of Travel and Activity, 2009Note: Stop file analysis; stops with an origin purpose and destination purpose = Got on or off PT : Note that VISTA is unlikely to represent all walking trips notably short distance trips; hence results deserve much caution in interpretation but are interesting nonetheless
914
1,087
142
2,001
1,824
0 500 1000 1500 2000 2500
To PT
From PT
PT Transfer
All PT relatedwalking
Non PT RelatedTravel
Weekday Total of All Walk Travel
Volume of All Walk Travel (000)/ Day
PT
Rel
ated
Trip
s
52% of all
walking
375
408
30
783
1,632
0 500 1000 1500 2000
To PT
From PT
PT Transfer
All PT relatedwalking
Non PT RelatedTravel
Weekend Day Total of All Walk Travel
Volume of All Walk Travel (000)/ Day
32% of all
walking
Results also suggest PT walk trips are 33% of all walk time; average time per PT walk is 7.4mins; transfers 4mins

Institute of Transport Studies (Monash)The Australian Research Council Key Centre in Transport Management
1 Introduction
2 Important Strides?
3 How Tracking?
4 The Right Steps?
Agenda
Copyright 2005 - 2015 © Marcus Wong
14

Institute of Transport Studies (Monash)The Australian Research Council Key Centre in Transport Management
15
Institute of Transport Studies (Monash)The Australian Research Council Key Centre in Transport Management
16
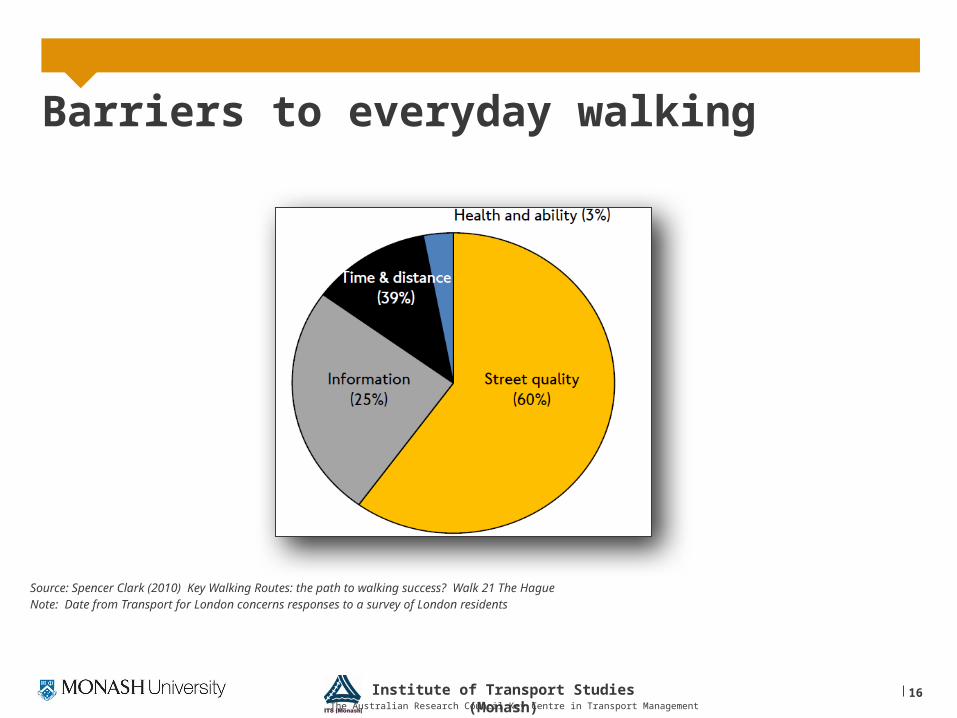
Barriers to everyday walking
Source: Spencer Clark (2010) Key Walking Routes: the path to walking success? Walk 21 The HagueNote: Date from Transport for London concerns responses to a survey of London residents

Institute of Transport Studies (Monash)The Australian Research Council Key Centre in Transport Management
17
Transit Oriented Development
Source: Cervero and Kockleman (1997)
Density – the concentration and
compactness of development within geographic space
Diversity – the land use mix including
the balance and compatability of users with each other
(and transit)
Design – which relates how the various
land uses are combined,linked and presented in terms of ease of
access and attractiveness

Institute of Transport Studies (Monash)The Australian Research Council Key Centre in Transport Management
Transit Oriented Development - Design
Source: G Currie L Aston and K Pavkova (2015) Unpublished
Walkers Paradise
Very Walkable
Somewhat Walkable
Car Dependent
18

Institute of Transport Studies (Monash)The Australian Research Council Key Centre in Transport Management
Transit Oriented Development - Density
Source: G Currie L Aston and K Pavkova (2015) Unpublished
19
Minimum Density (including JOBS) for
Effective PT Provision (Newman &
Kenworthy (2006)

Institute of Transport Studies (Monash)The Australian Research Council Key Centre in Transport Management
1 Introduction
2 Important Strides?
3 How Tracking?
4 The Right Steps?
Agenda
Copyright 2005 - 2015 © Marcus Wong
20

Institute of Transport Studies (Monash)The Australian Research Council Key Centre in Transport Management
Strasbourg
21

Institute of Transport Studies (Monash)The Australian Research Council Key Centre in Transport Management
French Light Rail
22

Institute of Transport Studies (Monash)The Australian Research Council Key Centre in Transport Management
French Light Rail
23
Institute of Transport Studies (Monash)The Australian Research Council Key Centre in Transport Management
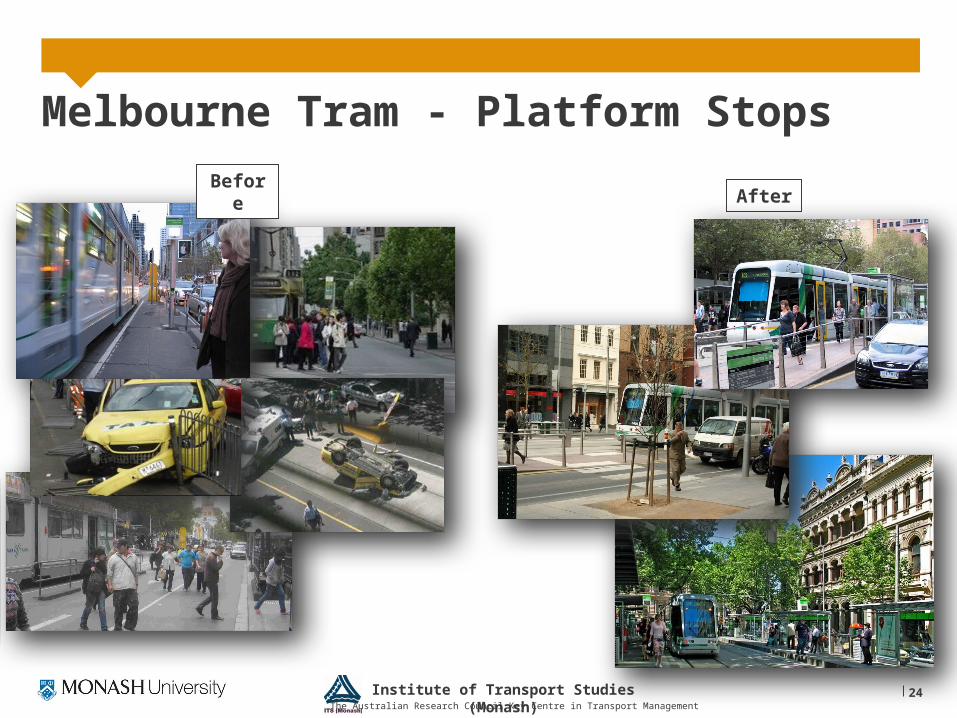
Melbourne Tram - Platform Stops
24
BeforeAfter

Institute of Transport Studies (Monash)The Australian Research Council Key Centre in Transport Management
Melbourne Tram - Platform Stops
25
53
57
9
0 10 20 30 40 50 60
Pedestrian-involved all injurycrashes per year
Pedestrian-involved FSIcrashes per year
AADT per site
% Reduction in Crash Statistics Before/After
Source: Naznin, Currie, Logan and Sarvi (Under Review) Safety Impacts of Platform Tram Stops on Pedestrians in Mixed Traffic Operation: A Comparison Group Before-After Crash Study, Accident Analysis and Prevention
Reduction in Pedestrian Involved Crashes; Conversion of Safety Zone to Platform Stops
Cra
sh D
ata
Typ
e
Assessing results on a per passenger basis; conversion to Platform Stops has reduced the total pedestrian
involved crash rate/10,000 riders by 86% and the pedestrian involved Fatal and Serious crash rate by 81%

Institute of Transport Studies (Monash)The Australian Research Council Key Centre in Transport Management
26
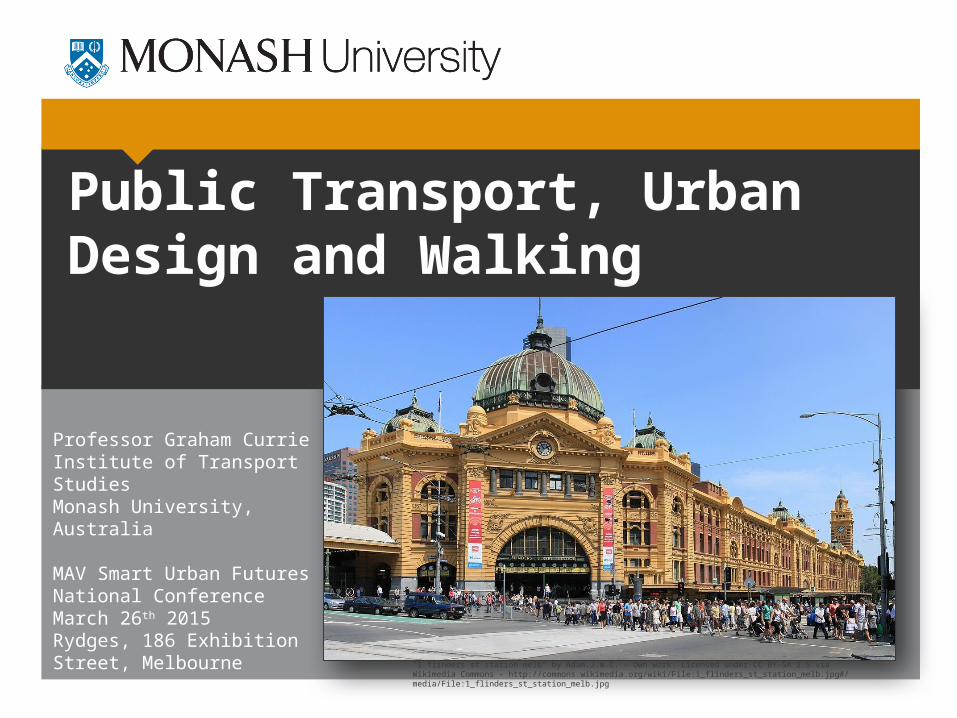
Bus stop access has some way to go
Research FocusResearch Focus
Over 1,600 bus stops in outer Melbourne have no connecting path
It would cost only $6.4M to build the required 42kms of footpaths necessary to connect the worst 200 of these
Over 1,600 bus stops in outer Melbourne have no connecting path
It would cost only $6.4M to build the required 42kms of footpaths necessary to connect the worst 200 of these
Institute of Transport Studies (Monash)The Australian Research Council Key Centre in Transport Management
27
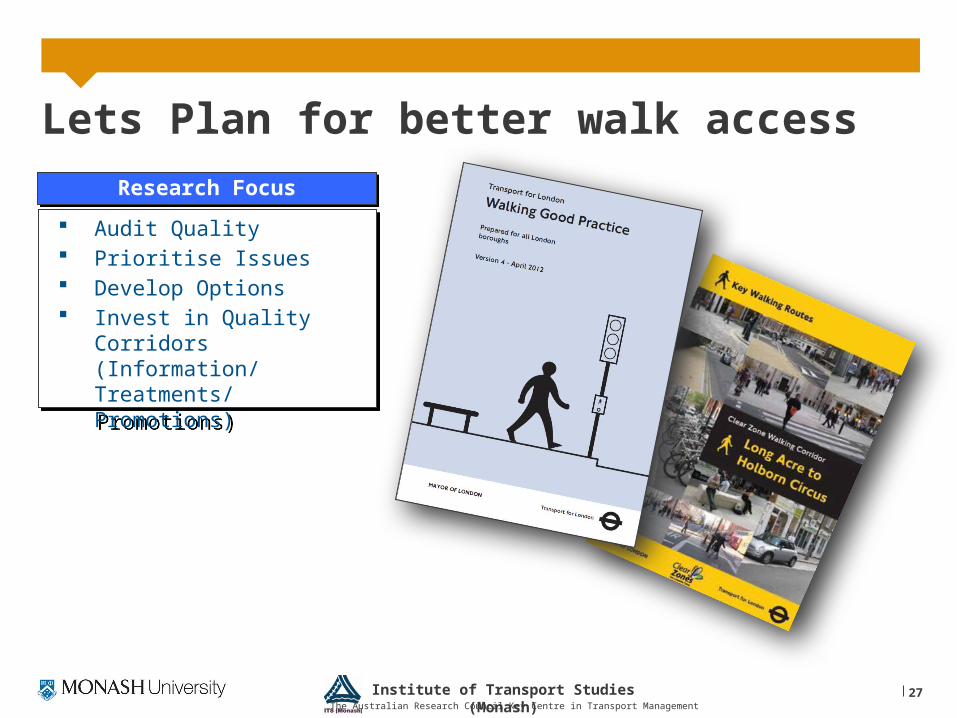
Lets Plan for better walk access
Research FocusResearch Focus
Audit Quality Prioritise Issues Develop Options Invest in Quality Corridors
(Information/ Treatments/ Promotions)
Audit Quality Prioritise Issues Develop Options Invest in Quality Corridors
(Information/ Treatments/ Promotions)
Institute of Transport Studies (Monash)The Australian Research Council Key Centre in Transport Management
28
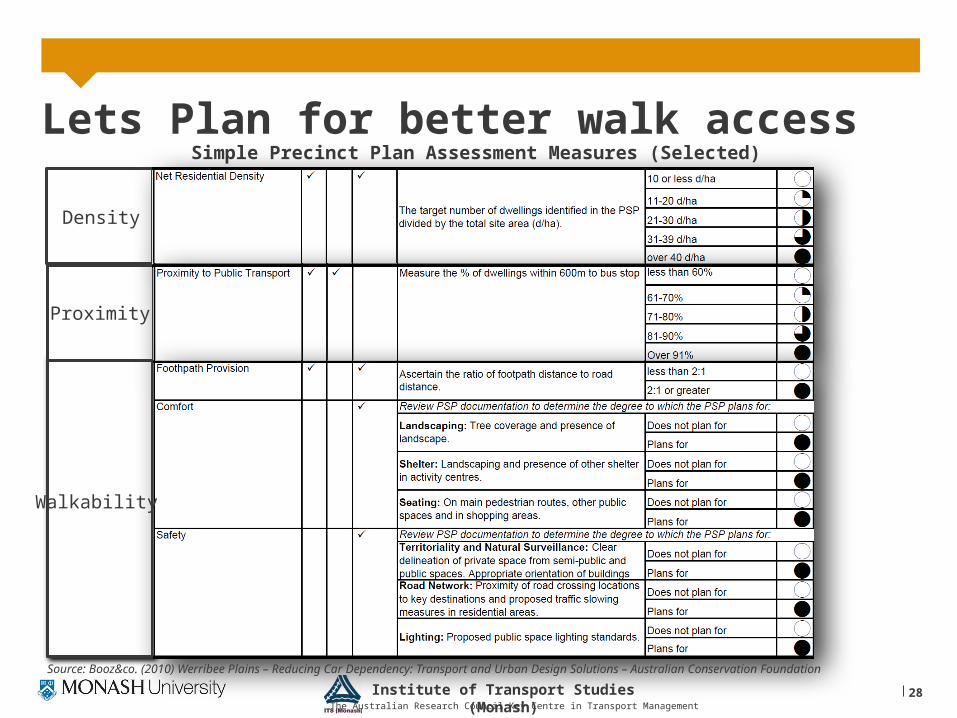
Lets Plan for better walk accessSimple Precinct Plan Assessment Measures (Selected)
Density
Proximity
Walkability
Source: Booz&co. (2010) Werribee Plains – Reducing Car Dependency: Transport and Urban Design Solutions – Australian Conservation Foundation
Institute of Transport Studies (Monash)The Australian Research Council Key Centre in Transport Management
www.worldtransitresearch.info
Showcase Award
Winner

Institute of Transport Studies (Monash)The Australian Research Council Key Centre in Transport Management
Join the ITS (Monash) LinkedIn group to keep informed of our activities