Embed Size (px)
Citation preview

Public Opinion Research Telephone Survey
Regarding Golden Gate National Recreation Area
Pet Management Issues
Technical Report December 2002
The Social Research Laboratory Northern Arizona University

Prepared by:
The Social Research Laboratory Northern Arizona University
P.O. Box 15301 Flagstaff, AZ 86011-5301
(928) 523-1515 www.nau.edu/srl
Frederic I. Solop, Ph.D. Kristi K. Hagen, M.A., M.A. Principal Investigator Research Operations Manager
Arian Sunshine Coffman
Project Manager
Research Team: James I. Bowie, Anne Mottek-Lucas,
Karin Ross, Katharyn Lyon, Russ Masco, M. Christopher Stringer
Public Opinion Telephone Research Survey Regarding
Golden Gate National Recreation Area Pet Management Issues
Table of Contents
Page Number
I. Methodology 1 II. Executive Summary 8 III. Appendix A – Annotated Questionnaire 36 IV. Appendix B – Open-ended Verbatim Responses 54 V. Appendix C – Cross-tabulation Tables by Demographics 59 VI. Appendix D – Cross-tabulation Tables by Visitor Status 133

Public Opinion Research Telephone Survey Regarding GGNRA Pet Management Issues
The Social Research Laboratory, Northern Arizona University 1
I. Methodology Objectives The Golden Gate National Recreation Area (GGNRA), a unit of the National Park Service, commissioned Northern Arizona University’s Social Research Laboratory (SRL) at the beginning of the public comment period to conduct a survey of residents of Marin County, San Francisco County, Alameda County, and San Mateo County. This survey focused on residents’ opinions concerning pet management regulations in parklands administered by GGNRA. Dr. Frederic I. Solop served as principal investigator and Kristi K. Hagen served as co-principal investigator for this study. Arian Sunshine Coffman served as Project Manager. The SRL provided technical research consultation on all aspects of this research project. SRL personnel developed the study methodology, wrote the survey instrument in consultation with GGNRA staff, fielded the survey instrument, conducted data analysis, and wrote this report with final review from GGNRA staff. Survey Instrument Design Dr. Solop and Ms. Hagen, with GGNRA input and final review, developed the survey instrument to ensure unbiased and balanced data collection in meeting the project objectives. The first step in the survey design was to conduct background research in the area of pet management in national park units. Background research on this topic area is quite limited. Literature reviews and Internet searches were completed in an effort to uncover previous scientific studies and research. None were found that related to the scientific study of pet management in national parks. Once the survey instrument was finalized, it was thoroughly pre-tested before data collection was initiated. The instrument was tested in-house and in the field for validity, clarity, phrasing, flow, neutrality, and comprehensiveness. Residents living in the four-county area were surveyed during the pre-test and asked to comment on the survey after completion. The pre-tests confirmed the validity and reliability of the survey instrument. The survey instrument was submitted to the National Park Service’s Washington Social Science Office and the Office of Management and Budget (OMB) for review. Final OMB clearance was received March 22, 2002. Final Survey Design Survey fielding was conducted between May 20 and July 2, 2002, with 400 adult residents living within each of the four counties (total respondents = 1600). Data collection within the four counties occurred simultaneously to maintain consistency in respondent information. The study utilized a random-digit dial (RDD) sampling technique to generate a representative sample of households in the four-county area. RDD involves the random generation of phone numbers within blocks of residential phone numbers assigned to geographic areas. This sampling technique produces a scientifically representative sample of a population because all households

Public Opinion Research Telephone Survey Regarding GGNRA Pet Management Issues
The Social Research Laboratory, Northern Arizona University 2
with working telephones have an equal chance of being contacted. Listed and unlisted residential households have similar probabilities of being included in an RDD study. This is a commonly accepted, standard method of respondent selection. To avoid biases in who is more likely to answer the telephone and who is more likely to complete a phone survey, area adult residents were randomly selected from sampled households using the “most recent birthday” method of selection. Calling took place Monday through Sunday, with morning, afternoon, and evening shifts. The average length of the survey was approximately eight minutes. Fifty trained interviewers were employed to conduct the calling. The survey utilized Computer Assisted Telephone Interviewing (CATI) technology. CATI is a system in which computers are employed to increase the accuracy, flexibility, and efficiency of telephone surveys. The computer system maintains a database of phone numbers, engages the sampling procedures, schedules callbacks, and records the disposition of each call. Interviewers are trained on interviewing protocol and use of the CATI system prior to fielding of the survey. Interviewers view survey questions on the computer screen in a programmed sequence and record respondents’ answers with use of a keyboard. Data entry errors are decreased using this system. Survey Implementation Once a phone contact was initiated, trained interviewers introduced the survey to potential respondents by identifying the name of the calling center and the purpose of the survey. Respondents were assured that nothing was being sold or solicited, and they were guaranteed confidentiality of responses. Respondents were asked for their consent to take the survey and told the survey would take approximately eight minutes to complete. Every effort was made to obtain the highest possible completion rates. Several techniques were employed to achieve this goal. Survey fielding utilized an established pattern of callbacks to minimize non-sampling errors that occur from certain types of people not being available at particular times of the day. Also, a refusal conversion process helped to maintain the integrity of the original sampling framework and minimize non-response bias in sampling. In the refusal conversion process, declined interviews were reattempted using a prescribed call-back schedule. The first time a respondent declined to participate in the survey, the respondent was coded as a “soft-refusal.” The telephone number was returned to the sample database and called again by a skilled “refusal converter,” an interviewer specially trained to convert refusals into completed interviews. If a respondent refused a second time, they were coded as a “medium refusal” and recontacted by a skilled interviewer in an attempt to complete the interview. If the respondent refused a third time, they were coded as a “hard refusal” and their number was removed from the sample database. Telephone numbers that were busy, rang without answer, or answered by an answering machine were called a minimum of ten times at different hours of different days before being removed from the sample database. Once “dead,” another phone number in the sample was substituted for the original number. This “call-back” procedure minimized the possibility of nonrandom bias from entering into the data.

Public Opinion Research Telephone Survey Regarding GGNRA Pet Management Issues
The Social Research Laboratory, Northern Arizona University 3
Quality Control The Social Research Laboratory utilized several quality checks in the collection of data. All interviewers were thoroughly trained in telephone surveying methodology prior to interviewing. After several general training sessions, interviewers received training specific to this project and remained in practice mode until maximum proficiency was reached. Once an interviewer was prepared to administer the survey, supervisors performed frequent and regular monitoring of calls and data collection. Supervisors who were trained to check on the accuracy and validity of data collection completed a “supervisor call-back” of randomly selected calls. Each calling shift held a pre-shift meeting that prepped interviewers on updates and changes in survey procedures. Interviewer meetings were held regularly and meetings with calling center staff were also held throughout the fielding of the survey to address questions that may have arisen. Respondents were also provided with the following information: “This survey has been approved by the Office of Management and Budget. The designated approval number is #1024-0224 (NPS #02-016) with an expiration date of 11/30/2003. You may direct comments that you have about any aspect of the survey to: Information Collection Clearance Officer, WASO Administrative Program Center, National Park Service, 1849 C Street NW, Washington, DC 20240. Or, you may call the principal investigator of this survey.” The name and phone number of the principal investigator was then provided. Sampling Error “Sampling error” is a social science term that describes the probable difference between interviewing everyone in a given population and interviewing a sample drawn from that population. Survey research makes inferences from the sample population to the general population; therefore, the percentages obtained in telephone surveys such as these are estimates of what the percentage would be if the entire population had been surveyed. “Sampling error” reflects how close the sample data is to what is true for the population as a whole. Smaller sampling error means the sample data is closer to reflecting true information from a larger population. Larger sampling error means the sample data is not as close to reflecting true information from a larger population. The standard for a scientific survey is to have a sampling error that is no larger than +/- 5 percent. The “sampling error” associated with a 1600 person sample drawn from a population of approximately 3,172,154 people is +/- 2.5 percent at a 95 percent confidence level. The sampling error associated with data from each of the four counties is +/- 5.0 percent at a 95 percent confidence level. Thus, for the regional- level data, if 50 percent of those in the sample are found to agree with a particular statement, the actual percentage of agreement in the population from which the sample is drawn would be between 47.5 percent and 52.5 percent (50% +/- 2.5%). The 95 percent confidence level means that this +/- 2.5 percent margin of error

Public Opinion Research Telephone Survey Regarding GGNRA Pet Management Issues
The Social Research Laboratory, Northern Arizona University 4
would occur in 95 out of 100 samples of this size drawn in a similar manner from the four-county area. This level of error meets professional standards for a reliable scientific survey. Sampling error increases as sample size is reduced. This must be kept in mind when comparing the responses of different groups, identified in the report as subsets, within the sample (e.g., men versus women). Smaller numbers of respondents on any question translate into higher margins of error. Completion Rates For this survey, completion rates were calculated to indicate the percentage of contacted respondents completing the survey. Survey completion rates for each county are presented below. A summary completion rate for the entire study is also presented. Alameda: 59% Marin: 62% San Mateo: 66% San Francisco: 68% Study Average: 64% Completion rates of 64 percent are very good for a scientific telephone survey of this type and suggest that the survey data is a reliable reflection of attitudes, behaviors, and ideas within the broader population. Analysis of Survey Results Once the survey fielding process was completed, data was exported from CATI to SPSS, a statistical software program. Data files were then reviewed for accuracy. At the request of GGNRA, the data was examined for nonrandom sampling error using standard procedures. County data was adjusted to accurately reflect the gender, age, race, and ethnic composition of the population based on Census 2000 information. Regional- level data was also adjusted to accurately reflect the relative population of each county. A complete SPSS dataset was used for analysis. Data findings are presented in this executive summary report. The report includes methodology, executive summary of findings, an annotated questionnaire, and cross-tabulation tables. Tables and figures are included in the executive summary to provide a graphic portrait of subset attitudes. Subsets (the breakout of respondents by demographic features such as age, gender, income, etc.) are included in figures only when significant subset differences occur within the data. All verbatim questions were coded according to decisions made in the questionnaire development phase of this project. A comprehensive listing of verbatim responses is available in Appendix B.

Public Opinion Research Telephone Survey Regarding GGNRA Pet Management Issues
The Social Research Laboratory, Northern Arizona University 5
Table Reading Two sets of tables are provided in Appendices A and C. The Annotated Questionnaire in Appendix A contains the survey as it was presented to respondents. Each question is followed by a summary table of regional data (data from all four counties combined) and data for each county. In some tables, “don’t know” and/or “refused” responses are coded as “missing data.” Additionally, all figures are rounded off to whole numbers. Therefore, total responses to some questions may be greater or less than 100 percent. Data may vary by one percent or more due to rounding in the tables and charts. Differences between data in the report and appendices are also due to rounding. Appendix C consists of cross-tabulations that present data in a condensed form. Questions asked of respondents are cross-tabulated by demographic variables to illustrate similarities and differences across specific subsets within the population. Thus, each table shows how individuals of different genders, ages, races, ethnicities, dog ownership statuses, income levels, and education levels responded to selected survey questions. Presenting data in this manner assists in making comparisons across demographic categories. For some variables, several categories have been collapsed to fewer categories to simplify data presentation. Note: categories with small numbers of responses (n size) should be read with caution. Small size responses carry a larger margin of error and should be understood as more descriptive in nature (see margin of error table on page 8). When reading the Executive Summary, it is important to note that salient information is bolded, italicized, and/or underlined for quick reference. Weighting of the data can increase the apparent number of responses. Thus, while 400 respondents were surveyed from each of the four counties (total n = 1600), the count of responses for questions may vary slightly depending upon weighting for both the regional and county datasets. This will affect any totaling of numbers of categories of respondents and percentages for a particular question, while actually increasing the validity and/or reliability of the information (see page 8 for further discussion on this). Ethnicity and race questions were based on the 2000 Census question wording and follow the same order. All respondents were first presented with an ethnicity question that asked, “Are you of Hispanic, Latino/a or Spanish origin?” The response categories were “Yes,” “No,” “Don’t know,” and “Refused.” All respondents were then asked, “What do you primarily consider your race to be?” Following US Census protocol, respondents were able to select more than one response. The response categories provided were “American Indian or Alaska Native,” “Asian,” “Black or African American,” “Native Hawaiian or other Pacific Islander,” “White,” “Don’t know,” and “Refused.” For purposes of data analysis and due to small numbers, “American Indian or Alaska Native” and “Native Hawaiian or other Pacific Islander” categories are collapsed in with the category of “Other” in this report.

Public Opinion Research Telephone Survey Regarding GGNRA Pet Management Issues
The Social Research Laboratory, Northern Arizona University 6
Survey Limitations The goal of this study was to interview a representative sample of adults from households within the four-county area adjacent to the GGNRA. However, despite the use of rigorous scientific methodology, all telephone sample studies face certain challenges and limitations. Only households that contain a working telephone were capable of participating in the study. Other types of survey methodologies were not used to reach residents who may not have a working telephone in the home. Random-digit dial or RDD telephone sampling generates telephone numbers that are both listed and unlisted. Since telephone companies’ boundaries for telephone exchange areas are not necessarily coterminous with geopolitical boundaries such as counties, telephone companies are not exact in assigning phone numbers within a defined geographical region. For this study, approximately 98 percent of telephone sample records were found to lie within the county for which it was generated and assigned. Only those records that were within the respective county were used in the study. This survey was administered in English, as this is the single widest spoken language in the four- county area, and was not provided in any other language. In an effort to account for RDD telephone sampling, non-English speaking respondents, and other types of sampling error, ratio-estimation adjustments were made to the final dataset after fielding was completed. Populations of the four counties vary, so ratio-estimation adjustments were also made to ensure that each county was proportionally represented in the regional dataset.

Public Opinion Research Telephone Survey Regarding GGNRA Pet Management Issues
The Social Research Laboratory, Northern Arizona University 7
The 2000 Census DP-1 Profile of General Characteristics report for county populations indicates the following adult (18 years of age and older) populations for the four counties surveyed and each county’s proportion of the total population surveyed:
County County Population Proportion of Total Population
Alameda 1,089,169 43.67% Marin 197,104 7.89% San Francisco 663,931 26.61% San Mateo 545,061 21.86% Totals 2,495,265 100.03%
Ratio-estimation, also known as weighting, allows the dataset to more fully represent the population from which it was drawn. In a perfect world, a probability sample is representative of the population and all eligible respondents in that population have an equal and non-zero chance of being selected for participation. However, in the practical world, sample telephone numbers that are selected may not lead to a completed interview for a va riety of reasons. Statistical adjustments are made to correct for sampling error and increase the representativeness of the sample to the population from which it was drawn. Proportions of certain demographic characteristics for the four-county populations are provided in Census 2000 reports. Using this information, researchers assigned weights to the data based on the different demographic characteristics pertinent to this study (gender, age, race, ethnicity, and region). In several instances in the report, a subset of respondents was given survey questions. Since smaller numbers of respondents on any question translate into larger margins of error, the following table is provided to assist the reader in understanding the margin of error associated with reduced sample sizes.
SAMPLE SIZE
N=1600 N=800 N=400 N=100 N=50 N=25 Margin of Error: +/-2.5% +/-3.5 +/- 5% +/-10% +/-14% +/-20%
Lastly, this report is not an exhaustive review of available data. It contains only those elements deemed salient and helpful to policy decisionmakers. The researchers were not asked to discuss the impact and policy implications of the findings, but rather to present the findings to decisionmakers for their review and integration into their decision-making process.

Public Opinion Research Telephone Survey Regarding GGNRA Pet Management Issues
The Social Research Laboratory, Northern Arizona University 8
II. Executive Summary Public Opinion Research Telephone Survey Project Description and Objectives On January 11, 2002, GGNRA implemented the Advanced Notice of Proposed Rulemaking (ANPR). As the Federal Register states:
This notice is intended to solicit public comment on a range of potential management options for addressing appropriate pet management within Golden Gate National Recreation Area, consistent with protecting national park resources and assuring visitor safety. This procedure could result in a range of outcomes, from enforcement of the existing regulation, to revisions of the existing regulation that would permit off- leash pets within portions of Golden Gate National Recreation Area under specific conditions. (Vol. 67, No. 8, pg.11)
GGNRA managers solicited public comment by letter, fax, e-mail, and oral comment from all interested parties during the 91-day public comment period for the ANPR. GGNRA contracted the Social Research Laboratory at Northern Arizona University to compile and evaluate the comments received. Two public information meetings were held on March 13 and 19, 2002, to present information on all aspects of pet management and help inform public comment. An oral comment opportunity was held on April 6, 2002, to allow members of the public to submit their comments to the ANPR orally. The following picture of the Golden Gate National Recreation Area illustrates the sites that comprise the GGNRA and is provided to assist the reader in understanding the areas under discussion.

Public Opinion Research Telephone Survey Regarding GGNRA Pet Management Issues
The Social Research Laboratory, Northern Arizona University 9

Public Opinion Research Telephone Survey Regarding GGNRA Pet Management Issues
The Social Research Laboratory, Northern Arizona University 10
In addition to these forms of soliciting public comment, NPS officials sought a method that would garner regional representation of the local public’s attitudes concerning the pet management regulations. Many members of the pub lic are unable to attend public meetings, or do not write in on issues in which they may have an interest. GGNRA sought to obtain input in the form of a public opinion research survey in order to provide a representative sample of public opinion from the region surrounding the GGNRA, including the adjacent counties of Alameda, Marin, San Francisco, and San Mateo.
The public opinion research project was initiated in the form of a telephone survey during GGNRA’s public comment period on the ANPR. The Social Research Laboratory was contracted to develop and administer the survey instrument and analyze the information collected in close cooperation with the GGNRA staff. The research effort involved a three-step process: constructing the survey instrument, administering the survey, and analyzing the results. The first step included a series of conversations and a meeting between the SRL and GGNRA staff to ensure that the sample and survey design methodology and construction of the survey instrument met the objectives of the study. Second, the survey methodology and sampling plan was rigorously controlled to ensure that the results met the targeted level of confidence in the results with an agreed upon margin of error for each survey item, county, and region. Finally, the evaluation and analyses of the survey results was not only compiled by item but included significant cross-tabulations to determine context for different inputs, as well.

Public Opinion Research Telephone Survey Regarding GGNRA Pet Management Issues
The Social Research Laboratory, Northern Arizona University 11
Current NPS Leash Regulations and Public Opinion
One purpose of the survey research project was to ascertain public opinion regarding off- leash dog walking at GGNRA sites. The public’s attitudes regarding this subject were collected in three specific sets of questions. For the first set of questions, respondents were read the statement, “Current NPS regulations allow for walking dogs on- leash at most GGNRA sites AND prohibit any off- leash dog walking,” and asked if they support or oppose this current regulation. Nearly three-quarters of all respondents from the four-county region (71%) support the current dog walking regulation and nearly one-quarter (23%) oppose the current regulation. Focusing on respondents with strong feelings toward the issue, the population of respondents “strongly supporting” the current regulation (45%) is almost four times as large as the population of respondents “strongly opposed” to the current regulation (12%). In the second set of questions, respondents were asked about their attitudes toward imposing additional limits to on- leash dog walking in the GGNRA. One-third of residents (33%) want to further limit the number of sites in which on-leash dog walking is allowed, with 19 percent “strongly in favor” of this regulation change and 14 percent “somewhat in favor” of this change. A much larger group opposes reducing the number of sites available for on- leash dog walking. Over half of respondents (55%) do not want to see a reduction in the number of sites where on-leash dog walking is allowed; 27 percent “somewhat oppose” this change and 28 percent “strongly oppose” further limitations. The third set of questions asked respondents whether they support allowing dogs off- leash in the GGNRA. Forty percent of respondents from the four-county area say they support allowing dogs off- leash. Seventeen percent of all respondents say they “strongly support” off- leash dog walking and almost one-quarter (23%) of respondents say they “somewhat support” off- leash dog walking. Just over half of respondents oppose off- leash dog walking (53%); 17 percent “somewhat oppose” off- leash dog walking in GGNRA sites and 36 percent “strongly oppose” off- leash dog walking in GGNRA sites. Dog owners and non-owners differ significantly on this issue.1 Just over one-half of dog owners (51%) say they support off- leash dog walking in GGNRA sites while 45 percent oppose off- leash dog walking in GGNRA sites. Thirty-five percent of non-owners support off- leash dog walking in GGNRA sites and 56 percent oppose it. Respondents were then read the following abbreviated GGNRA mission statement to provide a context for their response: “The mission of the Golden Gate National Recreation Area is the preservation, unimpaired, of the natural and cultural resources, and scenic and recreation values, of the park for present and future generations to enjoy.” Respondents were then asked whether they support or oppose off- leash dog walking at GGNRA sites. Over half of all respondents in the four-county area (58%) oppose off- leash dog walking after hearing the GGNRA mission statement. Forty-one percent of respondents “strongly oppose” off- leash dog walking and 17 percent “somewhat oppose” off- leash dog walking. Thirty-six percent of all respondents support off- leash dog walking; 16 percent “strongly 1 Smaller numbers of respondents on any question translate into larger margins of error.

Public Opinion Research Telephone Survey Regarding GGNRA Pet Management Issues
The Social Research Laboratory, Northern Arizona University 12
Position on Off-Leash Dog Walking (after mission statement was read)
11%
20%
20%
22%
16%
25%
25%
17%
15%
20%
14%
15%
14%
20%
17%
42%
33%
44%
40%
41%
0% 10% 20% 30% 40% 50% 60% 70% 80% 90% 100%
San Mateo
San Fran
Marin
Alameda
4 Cty Region
Strongly supportSomewhat supportSomewhat opposeStrongly oppose
Position on Off-Leash Dog Walking by Ownership (after mission statement was read)
10%
32%
20%
21%
19%
14%
45%
31%
0% 20% 40% 60% 80% 100%
Non-Owners
Dog Owners
Strongly supportSomewhat supportSomewhat opposeStrongly oppose
support” and 20 percent “somewhat support” off- leash dog walking. The following graphs illustrate these responses to Question 17:
These series of aforementioned questions establish the crux of the regional public’s attitude toward off- leash dog walking. Should there be further efforts to understand and plan for any off-leash dog walking in GGNRA, then Questions 17-20 should be considered as important input into that process. One note to remember in that regard is that one must then take into account those in Question 17 who were strongly opposed to off- leash dog walking in the park who were not asked Questions 18-20 about off- leash situations in the park because they had already stated their strong opposition. In the summary that follows, these items and other variables will be more fully discussed.

Public Opinion Research Telephone Survey Regarding GGNRA Pet Management Issues
The Social Research Laboratory, Northern Arizona University 14
Park Visitation All respondents were read a list of GGNRA park sites and asked if they had visited each site within the last 12 months or at an earlier time. Virtually all respondents (96%) have visited at least one GGNRA site in their lifetime and three quarters of respondents (74%) visited at least one GGNRA site within the last year.4 Table 1 provides a full listing of park site visitation statistics. (For a full reference to question wording and order, please see Appendix A.) Table 1
FOUR COUNTY REGION*
Visited more
than 12 months ago
Visited within last 12 months
Never visited
Don’t know
Total Alcatraz 42% 10% 48% -- 100% Baker Beach 38% 20% 41% 1% 100% Bolinas Ridge 21% 12% 63% 4% 100% China Beach 29% 17% 52% 2% 100% Cliff House 42% 32% 26% 1% 101% Crissy Field 27% 33% 39% 2% 101% Fort Baker 28% 22% 47% 3% 100% Fort Funston 24% 18% 55% 3% 100% Fort Mason 33% 32% 33% 2% 100% Fort Point 23% 17% 56% 3% 99% Land’s End 17% 15% 65% 3% 100% Milagra Ridge 3% 3% 90% 5% 101% Marin Headlands5 22% 36% 41% 1% 100% Muir Beach 34% 25% 38% 3% 100% Muir Woods 40% 27% 32% 1% 100% Ocean Beach 29% 39% 29% 3% 100% Olema Valley 13% 15% 71% 2% 101% Phleger Estate 3% 1% 92% 4% 100% Presidio 6 27% 49% 23% 1% 100% Rodeo Beach 10% 11% 76% 3% 100% Stinson Beach 39% 32% 29% 1% 101% Sutro Heights Parks and Baths 23% 18% 58% 1% 100% Sweeney Ridge 5% 4% 88% 4% 101% Tennessee Valley 11% 16% 72% 2% 101%
* Totals may not equal 100% due to rounding.
The sites visited by the largest proportion of respondents are Presidio (76%), Cliff House (74%), Stinson Beach (71%), Ocean Beach (68%), and Muir Woods (67%). Presidio was visited by 49 percent of respondents within the last 12 months, followed by Ocean Beach (39%), Marin 4 Items of particular interest or salience are presented in italicized format for better identification. 5 Marin Headlands include all Marin Headlands except Rodeo Beach. These other subsites are separately identified due to nature of their identity within the park. 6 Presidio site above includes all Presidio lands except Baker Beach and Crissy Field.

Public Opinion Research Telephone Survey Regarding GGNRA Pet Management Issues
The Social Research Laboratory, Northern Arizona University 15
Headlands (36%), Crissy Field (33%), and the Cliff House, Fort Mason, and Stinson Beach each at (32%). Respondents who had visited a GGNRA site within the last 12 months were asked for the total number of visits they had made in the last 12 months. Responses ranged from one visit to 500 visits with an average number of 28 visits and a median number of eight visits per respondent made in the last 12 months. People from San Francisco County had the highest average number of visits with 55 visits per respondent and people from Alameda County had the lowest average number of visits with nine visits per respondent. For a comprehensive listing of GGNRA park sites visited by each county’s respondents, see the Annotated Questionnaire in Appendix A. Individual park visitation by each respondent was recoded into a broader classification to better represent park visitorship. Overall, five percent of residents have never visited a GGNRA site or don’t know if they have ever visited a GGNRA site. Twenty-three percent of residents were classified as “low visitorship.” This group has visited a GGNRA site in their lifetime but not within the last 12 months. Nearly 30 percent (29%) of respondents were classified as “medium visitorship.” These residents said they had visited a GGNRA site up to five times within the last 12 months. Those residents classified as “high visitorship” – more than five visits to a GGNRA site within the last 12 months – comprise the largest group of respondents. Forty-four percent of residents fall within this classification. Similar to the breakdown of park visits by county above, San Francisco County had the largest percentage of high visitorship with 36 percent of residents stating they had visited a GGNRA site more than five times in the last year. Marin County had the second highest percentage of high visitorship with 30 percent of residents having more than five visits in the last 12 months (see Table 2). For a full comparison of questions by visitor status, see Appendix C.
*All respondents
Table 2* Visitation to Park Units by Region
Never visited
Low visitorship
Medium visitorship
High visitorship
Total
4-County Area 5% 23% 29% 44% 101% Visitation to Park Units by County
Alameda 63% 44% 30% 17% 29% Marin 6% 7% 21% 30% 21%
San Francisco 10% 15% 17% 36% 25% San Mateo 22% 34% 32% 18% 26%
Total 101% 100% 100% 101% 101%

Public Opinion Research Telephone Survey Regarding GGNRA Pet Management Issues
The Social Research Laboratory, Northern Arizona University 16
Semi-Annual
31%
Daily19%
Weekly20%
Monthly22%
No dogs72%
2+ dogs7%
1 dog22%
Dog Ownership and Care
All respondents were asked if they currently own or care for one or more dogs. Twenty-two percent of respondents throughout the four- county area say they own or care for one dog and seven percent of respondents own or care for more than one dog. Marin County residents are more likely to own or care for a dog (35%) than San Mateo residents (32%), Alameda residents (31%), and San Francisco residents (19%). Women in the four-county area are somewhat more likely than men to say they own or care for a dog (31% vs. 25%), and overall, individuals with higher incomes are more likely to own or care for a dog. Residents earning less than $50,000 annually are less likely to own or care for a dog (19%) than residents earning over $100,000 annually (44%). Dog ownership is spread fairly equally across low and high visitorship levels (32% and 31%) but only 14 percent of those who have not visited a GGNRA site say they own a dog. Respondents owning or caring for one or more dogs were asked for the total number of dogs under their care. Twenty-three percent of dog-owning respondents have more than one dog. The highest number of dogs owned or cared for by any member of this population subset is five. Women are more likely to own or care for multiple dogs (28% of female dog owners/care givers) than men (16% of male dog owners/care givers). Younger (ages 18-44) dog owner/care givers are three times more likely to care for multiple dogs (29%) than older (ages 65+) dog owner/care givers (11%). Dog Owner Use of GGNRA Sites All dog owners and caregivers (28% of all respondents) were asked a series of questions regarding their use of GGNRA sites.7 Respondents were first asked if they had ever taken their dog(s) for a walk in a GGNRA site. Half of dog-owning respondents (50%, or 14% of all respondents) say they have walked their dog(s) in a GGNRA site while the same proportion of respondents have not taken their dog to a GGNRA site (50%). Among those who do walk dogs in a GGNRA park site, one in five visit a GGNRA site daily or weekly (19% and 20% respectively), 22 percent visit the site with their dog(s) monthly, and almost one-third (31%) visit with their dog(s) semi-annually. High visitation residents are the most likely to make use of GGNRA sites for dog walking with 66 percent saying they have taken their dog(s) for a walk in a GGNRA site. Medium and high visitation residents also report the most frequent use of the park (28% and 20% daily use, 12% and 26% weekly use). More male than female dog owners have visited a GGNRA site with their dog(s) (61% vs. 41%). Over half (54%) of Asian American dog owners have visited a GGNRA site with their dog(s), 7 Dog owner/care givers will be referred to as dog owners throughout the report.
All respondents
Dog owners walking dogs in a GGNRA site (n=223)

Public Opinion Research Telephone Survey Regarding GGNRA Pet Management Issues
The Social Research Laboratory, Northern Arizona University 17
and slightly less than half (47%) of white residents have taken their dog(s) to a GGNRA site. African Americans are least likely to have taken a dog to a GGNRA site (33%). A larger proportion of dog-owning respondents living in San Francisco (75%) and Marin counties (69%) have taken dogs to GGNRA sites than dog owners living in San Mateo (44%) or Alameda (29%) counties.
As part of this series of cascading questions, dog owners were also asked if they ever had someone else take their dog(s) for a walk in a GGRNA site. Almost one-fifth of dog-owning residents (18%, n=81), or 5 percent of the total population, have had someone else take their dog(s) for a walk in a GGNRA site. Next, this subset of the respondent population (who did have their dog walked by others) was asked if they had ever hired a commercial dog walker to take a dog(s) to a GGNRA site. One in five (20%) dog owners who have taken their dog(s) for a walk in a GGNRA site have had their dog(s) taken to a GGNRA site by a commercial dog walker. Twenty percent of this population subset translates into one percent (1%) of all survey respondents having had their dog(s) taken to a GGNRA site by a commercial dog walker (n=16). Experience With Dogs Off-leash All GGNRA visitors were asked if they had ever seen a dog allowed off- leash by another visitor at a GGNRA site. Over half of visitors living in the four-county region (52%) say they have seen a dog off-leash at a GGNRA park site (39% have not seen a dog off-leash, 9% were unsure). GGNRA visitors living in San Francisco and Marin counties are more likely to have seen a dog off- leash (75% and 71%, respectively) than visitors living in San Mateo (44%) or Alameda counties (42%). Visitors who have seen dogs off- leash were asked how a dog being off- leash affected their visitor experience: did dogs off- leash add to their experience, detract from their experience, or have no effect on their experience? Twenty-seven percent of visitors who have seen dogs off-leash report that off-leash dogs added to their experience and 22 percent say dogs off-leash detracted from their experience. Nearly half of visitors who have seen dogs off-leash in a GGNRA site (49%) believe dogs off-leash had no impact on their experience. The largest proportion of visitors from each county who have seen dogs off- leash in a GGNRA site say off-leash dogs had neither a positive nor negative effect upon their experience within the GGNRA park site. Experiences with off- leash dogs vary little across three of the four counties. Close to one-third of Alameda (32%), Marin (30%), and San Francisco (34%) County visitors who have seen dogs off- leash in a GGNRA site view their experiences with off- leash dogs positively. Twenty-five percent of Alameda residents responding to this question, 26 percent of Marin residents, and 20 percent of San Francisco residents said that their encounters with dogs off- leash detracted from their experience. San Mateo visitors who have seen a dog off- leash at a GGNRA site are least likely to describe their encounter with an off- leash dog as adding to their experience (19%). San Mateo residents within the population subset are most likely to describe their experiences with off- leash dogs in GGNRA sites as not affecting their experience (61%), compared to 45 percent, 44 percent, and 40 percent of people in this population subset living in the other counties.

Public Opinion Research Telephone Survey Regarding GGNRA Pet Management Issues
The Social Research Laboratory, Northern Arizona University 18
Younger visitors (18-44) are more likely to say that off- leash dogs added to their experiences (36%) than older visitors (20% reported a negative experience, 56% report no effect on their experience). Twenty-one percent of visitors ages 45-64 and 18 percent of visitors 65 years of age and older say off- leash dogs added to their experience at a GGNRA site. More visitors ages 45-64 report having a negative experience (31%), followed by visitors 65 and older (20%). See Figure 1 or Appendix C for a detailed portrait of visitors’ experiences with off- leash dogs in a GGNRA park site. Dog ownership is related to one’s personal experience with off- leash dogs in GGNRA park sites. Dog owners who have visited a GGNRA site and have seen a dog off-leash are more likely to view their interaction with off-leash dogs as adding to their experience than non-owners in the same population subset (37% vs. 23%). Non-dog owners are three times more likely than dog owners in this population subset to believe that off-leash dogs detracted from their experience in a GGNRA park site (28% vs. 9%) (see Table 3).
Table 3 How did dog(s) off-leash affect visitor experience? *
Dog Owner Does Not Own Dog Total
Added to 37% 23% 27% (n=217) Detracted from 9% 28% 22% (n=174) Did not affect 54% 47% 49% (n=393) Don’t know 1% 2% 2% (n=13) Total 101% 100% 100% (n=798)
*GGNRA visitors who have seen a dog off-leash in a GGNRA Almost one-quarter (24%) of those who frequent a GGNRA site often (high visitation) and just less than one quarter (22%) of those who occasionally visit the GGNRA (low visitation), report having a negative experience. Respondents who reported having a positive or negative experience with off- leash dogs were given an opportunity to say how off- leash dogs affected their experience. Following are a few of the verbatim quotes provided by respondents describing their experiences with off- leash dogs in GGNRA park sites. (See Appendix B for a full listing of open-ended responses to this question.)

Public Opinion Research Telephone Survey Regarding GGNRA Pet Management Issues
The Social Research Laboratory, Northern Arizona University 19
Positive Experiences • It is wonderful to play with other people’s dogs. • The dogs visually add to the park. • It’s wonderful to exercise dogs; builds community with other dog walkers. • The dogs are usually well behaved and nice to have around. • I like dogs being able to play together and it is hard to throw a ball for a dog on a leash. • I love dogs and I think dogs are less aggressive off- leash. • Dogs have more freedom, which gives them a chance to play with other dogs. Negative Experiences • I have been the victim of a Rottweiler attack, so anytime I see a large dog off- leash, it
makes me a little more cautious, nervous. • Noisy, messy, and worry about chasing wildlife and threatened by them. • We have a problem with people who own dogs and want them to have the same rights as
people; they think they have the right to let them run rampant without concern for the environment.
• When you have small children, the dogs are a problem; our daughter was carried on
Ocean Beach and got knocked over; dogs have taken something from the kids and poop everywhere.
• We keep our dog on a leash because other dogs are aggressive. • Some owners do not know where their dogs have run off; when I am hiking, dogs bother
me. • Dog poop is left on the ground, and at picnics dogs sniff at your food.

Public Opinion Research Telephone Survey Regarding GGNRA Pet Management Issues
The Social Research Laboratory, Northern Arizona University 20
Figure 1: Visitor Experiences With Off-Leash Dogs in a GGNRA Park Site
29%
31%
17%
24%
29%
26%
30%
62%
50%
37%
48%
64%
53%
54%
49%
50%
61%
49%
39%
14%
19%
30%
12%
17%
21%
24%
30%
22%
22%
26%
22%
46%
25%
36%
25%
20%
19%
34%
32%
27%
16%
15%
61%
44%
45%
44%
41%
21%
19%
20%
25%
0% 10% 20% 30% 40% 50% 60% 70% 80% 90% 100%
< HS
HS Degree
Some College
College Degree
Post College
< $25K
$25K-$50K
$50K-$75K
$75K-$100K
>$100K
Women
Men
San Mateo
San Fran
Marin
Alameda
Region
Percent of GGNRA visitors who have seen a dog off-leash at a GGNRA park site(49% of total respondents; n=797)
Added to visit Did not affect visit Detracted from visit

Public Opinion Research Telephone Survey Regarding GGNRA Pet Management Issues
The Social Research Laboratory, Northern Arizona University 21
Familiarity with NPS Pet Management Regulations Survey participants were asked about familiarity with present National Park Service regulations regarding dog leash laws at GGNRA park sites (see Figure 2). Half of respondents (50%) said they are familiar with current NPS leash laws and 47 percent said they are not familiar with these rules. Marin County residents (61%) are more likely to say they are familiar with these regulations than residents of other counties (San Francisco County - 56%; Alameda County - 46%; San Mateo County - 36%). Thirty-seven percent of Marin residents, 44 percent of San Francisco residents, 52 percent of Alameda residents, and 60 percent of San Mateo residents say they are not familiar with present NPS dog leash laws. Women and men report similar levels of familiarity with NPS pet management regulations (52% and 49%, respectively, with 46% of women and 49% of men unfamiliar with the regulations). Older residents are generally more aware of these laws than younger residents (62% of 65+; 47% of 45-64; and 46% of 44 and younger are familiar; 37% of 65+; 49% of 45-64; and 53% of those under 44 are unfamiliar with the current regulations). Dog owners are more likely than respondents without dogs to be familiar with leash laws (63% vs. 46%, respectively, with 35% of dog owners and 52% of those without dogs unfamiliar with the regulations). Residents who visit GGNRA sites frequently are much more likely to be familiar with leash laws than those who don’t visit or have low visitorship. Sixty-two percent of high visitation residents report being familiar with current regulations as compared to 47 percent of medium visitation residents, 40 percent of low visitation residents and 18 percent of nonvisitors. Opinions Regarding Current Leash Regulations Respondents were read the statement, “Current NPS regulations allow for walking dogs on- leash at most GGNRA sites AND prohibit any off- leash dog walking,” and asked if they support or oppose this current regulation. Nearly three-quarters of all respondents from the four-county area (71%) support the current dog walking regulation and 23 percent oppose the current regulation (see Figure 3). Focusing on respondents with strong feelings toward the issue, the population of respondents who “strongly support” the current regulation (45%) is almost 4 times as large as the population of respondents “strongly opposed” to the current regulation (12%). Levels of support and opposition to current NPS pet management regulations vary across counties. San Mateo County respondents express the highest proportion of support for current regulations (76%), followed by Alameda with 72 percent support. Fewer respondents from Marin and San Francisco counties support current leash regulations (67% and 63%,
51% 46%
61%56%
36%
0%
20%
40%
60%
80%
100%
Region Alameda Marin San Fran SanMateo
*All Respondents
Figure 2: Familiarity with NPSPet Management Regulations

Public Opinion Research Telephone Survey Regarding GGNRA Pet Management Issues
The Social Research Laboratory, Northern Arizona University 22
respectively). Women (75%), older respondents (75%), and people who do not own a dog (73%) express greater support for the regulation than men (66%), younger people (69%), and dog owners (63%). People who visit GGNRA are stronger in their support of allowing on- leash dog walking than those who don’t visit GGNRA sites. Fifty-four percent of low visitation residents, 46 percent of medium visitation residents and 41 percent of high visitation residents strongly support continuing to allow dogs on- leash in the park.
Figure 3: Attitudes Toward Current Leash Regulations
39%
53%
52%
38%
48%
37%
44%
45%
30%
23%
22%
23%
28%
25%
26%
26%
11%
15%
9%
12%
10%
12%
15%
11%
13%
12%
12%
14%
9%
21%
14%
12%
48%
40%
44%
45%
28%
22%
23%
28%
8%
8%
12%
10%
11%
8%
14%
15%
0% 10% 20% 30% 40% 50% 60% 70% 80% 90% 100%
Ages 18-44
Ages 45-64
Ages 65+
Women
Men
Non-Owner
Dog Owner
San Mateo
San Fran
Marin
Alameda
Region
All Respondents
Strongly Support Somewhat Support Somewhat Oppose Strongly Oppose

Public Opinion Research Telephone Survey Regarding GGNRA Pet Management Issues
The Social Research Laboratory, Northern Arizona University 23
Additional Limitations to On-Leash Dog Walking Respondents were queried about their attitudes toward imposing additional limits to on- leash dog walking in the GGNRA. One-third of residents (33%) want to further limit the number of sites in which on-leash dog walking is allowed, with 19 percent “strongly in favor” of this regulation change and 14 percent “somewhat in favor” of this change. A much larger group opposes reducing the number of sites available for on-leash dog walking. Over half of respondents (55%) do not want to see a reduction in the number of sites where on- leash dog walking is allowed; 27 percent “somewhat oppose” this change and 28 percent “strongly oppose” further limitations. Eleven percent of respondents are unsure of their position on this issue. (See Figure 4 for a detailed demographic analysis of responses to this question.) Figure 4 portrays regional differences in support and opposition to further limiting dog walking. Alameda residents support additional limitations more frequently than residents from the other three counties, with 22 percent who “strongly support” and 15 percent who “somewhat support” further limiting the areas that on-leash dog walking can take place. Fifty-four percent of Alameda residents oppose further limitations on dog walking with 24 percent “somewhat opposed” and 30 percent “strongly opposed” to an increase in limits. Residents of San Mateo, Marin, and San Francisco counties are close in their positions with slightly more than one-third (33%) of San Mateo residents and 30 percent of San Francisco and 25 percent of Marin residents supporting additional on-leash limitations. In contrast, 58 percent of San Mateo residents, 59 percent of San Francisco residents, and 64 percent of Marin residents either “strongly” or “somewhat oppose” further limiting on- leash dog walking in the GGRNA. Males and females responded similarly to additional limitations on on-leash dog walking. Approximately one-third of men and women (34% and 32%, respectively) support further restrictions, with slightly more women in opposition to further restrictions (61%) than men (51%). Those who don’t visit GGNRA sites or who visit infrequently are more likely to support reducing the number of GGNRA sites where on- leash dog walking is permitted than those who visit somewhat or very frequently. Fifty-one percent of nonvisitors strongly or somewhat support a reduction in sites for on- leash dog walking while 27 percent of very frequent visitors want to see a reduction in the number of GGNRA sites where on- leash dog walking is allowed. Dog owners are more strongly opposed to limiting sites where dogs can be walked on-leash than non-owners. Seventy percent of respondents with dogs do not want to see a reduction in the number of GGNRA sites where on- leash dog walking is permitted. Half of respondents who do not own dogs oppose this reduction. On the other side of the coin, 37 percent of non-dog owners want to see increased site limitations for on- leash dog walking, while one-quarter of dog owners support this option. Cross-tabulations by income and education suggest individuals having less than a high school degree are twice as likely to support increased limits on on- leash dog walking, as compared to those with a college degree or more than a college degree (66% vs. 31%, respectively). Residents earning $50,000 a year or less are more supportive of reducing the number of sites on-leash dogs can visit (40%) than residents earning $50,001 - $100,000 a year (28%) and residents who earn more than $100,000 a year (29%).

Public Opinion Research Telephone Survey Regarding GGNRA Pet Management Issues
The Social Research Laboratory, Northern Arizona University 24
Figure 4:
Attitudes Toward Additional Limits For On-Leash Dog Walking
17%
19%
20%
22%
21%
14%
14%
16%
20%
18%
13%
21%
19%
27%
14%
12%
9%
20%
18%
12%
15%
13%
12%
16%
12%
15%
12%
14%
30%
19%
36%
28%
23%
25%
30%
30%
33%
28%
32%
23%
30%
26%
31%
30%
24%
27%
5%
22%
25%
32%
35%
23%
24%
34%
30%
34%
29%
28%
40%
24%
29%
28%
50%
16%
18%
16%
22%
15%
16%
16%
9%
15%
26%
27%
30%
38%
0% 10% 20% 30% 40% 50% 60% 70% 80% 90% 100%
< HS
HS Degree
Some College
College Degree
Post College
< $25K
$25K-$50K
$50K-$75K
$75-$100K
$100K+
Women
Men
Dog Owner
Non-Owner
San Mateo
San Fran
Marin
Alameda
Region
All Respondents
Strongly Support Somewhat Support Somewhat Oppose Strongly Oppose

Public Opinion Research Telephone Survey Regarding GGNRA Pet Management Issues
The Social Research Laboratory, Northern Arizona University 25
Support for or Opposition to Off-Leash Dog Walking GGNRA is interested in understanding attitudes of residents of the four-county area toward off-leash dog walking. All survey respondents were asked specifically (in Question 13) if they support or oppose allowing off- leash dog walking in GGNRA sites. Forty percent of respondents from the four-county area say they support allowing dogs off-leash (see Figure 5). Seventeen percent of all respondents say they “strongly support” off-leash dog walking and almost one-quarter (23%) of respondents say they “somewhat support” off-leash dog walking. Just over half of respondents oppose off-leash dog walking (53%); 17 percent “somewhat oppose” off-leash dog walking in GGNRA sites and 36 percent “strongly oppose” off-leash dog walking in GGNRA sites. Seven percent of residents are unsure whether they support or oppose off- leash dogs in GGNRA park sites. One-half of dog owners (51%) say they support off-leash dog walking in GGNRA sites and 45 percent oppose off-leash dog walking in GGNRA sites. Thirty-five percent of non-owners support off-leash dog walking in GGNRA sites and 56 percent oppose it. Residents who visit GGNRA sites very frequently are more likely to support off-leash dog walking than people who rarely or never visit GGNRA sites. Almost half of residents with high visitorship (49%) strongly or somewhat support allowing dogs off-leash while 28 percent of low visitorship residents and 18 percent of nonvisitors support off-leash dogs.

Public Opinion Research Telephone Survey Regarding GGNRA Pet Management Issues
The Social Research Laboratory, Northern Arizona University 26
Figure 5: Attitudes Toward Off-Leash Dog Walking
20%
16%
19%
20%
12%
25%
19%
20%
20%
29%
12%
19%
17%
19%
27%
27%
18%
28%
24%
28%
19%
24%
22%
22%
23%
27%
22%
23%
21%
17%
16%
15%
13%
16%
20%
17%
16%
16%
17%
17%
15%
17%
42%
31%
34%
39%
29%
38%
31%
34%
36%
38%
34%
29%
39%
32%
36%
15%
15%
13%
22%
19%
11%
25%
21%
19%
7%
20%
18%
19%
16%
45%
43%
34%
34%
0% 10% 20% 30% 40% 50% 60% 70% 80% 90% 100%
< HS
HS Degree
Some College
College Degree
Post College
< $25K
$25K-$50K
$50K-$75K
$75-$100K
$100K+
Women
Men
Dog-Owner
Non-Owner
San Mateo
San Fran
Marin
Alameda
Region
All Respondents ("Don't Know" responses not included)
Strongly Support Somewhat Support Somewhat Oppose Strongly Oppose

Public Opinion Research Telephone Survey Regarding GGNRA Pet Management Issues
The Social Research Laboratory, Northern Arizona University 27
Opinions of Residents Who Support Off-Leash Dog Walking Respondents supportive of off-leash dog walking (639 respondents out of 1600, or 40% of all respondents) were asked a series of questions probing specific preferences.8 This subset of survey participants were read two options and asked to specify which option they most prefer: “First, do you prefer allowing dogs off- leash in ALL areas where on- leash walking is now allowed –OR– do you prefer allowing dogs off- leash ONLY in limited areas?” One in five off- leash supporters (20%, or 8% of all survey respondents) would like to see dogs able to be off- leash in ALL areas where on-leash dog walking is currently allowed. Three-quarters of those respondents supportive of off-leash dog walking (74%, or 30% of all survey respondents) prefer to have off-leash dog walking only in limited areas (see Figure 6). Residents who visit GGNRA sites most frequently expressed the strongest support (24%) while those who visit somewhat frequently or infrequently expressed lower levels of support (15% and 18% respectively). Nonvisitors expressed the lowest level of support (15%) for allowing dogs off-leash in areas where on-leash dog walking is currently allowed. Within the four-county area, of those supporting off- leash dog walking, support for allowing it only in limited areas ranges from a high of 82 percent in Alameda County (34% of all Alameda County respondents) to 69 percent from Marin County residents (29% of all Marin County respondents). Just over three-quarters of San Mateans (78%, or 26% of all San Mateo County respondents) and just under three-quarters of San Franciscans (72%, or 33% of all San Francisco County respondents) support this option. Within the four counties, 26 percent of San Francisco County residents who support off- leash dog walking (12% of all San Francisco County respondents) prefer to see off- leash dogs allowed anywhere that on- leash dogs are currently allowed. Nearly as many Marin County residents share this view (24%, or 10% of all Marin County respondents), along with San Mateo residents (20%, or 7% of all San Mateo respondents). Alameda residents who support off- leash dog walking are less likely to support allowing off- leash dog walking in all areas where on- leash dog walking is currently allowed (15%, or 6% of all Alameda respondents). One percent or less of residents from each of the four counties did not prefer either option. There is no difference between males and females in preferences between the two options, nor are there distinct differences between age groups. Individuals from different educational and income levels differ in their preferences for off- leash dog walking. Supporters of off- leash dog walking who have a lower level of education are divided in their support for where to walk dogs off- leash, but are more likely to prefer off- leash walking in all areas where on- leash walking is currently allowed, compared to more educated supporters of off- leash dog walking. As income levels increase, so does support for allowing off- leash dogs in all areas that now allow for on-leash dog walking. A majority of off-leash dog walking supporters who own dogs (66%, or 34% of all dog owners) and who do not own dogs (79%, or 28% of all non-dog owners) support allowing off-leash dog walking only in limited areas. However, dog owners are more than twice as likely to prefer off- leash dog walking in all areas currently designated for on- leash dog walking than people who do not own dogs (32% vs. 14%, or 16% of all dog owners vs. 5% of people who do not own dogs).
8 The margin of error associated with a sample of 640 respondents is +/- 4.0% at a 95% confidence level.

Public Opinion Research Telephone Survey Regarding GGNRA Pet Management Issues
The Social Research Laboratory, Northern Arizona University 28
Figure 6: Preferences for Where to Walk Dogs Off-Leash
14%
18%
29%
14%
27%
24%
25%
22%
19%
20%
32%
14%
26%
20%
71%
82%
73%
68%
85%
76%
71%
63%
78%
77%
72%
66%
72%
74%
56%
14%
35%
9%
21%
20%
24%
15%
23%
44%
73%
76%
65%
83%
79%
78%
69%
82%
0% 10% 20% 30% 40% 50% 60% 70% 80% 90% 100%
< HS
HS Degree
Some College
College Degree
Post College
< $25K
$25K-$50K
$50K-$75K
$75-$100K
$100K+
Other Race
Asian
Black
White
Women
Men
Dog-Owner
Non-Owner
San Mateo
San Fran
Marin
Alameda
Region
Respondents Supportive of Off-Leash Dog-Walking (40% of all respondents; n=639)
In All On-Leash Areas Limited Areas

Public Opinion Research Telephone Survey Regarding GGNRA Pet Management Issues
The Social Research Laboratory, Northern Arizona University 29
Figure 7: Should There Be Limits on
the Number of Dogs walked?
52%
63%
61%
59%
56%
58%
41%
33%
27%
32%
38%
35%
48%
54%
67%
61%
46%
47%
29%
30%
0% 20% 40% 60% 80% 100%
18-44
45-64
65+
Male
Female
San Mateo
San Fran
Marin
Alameda
Region
Yes, limit No limit
Preferences for Off-Leash Availability The subset of respondents supporting off- leash dog walking was asked whether they favor off-leash dog walking to be available all of the time or only during limited times. Some of these subsets consist of small numbers of respondents. These cases result in a larger margin of error. Over two-thirds of off-leash supporters (64%, or 25% of all respondents) prefer to see off-leash walking available ALL the time and one-third of off-leash supporters (34%, or 14% of all respondents) would rather see it limited to certain times of the day. Within the subset that favors limiting availability of off- leash dog walking, 38 percent (or 5% of all respondents) prefer to have off- leash dog walking limited by both time and day, 35 percent prefer hourly limitations (5% of all respondents), and 23 percent want to see off- leash dog walking limited by day (3% of all respondents). This subset of respondents preferring limits to off- leash dog walking were further questioned about preferences within those limitations. Respondents wanting to see time of day restrictions for off- leash walking were asked what time of day they preferred limiting the hours; only morning hours (23%, or 2% of all respondents), only afternoon hours (6%, or 1% of all respondents), only evening/dusk hours (21%, or 2% of all respondents), or no limit on hours/available at all times (39%, or 4% of all respondents). Among respondents preferring limiting the days for off- leash dog walking, 37 percent (or 3% of all respondents) say off- leash dog walking should only be on weekdays, 11 percent (1% of all respondents) say only weekends, and 46 percent (4% of all respondents) say limits should be on both weekdays and weekends. High and medium frequency visitors are most supportive of allowing dogs off- leash all the time (65% and 71%, respectively). Limit the Number of Dogs Walked? All survey respondents were asked if there should be a limit on the number of dogs walked by any one person at any one time in GGRNA sites (this includes on and off- leash dogs). Overall, most respondents (58%) think that there should be a limit on the number of dogs walked by a single person in a GGNRA site. Marin and Alameda County residents (67% and 61%) are somewhat more likely to prefer limits on the number of dogs any one person can walk at a time than residents from San Mateo and San Francisco (54% and 48%). Middle age and older (45+) residents are more supportive of limiting how many dogs a person can walk than
All Respondents

Public Opinion Research Telephone Survey Regarding GGNRA Pet Management Issues
The Social Research Laboratory, Northern Arizona University 30
residents ages 18 to 44 (61% and 63% compared to 52%) (see Figure 7). A similar number of males and females want to see limits (59% and 56%) as those who don’t want limits applied (32% and 38%). Nonvisitors and infrequent visitors expressed the highest interest in limiting the number of dogs walked (72% and 61%) while more frequent visitors expressed lower interest in limits (medium visitation, 54% and high visitation, 57%). Of those respondents who prefer limits on the number of dogs walked, forty percent (23% of all respondents; n=364) say that two is highest number of dogs a person should be allowed to handle. Just over one quarter (28%, or 16% of all respondents; n=256) of respondents who support a limit say three dogs is enough and a smaller proportion prefer a limit of either one dog or four dogs (13% and 9%, respectively, or 8% and 5% of all respondents; n=120 and n=79). Six percent (4% of all respondents; n=58) say five dogs should be the limit (see figure 7a). Figure 7a: Breakout of dog walking limits
The Mission of the GGRNA and Off-leash Dog Walking As an introduction to Question 17, all respondents were read an abbreviated version of the NPS GGNRA mission statement: “The mission of the Golden Gate National Recreation Area is the preservation, unimpaired, of the natural and cultural resources, and scenic and recreation values, of the park for present and future generations to enjoy.”
After hearing the mission statement, respondents were asked if they “support” or “oppose” off-leash dog walking in GGNRA sites. Over half of all respondents in the four-county area (58%) oppose off-leash dog walking after hearing the GGNRA mission statement. Forty-one percent of respondents “strongly oppose” off-leash dog walking and 17 percent “somewhat oppose” off-leash dog walking. Opposition to off- leash dog walking varies across the four counties with Alameda County having the highest number of residents either “strongly” or “somewhat opposed” to off- leash dog walking (60%). In San Francisco County, slightly less than half of respondents (48%) oppose off- leash dog walking; 33 percent of San Francisco respondents “strongly oppose” and 15 percent “somewhat oppose” this option.
Respondents who prefer to limit the number of dogs walked (n=917)
Three Dogs28%
Two Dogs40%
Five Dogs6%Four Dogs
9%
One Dog13%
120 8% 13%364 23% 40%256 16% 28%
79 5% 9%58 4% 6%39 2% 4%
917 57% 100%
1 0%682 43%683 43%
1600 100%
123
45+Don't knowTotal
RefusedSystem skipTotal
Total
N PercentValid
Percent

Public Opinion Research Telephone Survey Regarding GGNRA Pet Management Issues
The Social Research Laboratory, Northern Arizona University 31
Respondents who do not own dogs are much more likely than dog owners to oppose off- leash dog walking (63% vs. 45%, respectively). Women are more likely (62%) than men (55%) to oppose off- leash dog walking. Age also plays an important role in whether someone supports or opposes off- leash dog walking. Residents 65 years of age or older are more likely to oppose off-leash dog walking (65%) than 18 to 44 year olds (52%). Residents who visit GGNRA sites very frequently or somewhat frequently are more supportive of allowing off- leash dog walking (43% and 36%, respectively) than low frequency visitors and nonvisitors (28% and 16%, respectively) after hearing the mission statement again.
Figure 8: Attitudes Toward Off-leash Dog Walking After Hearing GGNRA Mission Statement
19%
12%
14%
21%
15%
17%
10%
32%
20%
16%
23%
19%
18%
25%
24%
16%
19%
22%
20%
21%
25%
20%
17%
16%
20%
22%
14%
19%
19%
16%
19%
14%
14%
15%
17%
35%
43%
46%
34%
36%
38%
43%
39%
45%
31%
41%
24%
11%
20%
22%
18%
25%
17%
15%
14%
20%
42%
33%
44%
40%
0% 10% 20% 30% 40% 50% 60% 70% 80% 90% 100%
Ages 18-44
Ages 45-64
Ages 65+
<$50K
$50K-$100K
>$100K
Women
Men
Non-Owner
Dog Owner
San Mateo
San Fran
Marin
Alameda
Region
All Respondents
Strongly Support Somewhat Support Somewhat Oppose Strongly Oppose

Public Opinion Research Telephone Survey Regarding GGNRA Pet Management Issues
The Social Research Laboratory, Northern Arizona University 32
Respondents not in strong opposition to off-leash dog walking9 (54% of all respondents) were asked follow-up questions examining off- leash options in greater depth. Three off- leash scenarios were presented and respondents were asked if they “support” or “oppose” each option: 1) Allowing off- leash dog walking on trails used by hikers, bikers, or horses; 2) Allowing off- leash dog walking only in designated areas that are separated from other
visitors, and; 3) Allowing off- leash dog walking at public beaches in the GGNRA.
Figure 9: Off-leash Locations
61%70%
40%
56%
27% 37%
3%4%5%
0%
20%
40%
60%
80%
100%
Trails Designated Areas Public Beaches
Support Oppose Don't know
Overall, within the subset of people who do not “strongly oppose” off-leash dog walking, most people (70%, or 37% of all respondents) support allowing off-leash dog walking only in designated areas that are separated from other visitors. Twenty-seven percent of this subset oppose this option (14% of all respondents). Sixty-one percent of this subset (33% of all respondents) support off- leash dog walking at public beaches in the GGNRA park (36% oppose; 19% of all respondents), and 40 percent (21% of all respondents) support off- leash dog walking on trails used by hikers, bikers, or horses (56% or 30% of all respondents oppose this option). High frequency visitors are consistently more supportive of all off- leash options over low frequency visitors and nonvisitors (see Table 4). Table 4
Support Levels (Strong / Somewhat) for Off-Leash Locations by Visitation Levels Nonvisitor Low Visitation Med. Visitation High Visitation Trails 20% 30% 41% 46% Designated Areas 47% 79% 70% 67% Public Beaches 32% 40% 67% 69%
9 Includes “somewhat oppose,” “somewhat support,” and “strongly support” off-leash recreation.
Respondents who do not strongly oppose off-leash dog walking (n=857)

Public Opinion Research Telephone Survey Regarding GGNRA Pet Management Issues
The Social Research Laboratory, Northern Arizona University 33
Those respondents who did not “strongly oppose” off- leash dog walking in GGNRA sites (as well as those who had no opinion or refused to answer) were asked three follow-up questions as to what areas in which they would support off- leash dogs. This subset (54% of all respondents, n=857) was asked their support for off- leash dogs on park beaches, separate designated areas and multi-use trails. Levels of support for different off- leash dog walking locations vary by county. Fifty-two percent of San Francisco County respondents answering this question support off- leash dog walking on trails used by hikers, bikers, or horses (31% of all respondents), 44 percent of Marin County respondents (22% of all Marin County respondents) support this option, and 34 percent of both Alameda County and San Mateo County respondents support this option (19% of all Alameda County respondents and 17% of all San Mateo County respondents). Seventy-seven percent of San Mateo respondents answering this question (38% of all San Mateo County respondents) support allowing off- leash dog walking only in designated areas that are separated from other visitors, 70 percent of Alameda County respondents (40% of all Alameda County respondents) support this option, while 65 percent of respondents from Marin County (33% of all Marin County respondents), and 63 percent of San Francisco County respondents (38% of all San Francisco County respondents) support this option. Support for allowing off- leash dog walking at public beaches in the park varies from 74 percent among San Francisco County respondents (45% of all San Francisco County respondents) to 68 percent of respondents from Marin County (34% of all Marin County respondents), 59 percent of respondents from San Mateo County (29% of all San Mateo County respondents), and 54 percent of respondents from Alameda County (31% of all Alameda County respondents). Discussion A central question running throughout the GGNRA telephone study involves an understanding of public opinion regarding National Park Service pet management regulations. Information central to this question is found in responses to Questions 11, 13, and 17 (see Annotated Questionnaire in Appendix A). Each of these questions probes attitudes toward dog walking in GGNRA park sites, although the questions approach this topic from different directions. Question 11: Current regulations allow for walking dogs on- leash at most GGNRA sites and prohibit any off- leash dog walking. Do you support or oppose this current regulation? Question 13: Do you support or oppose allowing off- leash dog walking in GGNRA sites? Question 17: “The mission of the Golden Gate National Recreation Area is the preservation, unimpaired, of the natural and cultural resources, and scenic and recreation values of the park for present and future generations to enjoy.” Knowing this, do you support or oppose allowing off-leash dog walking in GGNRA sites? Question 11 is framed as a referendum on current GGNRA policy. Hearing the policy, seven out of ten people (71%) in the four-county region surrounding GGNRA park sites express their support for the dog walking regulations, while nearly one-quarter oppose this regulation (23%). Nearly half of all respondents express “strong support” for current regulations (45%) as compared to the proportion of residents who “strongly oppose” this regulation (12%). A review

Public Opinion Research Telephone Survey Regarding GGNRA Pet Management Issues
The Social Research Laboratory, Northern Arizona University 34
of the data presented above indicates that support for the current regulations is consistent throughout each of the four counties and among every demographic subset including dog owners. Questions 13 and 17 approach the question of dog walking regulations from different directions. Question 13 asks specifically about attitudes toward off- leash dog walking without a context of current policy that does not allow off- leash dog walking. This is a theoretical question framed without a contextual understanding of consequences inherent in adopting one position or another. When framed in this more hypothetical manner, a majority of people in the four-county area (53%) say they oppose off- leash dog walking in GGNRA sites. Notable in the response to this question is the intensity of opposition. More than one-third of the public (36%) “strongly oppose” off- leash dog walking in GGNRA sites. Forty percent of the public supports off- leash dog walking with 17 percent stating they “strongly support” dogs off- leash. Majorities of people in all demographic subsets except for dog owners say they oppose off- leash dog walking in GGNRA sites. Dog owners are divided on this question, with 51 percent supporting off- leash dog walking and 45 percent opposing off- leash dog walking. Question 17 frames the issue of dog walking regulations within the context of the GGNRA mission. After hearing the abbreviated mission statement of the Golden Gate National Recreation Area, people in the four-county area continue to oppose off- leash dog walking in proportions similar to those found in Question 13. Whereas 40 percent of survey respondents supported (strongly and somewhat support combined) off- leash dog walking in Question 13, 36 percent support off- leash dog walking in Question 17. Opposition to off- leash dog walking differs only slightly between the two questions. When the question was first asked, 53 percent of respondents opposed (strongly and somewhat opposed combined) off- leash dog walking, with 36 percent strongly opposing off- leash dog walking. When the question was asked a second time, after hearing the GGNRA mission statement, 58 percent of respondents in the four-county area opposed off- leash dog walking with 41 percent “strongly opposing” off- leash dog walking. The intensity of opposition increased in Question 17 after information about the GGNRA mission was provided. Looking at it from another perspective, 17 percent stated a strong support for off-leash dog walking prior to the reading of the mission statement and 23 percent said they were “somewhat supportive.” After the abbreviated mission statement was presented, most of those who were strongly supportive maintained their position (16%) while those who had been somewhat supportive were slightly more likely to change positions (20%). (See Table 5 for a comparison of data before (Q13) and after the presentation of the abbreviated mission statement.) Table 5
Comparison of Q13 and Q17 responses Q13 Percents & Frequencies Q17 Percents & Frequencies Strongly support 17% N=273 16% N=257 Somewhat support 23% N=366 20% N=324 Somewhat oppose 17% N=265 17% N=276 Strongly oppose 36% N=575 41% N=654 Don’t know 8% N=121 5% N=84

Public Opinion Research Telephone Survey Regarding GGNRA Pet Management Issues
The Social Research Laboratory, Northern Arizona University 35
If pet management regulations are changed to allow for off- leash dog walking, Questions 17-20 (see Annotated Questionnaire) provide valuable information about public preferences for the shaping of new regulations. Of course, one must take into account the number of those strongly opposed to off- leash dog walking and not asked the subsequent questions. Recognizing that, the next series of questions was asked of 54 percent of respondents (n=857) (see Question 17). For this subset, in order of preference, 70 percent of this population support allowing off- leash dog walking only in designated areas that are separated from other visitors (37% of all respondents, n=597). Likewise, 61 percent, of this population support allowing off- leash dog walking at public beaches in the park (33% of all respondents, n= 520). Forty percent of this subset of respondents support allowing off- leash dog walking on trails used by hikers, bikers, or horses (21% of all respondents, n=341), while 56 percent of the same subset oppose allowing off- leash dog walking on these multi-use trails (30% of all respondents, n=476).

Appendix A Annotated Questionnaire

Public Opinion Research Telephone Survey Regarding GGNRA Pet Management Issues
The Social Research Laboratory, Northern Arizona University 36
Appendix A – Annotated Questionnaire
INTRODUCTION Hello, my name is (STATE YOUR FIRST AND LAST NAME) and I am calling from Northern Arizona University. I am not selling anything. We are asking people questions about the Golden Gate National Recreation Area. The purpose of the survey is to help the National Park Service improve its services to you and to people like you. In order for our survey to be most representative, I need to talk to the person currently living in your household who is 18 years of age or older, and who has had the most recent birthday. Would that be you or someone else?
1. Self à Proceed with survey 2. Someone else à Ask to speak with that person; if that person is not home, schedule
callback IF SELF: The Paperwork Reduction Act requires approval of all federal government surveys by the Office of Management and Budget. If you would like to know more about the approval of this survey, I can provide information upon request.* The questions I would like to ask you will only take about 8 minutes to complete. All of your answers are voluntary and confidential. If I should come to any question you prefer not to answer, just let me know and I’ll skip over it, OK?
1. Yes 2. No à PROBE: Is there another time when it would be better to talk to you?
IF SOMEONE ELSE: Hello, my name is (STATE YOUR FIRST AND LAST NAME) and I am calling from Northern Arizona University. I am not selling anything. We are asking people questions about the Golden Gate National Recreation Area. The purpose of the survey is to help the National Park Service improve its services to you and to people like you. The Paperwork Reduction Act requires approval of all federal government surveys by the Office of Management and Budget. If you would like to know more about the approval of this survey, I can provide information upon request. The questions I would like to ask you will only take about 8 minutes to complete. All of your answers are voluntary and confidential. If I should come to any question you prefer not to answer, just let me know and I’ll skip over it, OK?
1. Yes 2. No à PROBE: Is there another time when it would be better to talk to you?
* Additional information provided upon request; see end of annotated questionnaire for full information.

Public Opinion Research Telephone Survey Regarding GGNRA Pet Management Issues
The Social Research Laboratory, Northern Arizona University 37
SURVEY QUESTIONS
Before we begin the survey, I’d like to tell you something about the Golden Gate National Recreation Area. [Read to all respondents.] The Golden Gate National Recreation Area, also known as “GGNRA,” is a system of National Park Service sites in the San Francisco Bay Area stretching 70 miles north and south of the Golden Gate Bridge, creating a 75,500-acre greenbelt along the Pacific Ocean. [Read to all respondents.]
1. Now I would like to read a list of Golden Gate National Recreation Area park sites. Please tell me if you have ever visited each site that I read.1 [Asked of all respondents.]
FOUR COUNTY REGION
Ever visited
Last 12 months
Never visited
Don’t know
Total N
Alcatraz 42% 10% 48% -- 1600 Baker Beach 38% 20% 41% 1% 1600 Bolinas Ridge 21% 12% 63% 4% 1600 China Beach 29% 17% 52% 2% 1600 Cliff House 42% 32% 26% 1% 1600 Crissy Field 27% 33% 39% 2% 1600 Fort Baker 28% 22% 47% 3% 1600 Fort Funston 24% 18% 55% 3% 1600 Fort Mason 33% 32% 33% 2% 1600 Fort Point 23% 17% 56% 3% 1599 Land’s End 17% 15% 65% 3% 1600 Milagra Ridge 3% 3% 90% 5% 1600 Marin Headlands 22% 36% 41% 1% 1600 Muir Beach 34% 25% 38% 3% 1598 Muir Woods 40% 27% 32% 1% 1598 Ocean Beach 29% 39% 29% 3% 1598 Olema Valley 13% 15% 71% 2% 1600 Phleger Estate 3% 1% 92% 4% 1600 Presidio 27% 49% 23% 1% 1600 Rodeo Beach 10% 11% 76% 3% 1599 Stinson Beach 39% 32% 29% 1% 1600 Sutro Heights Parks and Baths
23% 18% 58% 1% 1600
Sweeney Ridge 5% 4% 88% 4% 1600 Tennessee Valley 11% 16% 72% 2% 1600
1 -- = Total percent is less than 1.

Public Opinion Research Telephone Survey Regarding GGNRA Pet Management Issues
The Social Research Laboratory, Northern Arizona University 38
ALAMEDA
Ever visited
Last 12 months
Never visited
Don’t know Total N
Alcatraz 41% 8% 51% -- 400 Baker Beach 25% 8% 65% 2% 400 Bolinas Ridge 18% 6% 73% 3% 400 China Beach 22% 8% 69% 2% 400 Cliff House 39% 19% 41% 1% 400 Crissy Field 24% 15% 58% 3% 400 Fort Baker 26% 12% 61% 2% 400 Fort Funston 15% 10% 74% 1% 400 Fort Mason 32% 19% 48% 1% 400 Fort Point 20% 11% 66% 4% 400 Land’s End 9% 8% 79% 3% 400 Milagra Ridge 3% 2% 94% 2% 400 Marin Headlands 21% 23% 54% 1% 400 Muir Beach 32% 19% 48% 1% 400 Muir Woods 35% 22% 43% 1% 400 Ocean Beach 29% 25% 44% 2% 400 Olema Valley 9% 7% 83% 1% 400 Phleger Estate 2% 1% 96% 1% 400 Presidio 30% 28% 41% 1% 400 Rodeo Beach 8% 7% 84% 1% 400 Stinson Beach 36% 19% 44% 1% 400 Sutro Heights Parks and Baths
13% 9% 77% 1% 400
Sweeney Ridge 3% 1% 95% 1% 400 Tennessee Valley 6% 10% 82% 2% 400

Public Opinion Research Telephone Survey Regarding GGNRA Pet Management Issues
The Social Research Laboratory, Northern Arizona University 39
MARIN
Ever visited
Last 12 months
Never visited
Don’t know Total N
Alcatraz 43% 13% 43% -- 400 Baker Beach 47% 31% 21% 1% 400 Bolinas Ridge 33% 32% 30% 5% 400 China Beach 38% 36% 25% 1% 400 Cliff House 45% 29% 27% -- 400 Crissy Field 31% 43% 25% 1% 400 Fort Baker 32% 42% 25% 2% 400 Fort Funston 27% 14% 54% 5% 400 Fort Mason 34% 43% 22% 1% 400 Fort Point 27% 24% 45% 4% 399 Land’s End 23% 12% 61% 4% 400 Milagra Ridge 3% 2% 89% 6% 400 Marin Headlands 18% 71% 10% 1% 400 Muir Beach 35% 51% 12% 2% 400 Muir Woods 40% 47% 12% 2% 400 Ocean Beach 34% 32% 30% 3% 400 Olema Valley 18% 44% 35% 2% 400 Phleger Estate 2% 1% 91% 6% 400 Presidio 20% 67% 13% -- 400 Rodeo Beach 16% 26% 54% 4% 400 Stinson Beach 27% 64% 8% -- 400 Sutro Heights Parks and Baths
31% 12% 56% 2% 400
Sweeney Ridge 3% 4% 87% 6% 400 Tennessee Valley
25% 46% 28% 1% 400

Public Opinion Research Telephone Survey Regarding GGNRA Pet Management Issues
The Social Research Laboratory, Northern Arizona University 40
SAN FRANCISCO
Ever visited
Last 12 months
Never visited
Don’t know
Total N
Alcatraz 41% 15% 44% -- 400 Baker Beach 39% 43% 18% -- 400 Bolinas Ridge 19% 12% 66% 3% 400 China Beach 33% 24% 43% 1% 400 Cliff House 31% 57% 12% -- 400 Crissy Field 22% 58% 19% 1% 400 Fort Baker 24% 31% 40% 5% 400 Fort Funston 26% 35% 37% 2% 400 Fort Mason 29% 52% 17% 2% 400 Fort Point 21% 28% 50% 1% 400 Land’s End 13% 36% 49% 2% 400 Milagra Ridge 2% 2% 92% 4% 400 Marin Headlands
19% 51% 30% 1% 400
Muir Beach 27% 34% 34% 4% 398 Muir Woods 38% 35% 27% -- 398 Ocean Beach 18% 72% 9% 1% 398 Olema Valley 12% 13% 74% 2% 400 Phleger Estate 2% -- 96% 2% 400 Presidio 17% 74% 9% 1% 400 Rodeo Beach 7% 15% 77% 2% 399 Stinson Beach 38% 40% 22% -- 400 Sutro Heights Parks and Baths
22% 39% 39% 1% 400
Sweeney Ridge 2% 4% 92% 3% 400 Tennessee Valley
9% 20% 71% -- 400

Public Opinion Research Telephone Survey Regarding GGNRA Pet Management Issues
The Social Research Laboratory, Northern Arizona University 41
SAN MATEO
Ever visited
Last 12 months
Never visited
Don’t know
Total N
Alcatraz 50% 11% 39% -- 400 Baker Beach 36% 13% 50% 2% 400 Bolinas Ridge 20% 3% 76% 1% 400 China Beach 26% 7% 64% 3% 400 Cliff House 46% 31% 22% 1% 400 Crissy Field 31% 25% 43% 1% 400 Fort Baker 26% 11% 61% 3% 400 Fort Funston 24% 20% 55% 2% 400 Fort Mason 36% 21% 40% 3% 400 Fort Point 24% 13% 61% 2% 400 Land’s End 16% 9% 72% 4% 399 Milagra Ridge 3% 6% 88% 3% 400 Marin Headlands 28% 22% 49% 1% 400 Muir Beach 37% 13% 50% 1% 400 Muir Woods 47% 16% 37% 1% 400 Ocean Beach 31% 38% 28% 2% 400 Olema Valley 11% 3% 83% 3% 400 Phleger Estate 5% 2% 90% 3% 400 Presidio 33% 45% 22% 1% 400 Rodeo Beach 6% 5% 85% 3% 400 Stinson Beach 44% 20% 36% 1% 400 Sutro Heights Parks and Baths
22% 16% 61% -- 400
Sweeney Ridge 9% 6% 82% 3% 400 Tennessee Valley 5% 2% 90% 3% 400

Public Opinion Research Telephone Survey Regarding GGNRA Pet Management Issues
The Social Research Laboratory, Northern Arizona University 42
2. What is the total number of visits you have made to GGNRA park sites in the last 12 months? [Asked only of those respondents who said ‘yes’ to visiting any of the sites.]
REGIONAL ALAMEDA MARIN SAN FRANCISCO
SAN MATEO
Lowest number of visits 1 1 1 1 1
Highest number of visits
500 123 365 500 365
Average 28 9 35 55 12 3. Now I’d like to know if you currently have one or more dogs. (This includes own/care for/responsible for, either permanently or temporarily.) [Asked of
all respondents.]
REGIONAL ALAMEDA MARIN SAN FRANCISCO
SAN MATEO
Yes, have only one dog.
22% 348 20% 79 26% 102 15% 60 26% 103
Yes, have more than one dog.
7% 103 11% 43 9% 35 4% 14 6% 25
No, don’t have any dogs.
72% 1149 70% 278 66% 263 82% 326 68% 271
Don’t know -- 0 -- 0 -- 0 -- 0 -- 0 Total Percent 101% 1600 101% 400 101% 400 101% 400 100% 399
4. How many dogs do you have (own/keep/care for)?
[Asked only if respondent said they have a dog(s).]
REGIONAL ALAMEDA MARIN SAN FRANCISCO
SAN MATEO
One 77% 348 65% 79 75% 102 81% 60 80% 103 Two 15% 67 14% 17 22% 29 16% 12 16% 21 Three 6% 27 17% 20 2% 3 3% 2 1% 1 Four 2% 9 5% 6 1% 1 -- 0 3% 4 Five or more -- 0 -- 0 1% 1 -- 0 -- 0 Total 100% 451 101% 122 101% 136 100% 74 100% 129

Public Opinion Research Telephone Survey Regarding GGNRA Pet Management Issues
The Social Research Laboratory, Northern Arizona University 43
5. Have you ever taken (your dog/one of your dogs) for a walk in a GGNRA site? [Asked only of those respondents who said ‘yes’ to having a dog(s).]
REGIONAL ALAMEDA MARIN SAN FRANCISCO
SAN MATEO
Yes 50% 224 29% 35 69% 94 75% 55 44% 57 No 50% 224 69% 85 31% 42 25% 18 55% 71 Don’t know 1% 2 2% 2 1% 1 -- 0 -- 0 Total 101% 451 100% 122 101% 137 100% 73 99% 128
5a. How often do you take your dog(s) for a walk in a GGNRA site - daily, weekly,
monthly, or semi-annually? [Asked only of those respondents who have taken their dog(s) for a walk in a GGNRA site.]
REGIONAL ALAMEDA MARIN SAN
FRANCISCO SAN
MATEO Daily 19% 43 8% 3 18% 17 30% 17 9% 5 Weekly 20% 45 27% 9 17% 16 35% 20 12% 7 Monthly 22% 48 24% 8 32% 31 17% 10 15% 8 Semi-annually 31% 68 38% 13 31% 29 18% 10 38% 22 Don’t know 9% 19 3% 1 2% 2 -- 0 27% 15 Total 101% 223 100% 34 100% 95 100% 57 101% 57
6. Have you ever had someone else take (your dog/one of your dogs) for a walk in a GGNRA
site? [Asked only of those respondents who said ‘yes’ to having a dog(s).]
REGIONAL ALAMEDA MARIN SAN FRANCISCO
SAN MATEO
Yes 18% 81 9% 11 17% 23 47% 35 10% 13 No 79% 356 89% 109 78% 107 53% 39 84% 108 Don’t know 3% 14 2% 2 5% 6 -- 0 6% 7 Total 100% 451 100% 122 100% 136 100% 74 100% 128
7. Have you ever hired a commercial dog-walker to take your dog(s) for a walk in a GGNRA
site? [Asked only of those respondents who said ‘yes’ to having a dog(s).]
REGIONAL ALAMEDA MARIN SAN FRANCISCO
SAN MATEO
Yes 20% 16 24% 3 14% 3 16% 5 8% 1 No 80% 65 76% 8 87% 20 84% 29 92% 12 Don’t know -- 0 -- 0 -- 0 -- 0 -- 0 Total 100% 81 100% 11 101% 23 100% 34 100% 13

Public Opinion Research Telephone Survey Regarding GGNRA Pet Management Issues
The Social Research Laboratory, Northern Arizona University 44
8. Have you ever seen a dog allowed off- leash by a visitor at any GGNRA site? [Asked of GGNRA visitors.]
REGIONAL ALAMEDA MARIN SAN FRANCISCO
SAN MATEO
Yes 52% 801 42% 155 71% 279 75% 296 44% 168 No 39% 592 52% 190 21% 84 20% 81 42% 162 Don’t know 9% 138 6% 21 8% 32 5% 19 14% 55 Total 100% 1531 100% 366 100% 395 100% 396 100% 385
9. How did dogs being off- leash affect your visitor experience – did it add to your experience, did it detract from your experience, or did it not affect your experience at all? [Asked of GGNRA visitors.]
REGIONAL ALAMEDA MARIN SAN FRANCISCO
SAN MATEO
Added to experience
27% 217 32% 50 30% 83 34% 99 19% 32
Detracted from experience 22% 174 25% 39 26% 72 20% 57 19% 32
Did not affect experience
49% 393 41% 63 44% 124 45% 131 61% 102
Don’t know 2% 13 2% 3 -- 1 1% 4 1% 2 Total 100% 797 100% 155 100% 280 100% 291 100% 168
9a. Please tell me how the dog(s) being allowed off- leash affected your experience. [Open-ended]
10. Are you familiar with present National Park Service regulations regarding dog leash laws at
GGNRA sites? [Asked of all respondents.]
REGIONAL ALAMEDA MARIN SAN FRANCISCO
SAN MATEO
Yes 51% 801 46% 180 61% 242 56% 225 36% 145 No 47% 752 52% 205 37% 147 44% 174 60% 241 Don’t know 2% 33 2% 7 3% 11 -- 1 3% 14 Total 100% 1586 100% 392 101% 400 100% 400 99% 400

Public Opinion Research Telephone Survey Regarding GGNRA Pet Management Issues
The Social Research Laboratory, Northern Arizona University 45
11. Current regulations allow for walking dogs on- leash at most GGNRA sites AND prohibit any off- leash dog walking. Do you support or oppose this current regulation? Is that strongly (support/oppose) or somewhat (support/oppose)? [Asked of all respondents.]
REGIONAL ALAMEDA MARIN SAN FRANCISCO
SAN MATEO
Strongly support 45% 718 44% 174 44% 174 40% 158 48% 193
Somewhat support 26% 406 28% 112 23% 90 23% 89 28% 112
Somewhat oppose 11% 170 10% 41 12% 47 15% 60 8% 31
Strongly oppose
12% 194 14% 55 15% 61 15% 58 8% 33
Don’t know 7% 108 5% 18 7% 27 8% 30 8% 30 Total 101% 1596 101% 400 101% 399 101% 395 100% 399
12. Do you support or oppose further limiting on-leash dog walking in the GGNRA? Is that strongly (support/oppose) or somewhat (support/oppose)? [Asked of all respondents.]
REGIONAL ALAMEDA MARIN SAN FRANCISCO
SAN MATEO
Strongly support
19% 304 22% 86 16% 62 18% 73 16% 63
Somewhat support 14% 228 15% 62 9% 38 12% 47 17% 69
Somewhat oppose 27% 437 24% 95 26% 105 30% 119 31% 121
Strongly oppose 28% 453 30% 120 38% 151 29% 117 27% 106
Don’t know 11% 177 9% 37 11% 44 11% 44 10% 39 Total 99% 1599 100% 400 100% 400 100% 400 101% 398

Public Opinion Research Telephone Survey Regarding GGNRA Pet Management Issues
The Social Research Laboratory, Northern Arizona University 46
13. Do you support or oppose allowing off- leash dog walking in GGNRA sites? Is that strongly (support/oppose) or somewhat (support/oppose)? [Asked of all respondents.]
REGIONAL ALAMEDA MARIN SAN FRANCISCO
SAN MATEO
Strongly support 17% 273 19% 78 22% 89 19% 76 13% 52
Somewhat support
23% 366 22% 89 19% 77 27% 106 21% 83
Somewhat oppose 17% 265 16% 65 19% 75 15% 61 17% 67
Strongly oppose 36% 575 34% 137 34% 137 32% 129 43% 172
Don’t know 8% 121 8% 31 5% 22 7% 28 6% 25 Total 101% 1600 99% 400 99% 400 100% 400 100% 399
14. Now I’m going to read you two options. Please listen carefully to both options and tell me which option you prefer most. First, do you prefer allowing dogs off- leash in ALL areas where on- leash walking is now allowed OR do you prefer allowing dogs off- leash ONLY in limited areas? [Asked only of those respondents who favor off-leash dog walking.]
REGIONAL ALAMEDA MARIN SAN FRANCISCO
SAN MATEO
In all areas where on- leash is allowed
20% 129 15% 26 24% 40 26% 47 20% 27
Off- leash only in limited areas
74% 473 82% 137 69% 114 72% 131 78% 105
Neither 1% 7 1% 2 1% 2 1% 2 1% 2 Don’t know/no opinion 5% 30 1% 2 6% 11 1% 2 1% 2
Total 100% 639 99% 167 100% 167 100% 182 100% 136

Public Opinion Research Telephone Survey Regarding GGNRA Pet Management Issues
The Social Research Laboratory, Northern Arizona University 47
15. If GGNRA areas were designated for off- leash dog walking, do you favor off- leash dog walking being available ALL the time or ONLY during limited times?
REGIONAL ALAMEDA MARIN SAN FRANCISCO
SAN MATEO
All the time 64% 405 60% 100 71% 118 76% 139 57% 77 During limited times 34% 217 38% 63 27% 46 22% 39 39% 52
Don’t know 2% 15 2% 3 2% 3 2% 4 4% 6 Total 100% 637 100% 166 100% 167 100% 182 100% 135
15a. Do you prefer limiting hours in the day when off- leash dog walking takes place, limiting days in the week when off- leash walking takes place, or both? [Asked only of those respondents who favored limiting the times off-leash walking being available.]
REGIONAL ALAMEDA MARIN SAN FRANCISCO
SAN MATEO
Limiting hours
35% 75 27% 17 50% 23 37% 15 31% 16
Limiting days 23% 50 43% 27 12% 6 25% 10 17% 9
Both 38% 82 28% 18 30% 13 36% 14 45% 24 Don’t know 4% 10 3% 2 9% 4 2% 1 6% 3 Total 100% 217 101% 64 101% 46 100% 40 99% 52
15b. Do you prefer limiting the hours for off- leash dog walking to…?
[Asked only of those respondents who answered ‘limiting hours’ or ‘both.’]
REGIONAL ALAMEDA MARIN SAN FRANCISCO
SAN MATEO
Only morning hours
23% 37 42% 14 25% 9 14% 4 16% 7
Only afternoon hours 6% 10 3% 1 19% 7 7% 2 6% 2
Only evening/ dusk hours
21% 33 26% 9 10% 3 27% 8 19% 7
No limit on hours 39% 62 9% 3 33% 12 37% 11 54% 22
Don’t know 11% 16 20% 7 14% 5 15% 4 6% 2 Total 100% 158 100% 34 101% 36 100% 29 101% 40

Public Opinion Research Telephone Survey Regarding GGNRA Pet Management Issues
The Social Research Laboratory, Northern Arizona University 48
15c. Do you prefer limiting the days for off- leash walking to…? [Asked only of those respondents who answered ‘limiting days’ or ‘both.’]
REGIONAL ALAMEDA MARIN SAN FRANCISCO
SAN MATEO
Only weekdays 37% 48 64% 28 33% 6 8% 2 25% 8 Only weekends 11% 15 6% 3 14% 3 10% 3 20% 7 Both weekdays and weekends 46% 60 27% 12 40% 7 73% 18 54% 18
Don’t know/no opinion
7% 9 3% 1 14% 2 9% 2 -- 0
Total 101% 132 100% 44 101% 18 100% 25 99% 33
16. Do you believe there should be a limit on the number of dogs walked by any one person at any one time at GGNRA sites? (This includes on- or off- leash.) [Asked of all respondents.]
REGIONAL ALAMEDA MARIN SAN FRANCISCO
SAN MATEO
Yes 58% 918 61% 242 67% 268 48% 188 54% 205 No 35% 562 30% 119 29% 116 47% 185 46% 175 No dogs should be allowed in
-- 5 1% 3 -- 0 -- 1 -- 0
Don’t know 7% 112 9% 34 4% 17 6% 23 -- 0 Total 100% 1597 100% 398 100% 401 101% 397 99% 380
16a. How many dogs do you believe a person should be allowed to walk at any one
time? (This includes on- or off- leash.) [Asked of those respondents answering ‘yes’ to limiting the number of dogs walked by one person at one time.]
REGIONAL ALAMEDA MARIN SAN FRANCISCO
SAN MATEO
One 13% 120 20% 50 5% 14 9% 17 12% 25 Two 40% 364 36% 87 40% 107 33% 62 49% 99 Three 28% 256 25% 60 34% 91 26% 49 22% 45 Four 9% 79 5% 13 9% 24 16% 31 9% 18 Five or more 6% 58 8% 19 9% 24 11% 20 3% 5 Don’t know 4% 39 6% 15 2% 6 5% 9 6% 12 Total 100% 916 100% 244 99% 266 100% 188 101% 204

Public Opinion Research Telephone Survey Regarding GGNRA Pet Management Issues
The Social Research Laboratory, Northern Arizona University 49
The mission of the Golden Gate National Recreation Area is the preservation, unimpaired, of the natural and cultural resources and scenic and recreation values of the park for present and future generations to enjoy. [Read to all respondents.] Knowing this, do you support or oppose… 17. Allowing off- leash dog walking in GGNRA sites? [Asked of all respondents.]
REGIONAL ALAMEDA MARIN SAN FRANCISCO
SAN MATEO
Strongly support 16% 257 22% 87 20% 79 20% 81 11% 44
Somewhat support 20% 324 15% 61 17% 68 25% 101 25% 100
Somewhat oppose 17% 276 20% 78 14% 56 15% 61 14% 55
Strongly oppose
41% 654 40% 162 44% 176 33% 131 42% 167
Don’t know/ no opinion 5% 84 3% 12 5% 21 7% 26 8% 30
Total 99% 1595 100% 400 100% 400 100% 400 100% 396 18. Allowing off- leash dog walking on trails used by hikers, bikers, or horses? [Asked of all respondents except those who ‘strongly oppose’ off-leash dog walking.]
REGIONAL ALAMEDA MARIN SAN FRANCISCO
SAN MATEO
Strongly support 20% 167 16% 35 24% 49 20% 49 14% 28
Somewhat support 20% 174 18% 41 19% 39 32% 77 20% 39
Somewhat oppose
27% 231 31% 71 25% 50 24% 57 30% 60
Strongly oppose 29% 245 32% 73 25% 50 20% 49 30% 60
Don’t know/ no opinion
5% 40 3% 6 7% 15 4% 10 6% 12
Total 101% 857 100% 226 100% 203 100% 242 100% 199

Public Opinion Research Telephone Survey Regarding GGNRA Pet Management Issues
The Social Research Laboratory, Northern Arizona University 50
19. Allowing off- leash dog walking only in designated areas that are separated from other visitors? [Asked of all respondents except those who ‘strongly oppose’ off-leash dog walking.]
REGIONAL ALAMEDA MARIN SAN FRANCISCO
SAN MATEO
Strongly support 36% 306 37% 84 37% 74 28% 67 39% 78
Somewhat support 34% 291 33% 74 28% 57 35% 86 38% 76
Somewhat oppose 15% 128 14% 33 13% 27 18% 43 15% 30
Strongly oppose
12% 99 14% 31 15% 30 16% 39 6% 12
Don’t know/ no opinion 4% 33 2% 5 7% 15 3% 8 2% 3
Total 101% 857 100% 227 100% 203 100% 243 100% 199 20. Allowing off- leash dog walking at public beaches in the park? [Asked of all respondents except those who ‘strongly oppose’ off-leash dog walking.]
REGIONAL ALAMEDA MARIN SAN FRANCISCO
SAN MATEO
Strongly support
27% 232 26% 59 35% 71 34% 81 20% 40
Somewhat support 34% 288 28% 64 32% 66 41% 99 39% 77
Somewhat oppose
17% 141 20% 44 13% 26 15% 37 13% 26
Strongly oppose 20% 167 24% 53 14% 29 8% 19 27% 53
Don’t know/ no opinion
3% 27 3% 6 6% 11 2% 5 1% 2
Total 101% 855 101% 226 100% 203 100% 241 100% 198
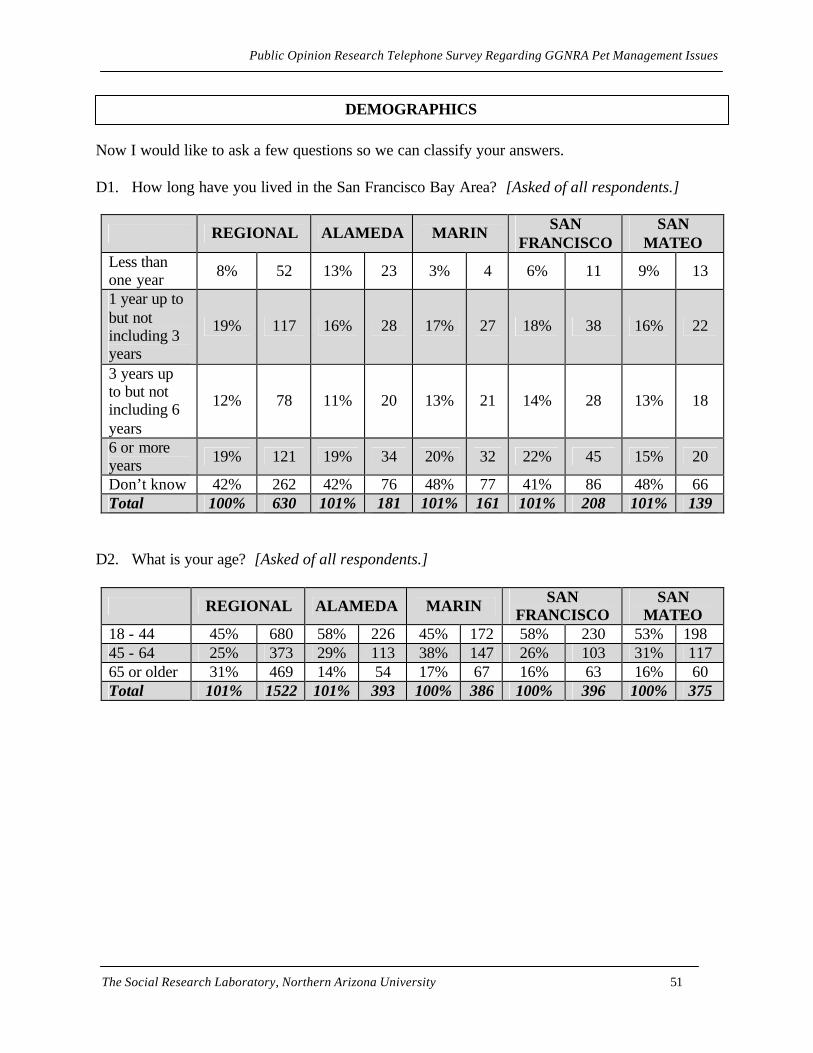
Public Opinion Research Telephone Survey Regarding GGNRA Pet Management Issues
The Social Research Laboratory, Northern Arizona University 51
Now I would like to ask a few questions so we can classify your answers.
D1. How long have you lived in the San Francisco Bay Area? [Asked of all respondents.]
REGIONAL ALAMEDA MARIN SAN FRANCISCO
SAN MATEO
Less than one year 8% 52 13% 23 3% 4 6% 11 9% 13
1 year up to but not including 3 years
19% 117 16% 28 17% 27 18% 38 16% 22
3 years up to but not including 6 years
12% 78 11% 20 13% 21 14% 28 13% 18
6 or more years 19% 121 19% 34 20% 32 22% 45 15% 20
Don’t know 42% 262 42% 76 48% 77 41% 86 48% 66 Total 100% 630 101% 181 101% 161 101% 208 101% 139
D2. What is your age? [Asked of all respondents.]
REGIONAL ALAMEDA MARIN SAN FRANCISCO
SAN MATEO
18 - 44 45% 680 58% 226 45% 172 58% 230 53% 198 45 - 64 25% 373 29% 113 38% 147 26% 103 31% 117 65 or older 31% 469 14% 54 17% 67 16% 63 16% 60 Total 101% 1522 101% 393 100% 386 100% 396 100% 375
DEMOGRAPHICS

Public Opinion Research Telephone Survey Regarding GGNRA Pet Management Issues
The Social Research Laboratory, Northern Arizona University 52
D3. What is the highest grade of school or year of college that you have completed? [Asked of all respondents.]
REGIONAL ALAMEDA MARIN SAN FRANCISCO
SAN MATEO
Less than high school degree (Grades 1-11)
3% 45 4% 14 -- 0 2% 9 2% 7
High school degree
15% 234 17% 68 6% 25 16% 63 12% 49
Some college/ Associate’s degree
29% 453 36% 142 23% 89 20% 78 34% 134
Bachelor’s degree 29% 463 22% 89 36% 142 34% 133 30% 117
Post-Bachelor’s degree
25% 388 21% 85 35% 138 29% 113 22% 88
Total 101% 1583 100% 398 100% 394 101% 396 100% 395 D4. Which of the following income groups includes your total family income in 2001 before
taxes? [Asked of all respondents.]
REGIONAL ALAMEDA MARIN SAN FRANCISCO
SAN MATEO
Up to $25,000 18% 207 21% 66 6% 18 21% 61 9% 26 $25,001 to $50,000
20% 229 25% 77 14% 40 17% 49 18% 54
$50,001 to $75,000 18% 211 17% 53 21% 59 20% 58 20% 57
$75,001 to $100,000 16% 185 12% 38 19% 55 19% 55 17% 51
$100,000 or more 27% 313 25% 77 40% 113 23% 65 36% 106
Total 99% 1145 100% 311 100% 285 100% 288 100% 294

Public Opinion Research Telephone Survey Regarding GGNRA Pet Management Issues
The Social Research Laboratory, Northern Arizona University 53
D5. Are you of Hispanic, Latino/a, or Spanish origin? [Asked of all respondents.]
REGIONAL ALAMEDA MARIN SAN FRANCISCO
SAN MATEO
Yes 33% 513 37% 145 21% 84 25% 97 41% 160 No 67% 1058 63% 249 79% 306 75% 293 59% 234 Total 100% 1571 100% 394 100% 390 100% 390 100% 394
D6. What do you primarily consider your race to be? [Respondent may select more than one.]
[Asked of all respondents.]
REGIONAL ALAMEDA MARIN SAN FRANCISCO
SAN MATEO
Asian 22% 338 22% 84 5% 18 32% 119 21% 76 Black/ African American 10% 151 16% 60 3% 11 8% 31 4% 13
White 57% 860 52% 199 87% 328 51% 192 62% 230 Other 11% 163 11% 43 5% 20 9% 33 14% 51 Total 100% 1512 101% 386 100% 377 100% 375 101% 370
D7. Respondent’s gender
REGIONAL ALAMEDA MARIN SAN FRANCISCO
SAN MATEO
Male 50% 792 49% 196 50% 202 50% 199 49% 197 Female 51% 808 51% 204 50% 198 50% 202 51% 203 Total 101% 1600 100% 400 100% 400 100% 401 100% 400
Those are all the questions I have for you. Thank you very much for your time! *This information was provided to respondents upon request: “This survey has been approved by the Office of Management and Budget. The designated approval number is #1024-0224 (NPS #02-016) Expiration Date 11/30/2003. You may direct comments that you have about any aspect of the survey to: Information Collection Clearance Officer WASO Administrative Program Center National Park Service 1849 C Street NW Washington, DC 20240 Or, you may call the principal investigator of this survey. His name is Dr. Fred Solop. He is the director of the Social Research Laboratory at Northern Arizona University. You can call Dr. Solop toll- free at (866) 213-5716.”

Appendix B Open-Ended Verbatim
Responses

Public Opinion Research Telephone Survey Regarding GGNRA Pet Management Issues
The Social Research Laboratory, Northern Arizona University 54
Appendix B – Verbatim Responses
“Please tell me how the dog(s) being off-leash affected your experience.” [Asked only of respondents who had a positive or negative experience with dog(s) off-leash at a GGNRA site.] Positive Experiences with Dogs Off-Leash
• Rather see them off- leash, but these days you can’t do that. • Freedom of animal-display joy okay as long as they are under control. • I love dogs and like see them enjoy their freedom. • I love to see dogs running around as long as they’re well behaved. • I like to watch Social dogs exercise. • I am happy to see dogs run freely if they are under control. • Dogs were playfully playing with owners and were not bothering anyone else. • Some owners do not know where their dogs have run off. When I am hiking dogs bother
me. • It is fun to watch dogs play. • It is convenient when dogs are off- leash. • I love dogs and I think dogs are less aggressive off- leash. • Dogs being off- leash did not bother me. • My dogs played with other nice dogs. • I grew up in the country and it is nice to see other places still allow dogs to run around. • It is fun to see dogs run around. • I love dogs. • Dogs get exercise when off- leash but should be within voice control. • I like to watch dogs run around. • A dog being off- leash makes it more fun and adds to socialization. • No problem with dogs being off- leash. • I like seeing dogs enjoy themselves. • It is fun to watch dogs swim after balls in the water. • Dogs are having fun running around. • Dog people have to have somewhere where dogs can interact. You learn a lot from them.
A dog is like a child to a lot of people. Makes it friendlier. Not many places where dogs can be dogs. Never once have I seen a dog encounter with a bad experience. Most educated owners have control of their dogs.
• Gave another dog for her dog to play with. Didn't see any misbehaving dogs. It also encourages social interaction for people.
• Off- leash dogs are more social. • Most dogs are well behaved and very good. • I like dogs when they are off- leash. • It was like watching children play it was fun to see! • I like dogs and I don't have any fear them, some people are, but they are not nuisances. • I like to see dogs running free having fun.

Public Opinion Research Telephone Survey Regarding GGNRA Pet Management Issues
The Social Research Laboratory, Northern Arizona University 55
• I like to be able to let my dog run. • Happy dogs, happy owners. • It was nice to see dogs free, the owners are very cons iderate, and they are very clean. • I believe in off- leash dog walking. • I like dogs being able to play together and it is hard to throw a ball to a dog on a leash. • I enjoy off- leash dog walking. • Dogs can interact with public. • Greeting and playing with dogs is enjoyable. • I like dogs to be free and able to run around. • I enjoy dogs interacting with each other most are better behaved than people. • I love seeing animals run about enjoying their freedom. It brings happiness to families
with dogs. • They need an area to allow dogs off their leash. • I like it when dogs are allowed off- leash. • I have no problems with it. • No problems with dogs being allowed off- leash. • Dogs are wonderful creatures and they are very friendly. • I Enjoy watching dogs run and play. • I am pleased to see dogs being able to run if the dogs are under voice command. • It is enjoyable and fun watching my dog play in the water. • I enjoyed seeing dogs run and having fun. • I like dogs. • I love dogs. • Dogs being off- leash made for a fun afternoon. • Because I just got a dog and I am learning about dogs and the social interaction for both
the dog and I was positive. • I like running and playing with my dog at the beach. • Dogs are nicer off- leash there is no leash aggression. • I'm very fond of dogs and not afraid of them and I like to see how happy they are when
they're frolicking. I prefer the dogs to the people. • I like to watch the dogs play. • I like to pet the dogs. • My friends dogs and my dogs were there to play and get exercise. • My dog has more fun and gets better exercise off- leash. • I loves dogs. • I enjoy seeing well-behaved dogs running around. • Dogs have more freedom, which gives them a chance to play with other dogs. • It's good to see animals free.

Public Opinion Research Telephone Survey Regarding GGNRA Pet Management Issues
The Social Research Laboratory, Northern Arizona University 56
Negative Experiences with Dogs Off-Leash
• You don’t know how the dogs are going to act. The dogs also spatter sand on you and they leave poop everywhere.
• Dogs should be controlled or be in certain areas. • Dogs leave feces everywhere and get in the way. When dogs fight they frighten my
grandchildren. • Mindful of no leash area and mindful of plants and habitat and it bothers you with dogs
off- leash. • Owners do not pick up after their dogs. • Dog poop is left on the ground and at picnics dogs sniff at your food. • I have visited a beach where dogs were off- leash, but I prefer when dogs are on-leash
while at the beach. • Dogs chase me while I am riding my bike, which frightens me. • I had my dog on- leash abiding by the rules while the other dogs weren’t. • My dog got bit by another dog once- it was bleeding. Because of this I think off- leash
dogs are a threat to other dogs and people. • I do not like to see dogs running loose. • I am afraid that dogs might bite me. • Dog run up to you, invade your space, which makes my daughter afraid. Dog poop is not
picked up. • I think dogs should be on a leash. Some irresponsible dog owners do not control their
dogs. I have a child and it concerns me when dogs are off their leashes. • I am a little afraid of dogs, but most of the time the dogs are fine. • I worry about wildlife being destroyed by dogs. • Dogs chase wildlife and run at you and cause people to be scared. • Dogs being off their leashes bother me, especially on Tennessee valley road. • Most of the dogs are untrained and knock his children down, not many people clean up
after their dogs. • I am afraid of dogs. • I have a 17 month olds son and a dog came and ate our picnic. • Dogs get into fights with each other. Their owners don't clean up after them. • I have a dog and do not know if the dog would be nice or mean. • Dogs off- leash may be a potential threat. • Dogs are annoying and run our over towels when were at the beach. • I dislike dogs and their owners. • I have a problem with people who own dogs and want them to have the same rights as
people; they think they have the right to let them run rampant without concern for the environment and other people.
• I don’t think I am trusting of wild-running dogs. Don’t know whether they are hostile or not.
• I keep my dog on a leash, so I would rather other owners did too. • I am not a dog person; apprehensive of dogs I don't know. • Off- leash dogs negatively affected my experience.

Public Opinion Research Telephone Survey Regarding GGNRA Pet Management Issues
The Social Research Laboratory, Northern Arizona University 57
• Allowing a dog off- leash is bad. • I don't like it when dogs are off- leash. • I do not want dogs allowed off- leash, but it is the number of dogs that need to be
restricted. Dog walkers are spoiling it for everybody else. • You can't be enjoying yourself while visiting when dogs are off- leash. • Owners poorly control their dogs. Their dogs also chase after wildlife. Dogs also disturb
other visitors. • I worry about the safety of my children. • When dogs approach me, I am unsure of their actions. • You have to watch your back to not get caught. • It is frightening because you never know when a dog will turn on you. • It can be frightening, messy, and interruptive. • Not always detracting, but on beaches especially its annoying to look around for dog
crap, and I’ve witnessed dogs chasing birds. • I'd prefer not having dogs running up to me. • I would like people to clean up after their animals. • I have small children and I have safety concerns. • I always get nervous because my dog is on a leash and I don’t know how he will respond! • Sometimes worry they will bite, or dogs chase birds off the beach or they poop where I
might step in it. • It puts you on a side of caution, you have to be more aware, and it would be a concern. • It was a negative experience. • Little kids are scared of the dogs. • Because I am allergic to dogs. • It is harmful to the environment they are often not controlled. • It is just not safe and that bothers me. • A pit bull dog wandering around without a leash frightened my family and I. • We keep our dog on- leash other dogs are too aggressive. • I fear for my daughter’s safety. • Certain breeds of dogs should not be allowed in the GGNRA. Pit bulls should not be
allowed in the parks. • I do not like dogs off a leash in an on- leash area. • Don't like it because I may get attacked by one of them. Dog owners should keep them on
the dog leashes. • Dogs Cause problems for everyone. Especially when dogs are on the beach. Putting sand
on people. • I don't trust dogs because they might attack you. • Dogs off- leash are better behaved in my experience; dogs on- leash can be more
aggressive than off- leash. • I am a firm believer that dogs should be on a leash. • I don't like dogs running up to me. • A dog was interacting negatively with my dog. • At Stinson beach, dogs run all over the place, makes a mess on the beach. Never know if
the dog will run up and bite you, and everyone thinks his or her dog is harmless.

Public Opinion Research Telephone Survey Regarding GGNRA Pet Management Issues
The Social Research Laboratory, Northern Arizona University 58
• Dogs interfere with the wildlife, which should be protected. • When I go to Stinson beach, there's dogs off- leash, and you don't know if they are under
control or not. • Occasionally there is minimal confrontation. • Some of dogs run up to you and jump on you. • Dogs are dangerous; I have been run into by dogs at the park. • I don't know how stable dogs are with kids. • Owners do no clean up after them. • She doesn't like dogs off- leash they bother plants and animals. Also dogs jump on her. • Don’t like dogs off- leash. • I have to worry about dogs around me. • Most dogs are not under control and knock over my kite set. • I don't like the dogs running around, pooping all over the place. • Owners don't clean up after their dogs.

Appendix C Cross-tabulation Tables by
Demographics
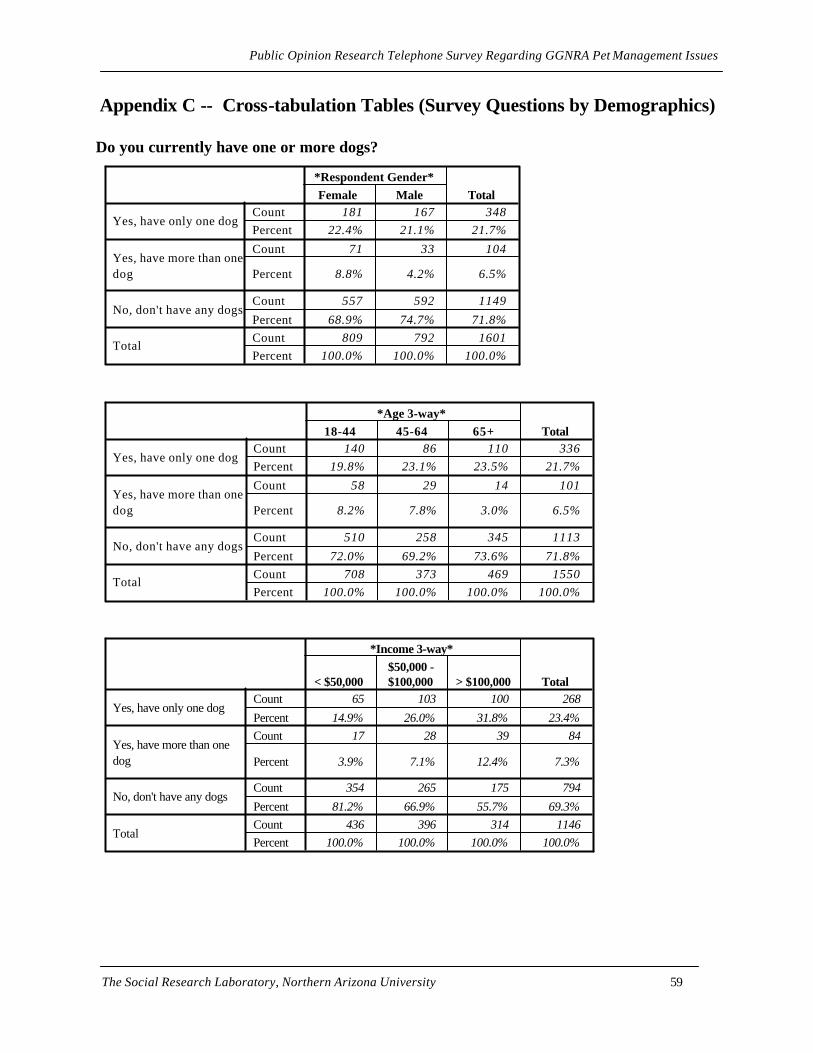
Public Opinion Research Telephone Survey Regarding GGNRA Pet Management Issues
The Social Research Laboratory, Northern Arizona University 59
Appendix C -- Cross-tabulation Tables (Survey Questions by Demographics)
Do you currently have one or more dogs?
181 167 34822.4% 21.1% 21.7%
71 33 104
8.8% 4.2% 6.5%
557 592 1149
68.9% 74.7% 71.8%809 792 1601
100.0% 100.0% 100.0%
CountPercent
Count
Percent
Count
PercentCountPercent
Yes, have only one dog
Yes, have more than onedog
No, don't have any dogs
Total
Female Male*Respondent Gender*
Total
140 86 110 33619.8% 23.1% 23.5% 21.7%
58 29 14 101
8.2% 7.8% 3.0% 6.5%
510 258 345 1113
72.0% 69.2% 73.6% 71.8%708 373 469 1550
100.0% 100.0% 100.0% 100.0%
CountPercent
Count
Percent
Count
PercentCountPercent
Yes, have only one dog
Yes, have more than onedog
No, don't have any dogs
Total
18-44 45-64 65+*Age 3-way*
Total
65 103 100 268
14.9% 26.0% 31.8% 23.4%17 28 39 84
3.9% 7.1% 12.4% 7.3%
354 265 175 794
81.2% 66.9% 55.7% 69.3%436 396 314 1146
100.0% 100.0% 100.0% 100.0%
Count
PercentCount
Percent
Count
PercentCountPercent
Yes, have only one dog
Yes, have more than onedog
No, don't have any dogs
Total
< $50,000$50,000 -$100,000 > $100,000
*Income 3-way*
Total

Public Opinion Research Telephone Survey Regarding GGNRA Pet Management Issues
The Social Research Laboratory, Northern Arizona University 60
8 41 106 106 79 34017.8% 17.5% 23.3% 22.9% 20.4% 21.5%
4 10 40 24 24 102
8.9% 4.3% 8.8% 5.2% 6.2% 6.4%
33 183 308 332 284 1140
73.3% 78.2% 67.8% 71.9% 73.4% 72.1%45 234 454 462 387 1582
100.0% 100% 100.0% 100.0% 100.0% 100.0%
CountPercentCount
Percent
Count
PercentCountPercent
Yes, have only one dog
Yes, have more than onedog
No, don't have any dogs
Total
Grades1-11
HSdegree/GED
Somecollege/
AABA/BSdegree
Post-BA/BS
*Education 5-way*
Total
57 62 20 187 326
35.2% 18.3% 13.2% 21.7% 21.6%10 16 23 45 94
6.2% 4.7% 15.1% 5.2% 6.2%
95 260 109 628 1092
58.6% 76.9% 71.7% 73.0% 72.2%162 338 152 860 1512
100.0% 100.0% 100.0% 100.0% 100.0%
Count
PercentCount
Percent
Count
PercentCountPercent
Yes, have only one dog
Yes, have more than onedog
No, don't have any dogs
Total
OtherAsian
AmericanBlack / African
American White
** Race **
Total
130 212 34225.4% 20.0% 21.8%
33 68 101
6.4% 6.4% 6.4%
349 779 1128
68.2% 73.6% 71.8%512 1059 1571
100.0% 100.0% 100.0%
CountPercentCount
Percent
Count
PercentCountPercent
Yes, have only one dog
Yes, have more than onedog
No, don't have any dogs
Total
Yes, is ofHispanic
origin
No, is not ofHispanic
origin
*Hispanic/Non-Hispanic*
Total

Public Opinion Research Telephone Survey Regarding GGNRA Pet Management Issues
The Social Research Laboratory, Northern Arizona University 61
348 0 34877.2% .0% 21.8%
103 0 103
22.8% .0% 6.4%
0 1149 1149
.0% 100.0% 71.8%451 1149 1600
100.0% 100.0% 100.0%
Countpercent
Count
percent
Count
percentCountpercent
Yes, have only one dog
Yes, have more than onedog
No, don't have any dogs
Total
Own dog(s) Has No dog(s)*Dog owner/Non-owner*
Total
How many dogs do you have (own, keep, care for)?
181 167 34872.1% 83.9% 77.3%
40 27 6715.9% 13.6% 14.9%
21 5 268.4% 2.5% 5.8%
9 0 93.6% .0% 2.0%
0 0 0
.0% .0% .0%251 199 450
100.0% 100.0% 100.0%
Countpercent
CountpercentCountpercent
CountpercentCount
percentCountpercent
1
2
3
4
5
Total
Female Male*Respondent Gender*
Total
140 86 110 33671.1% 74.8% 89.4% 77.2%
31 21 12 6415.7% 18.3% 9.8% 14.7%
24 1 1 2612.2% .9% .8% 6.0%
2 7 0 91.0% 6.1% .0% 2.1%
0 0 0 0
.0% .0% .0% .0%197 115 123 435
100.0% 100.0% 100.0% 100.0%
Countpercent
CountpercentCountpercent
CountpercentCount
percentCountpercent
1
2
3
4
5
Total
18-44 45-64 65+*Age 3-way*
Total

Public Opinion Research Telephone Survey Regarding GGNRA Pet Management Issues
The Social Research Laboratory, Northern Arizona University 62
65 103 100 268
80.2% 78.6% 72.5% 76.6%11 19 21 51
13.6% 14.5% 15.2% 14.6%0 9 14 23
.0% 6.9% 10.1% 6.6%5 0 3 8
6.2% .0% 2.2% 2.3%0 0 0 0
.0% .0% .0% .0%81 131 138 350
100.0% 100.0% 100.0% 100.0%
Count
percentCountpercentCount
percentCountpercentCount
percentCountpercent
1
2
3
4
5
Total
< $50,000$50,000 -$100,000 > $100,000
*Income 3-way*
Total
8 41 106 106 79 34066.7% 78.8% 73.1% 81.5% 76.7% 76.9%
4 5 20 18 19 6633.3% 9.6% 13.8% 13.8% 18.4% 14.9%
0 4 12 6 5 27.0% 7.7% 8.3% 4.6% 4.9% 6.1%
0 2 7 0 0 9.0% 3.8% 4.8% .0% .0% 2.0%
0 0 0 0 0 0
.0% .0% .0% .0% .0% .0%12 52 145 130 103 442
100.0% 100.0% 100.0% 100.0% 100.0% 100.0%
CountpercentCountpercent
CountpercentCountpercentCount
percentCountpercent
1
2
3
4
5
Total
Grades1-11
HSdegree/GED
Somecollege/AA
BA/BSdegree Post-BA/BS
*Education 5-way*
Total

Public Opinion Research Telephone Survey Regarding GGNRA Pet Management Issues
The Social Research Laboratory, Northern Arizona University 63
57 62 20 187 32685.1% 79.5% 47.6% 81.0% 78.0%
6 11 11 33 619.0% 14.1% 26.2% 14.3% 14.6%
4 3 11 8 266.0% 3.8% 26.2% 3.5% 6.2%
0 2 0 3 5.0% 2.6% .0% 1.3% 1.2%
0 0 0 0 0
.0% .0% .0% .0% .0%67 78 42 231 418
100.0% 100.0% 100.0% 100.0% 100.0%
CountpercentCountpercent
CountpercentCountpercentCount
percentCountpercent
1
2
3
4
5
Total
OtherAsian
American
Black /African
American White
** Race **
Total
130 212 34279.8% 76.0% 77.4%
9 57 665.5% 20.4% 14.9%
18 8 2611.0% 2.9% 5.9%
6 2 83.7% .7% 1.8%
0 0 0
.0% .0% .0%163 279 442
100.0% 100.0% 100.0%
CountpercentCountpercent
CountpercentCountpercentCount
percentCountpercent
1
2
3
4
5
Total
Yes, is ofHispanic
origin
No, is not ofHispanic
origin
*Hispanic/Non-Hispanic*
Total

Public Opinion Research Telephone Survey Regarding GGNRA Pet Management Issues
The Social Research Laboratory, Northern Arizona University 64
348 34877.2% 77.2%
67 6714.9% 14.9%
27 276.0% 6.0%
9 92.0% 2.0%
0 0
.0% .0%451 451
100.0% 100.0%
CountpercentCountpercent
CountpercentCountpercentCount
percentCountpercent
1
2
3
4
5
Total
Own dog(s)
*Dogowner/Non-owner
*Total
88 93 64 103 34865.2% 83.0% 84.2% 81.1% 77.3%
20 17 10 20 6714.8% 15.2% 13.2% 15.7% 14.9%
22 1 2 1 2616.3% .9% 2.6% .8% 5.8%
5 1 0 3 93.7% .9% .0% 2.4% 2.0%
0 0 0 0 0.0% .0% .0% .0% .0%135 112 76 127 450
100.0% 100.0% 100.0% 100.0% 100.0%
CountpercentCountpercentCountpercentCountpercentCountpercentCountpercent
1
2
3
4
5
Total
Alameda Marin San Francisco San Mateo*R's county*
Total
Have you ever taken your dog(s) for a walk in a GGNRA site?
104 121 22541.3% 60.5% 49.8%
146 78 22457.9% 39.0% 49.6%
2 1 3.8% .5% .7%252 200 452
100.0% 100.0% 100.0%
CountpercentCountpercentCountpercentCountpercent
Yes
No
Don't know
Total
Female Male*Respondent Gender*
Total

Public Opinion Research Telephone Survey Regarding GGNRA Pet Management Issues
The Social Research Laboratory, Northern Arizona University 65
88 64 61 21344.4% 55.7% 49.2% 48.7%
109 50 63 22255.1% 43.5% 50.8% 50.8%
1 1 0 2.5% .9% .0% .5%198 115 124 437
100.0% 100.0% 100.0% 100.0%
CountpercentCountpercentCountpercentCountpercent
Yes
No
Don't know
Total
18-44 45-64 65+*Age 3-way*
Total
44 72 60 176
54.3% 55.0% 43.5% 50.3%36 59 78 173
44.4% 45.0% 56.5% 49.4%1 0 0 1
1.2% .0% .0% .3%81 131 138 350
100.0% 100.0% 100.0% 100.0%
Count
percentCountpercentCount
percentCountpercent
Yes
No
Don't know
Total
< $50,000$50,000 -$100,000 > $100,000
*Income 3-way*
Total
6 19 49 78 70 22246.2% 37.3% 33.6% 60.0% 67.3% 50.0%
7 32 95 52 34 22053.8% 62.7% 65.1% 40.0% 32.7% 49.5%
0 0 2 0 0 2.0% .0% 1.4% .0% .0% .5%
13 51 146 130 104 444100.0% 100.0% 100.0% 100.0% 100.0% 100.0%
CountpercentCountpercent
CountpercentCountpercent
Yes
No
Don't know
Total
Grades1-11
HSdegree/GED
Somecollege/AA BA/BS degree Post-BA/BS
*Education 5-way*
Total

Public Opinion Research Telephone Survey Regarding GGNRA Pet Management Issues
The Social Research Laboratory, Northern Arizona University 66
41 42 14 110 20760.3% 53.8% 32.6% 47.4% 49.2%
26 36 29 121 21238.2% 46.2% 67.4% 52.2% 50.4%
1 0 0 1 21.5% .0% .0% .4% .5%
68 78 43 232 421100.0% 100.0% 100.0% 100.0% 100.0%
CountpercentCountpercent
CountpercentCountpercent
Yes
No
Don't know
Total
OtherAsian
American
Black /African
American White
** Race **
Total
83 138 22150.9% 49.3% 49.9%
79 141 22048.5% 50.4% 49.7%
1 1 2.6% .4% .5%163 280 443
100.0% 100.0% 100.0%
CountpercentCountpercent
CountpercentCountpercent
Yes
No
Don't know
Total
Yes, is ofHispanic
origin
No, is not ofHispanic
origin
*Hispanic/Non-Hispanic*
Total
224 22449.8% 49.8%
224 22449.8% 49.8%
2 2.4% .4%450 450
100.0% 100.0%
CountpercentCountpercent
CountpercentCountpercent
Yes
No
Don't know
Total
Own dog(s)
*Dogowner/Non
-owner*Total

Public Opinion Research Telephone Survey Regarding GGNRA Pet Management Issues
The Social Research Laboratory, Northern Arizona University 67
38 70 58 59 22527.9% 62.5% 76.3% 46.5% 49.9%
96 42 18 68 22470.6% 37.5% 23.7% 53.5% 49.7%
2 0 0 0 21.5% .0% .0% .0% .4%
136 112 76 127 451100.0% 100.0% 100.0% 100.0% 100.0%
CountpercentCountpercentCountpercentCountpercent
Yes
No
Don't know
Total
Alameda Marin San Francisco San Mateo*R's county*
Total
How often do you take your dog(s) for a walk in a GGNRA site?
25 18 4324.3% 14.9% 19.2%
16 29 4515.5% 24.0% 20.1%
24 24 4823.3% 19.8% 21.4%
34 35 6933.0% 28.9% 30.8%
4 15 193.9% 12.4% 8.5%
103 121 224100.0% 100.0% 100.0%
CountpercentCountpercentCountpercentCountpercentCountpercentCountpercent
Daily
Weekly
Monthly
Semi-annually
Don't know
Total
Female Male*Respondent Gender*
Total
11 9 22 4212.8% 13.8% 36.1% 19.8%
30 7 5 4234.9% 10.8% 8.2% 19.8%
24 12 9 4527.9% 18.5% 14.8% 21.2%
19 23 22 6422.1% 35.4% 36.1% 30.2%
2 14 3 192.3% 21.5% 4.9% 9.0%
86 65 61 212100.0% 100.0% 100.0% 100.0%
CountpercentCountpercentCountpercentCountpercentCountpercentCountpercent
Daily
Weekly
Monthly
Semi-annually
Don't know
Total
18-44 45-64 65+*Age 3-way*
Total

Public Opinion Research Telephone Survey Regarding GGNRA Pet Management Issues
The Social Research Laboratory, Northern Arizona University 68
8 24 6 38
17.8% 33.8% 10.0% 21.6%8 13 12 33
17.8% 18.3% 20.0% 18.8%5 19 16 40
11.1% 26.8% 26.7% 22.7%9 13 24 46
20.0% 18.3% 40.0% 26.1%15 2 2 19
33.3% 2.8% 3.3% 10.8%45 71 60 176
100.0% 100.0% 100.0% 100.0%
Count
percentCountpercentCount
percentCountpercentCount
percentCountpercent
Daily
Weekly
Monthly
Semi-annually
Don't know
Total
< $50,000$50,000 -$100,000 > $100,000
*Income 3-way*
Total
5 5 4 11 18 43100.0% 27.8% 8.3% 13.9% 26.1% 19.6%
0 7 9 12 16 44.0% 38.9% 18.8% 15.2% 23.2% 20.1%
0 2 4 22 17 45.0% 11.1% 8.3% 27.8% 24.6% 20.5%
0 4 15 31 18 68.0% 22.2% 31.3% 39.2% 26.1% 31.1%
0 0 16 3 0 19
.0% .0% 33.3% 3.8% .0% 8.7%5 18 48 79 69 219
100.0% 100.0% 100.0% 100.0% 100.0% 100.0%
CountpercentCountpercent
CountpercentCountpercentCount
percentCountpercent
Daily
Weekly
Monthly
Semi-annually
Don't know
Total
Grades1-11
HSdegree/GED
Somecollege/AA
BA/BSdegree Post-BA/BS
*Education 5-way*
Total

Public Opinion Research Telephone Survey Regarding GGNRA Pet Management Issues
The Social Research Laboratory, Northern Arizona University 69
16 12 0 13 4141.0% 28.6% .0% 11.7% 20.0%
10 4 1 28 4325.6% 9.5% 7.7% 25.2% 21.0%
5 4 6 24 3912.8% 9.5% 46.2% 21.6% 19.0%
8 8 6 43 6520.5% 19.0% 46.2% 38.7% 31.7%
0 14 0 3 17
.0% 33.3% .0% 2.7% 8.3%39 42 13 111 205
100.0% 100.0% 100.0% 100.0% 100.0%
CountpercentCountpercent
CountpercentCountpercentCount
percentCountpercent
Daily
Weekly
Monthly
Semi-annually
Don't know
Total
OtherAsian
American
Black /African
American White
** Race **
Total
18 25 43
22.5% 18.0% 19.6%18 26 44
22.5% 18.7% 20.1%13 33 46
16.3% 23.7% 21.0%18 48 66
22.5% 34.5% 30.1%13 7 20
16.3% 5.0% 9.1%80 139 219
100.0% 100.0% 100.0%
Count
percentCountpercentCount
percentCountpercentCount
percentCountpercent
Daily
Weekly
Monthly
Semi-annually
Don't know
Total
Yes, is ofHispanic
origin
No, is notof Hispanic
origin
*Hispanic/Non-Hispanic*
Total

Public Opinion Research Telephone Survey Regarding GGNRA Pet Management Issues
The Social Research Laboratory, Northern Arizona University 70
43 4319.3% 19.3%
45 4520.2% 20.2%
48 4821.5% 21.5%
68 6830.5% 30.5%
19 19
8.5% 8.5%223 223
100.0% 100.0%
CountpercentCountpercent
CountpercentCountpercentCount
percentCountpercent
Daily
Weekly
Monthly
Semi-annually
Don't know
Total
Own dog(s)
*Dogowner/Non
-owner*Total
5 14 17 7 4313.2% 20.0% 29.3% 11.9% 19.1%
9 12 18 7 4623.7% 17.1% 31.0% 11.9% 20.4%
7 22 12 8 4918.4% 31.4% 20.7% 13.6% 21.8%
16 20 11 21 6842.1% 28.6% 19.0% 35.6% 30.2%
1 2 0 16 192.6% 2.9% .0% 27.1% 8.4%
38 70 58 59 225100.0% 100.0% 100.0% 100.0% 100.0%
CountpercentCountpercentCountpercentCountpercentCountpercentCountpercent
Daily
Weekly
Monthly
Semi-annually
Don't know
Total
Alameda Marin San Francisco San Mateo*R's county*
Total
Have you ever had someone else take your dog(s) for a walk in a GGNRA site?
44 37 8117.5% 18.5% 18.0%
199 157 35679.3% 78.5% 78.9%
8 6 143.2% 3.0% 3.1%
251 200 451100.0% 100.0% 100.0%
CountpercentCountpercentCountpercentCountpercent
Yes
No
Don't know
Total
Female Male*Respondent Gender*
Total

Public Opinion Research Telephone Survey Regarding GGNRA Pet Management Issues
The Social Research Laboratory, Northern Arizona University 71
22 22 33 7711.1% 19.1% 26.6% 17.6%
165 91 91 34782.9% 79.1% 73.4% 79.2%
12 2 0 146.0% 1.7% .0% 3.2%
199 115 124 438100.0% 100.0% 100.0% 100.0%
CountpercentCountpercentCountpercentCountpercent
Yes
No
Don't know
Total
18-44 45-64 65+*Age 3-way*
Total
16 35 21 72
19.5% 26.7% 15.2% 20.5%65 96 107 268
79.3% 73.3% 77.5% 76.4%1 0 10 11
1.2% .0% 7.2% 3.1%82 131 138 351
100.0% 100.0% 100.0% 100.0%
Count
percentCountpercentCount
percentCountpercent
Yes
No
Don't know
Total
< $50,000$50,000 -$100,000 > $100,000
*Income 3-way*
Total
5 5 14 30 27 8141.7% 9.6% 9.7% 23.1% 26.2% 18.3%
7 46 130 94 71 34858.3% 88.5% 89.7% 72.3% 68.9% 78.7%
0 1 1 6 5 13.0% 1.9% .7% 4.6% 4.9% 2.9%
12 52 145 130 103 442100.0% 100.0% 100.0% 100.0% 100.0% 100.0%
CountpercentCountpercent
CountpercentCountpercent
Yes
No
Don't know
Total
Grades1-11
HSdegree/GED
Somecollege/AA BA/BS degree Post-BA/BS
*Education 5-way*
Total

Public Opinion Research Telephone Survey Regarding GGNRA Pet Management Issues
The Social Research Laboratory, Northern Arizona University 72
17 22 11 30 80
25.0% 28.2% 25.6% 12.9% 19.0%50 53 32 198 333
73.5% 67.9% 74.4% 85.3% 79.1%1 3 0 4 8
1.5% 3.8% .0% 1.7% 1.9%68 78 43 232 421
100.0% 100.0% 100.0% 100.0% 100.0%
Count
percentCountpercentCount
percentCountpercent
Yes
No
Don't know
Total
OtherAsian
AmericanBlack / African
American White
** Race **
Total
18 63 8111.0% 22.5% 18.3%
135 213 34882.8% 76.1% 78.6%
10 4 146.1% 1.4% 3.2%
163 280 443100.0% 100.0% 100.0%
CountpercentCountpercent
CountpercentCountpercent
Yes
No
Don't know
Total
Yes, is ofHispanic
origin
No, is not ofHispanic
origin
*Hispanic/Non-Hispanic*
Total
81 8118.0% 18.0%
356 35678.9% 78.9%
14 143.1% 3.1%
451 451100.0% 100.0%
CountpercentCountpercent
CountpercentCountpercent
Yes
No
Don't know
Total
Own dog(s)
*Dogowner/Non
-owner*Total

Public Opinion Research Telephone Survey Regarding GGNRA Pet Management Issues
The Social Research Laboratory, Northern Arizona University 73
16 17 36 12 8111.9% 15.0% 47.4% 9.4% 18.0%
116 90 40 110 35685.9% 79.6% 52.6% 86.6% 78.9%
3 6 0 5 142.2% 5.3% .0% 3.9% 3.1%
135 113 76 127 451100.0% 100.0% 100.0% 100.0% 100.0%
CountpercentCountpercentCountpercentCountpercent
Yes
No
Don't know
Total
Alameda Marin San Francisco San Mateo*R's county*
Total
Have you ever hired a commercial dog-walker to take your dog(s) for a walk in a GGNRA site?
6 11 1713.3% 29.7% 20.7%
39 26 65
86.7% 70.3% 79.3%45 37 82
100.0% 100.0% 100.0%
CountpercentCount
percentCountpercent
Yes
No
Total
Female Male*Respondent Gender*
Total
3 4 9 1613.6% 17.4% 27.3% 20.5%
19 19 24 62
86.4% 82.6% 72.7% 79.5%22 23 33 78
100.0% 100.0% 100.0% 100.0%
CountpercentCount
percentCountpercent
Yes
No
Total
18-44 45-64 65+*Age 3-way*
Total
5 4 6 1531.3% 11.4% 27.3% 20.5%
11 31 16 5868.8% 88.6% 72.7% 79.5%
16 35 22 73100.0% 100.0% 100.0% 100.0%
Countpercent
CountpercentCountpercent
Yes
No
Total
< $50,000$50,000 -$100,000 > $100,000
*Income 3-way*
Total

Public Opinion Research Telephone Survey Regarding GGNRA Pet Management Issues
The Social Research Laboratory, Northern Arizona University 74
5 1 0 2 8 16100.0% 20.0% .0% 6.9% 29.6% 20.0%
0 4 14 27 19 64
.0% 80.0% 100.0% 93.1% 70.4% 80.0%5 5 14 29 27 80
100.0% 100.0% 100.0% 100.0% 100.0% 100.0%
CountpercentCount
percentCountpercent
Yes
No
Total
Grades1-11
HSdegree/GED
Somecollege/AA BA/BS degree Post-BA/BS
*Education 5-way*
Total
12 1 0 2 1575.0% 4.5% .0% 6.7% 19.0%
4 21 11 28 64
25.0% 95.5% 100.0% 93.3% 81.0%16 22 11 30 79
100.0% 100.0% 100.0% 100.0% 100.0%
CountpercentCount
percentCountpercent
Yes
No
Total
OtherAsian
American
Black /African
American White
** Race **
Total
16 1619.8% 19.8%
65 65
80.2% 80.2%81 81
100.0% 100.0%
CountpercentCount
percentCountpercent
Yes
No
Total
Own dog(s)
*Dogowner/Non
-owner*Total
5 5 5 1 1631.3% 31.3% 13.9% 8.3% 20.0%
11 11 31 11 64
68.8% 68.8% 86.1% 91.7% 80.0%16 16 36 12 80
100.0% 100.0% 100.0% 100.0% 100.0%
CountpercentCount
percentCountpercent
Yes
No
Total
Alameda Marin San Francisco San Mateo*R's county*
Total

Public Opinion Research Telephone Survey Regarding GGNRA Pet Management Issues
The Social Research Laboratory, Northern Arizona University 75
Have you ever seen a dog allowed off-leash by a visitor at any GGNRA site?
379 422 80148.3% 56.5% 52.3%
330 262 59242.1% 35.1% 38.7%
75 63 1389.6% 8.4% 9.0%
784 747 1531100.0% 100.0% 100.0%
CountpercentCountpercentCountpercentCountpercent
Yes
No
Don't know
Total
Female Male*Respondent Gender*
Total
386 217 181 78457.4% 60.8% 39.9% 52.8%
246 117 207 57036.6% 32.8% 45.6% 38.4%
41 23 66 1306.1% 6.4% 14.5% 8.8%
673 357 454 1484100.0% 100.0% 100.0% 100.0%
CountpercentCountpercentCountpercentCountpercent
Yes
No
Don't know
Total
18-44 45-64 65+*Age 3-way*
Total
173 230 189 592
43.5% 59.3% 61.2% 54.1%189 132 89 410
47.5% 34.0% 28.8% 37.4%36 26 31 93
9.0% 6.7% 10.0% 8.5%398 388 309 1095
100.0% 100.0% 100.0% 100.0%
Count
percentCountpercentCount
percentCountpercent
Yes
No
Don't know
Total
< $50,000$50,000 -$100,000 > $100,000
*Income 3-way*
Total

Public Opinion Research Telephone Survey Regarding GGNRA Pet Management Issues
The Social Research Laboratory, Northern Arizona University 76
12 80 197 265 237 79127.3% 40.2% 44.7% 58.8% 62.7% 52.3%
32 95 203 141 115 58672.7% 47.7% 46.0% 31.3% 30.4% 38.7%
0 24 41 45 26 136.0% 12.1% 9.3% 10.0% 6.9% 9.0%
44 199 441 451 378 1513100.0% 100.0% 100.0% 100.0% 100.0% 100.0%
CountpercentCountpercent
CountpercentCountpercent
Yes
No
Don't know
Total
Grades1-11
HSdegree/GED
Somecollege/AA BA/BS degree Post-BA/BS
*Education 5-way*
Total
80 132 78 458 748
50.6% 45.2% 53.4% 54.1% 51.8%65 149 53 294 561
41.1% 51.0% 36.3% 34.7% 38.9%13 11 15 95 134
8.2% 3.8% 10.3% 11.2% 9.3%158 292 146 847 1443
100.0% 100.0% 100.0% 100.0% 100.0%
Count
percentCountpercentCount
percentCountpercent
Yes
No
Don't know
Total
OtherAsian
AmericanBlack / African
American White
** Race **
Total
209 575 78443.0% 56.6% 52.2%
243 339 58250.0% 33.4% 38.7%
34 102 1367.0% 10.0% 9.1%
486 1016 1502100.0% 100.0% 100.0%
CountpercentCountpercent
CountpercentCountpercent
Yes
No
Don't know
Total
Yes, is ofHispanic
origin
No, is not ofHispanic
origin
*Hispanic/Non-Hispanic*
Total

Public Opinion Research Telephone Survey Regarding GGNRA Pet Management Issues
The Social Research Laboratory, Northern Arizona University 77
260 541 80158.6% 49.8% 52.4%
152 440 59234.2% 40.5% 38.7%
32 105 1377.2% 9.7% 9.0%
444 1086 1530100.0% 100.0% 100.0%
CountpercentCountpercentCountpercentCountpercent
Yes
No
Don't know
Total
Own dog(s) Has No dog(s)*Dog owner/Non-owner*
Total
161 202 272 167 80238.9% 60.3% 70.3% 42.1% 52.3%
233 98 92 170 59356.3% 29.3% 23.8% 42.8% 38.7%
20 35 23 60 1384.8% 10.4% 5.9% 15.1% 9.0%
414 335 387 397 1533100.0% 100.0% 100.0% 100.0% 100.0%
CountpercentCountpercentCountpercentCountpercent
Yes
No
Don't know
Total
Alameda Marin San Francisco San Mateo*R's county*
Total
How did dogs being allowed off-leash affect your visitor experience?
107 111 21828.5% 26.3% 27.4%
83 91 174
22.1% 21.6% 21.8%
182 211 39348.5% 50.0% 49.3%
3 9 12.8% 2.1% 1.5%375 422 797
100.0% 100.0% 100.0%
CountpercentCount
percent
Countpercent
CountpercentCountpercent
Added toexperience
Detracted fromexperience
Did not affectexperience
Don't know
Total
Female Male*Respondent Gender*
Total

Public Opinion Research Telephone Survey Regarding GGNRA Pet Management Issues
The Social Research Laboratory, Northern Arizona University 78
137 46 33 21635.9% 21.1% 18.2% 27.7%
62 67 37 166
16.2% 30.7% 20.4% 21.3%
182 103 101 38647.6% 47.2% 55.8% 49.4%
1 2 10 13.3% .9% 5.5% 1.7%382 218 181 781
100.0% 100.0% 100.0% 100.0%
CountpercentCount
percent
Countpercent
CountpercentCountpercent
Added toexperience
Detracted fromexperience
Did not affectexperience
Don't know
Total
18-44 45-64 65+*Age 3-way*
Total
41 51 46 138
23.7% 22.6% 24.3% 23.5%27 50 56 133
15.6% 22.1% 29.6% 22.6%
102 121 84 30759.0% 53.5% 44.4% 52.2%
3 4 3 10
1.7% 1.8% 1.6% 1.7%173 226 189 588
100.0% 100.0% 100.0% 100.0%
Count
percentCount
percent
CountpercentCount
percentCountpercent
Added toexperience
Detracted fromexperience
Did not affectexperience
Don't know
Total
< $50,000$50,000 -$100,000 > $100,000
*Income 3-way*
Total
6 13 48 76 73 21646.2% 16.0% 24.5% 29.0% 30.7% 27.3%
5 17 27 50 72 171
38.5% 21.0% 13.8% 19.1% 30.3% 21.6%
2 50 119 132 87 39015.4% 61.7% 60.7% 50.4% 36.6% 49.4%
0 1 2 4 6 13
.0% 1.2% 1.0% 1.5% 2.5% 1.6%13 81 196 262 238 790
100.0% 100.0% 100.0% 100.0% 100.0% 100.0%
CountpercentCount
percent
CountpercentCount
percentCountpercent
Added toexperience
Detracted fromexperience
Did not affectexperience
Don't know
Total
Grades1-11
HSdegree/GED
Somecollege/AA
BA/BSdegree Post-BA/BS
*Education 5-way*
Total

Public Opinion Research Telephone Survey Regarding GGNRA Pet Management Issues
The Social Research Laboratory, Northern Arizona University 79
17 33 7 144 20121.5% 25.0% 8.9% 31.7% 27.0%
11 29 19 104 163
13.9% 22.0% 24.1% 22.9% 21.9%
51 70 53 196 37064.6% 53.0% 67.1% 43.2% 49.7%
0 0 0 10 10
.0% .0% .0% 2.2% 1.3%79 132 79 454 744
100.0% 100.0% 100.0% 100.0% 100.0%
CountpercentCount
percent
CountpercentCount
percentCountpercent
Added toexperience
Detracted fromexperience
Did not affectexperience
Don't know
Total
OtherAsian
American
Black /African
American White
** Race **
Total
74 140 21436.3% 24.3% 27.4%
27 142 169
13.2% 24.7% 21.7%
103 281 38450.5% 48.8% 49.2%
0 13 13
.0% 2.3% 1.7%204 576 780
100.0% 100.0% 100.0%
CountpercentCount
percent
CountpercentCount
percentCountpercent
Added toexperience
Detracted fromexperience
Did not affectexperience
Don't know
Total
Yes, is ofHispanic
originNo, is not of
Hispanic origin
*Hispanic/Non-Hispanic*
Total
95 122 21736.5% 22.7% 27.2%
23 152 175
8.8% 28.3% 22.0%
139 254 39353.5% 47.3% 49.3%
3 9 121.2% 1.7% 1.5%
260 537 797100.0% 100.0% 100.0%
CountpercentCount
percent
Countpercent
CountpercentCountpercent
Added toexperience
Detracted fromexperience
Did not affectexperience
Don't know
Total
Own dog(s) Has No dog(s)*Dog owner/Non-owner*
Total

Public Opinion Research Telephone Survey Regarding GGNRA Pet Management Issues
The Social Research Laboratory, Northern Arizona University 80
50 61 79 27 217
31.3% 30.3% 29.5% 16.1% 27.2%34 53 52 35 174
21.3% 26.4% 19.4% 20.8% 21.8%
71 87 133 103 39444.4% 43.3% 49.6% 61.3% 49.4%
5 0 4 3 12
3.1% .0% 1.5% 1.8% 1.5%160 201 268 168 797
100.0% 100.0% 100.0% 100.0% 100.0%
Count
percentCount
percent
CountpercentCount
percentCountpercent
Added toexperience
Detracted fromexperience
Did not affectexperience
Don't know
Total
Alameda MarinSan
Francisco San Mateo
*R's county*
Total
Are you familiar with National Park Service regulations regarding dog leash laws at GGNRA sites?
418 383 80151.7% 49.3% 50.5%
372 380 75246.0% 48.9% 47.4%
18 14 322.2% 1.8% 2.0%
808 777 1585100.0% 100.0% 100.0%
CountpercentCountpercentCountpercentCountpercent
Yes
No
Don't know
Total
Female Male*Respondent Gender*
Total
323 175 283 78145.6% 46.9% 62.2% 50.8%
374 182 167 72352.8% 48.8% 36.7% 47.1%
11 16 5 321.6% 4.3% 1.1% 2.1%
708 373 455 1536100.0% 100.0% 100.0% 100.0%
CountpercentCountpercentCountpercentCountpercent
Yes
No
Don't know
Total
18-44 45-64 65+*Age 3-way*
Total

Public Opinion Research Telephone Survey Regarding GGNRA Pet Management Issues
The Social Research Laboratory, Northern Arizona University 81
200 211 153 564
45.9% 53.1% 48.7% 49.2%231 179 149 559
53.0% 45.1% 47.5% 48.7%5 7 12 24
1.1% 1.8% 3.8% 2.1%436 397 314 1147
100.0% 100.0% 100.0% 100.0%
Count
percentCountpercentCount
percentCountpercent
Yes
No
Don't know
Total
< $50,000$50,000 -$100,000 > $100,000
*Income 3-way*
Total
39 94 195 256 211 79588.6% 40.0% 43.0% 57.1% 54.4% 50.7%
5 139 252 174 171 74111.4% 59.1% 55.6% 38.8% 44.1% 47.3%
0 2 6 18 6 32.0% .9% 1.3% 4.0% 1.5% 2.0%
44 235 453 448 388 1568100.0% 100.0% 100.0% 100.0% 100.0% 100.0%
CountpercentCountpercent
CountpercentCountpercent
Yes
No
Don't know
Total
Grades1-11
HSdegree/GED
Somecollege/AA BA/BS degree Post-BA/BS
*Education 5-way*
Total
83 139 74 470 76651.2% 41.1% 49.0% 55.6% 51.2%
76 189 77 362 70446.9% 55.9% 51.0% 42.8% 47.0%
3 10 0 14 271.9% 3.0% .0% 1.7% 1.8%
162 338 151 846 1497100.0% 100.0% 100.0% 100.0% 100.0%
CountpercentCountpercent
CountpercentCountpercent
Yes
No
Don't know
Total
OtherAsian
American
Black /African
American White
** Race **
Total

Public Opinion Research Telephone Survey Regarding GGNRA Pet Management Issues
The Social Research Laboratory, Northern Arizona University 82
252 536 78850.5% 50.6% 50.6%
237 501 73847.5% 47.3% 47.4%
10 22 322.0% 2.1% 2.1%
499 1059 1558100.0% 100.0% 100.0%
CountpercentCountpercent
CountpercentCountpercent
Yes
No
Don't know
Total
Yes, is ofHispanic
origin
No, is not ofHispanic
origin
*Hispanic/Non-Hispanic*
Total
283 518 80162.7% 45.6% 50.5%
159 593 75235.3% 52.2% 47.4%
9 24 332.0% 2.1% 2.1%
451 1135 1586100.0% 100.0% 100.0%
CountpercentCountpercentCountpercentCountpercent
Yes
No
Don't know
Total
Own dog(s) Has No dog(s)*Dog owner/Non-owner*
Total
200 211 226 164 80145.1% 62.4% 57.4% 39.9% 50.5%
234 118 167 233 75252.8% 34.9% 42.4% 56.7% 47.4%
9 9 1 14 332.0% 2.7% .3% 3.4% 2.1%
443 338 394 411 1586100.0% 100.0% 100.0% 100.0% 100.0%
CountpercentCountpercentCountpercentCountpercent
Yes
No
Don't know
Total
Alameda Marin San Francisco San Mateo*R's county*
Total

Public Opinion Research Telephone Survey Regarding GGNRA Pet Management Issues
The Social Research Laboratory, Northern Arizona University 83
Current regulations allow for walking dogs on-leash at most GGNRA sites and prohibit any off-leash dogwalking. Do you support or oppose this current regulation?
416 301 71751.8% 38.1% 45.0%
185 221 406
23.0% 27.9% 25.5%
74 96 170
9.2% 12.1% 10.7%84 109 193
10.5% 13.8% 12.1%44 64 108
5.5% 8.1% 6.8%803 791 1594
100.0% 100.0% 100.0%
Countpercent
Count
percent
Count
percentCountpercentCount
percentCountpercent
Stronglysupport
Somewhatsupport
Somewhatoppose
Stronglyoppose
Don't know/Noopinion
Total
Female Male*Respondent Gender*
Total
276 167 246 68939.1% 44.9% 52.5% 44.6%
212 84 103 399
30.1% 22.6% 22.0% 25.8%
77 55 35 167
10.9% 14.8% 7.5% 10.8%89 46 54 189
12.6% 12.4% 11.5% 12.2%51 20 31 102
7.2% 5.4% 6.6% 6.6%705 372 469 1546
100.0% 100.0% 100.0% 100.0%
Countpercent
Count
percent
Count
percentCountpercentCount
percentCountpercent
Stronglysupport
Somewhatsupport
Somewhatoppose
Stronglyoppose
Don't know/Noopinion
Total
18-44 45-64 65+*Age 3-way*
Total

Public Opinion Research Telephone Survey Regarding GGNRA Pet Management Issues
The Social Research Laboratory, Northern Arizona University 84
210 148 131 489
48.3% 37.9% 42.0% 43.0%128 95 94 317
29.4% 24.3% 30.1% 27.9%
41 56 33 1309.4% 14.3% 10.6% 11.4%
30 65 37 1326.9% 16.6% 11.9% 11.6%
26 27 17 70
6.0% 6.9% 5.4% 6.2%435 391 312 1138
100.0% 100.0% 100.0% 100.0%
Count
percentCount
percent
CountpercentCountpercentCount
percentCountpercent
Stronglysupport
Somewhatsupport
Somewhatoppose
Stronglyoppose
Don't know/Noopinion
Total
< $50,000$50,000 -$100,000 > $100,000
*Income 3-way*
Total
44 116 185 190 172 707100.0% 49.6% 40.8% 41.4% 44.2% 44.8%
0 61 137 115 90 403
.0% 26.1% 30.2% 25.1% 23.1% 25.5%
0 20 60 58 31 169.0% 8.5% 13.2% 12.6% 8.0% 10.7%
0 21 31 67 73 192.0% 9.0% 6.8% 14.6% 18.8% 12.2%
0 16 40 29 23 108
.0% 6.8% 8.8% 6.3% 5.9% 6.8%44 234 453 459 389 1579
100.0% 100.0% 100.0% 100.0% 100.0% 100.0%
CountpercentCount
percent
Countpercent
CountpercentCount
percentCountpercent
Stronglysupport
Somewhatsupport
Somewhatoppose
Stronglyoppose
Don't know/Noopinion
Total
Grades1-11
HSdegree/GED
Somecollege/AA BA/BS degree Post-BA/BS
*Education 5-way*
Total

Public Opinion Research Telephone Survey Regarding GGNRA Pet Management Issues
The Social Research Laboratory, Northern Arizona University 85
80 132 73 394 679
48.8% 39.1% 48.3% 46.1% 45.0%47 102 37 199 385
28.7% 30.2% 24.5% 23.3% 25.5%
14 28 22 95 1598.5% 8.3% 14.6% 11.1% 10.5%
19 45 7 116 18711.6% 13.3% 4.6% 13.6% 12.4%
4 31 12 51 98
2.4% 9.2% 7.9% 6.0% 6.5%164 338 151 855 1508
100.0% 100.0% 100.0% 100.0% 100.0%
Count
percentCount
percent
CountpercentCountpercentCount
percentCountpercent
Stronglysupport
Somewhatsupport
Somewhatoppose
Stronglyoppose
Don't know/Noopinion
Total
OtherAsian
AmericanBlack / African
American White
** Race **
Total
218 484 70242.9% 45.8% 44.9%
140 261 401
27.6% 24.7% 25.6%
63 104 16712.4% 9.8% 10.7%
69 121 19013.6% 11.4% 12.1%
18 87 105
3.5% 8.2% 6.7%508 1057 1565
100.0% 100.0% 100.0%
CountpercentCount
percent
Countpercent
CountpercentCount
percentCountpercent
Stronglysupport
Somewhatsupport
Somewhatoppose
Stronglyoppose
Don't know/Noopinion
Total
Yes, is ofHispanic
origin
No, is not ofHispanic
origin
*Hispanic/Non-Hispanic*
Total

Public Opinion Research Telephone Survey Regarding GGNRA Pet Management Issues
The Social Research Laboratory, Northern Arizona University 86
167 551 71837.1% 48.1% 45.0%
118 289 407
26.2% 25.2% 25.5%
53 116 169
11.8% 10.1% 10.6%95 98 193
21.1% 8.6% 12.1%17 91 108
3.8% 7.9% 6.8%450 1145 1595
100.0% 100.0% 100.0%
Countpercent
Count
percent
Count
percentCountpercentCount
percentCountpercent
Stronglysupport
Somewhatsupport
Somewhatoppose
Stronglyoppose
Don't know/Noopinion
Total
Own dog(s) Has No dog(s)*Dog owner/Non-owner*
Total
197 149 162 210 71843.0% 44.2% 41.5% 51.2% 45.0%
134 71 84 117 406
29.3% 21.1% 21.5% 28.5% 25.5%
43 43 57 27 170
9.4% 12.8% 14.6% 6.6% 10.7%63 45 56 29 193
13.8% 13.4% 14.4% 7.1% 12.1%21 29 31 27 108
4.6% 8.6% 7.9% 6.6% 6.8%458 337 390 410 1595
100.0% 100.0% 100.0% 100.0% 100.0%
Countpercent
Count
percent
Count
percentCountpercentCount
percentCountpercent
Stronglysupport
Somewhatsupport
Somewhatoppose
Stronglyoppose
Don't know/Noopinion
Total
Alameda Marin San Francisco San Mateo*R's county*
Total

Public Opinion Research Telephone Survey Regarding GGNRA Pet Management Issues
The Social Research Laboratory, Northern Arizona University 87
Do you support or oppose further limiting on-leash dog walking in the GGNRA?
158 146 30419.6% 18.4% 19.0%
99 129 228
12.3% 16.3% 14.3%
254 183 437
31.5% 23.1% 27.3%231 222 453
28.6% 28.0% 28.3%65 112 177
8.1% 14.1% 11.1%807 792 1599
100.0% 100.0% 100.0%
Countpercent
Count
percent
Count
percentCountpercentCount
percentCountpercent
Stronglysupport
Somewhatsupport
Somewhatoppose
Stronglyoppose
Don't know/Noopinion
Total
Female Male*Respondent Gender*
Total
120 63 103 28617.0% 16.9% 22.0% 18.5%
125 42 52 219
17.7% 11.3% 11.1% 14.2%
181 115 133 429
25.6% 30.9% 28.4% 27.7%197 120 124 441
27.9% 32.3% 26.4% 28.5%83 32 57 172
11.8% 8.6% 12.2% 11.1%706 372 469 1547
100.0% 100.0% 100.0% 100.0%
Countpercent
Count
percent
Count
percentCountpercentCount
percentCountpercent
Stronglysupport
Somewhatsupport
Somewhatoppose
Stronglyoppose
Don't know/Noopinion
Total
18-44 45-64 65+*Age 3-way*
Total

Public Opinion Research Telephone Survey Regarding GGNRA Pet Management Issues
The Social Research Laboratory, Northern Arizona University 88
94 55 51 200
21.5% 14.0% 16.3% 17.5%82 53 39 174
18.8% 13.5% 12.5% 15.2%
120 125 88 33327.5% 31.8% 28.1% 29.1%
102 126 107 33523.3% 32.1% 34.2% 29.3%
39 34 28 101
8.9% 8.7% 8.9% 8.8%437 393 313 1143
100.0% 100.0% 100.0% 100.0%
Count
percentCount
percent
CountpercentCountpercentCount
percentCountpercent
Stronglysupport
Somewhatsupport
Somewhatoppose
Stronglyoppose
Don't know/Noopinion
Total
< $50,000$50,000 -$100,000 > $100,000
*Income 3-way*
Total
22 35 78 87 78 30050.0% 14.9% 17.3% 18.9% 20.1% 19.0%
7 64 65 55 33 224
15.9% 27.2% 14.4% 11.9% 8.5% 14.2%
13 44 161 129 89 43629.5% 18.7% 35.6% 28.0% 22.9% 27.6%
2 52 112 146 136 4484.5% 22.1% 24.8% 31.7% 35.0% 28.3%
0 40 36 44 53 173
.0% 17.0% 8.0% 9.5% 13.6% 10.9%44 235 452 461 389 1581
100.0% 100.0% 100.0% 100.0% 100.0% 100.0%
CountpercentCount
percent
Countpercent
CountpercentCount
percentCountpercent
Stronglysupport
Somewhatsupport
Somewhatoppose
Strongly oppose
Don't know/Noopinion
Total
Grades1-11
HSdegree/GED
Somecollege/AA BA/BS degree Post-BA/BS
*Education 5-way*
Total

Public Opinion Research Telephone Survey Regarding GGNRA Pet Management Issues
The Social Research Laboratory, Northern Arizona University 89
34 70 30 153 28720.9% 20.7% 19.7% 17.8% 19.0%
29 80 22 91 222
17.8% 23.7% 14.5% 10.6% 14.7%
38 71 61 252 42223.3% 21.0% 40.1% 29.3% 27.9%
45 75 21 284 42527.6% 22.2% 13.8% 33.1% 28.1%
17 42 18 79 156
10.4% 12.4% 11.8% 9.2% 10.3%163 338 152 859 1512
100.0% 100.0% 100.0% 100.0% 100.0%
CountpercentCount
percent
Countpercent
CountpercentCount
percentCountpercent
Stronglysupport
Somewhatsupport
Somewhatoppose
Stronglyoppose
Don't know/Noopinion
Total
OtherAsian
American
Black /African
American White
** Race **
Total
124 175 29924.1% 16.6% 19.0%
66 158 224
12.8% 15.0% 14.3%
155 278 433
30.2% 26.3% 27.6%117 324 441
22.8% 30.7% 28.1%52 121 173
10.1% 11.5% 11.0%514 1056 1570
100.0% 100.0% 100.0%
CountpercentCount
percent
Count
percentCountpercentCount
percentCountpercent
Stronglysupport
Somewhatsupport
Somewhatoppose
Stronglyoppose
Don't know/Noopinion
Total
Yes, is ofHispanic
origin
No, is not ofHispanic
origin
*Hispanic/Non-Hispanic*
Total

Public Opinion Research Telephone Survey Regarding GGNRA Pet Management Issues
The Social Research Laboratory, Northern Arizona University 90
57 246 303
12.7% 21.4% 19.0%55 173 228
12.2% 15.1% 14.3%
134 303 43729.8% 26.4% 27.3%
180 273 45340.1% 23.8% 28.3%
23 154 177
5.1% 13.4% 11.1%449 1149 1598
100.0% 100.0% 100.0%
Count
percentCount
percent
CountpercentCountpercentCount
percentCountpercent
Stronglysupport
Somewhatsupport
Somewhatoppose
Stronglyoppose
Don't know/Noopinion
Total
Own dog(s)Has Nodog(s)
*Dog owner/Non-owner*
Total
95 68 68 73 30420.8% 20.1% 17.3% 17.8% 19.0%
82 36 45 64 227
17.9% 10.6% 11.5% 15.6% 14.2%
109 84 116 128 437
23.9% 24.8% 29.5% 31.3% 27.3%126 112 113 102 453
27.6% 33.0% 28.8% 24.9% 28.3%45 39 51 42 177
9.8% 11.5% 13.0% 10.3% 11.1%457 339 393 409 1598
100.0% 100.0% 100.0% 100.0% 100.0%
Countpercent
Count
percent
Count
percentCountpercentCount
percentCountpercent
Stronglysupport
Somewhatsupport
Somewhatoppose
Stronglyoppose
Don't know/Noopinion
Total
Alameda Marin San Francisco San Mateo*R's county*
Total

Public Opinion Research Telephone Survey Regarding GGNRA Pet Management Issues
The Social Research Laboratory, Northern Arizona University 91
Do you support or oppose allowing off-leash dog walking in GGNRA sites?
117 156 27314.5% 19.7% 17.1%
191 175 366
23.6% 22.1% 22.9%
135 130 265
16.7% 16.4% 16.6%307 269 576
38.0% 33.9% 36.0%58 63 121
7.2% 7.9% 7.6%808 793 1601
100.0% 100.0% 100.0%
Countpercent
Count
percent
Count
percentCountpercentCount
percentCountpercent
Stronglysupport
Somewhatsupport
Somewhatoppose
Stronglyoppose
Don't know/Noopinion
Total
Female Male*Respondent Gender*
Total
149 62 53 26421.0% 16.7% 11.3% 17.0%
167 73 118 358
23.6% 19.6% 25.2% 23.1%
131 55 75 261
18.5% 14.8% 16.0% 16.8%198 164 187 549
27.9% 44.1% 39.9% 35.4%64 18 36 118
9.0% 4.8% 7.7% 7.6%709 372 469 1550
100.0% 100.0% 100.0% 100.0%
Countpercent
Count
percent
Count
percentCountpercentCount
percentCountpercent
Stronglysupport
Somewhatsupport
Somewhatoppose
Stronglyoppose
Don't know/Noopinion
Total
18-44 45-64 65+*Age 3-way*
Total

Public Opinion Research Telephone Survey Regarding GGNRA Pet Management Issues
The Social Research Laboratory, Northern Arizona University 92
58 86 64 208
13.3% 21.7% 20.4% 18.2%116 102 59 277
26.5% 25.8% 18.8% 24.2%
85 59 63 20719.5% 14.9% 20.1% 18.1%
145 128 112 38533.2% 32.3% 35.8% 33.6%
33 21 15 69
7.6% 5.3% 4.8% 6.0%437 396 313 1146
100.0% 100.0% 100.0% 100.0%
Count
percentCount
percent
CountpercentCountpercentCount
percentCountpercent
Stronglysupport
Somewhatsupport
Somewhatoppose
Stronglyoppose
Don't know/Noopinion
Total
< $50,000$50,000 -$100,000 > $100,000
*Income 3-way*
Total
9 26 71 86 78 27020.0% 11.1% 15.7% 18.7% 20.1% 17.1%
0 45 124 123 70 362
.0% 19.2% 27.4% 26.7% 18.0% 22.9%
3 48 79 73 59 262
6.7% 20.5% 17.4% 15.8% 15.2% 16.6%20 97 141 156 152 566
44.4% 41.5% 31.1% 33.8% 39.2% 35.8%13 18 38 23 29 121
28.9% 7.7% 8.4% 5.0% 7.5% 7.7%45 234 453 461 388 1581
100.0% 100.0% 100.0% 100.0% 100.0% 100.0%
CountpercentCount
percent
Count
percentCountpercentCount
percentCountpercent
Stronglysupport
Somewhatsupport
Somewhatoppose
Stronglyoppose
Don't know/Noopinion
Total
Grades1-11
HSdegree/GED
Somecollege/AA BA/BS degree Post-BA/BS
*Education 5-way*
Total

Public Opinion Research Telephone Survey Regarding GGNRA Pet Management Issues
The Social Research Laboratory, Northern Arizona University 93
36 69 8 144 257
22.2% 20.4% 5.3% 16.7% 17.0%29 57 58 201 345
17.9% 16.9% 38.4% 23.4% 22.8%
28 58 23 144 25317.3% 17.2% 15.2% 16.7% 16.7%
63 108 52 320 54338.9% 32.0% 34.4% 37.2% 35.9%
6 46 10 51 113
3.7% 13.6% 6.6% 5.9% 7.5%162 338 151 860 1511
100.0% 100.0% 100.0% 100.0% 100.0%
Count
percentCount
percent
CountpercentCountpercentCount
percentCountpercent
Stronglysupport
Somewhatsupport
Somewhatoppose
Stronglyoppose
Don't know/Noopinion
Total
OtherAsian
AmericanBlack / African
American White
** Race **
Total
101 166 26719.7% 15.7% 17.0%
101 256 357
19.7% 24.2% 22.7%
74 188 262
14.4% 17.8% 16.7%193 373 566
37.6% 35.3% 36.0%44 75 119
8.6% 7.1% 7.6%513 1058 1571
100.0% 100.0% 100.0%
CountpercentCount
percent
Count
percentCountpercentCount
percentCountpercent
Stronglysupport
Somewhatsupport
Somewhatoppose
Strongly oppose
Don't know/Noopinion
Total
Yes, is ofHispanic
origin
No, is not ofHispanic
origin
*Hispanic/Non-Hispanic*
Total

Public Opinion Research Telephone Survey Regarding GGNRA Pet Management Issues
The Social Research Laboratory, Northern Arizona University 94
131 141 27229.1% 12.3% 17.0%
100 266 366
22.2% 23.2% 22.9%
74 191 265
16.4% 16.6% 16.6%129 446 575
28.7% 38.8% 36.0%16 105 121
3.6% 9.1% 7.6%450 1149 1599
100.0% 100.0% 100.0%
Countpercent
Count
percent
Count
percentCountpercentCount
percentCountpercent
Stronglysupport
Somewhatsupport
Somewhatoppose
Stronglyoppose
Don't know/Noopinion
Total
Own dog(s) Has No dog(s)*Dog owner/Non-owner*
Total
75 78 73 47 27316.4% 23.1% 18.6% 11.4% 17.1%
102 68 104 92 366
22.3% 20.2% 26.5% 22.3% 22.9%
79 61 57 68 265
17.2% 18.1% 14.5% 16.5% 16.6%161 107 126 181 575
35.2% 31.8% 32.1% 43.9% 35.9%41 23 33 24 121
9.0% 6.8% 8.4% 5.8% 7.6%458 337 393 412 1600
100.0% 100.0% 100.0% 100.0% 100.0%
Countpercent
Count
percent
Count
percentCountpercentCount
percentCountpercent
Stronglysupport
Somewhatsupport
Somewhatoppose
Stronglyoppose
Don't know/Noopinion
Total
Alameda Marin San Francisco San Mateo*R's county*
Total

Public Opinion Research Telephone Survey Regarding GGNRA Pet Management Issues
The Social Research Laboratory, Northern Arizona University 95
Do you prefer allowing dogs off-leash in all areas where on-leash walking is now allowed,or do you prefer allowing dogs off-leash ONLY in limited areas?
63 66 129
20.5% 20.0% 20.2%
236 237 473
76.6% 71.8% 74.1%
5 2 71.6% .6% 1.1%
4 25 29
1.3% 7.6% 4.5%308 330 638
100.0% 100.0% 100.0%
Count
percent
Count
percent
CountpercentCount
percentCountpercent
In all areaswhere on-leashis allowed
Off-leash onlyin limited areas
Neither
Don't know/Noopinion
Total
Female Male*Respondent Gender*
Total
66 29 34 129
20.9% 21.3% 20.0% 20.7%
229 102 127 458
72.5% 75.0% 74.7% 73.6%
2 3 1 6.6% 2.2% .6% 1.0%
19 2 8 29
6.0% 1.5% 4.7% 4.7%316 136 170 622
100.0% 100.0% 100.0% 100.0%
Count
percent
Count
percent
CountpercentCount
percentCountpercent
In all areaswhere on-leashis allowed
Off-leash onlyin limited areas
Neither
Don't know/Noopinion
Total
18-44 45-64 65+*Age 3-way*
Total
24 48 31 103
13.8% 25.5% 25.4% 21.3%
139 139 87 365
79.9% 73.9% 71.3% 75.4%
2 1 3 61.1% .5% 2.5% 1.2%
9 0 1 10
5.2% .0% .8% 2.1%174 188 122 484
100.0% 100.0% 100.0% 100.0%
Count
percent
Count
percent
CountpercentCount
percentCountpercent
In all areaswhere on-leashis allowed
Off-leash onlyin limited areas
Neither
Don't know/Noopinion
Total
< $50,000$50,000 -$100,000 > $100,000
*Income 3-way*
Total

Public Opinion Research Telephone Survey Regarding GGNRA Pet Management Issues
The Social Research Laboratory, Northern Arizona University 96
5 16 27 37 43 128
55.6% 22.9% 13.8% 17.7% 29.1% 20.3%
4 50 160 153 100 467
44.4% 71.4% 81.6% 73.2% 67.6% 73.9%
0 2 2 1 3 8.0% 2.9% 1.0% .5% 2.0% 1.3%
0 2 7 18 2 29
.0% 2.9% 3.6% 8.6% 1.4% 4.6%9 70 196 209 148 632
100.0% 100.0% 100.0% 100.0% 100.0% 100.0%
Count
percent
Count
percent
CountpercentCount
percentCountpercent
In all areaswhere on-leashis allowed
Off-leash onlyin limited areas
Neither
Don't know/Noopinion
Total
Grades1-11
HSdegree/GED
Somecollege/AA BA/BS degree Post-BA/BS
*Education 5-way*
Total
23 28 6 65 122
35.4% 22.2% 9.2% 18.8% 20.3%
42 79 54 270 445
64.6% 62.7% 83.1% 78.0% 73.9%
0 2 0 5 7.0% 1.6% .0% 1.4% 1.2%
0 17 5 6 28
.0% 13.5% 7.7% 1.7% 4.7%65 126 65 346 602
100.0% 100.0% 100.0% 100.0% 100.0%
Count
percent
Count
percent
CountpercentCount
percentCountpercent
In all areaswhere on-leashis allowed
Off-leash onlyin limited areas
Neither
Don't know/Noopinion
Total
OtherAsian
AmericanBlack / African
American White
** Race **
Total

Public Opinion Research Telephone Survey Regarding GGNRA Pet Management Issues
The Social Research Laboratory, Northern Arizona University 97
34 93 127
16.8% 22.0% 20.3%
152 309 461
75.2% 73.0% 73.8%
0 7 7.0% 1.7% 1.1%
16 14 30
7.9% 3.3% 4.8%202 423 625
100.0% 100.0% 100.0%
Count
percent
Count
percent
CountpercentCount
percentCountpercent
In all areaswhere on-leashis allowed
Off-leash onlyin limited areas
Neither
Don't know/Noopinion
Total
Yes, is ofHispanic
origin
No, is not ofHispanic
origin
*Hispanic/Non-Hispanic*
Total
74 55 129
32.0% 13.5% 20.3%
153 319 472
66.2% 78.6% 74.1%
2 5 7.9% 1.2% 1.1%
2 27 29
.9% 6.7% 4.6%231 406 637
100.0% 100.0% 100.0%
Count
percent
Count
percent
CountpercentCount
percentCountpercent
In all areaswhere on-leashis allowed
Off-leash onlyin limited areas
Neither
Don't know/Noopinion
Total
Own dog(s) Has No dog(s)*Dog owner/Non-owner*
Total
30 30 46 23 129
16.9% 20.5% 26.0% 16.7% 20.2%
144 91 127 110 472
81.4% 62.3% 71.8% 79.7% 74.0%
1 2 2 2 7.6% 1.4% 1.1% 1.4% 1.1%
2 23 2 3 30
1.1% 15.8% 1.1% 2.2% 4.7%177 146 177 138 638
100.0% 100.0% 100.0% 100.0% 100.0%
Count
percent
Count
percent
CountpercentCount
percentCountpercent
In all areaswhere on-leashis allowed
Off-leash onlyin limited areas
Neither
Don't know/Noopinion
Total
Alameda Marin San Francisco San Mateo*R's county*
Total

Public Opinion Research Telephone Survey Regarding GGNRA Pet Management Issues
The Social Research Laboratory, Northern Arizona University 98
If GGNRA areas were designated for off-leash dog walking, do you favor off-leash dog walking being available ALL the time or ONLY during limited times?
189 215 40461.6% 65.5% 63.6%
114 103 217
37.1% 31.4% 34.2%
4 10 14
1.3% 3.0% 2.2%307 328 635
100.0% 100.0% 100.0%
Countpercent
Count
percent
Count
percentCountpercent
All the time
During limitedtimes
Don't know
Total
Female Male*Respondent Gender*
Total
211 97 88 39667.0% 71.3% 51.8% 63.8%
98 34 79 211
31.1% 25.0% 46.5% 34.0%
6 5 3 14
1.9% 3.7% 1.8% 2.3%315 136 170 621
100.0% 100.0% 100.0% 100.0%
Countpercent
Count
percent
Count
percentCountpercent
All the time
During limitedtimes
Don't know
Total
18-44 45-64 65+*Age 3-way*
Total
100 128 89 317
58.1% 68.4% 71.8% 65.6%68 57 32 157
39.5% 30.5% 25.8% 32.5%
4 2 3 9
2.3% 1.1% 2.4% 1.9%172 187 124 483
100.0% 100.0% 100.0% 100.0%
Count
percentCount
percent
Count
percentCountpercent
All the time
During limitedtimes
Don't know
Total
< $50,000$50,000 -$100,000 > $100,000
*Income 3-way*
Total
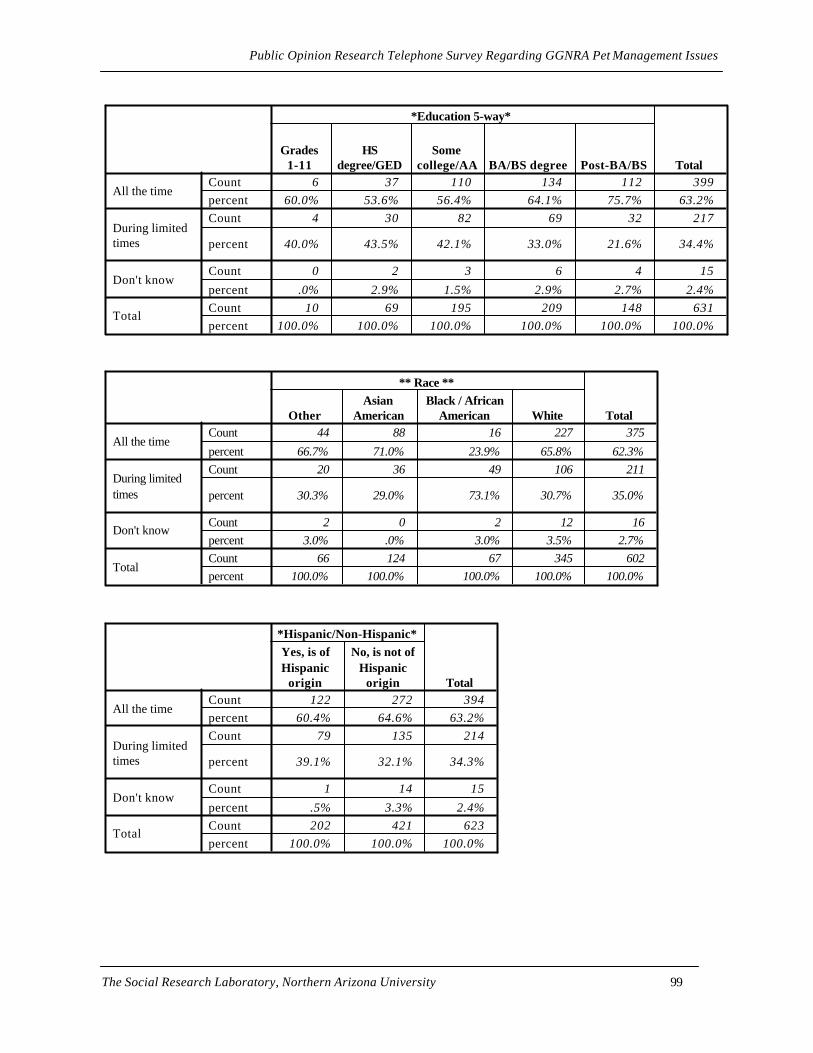
Public Opinion Research Telephone Survey Regarding GGNRA Pet Management Issues
The Social Research Laboratory, Northern Arizona University 99
6 37 110 134 112 39960.0% 53.6% 56.4% 64.1% 75.7% 63.2%
4 30 82 69 32 217
40.0% 43.5% 42.1% 33.0% 21.6% 34.4%
0 2 3 6 4 15
.0% 2.9% 1.5% 2.9% 2.7% 2.4%10 69 195 209 148 631
100.0% 100.0% 100.0% 100.0% 100.0% 100.0%
CountpercentCount
percent
Count
percentCountpercent
All the time
During limitedtimes
Don't know
Total
Grades1-11
HSdegree/GED
Somecollege/AA BA/BS degree Post-BA/BS
*Education 5-way*
Total
44 88 16 227 375
66.7% 71.0% 23.9% 65.8% 62.3%20 36 49 106 211
30.3% 29.0% 73.1% 30.7% 35.0%
2 0 2 12 163.0% .0% 3.0% 3.5% 2.7%
66 124 67 345 602100.0% 100.0% 100.0% 100.0% 100.0%
Count
percentCount
percent
CountpercentCountpercent
All the time
During limitedtimes
Don't know
Total
OtherAsian
AmericanBlack / African
American White
** Race **
Total
122 272 39460.4% 64.6% 63.2%
79 135 214
39.1% 32.1% 34.3%
1 14 15
.5% 3.3% 2.4%202 421 623
100.0% 100.0% 100.0%
CountpercentCount
percent
Count
percentCountpercent
All the time
During limitedtimes
Don't know
Total
Yes, is ofHispanic
origin
No, is not ofHispanic
origin
*Hispanic/Non-Hispanic*
Total

Public Opinion Research Telephone Survey Regarding GGNRA Pet Management Issues
The Social Research Laboratory, Northern Arizona University 100
171 234 40573.7% 57.8% 63.6%
58 159 217
25.0% 39.3% 34.1%
3 12 15
1.3% 3.0% 2.4%232 405 637
100.0% 100.0% 100.0%
Countpercent
Count
percent
Count
percentCountpercent
All the time
During limitedtimes
Don't know
Total
Own dog(s) Has No dog(s)*Dog owner/Non-owner*
Total
99 104 129 72 40456.6% 71.2% 73.3% 51.8% 63.5%
73 40 44 60 217
41.7% 27.4% 25.0% 43.2% 34.1%
3 2 3 7 15
1.7% 1.4% 1.7% 5.0% 2.4%175 146 176 139 636
100.0% 100.0% 100.0% 100.0% 100.0%
Countpercent
Count
percent
Count
percentCountpercent
All the time
During limitedtimes
Don't know
Total
Alameda Marin San Francisco San Mateo*R's county*
Total
Do you prefer limiting hours in the day when off-leash dog-walking takes place, limiting days in the week when off-leash walking takes place, or both?
45 30 7539.5% 29.4% 34.7%
22 27 49
19.3% 26.5% 22.7%42 40 82
36.8% 39.2% 38.0%5 5 10
4.4% 4.9% 4.6%114 102 216
100.0% 100.0% 100.0%
CountpercentCount
percentCountpercentCount
percentCountpercent
Limiting hours
Limiting days
Both
Don't know
Total
Female Male*Respondent Gender*
Total

Public Opinion Research Telephone Survey Regarding GGNRA Pet Management Issues
The Social Research Laboratory, Northern Arizona University 101
37 14 24 7537.8% 41.2% 30.4% 35.5%
21 8 17 46
21.4% 23.5% 21.5% 21.8%39 8 33 80
39.8% 23.5% 41.8% 37.9%1 4 5 10
1.0% 11.8% 6.3% 4.7%98 34 79 211
100.0% 100.0% 100.0% 100.0%
CountpercentCount
percentCountpercentCount
percentCountpercent
Limiting hours
Limiting days
Both
Don't know
Total
18-44 45-64 65+*Age 3-way*
Total
14 16 8 3820.6% 27.6% 25.0% 24.1%
26 9 7 4238.2% 15.5% 21.9% 26.6%
27 32 15 7439.7% 55.2% 46.9% 46.8%
1 1 2 41.5% 1.7% 6.3% 2.5%
68 58 32 158100.0% 100.0% 100.0% 100.0%
Countpercent
CountpercentCountpercent
CountpercentCountpercent
Limiting hours
Limiting days
Both
Don't know
Total
< $50,000$50,000 -$100,000 > $100,000
*Income 3-way*
Total
0 6 12 41 15 74.0% 20.0% 14.8% 58.6% 46.9% 34.1%
4 8 26 8 4 50
100.0% 26.7% 32.1% 11.4% 12.5% 23.0%0 15 40 20 8 83
.0% 50.0% 49.4% 28.6% 25.0% 38.2%0 1 3 1 5 10
.0% 3.3% 3.7% 1.4% 15.6% 4.6%4 30 81 70 32 217
100.0% 100.0% 100.0% 100.0% 100.0% 100.0%
CountpercentCount
percentCountpercentCount
percentCountpercent
Limiting hours
Limiting days
Both
Don't know
Total
Grades1-11
HSdegree/GED
Somecollege/AA
BA/BSdegree Post-BA/BS
*Education 5-way*
Total

Public Opinion Research Telephone Survey Regarding GGNRA Pet Management Issues
The Social Research Laboratory, Northern Arizona University 102
6 17 8 42 73
30.0% 47.2% 16.3% 39.6% 34.6%5 9 1 34 49
25.0% 25.0% 2.0% 32.1% 23.2%8 9 40 23 80
40.0% 25.0% 81.6% 21.7% 37.9%
1 1 0 7 95.0% 2.8% .0% 6.6% 4.3%
20 36 49 106 211100.0% 100.0% 100.0% 100.0% 100.0%
Count
percentCountpercentCountpercent
CountpercentCountpercent
Limiting hours
Limiting days
Both
Don't know
Total
OtherAsian
AmericanBlack / African
American White
** Race **
Total
33 41 7441.8% 30.6% 34.7%
23 24 47
29.1% 17.9% 22.1%23 60 83
29.1% 44.8% 39.0%0 9 9
.0% 6.7% 4.2%79 134 213
100.0% 100.0% 100.0%
CountpercentCount
percentCountpercentCount
percentCountpercent
Limiting hours
Limiting days
Both
Don't know
Total
Yes, is ofHispanic
origin
No, is not ofHispanic
origin
*Hispanic/Non-Hispanic*
Total
21 54 7536.2% 34.2% 34.7%
10 40 50
17.2% 25.3% 23.1%25 57 82
43.1% 36.1% 38.0%2 7 9
3.4% 4.4% 4.2%58 158 216
100.0% 100.0% 100.0%
CountpercentCount
percentCountpercentCount
percentCountpercent
Limiting hours
Limiting days
Both
Don't know
Total
Own dog(s) Has No dog(s)*Dog owner/Non-owner*
Total

Public Opinion Research Telephone Survey Regarding GGNRA Pet Management Issues
The Social Research Laboratory, Northern Arizona University 103
19 21 13 21 7426.0% 52.5% 29.5% 35.0% 34.1%
30 3 7 10 50
41.1% 7.5% 15.9% 16.7% 23.0%23 13 23 24 83
31.5% 32.5% 52.3% 40.0% 38.2%1 3 1 5 10
1.4% 7.5% 2.3% 8.3% 4.6%73 40 44 60 217
100.0% 100.0% 100.0% 100.0% 100.0%
CountpercentCount
percentCountpercentCount
percentCountpercent
Limiting hours
Limiting days
Both
Don't know
Total
Alameda Marin San Francisco San Mateo*R's county*
Total
Do you prefer limiting the hours for off-leash dog-walking to...?
22 14 3625.3% 20.0% 22.9%
3 7 10
3.4% 10.0% 6.4%
16 17 33
18.4% 24.3% 21.0%36 25 61
41.4% 35.7% 38.9%10 7 17
11.5% 10.0% 10.8%87 70 157
100.0% 100.0% 100.0%
Countpercent
Count
percent
Count
percentCountpercentCount
percentCountpercent
Only morninghours
Only afternoonhours
Onlyevening/duskhoursNo limit onhours (all times)
Don't know-Noopinion
Total
Female Male*Respondent Gender*
Total

Public Opinion Research Telephone Survey Regarding GGNRA Pet Management Issues
The Social Research Laboratory, Northern Arizona University 104
32 4 1 3742.1% 17.4% 1.8% 23.7%
8 2 0 10
10.5% 8.7% .0% 6.4%
15 6 12 33
19.7% 26.1% 21.1% 21.2%14 7 39 60
18.4% 30.4% 68.4% 38.5%7 4 5 16
9.2% 17.4% 8.8% 10.3%76 23 57 156
100.0% 100.0% 100.0% 100.0%
Countpercent
Count
percent
Count
percentCountpercentCount
percentCountpercent
Only morninghours
Only afternoonhours
Onlyevening/duskhoursNo limit onhours (all times)
Don't know-Noopinion
Total
18-44 45-64 65+*Age 3-way*
Total
6 5 15 26
15.0% 10.4% 68.2% 23.6%3 1 0 4
7.5% 2.1% .0% 3.6%
13 14 1 2832.5% 29.2% 4.5% 25.5%
17 23 5 4542.5% 47.9% 22.7% 40.9%
1 5 1 7
2.5% 10.4% 4.5% 6.4%40 48 22 110
100.0% 100.0% 100.0% 100.0%
Count
percentCount
percent
CountpercentCountpercentCount
percentCountpercent
Only morninghours
Only afternoonhours
Onlyevening/duskhoursNo limit onhours (all times)
Don't know-Noopinion
Total
< $50,000$50,000 -$100,000 > $100,000
*Income 3-way*
Total

Public Opinion Research Telephone Survey Regarding GGNRA Pet Management Issues
The Social Research Laboratory, Northern Arizona University 105
6 14 11 6 3727.3% 25.9% 18.0% 27.3% 23.3%
2 2 6 0 10
9.1% 3.7% 9.8% .0% 6.3%
5 15 8 5 33
22.7% 27.8% 13.1% 22.7% 20.8%8 20 27 7 62
36.4% 37.0% 44.3% 31.8% 39.0%1 3 9 4 17
4.5% 5.6% 14.8% 18.2% 10.7%22 54 61 22 159
100.0% 100.0% 100.0% 100.0% 100.0%
CountpercentCount
percent
Count
percentCountpercentCount
percentCountpercent
Only morninghours
Only afternoonhours
Onlyevening/duskhoursNo limit onhours (all times)
Don't know-Noopinion
Total
HSdegree/GED
Somecollege/AA BA/BS degree Post-BA/BS
*Education 5-way*
Total
5 8 12 11 36
33.3% 30.8% 25.5% 16.7% 23.4%2 0 1 6 9
13.3% .0% 2.1% 9.1% 5.8%
0 10 15 8 33.0% 38.5% 31.9% 12.1% 21.4%
8 6 18 29 6153.3% 23.1% 38.3% 43.9% 39.6%
0 2 1 12 15
.0% 7.7% 2.1% 18.2% 9.7%15 26 47 66 154
100.0% 100.0% 100.0% 100.0% 100.0%
Count
percentCount
percent
CountpercentCountpercentCount
percentCountpercent
Only morninghours
Only afternoonhours
Onlyevening/duskhoursNo limit onhours (all times)
Don't know-Noopinion
Total
OtherAsian
AmericanBlack / African
American White
** Race **
Total

Public Opinion Research Telephone Survey Regarding GGNRA Pet Management Issues
The Social Research Laboratory, Northern Arizona University 106
20 17 3735.7% 16.8% 23.6%
6 4 10
10.7% 4.0% 6.4%
0 33 33
.0% 32.7% 21.0%26 35 61
46.4% 34.7% 38.9%4 12 16
7.1% 11.9% 10.2%56 101 157
100.0% 100.0% 100.0%
CountpercentCount
percent
Count
percentCountpercentCount
percentCountpercent
Only morninghours
Only afternoonhours
Onlyevening/duskhoursNo limit onhours (all times)
Don't know-Noopinion
Total
Yes, is ofHispanic
origin
No, is not ofHispanic
origin
*Hispanic/Non-Hispanic*
Total
19 18 3741.3% 16.2% 23.6%
0 10 10
.0% 9.0% 6.4%
10 23 33
21.7% 20.7% 21.0%16 45 61
34.8% 40.5% 38.9%1 15 16
2.2% 13.5% 10.2%46 111 157
100.0% 100.0% 100.0%
Countpercent
Count
percent
Count
percentCountpercentCount
percentCountpercent
Only morninghours
Only afternoonhours
Onlyevening/duskhoursNo limit onhours (all times)
Don't know-Noopinion
Total
Own dog(s) Has No dog(s)*Dog owner/Non-owner*
Total

Public Opinion Research Telephone Survey Regarding GGNRA Pet Management Issues
The Social Research Laboratory, Northern Arizona University 107
18 8 4 6 3642.9% 22.9% 10.8% 13.6% 22.8%
1 5 2 2 10
2.4% 14.3% 5.4% 4.5% 6.3%
13 2 11 7 33
31.0% 5.7% 29.7% 15.9% 20.9%3 17 16 26 62
7.1% 48.6% 43.2% 59.1% 39.2%7 3 4 3 17
16.7% 8.6% 10.8% 6.8% 10.8%42 35 37 44 158
100.0% 100.0% 100.0% 100.0% 100.0%
Countpercent
Count
percent
Count
percentCountpercentCount
percentCountpercent
Only morninghours
Only afternoonhours
Onlyevening/duskhoursNo limit onhours (all times)
Don't know-Noopinion
Total
Alameda Marin San Francisco San Mateo*R's county*
Total
Do you prefer limiting the days for off-leash dog-walking to...?
31 17 4848.4% 25.0% 36.4%
6 9 15
9.4% 13.2% 11.4%24 36 60
37.5% 52.9% 45.5%3 6 9
4.7% 8.8% 6.8%64 68 132
100.0% 100.0% 100.0%
CountpercentCount
percentCountpercentCount
percentCountpercent
Only weekdays
Only weekends
Both weekdaysand weekends(no limits)Don't know-Noopinion
Total
Female Male*Respondent Gender*
Total
24 6 17 4740.0% 37.5% 34.0% 37.3%
7 2 3 12
11.7% 12.5% 6.0% 9.5%28 7 23 58
46.7% 43.8% 46.0% 46.0%1 1 7 9
1.7% 6.3% 14.0% 7.1%60 16 50 126
100.0% 100.0% 100.0% 100.0%
CountpercentCount
percentCountpercentCount
percentCountpercent
Only weekdays
Only weekends
Both weekdaysand weekends(no limits)Don't know-Noopinion
Total
18-44 45-64 65+*Age 3-way*
Total

Public Opinion Research Telephone Survey Regarding GGNRA Pet Management Issues
The Social Research Laboratory, Northern Arizona University 108
22 8 12 4241.5% 19.5% 57.1% 36.5%
4 4 5 137.5% 9.8% 23.8% 11.3%
20 29 4 5337.7% 70.7% 19.0% 46.1%
7 0 0 713.2% .0% .0% 6.1%
53 41 21 115100.0% 100.0% 100.0% 100.0%
Countpercent
CountpercentCountpercent
CountpercentCountpercent
Only weekdays
Only weekends
Both weekdaysand weekends(no limits)Don't know-Noopinion
Total
< $50,000$50,000 -$100,000 > $100,000
*Income 3-way*
Total
4 6 32 1 6 49100.0% 26.1% 47.1% 3.7% 50.0% 36.6%
0 2 8 4 1 15
.0% 8.7% 11.8% 14.8% 8.3% 11.2%0 15 22 20 4 61
.0% 65.2% 32.4% 74.1% 33.3% 45.5%0 0 6 2 1 9
.0% .0% 8.8% 7.4% 8.3% 6.7%4 23 68 27 12 134
100.0% 100.0% 100.0% 100.0% 100.0% 100.0%
CountpercentCount
percentCountpercentCount
percentCountpercent
Only weekdays
Only weekends
Both weekdaysand weekends(no limits)Don't know-Noopinion
Total
Grades1-11
HSdegree/GED
Somecollege/AA BA/BS degree Post-BA/BS
*Education 5-way*
Total
4 2 12 29 4730.8% 11.1% 29.3% 51.8% 36.7%
0 7 2 6 15.0% 38.9% 4.9% 10.7% 11.7%
9 9 22 19 5969.2% 50.0% 53.7% 33.9% 46.1%
0 0 5 2 7.0% .0% 12.2% 3.6% 5.5%
13 18 41 56 128100.0% 100.0% 100.0% 100.0% 100.0%
Countpercent
CountpercentCountpercent
CountpercentCountpercent
Only weekdays
Only weekends
Both weekdaysand weekends(no limits)Don't know-Noopinion
Total
OtherAsian
AmericanBlack / African
American White
** Race **
Total

Public Opinion Research Telephone Survey Regarding GGNRA Pet Management Issues
The Social Research Laboratory, Northern Arizona University 109
35 13 4874.5% 15.5% 36.6%
0 15 15
.0% 17.9% 11.5%12 48 60
25.5% 57.1% 45.8%0 8 8
.0% 9.5% 6.1%47 84 131
100.0% 100.0% 100.0%
CountpercentCount
percentCountpercentCount
percentCountpercent
Only weekdays
Only weekends
Both weekdaysand weekends(no limits)Don't know-Noopinion
Total
Yes, is ofHispanic
origin
No, is not ofHispanic
origin
*Hispanic/Non-Hispanic*
Total
15 33 4842.9% 34.0% 36.4%
6 9 15
17.1% 9.3% 11.4%14 46 60
40.0% 47.4% 45.5%0 9 9
.0% 9.3% 6.8%35 97 132
100.0% 100.0% 100.0%
CountpercentCount
percentCountpercentCount
percentCountpercent
Only weekdays
Only weekends
Both weekdaysand weekends
Don't know-Noopinion
Total
Own dog(s) Has No dog(s)*Dog owner/Non-owner*
Total
34 3 2 10 4964.2% 20.0% 6.5% 29.4% 36.8%
3 1 2 8 14
5.7% 6.7% 6.5% 23.5% 10.5%15 6 24 16 61
28.3% 40.0% 77.4% 47.1% 45.9%1 5 3 0 9
1.9% 33.3% 9.7% .0% 6.8%53 15 31 34 133
100.0% 100.0% 100.0% 100.0% 100.0%
CountpercentCount
percentCountpercentCount
percentCountpercent
Only weekdays
Only weekends
Both weekdaysand weekends(no limits)Don't know-Noopinion
Total
Alameda Marin San Francisco San Mateo*R's county*
Total

Public Opinion Research Telephone Survey Regarding GGNRA Pet Management Issues
The Social Research Laboratory, Northern Arizona University 110
Do you believe there should be a limit on the number of dogs walked by any one person at any one time at GGNRA sites?
453 465 91856.1% 59.0% 57.6%
309 252 561
38.3% 32.0% 35.2%1 3 4
.1% .4% .3%44 68 112
5.5% 8.6% 7.0%807 788 1595
100.0% 100.0% 100.0%
CountpercentCount
percentCountpercentCount
percentCountpercent
Yes
No
No dogs shouldbe allowed in
Don't know
Total
Female Male*Respondent Gender*
Total
369 236 287 89252.2% 63.4% 61.3% 57.7%
290 123 128 541
41.0% 33.1% 27.4% 35.0%2 1 1 4
.3% .3% .2% .3%46 12 52 110
6.5% 3.2% 11.1% 7.1%707 372 468 1547
100.0% 100.0% 100.0% 100.0%
CountpercentCount
percentCountpercentCount
percentCountpercent
Yes
No
No dogs shouldbe allowed in
Don't know
Total
18-44 45-64 65+*Age 3-way*
Total
268 219 197 684
61.5% 55.3% 62.7% 59.7%143 161 104 408
32.8% 40.7% 33.1% 35.6%1 1 1 3
.2% .3% .3% .3%
24 15 12 515.5% 3.8% 3.8% 4.5%
436 396 314 1146100.0% 100.0% 100.0% 100.0%
Count
percentCountpercentCountpercent
CountpercentCountpercent
Yes
No
No dogs shouldbe allowed in
Don't know
Total
< $50,000$50,000 -$100,000 > $100,000
*Income 3-way*
Total

Public Opinion Research Telephone Survey Regarding GGNRA Pet Management Issues
The Social Research Laboratory, Northern Arizona University 111
30 135 264 246 232 90766.7% 57.4% 58.4% 53.5% 59.8% 57.4%
15 80 166 167 130 558
33.3% 34.0% 36.7% 36.3% 33.5% 35.3%0 2 1 1 1 5
.0% .9% .2% .2% .3% .3%0 18 21 46 25 110
.0% 7.7% 4.6% 10.0% 6.4% 7.0%45 235 452 460 388 1580
100.0% 100.0% 100.0% 100.0% 100.0% 100.0%
CountpercentCount
percentCountpercentCount
percentCountpercent
Yes
No
No dogs shouldbe allowed in
Don't know
Total
Grades1-11
HSdegree/GED
Somecollege/AA BA/BS degree Post-BA/BS
*Education 5-way*
Total
87 193 100 493 87353.4% 57.3% 65.8% 57.5% 57.8%
71 113 49 299 53243.6% 33.5% 32.2% 34.8% 35.2%
0 0 3 2 5.0% .0% 2.0% .2% .3%
5 31 0 64 1003.1% 9.2% .0% 7.5% 6.6%
163 337 152 858 1510100.0% 100.0% 100.0% 100.0% 100.0%
Countpercent
CountpercentCountpercent
CountpercentCountpercent
Yes
No
No dogs shouldbe allowed in
Don't know
Total
OtherAsian
AmericanBlack / African
American White
** Race **
Total
279 625 90454.4% 59.2% 57.7%
191 359 550
37.2% 34.0% 35.1%0 5 5
.0% .5% .3%43 66 109
8.4% 6.3% 7.0%513 1055 1568
100.0% 100.0% 100.0%
CountpercentCount
percentCountpercentCount
percentCountpercent
Yes
No
No dogs shouldbe allowed in
Don't know
Total
Yes, is ofHispanic
origin
No, is not ofHispanic
origin
*Hispanic/Non-Hispanic*
Total

Public Opinion Research Telephone Survey Regarding GGNRA Pet Management Issues
The Social Research Laboratory, Northern Arizona University 112
288 630 91863.9% 55.0% 57.5%
147 415 562
32.6% 36.2% 35.2%0 5 5
.0% .4% .3%16 96 112
3.5% 8.4% 7.0%451 1146 1597
100.0% 100.0% 100.0%
CountpercentCount
percentCountpercentCount
percentCountpercent
Yes
No
No dogs shouldbe allowed in
Don't know
Total
Own dog(s) Has No dog(s)*Dog owner/Non-owner*
Total
283 226 195 213 91761.9% 67.1% 49.9% 51.8% 57.5%
122 95 170 175 562
26.7% 28.2% 43.5% 42.6% 35.2%4 0 1 0 5
.9% .0% .3% .0% .3%48 16 25 23 112
10.5% 4.7% 6.4% 5.6% 7.0%457 337 391 411 1596
100.0% 100.0% 100.0% 100.0% 100.0%
CountpercentCount
percentCountpercentCount
percentCountpercent
Yes
No
No dogs shouldbe allowed in
Don't know
Total
Alameda Marin San Francisco San Mateo*R's county*
Total
How many dogs do you believe a person should be allowed to walk at one time?
43 77 1209.5% 16.6% 13.1%
188 176 36441.7% 37.8% 39.7%
139 117 25630.8% 25.2% 27.9%
37 43 80
8.2% 9.2% 8.7%29 28 57
6.4% 6.0% 6.2%15 24 39
3.3% 5.2% 4.3%451 465 916
100.0% 100.0% 100.0%
Countpercent
CountpercentCountpercentCount
percentCountpercentCount
percentCountpercent
One
Two
Three
Four
Five or more
Don't know
Total
Female Male*Respondent Gender*
Total

Public Opinion Research Telephone Survey Regarding GGNRA Pet Management Issues
The Social Research Laboratory, Northern Arizona University 113
45 30 35 11012.2% 12.7% 12.2% 12.3%
112 107 138 35730.4% 45.3% 47.9% 40.0%
122 48 80 25033.2% 20.3% 27.8% 28.0%
40 19 20 79
10.9% 8.1% 6.9% 8.9%35 14 8 57
9.5% 5.9% 2.8% 6.4%14 18 7 39
3.8% 7.6% 2.4% 4.4%368 236 288 892
100.0% 100.0% 100.0% 100.0%
Countpercent
CountpercentCountpercentCount
percentCountpercentCount
percentCountpercent
One
Two
Three
Four
Five or more
Don't know
Total
18-44 45-64 65+*Age 3-way*
Total
36 27 18 81
13.5% 12.3% 9.1% 11.9%102 91 83 276
38.2% 41.6% 42.1% 40.4%85 55 49 189
31.8% 25.1% 24.9% 27.7%
20 22 18 607.5% 10.0% 9.1% 8.8%
7 18 18 432.6% 8.2% 9.1% 6.3%
17 6 11 34
6.4% 2.7% 5.6% 5.0%267 219 197 683
100.0% 100.0% 100.0% 100.0%
Count
percentCountpercentCountpercent
CountpercentCountpercentCount
percentCountpercent
One
Two
Three
Four
Five or more
Don't know
Total
< $50,000$50,000 -$100,000 > $100,000
*Income 3-way*
Total

Public Opinion Research Telephone Survey Regarding GGNRA Pet Management Issues
The Social Research Laboratory, Northern Arizona University 114
13 35 21 31 20 12043.3% 25.9% 7.9% 12.6% 8.7% 13.2%
1 61 114 95 85 356
3.3% 45.2% 42.9% 38.6% 36.8% 39.2%14 31 75 77 60 257
46.7% 23.0% 28.2% 31.3% 26.0% 28.3%2 5 27 22 23 79
6.7% 3.7% 10.2% 8.9% 10.0% 8.7%0 2 10 16 30 58
.0% 1.5% 3.8% 6.5% 13.0% 6.4%0 1 19 5 13 38
.0% .7% 7.1% 2.0% 5.6% 4.2%30 135 266 246 231 908
100.0% 100.0% 100.0% 100.0% 100.0% 100.0%
CountpercentCount
percentCountpercentCount
percentCountpercentCount
percentCountpercent
One
Two
Three
Four
Five or more
Don't know
Total
Grades1-11
HSdegree/GED
Somecollege/AA BA/BS degree Post-BA/BS
*Education 5-way*
Total
9 44 22 43 118
10.5% 22.9% 22.0% 8.7% 13.6%40 71 25 209 345
46.5% 37.0% 25.0% 42.5% 39.7%21 35 35 158 249
24.4% 18.2% 35.0% 32.1% 28.6%
6 13 16 38 737.0% 6.8% 16.0% 7.7% 8.4%
10 6 2 30 4811.6% 3.1% 2.0% 6.1% 5.5%
0 23 0 14 37.0% 12.0% .0% 2.8% 4.3%
86 192 100 492 870100.0% 100.0% 100.0% 100.0% 100.0%
Count
percentCountpercentCountpercent
CountpercentCountpercent
CountpercentCountpercent
One
Two
Three
Four
Five or more
Don't know
Total
OtherAsian
AmericanBlack / African
American White
** Race **
Total

Public Opinion Research Telephone Survey Regarding GGNRA Pet Management Issues
The Social Research Laboratory, Northern Arizona University 115
31 89 12011.1% 14.3% 13.3%
100 258 358
35.8% 41.3% 39.6%99 153 252
35.5% 24.5% 27.9%14 64 78
5.0% 10.3% 8.6%22 34 56
7.9% 5.4% 6.2%13 26 39
4.7% 4.2% 4.3%279 624 903
100.0% 100.0% 100.0%
CountpercentCount
percentCountpercentCount
percentCountpercentCount
percentCountpercent
One
Two
Three
Four
Five or more
Don't know
Total
Yes, is ofHispanic
origin
No, is not ofHispanic
origin
*Hispanic/Non-Hispanic*
Total
24 96 1208.4% 15.3% 13.1%
113 251 36439.5% 39.9% 39.8%
80 176 25628.0% 28.0% 28.0%
26 53 79
9.1% 8.4% 8.6%33 24 57
11.5% 3.8% 6.2%10 29 39
3.5% 4.6% 4.3%286 629 915
100.0% 100.0% 100.0%
Countpercent
CountpercentCountpercentCount
percentCountpercentCount
percentCountpercent
One
Two
Three
Four
Five or more
Don't know
Total
Own dog(s) Has No dog(s)*Dog owner/Non-owner*
Total

Public Opinion Research Telephone Survey Regarding GGNRA Pet Management Issues
The Social Research Laboratory, Northern Arizona University 116
65 13 19 23 12023.0% 5.8% 9.7% 10.8% 13.1%
100 87 67 110 36435.3% 38.7% 34.2% 51.6% 39.7%
72 85 53 47 25725.4% 37.8% 27.0% 22.1% 28.0%
13 17 31 18 79
4.6% 7.6% 15.8% 8.5% 8.6%17 19 17 5 58
6.0% 8.4% 8.7% 2.3% 6.3%16 4 9 10 39
5.7% 1.8% 4.6% 4.7% 4.3%283 225 196 213 917
100.0% 100.0% 100.0% 100.0% 100.0%
Countpercent
CountpercentCountpercentCount
percentCountpercentCount
percentCountpercent
One
Two
Three
Four
Five or more
Don't know
Total
Alameda Marin San Francisco San Mateo*R's county*
Total
Do you support or oppose allowing off-leash dog walking in GGNRA sites?
122 135 25715.1% 17.2% 16.1%
154 170 324
19.1% 21.6% 20.3%
153 123 276
18.9% 15.6% 17.3%347 307 654
42.9% 39.0% 41.0%32 52 84
4.0% 6.6% 5.3%808 787 1595
100.0% 100.0% 100.0%
Countpercent
Count
percent
Count
percentCountpercentCount
percentCountpercent
Stronglysupport
Somewhatsupport
Somewhatoppose
Stronglyoppose
Don't know/Noopinion
Total
Female Male*Respondent Gender*
Total

Public Opinion Research Telephone Survey Regarding GGNRA Pet Management Issues
The Social Research Laboratory, Northern Arizona University 117
135 66 55 25619.0% 17.8% 11.8% 16.5%
162 71 84 317
22.8% 19.1% 17.9% 20.5%
117 61 92 270
16.5% 16.4% 19.7% 17.4%250 160 214 624
35.2% 43.1% 45.7% 40.3%46 13 23 82
6.5% 3.5% 4.9% 5.3%710 371 468 1549
100.0% 100.0% 100.0% 100.0%
Countpercent
Count
percent
Count
percentCountpercentCount
percentCountpercent
Stronglysupport
Somewhatsupport
Somewhatoppose
Stronglyoppose
Don't know/Noopinion
Total
18-44 45-64 65+*Age 3-way*
Total
61 83 73 217
14.0% 21.0% 23.5% 19.0%108 95 51 254
24.8% 24.0% 16.4% 22.2%
95 54 59 20821.8% 13.6% 19.0% 18.2%
149 142 118 40934.3% 35.9% 37.9% 35.8%
22 22 10 54
5.1% 5.6% 3.2% 4.7%435 396 311 1142
100.0% 100.0% 100.0% 100.0%
Count
percentCount
percent
CountpercentCountpercentCount
percentCountpercent
Stronglysupport
Somewhatsupport
Somewhatoppose
Stronglyoppose
Don't know/Noopinion
Total
< $50,000$50,000 -$100,000 > $100,000
*Income 3-way*
Total

Public Opinion Research Telephone Survey Regarding GGNRA Pet Management Issues
The Social Research Laboratory, Northern Arizona University 118
9 21 78 71 77 25620.0% 9.0% 17.2% 15.4% 19.8% 16.2%
13 33 105 113 59 323
28.9% 14.2% 23.2% 24.5% 15.2% 20.4%
2 59 96 65 52 2744.4% 25.3% 21.2% 14.1% 13.4% 17.3%
21 105 140 194 185 64546.7% 45.1% 30.9% 42.0% 47.6% 40.8%
0 15 34 19 16 84
.0% 6.4% 7.5% 4.1% 4.1% 5.3%45 233 453 462 389 1582
100.0% 100.0% 100.0% 100.0% 100.0% 100.0%
CountpercentCount
percent
Countpercent
CountpercentCount
percentCountpercent
Stronglysupport
Somewhatsupport
Somewhatoppose
Stronglyoppose
Don't know/Noopinion
Total
Grades1-11
HSdegree/GED
Somecollege/AA BA/BS degree Post-BA/BS
*Education 5-way*
Total
36 48 21 142 247
22.1% 14.2% 13.9% 16.6% 16.4%33 72 19 184 308
20.2% 21.4% 12.6% 21.4% 20.4%
25 64 42 135 26615.3% 19.0% 27.8% 15.7% 17.6%
67 137 60 356 62041.1% 40.7% 39.7% 41.5% 41.1%
2 16 9 41 68
1.2% 4.7% 6.0% 4.8% 4.5%163 337 151 858 1509
100.0% 100.0% 100.0% 100.0% 100.0%
Count
percentCount
percent
CountpercentCountpercentCount
percentCountpercent
Stronglysupport
Somewhatsupport
Somewhatoppose
Stronglyoppose
Don't know/Noopinion
Total
OtherAsian
AmericanBlack / African
American White
** Race **
Total

Public Opinion Research Telephone Survey Regarding GGNRA Pet Management Issues
The Social Research Laboratory, Northern Arizona University 119
87 165 25217.0% 15.7% 16.1%
116 202 318
22.7% 19.2% 20.3%
81 191 27215.8% 18.1% 17.4%
209 432 64140.8% 41.0% 41.0%
19 63 82
3.7% 6.0% 5.2%512 1053 1565
100.0% 100.0% 100.0%
CountpercentCount
percent
Countpercent
CountpercentCount
percentCountpercent
Stronglysupport
Somewhatsupport
Somewhatoppose
Stronglyoppose
Don't know/Noopinion
Total
Yes, is ofHispanic
origin
No, is not ofHispanic
origin
*Hispanic/Non-Hispanic*
Total
142 116 25831.8% 10.1% 16.2%
92 232 324
20.6% 20.2% 20.3%
61 215 276
13.6% 18.7% 17.3%140 514 654
31.3% 44.7% 41.0%12 72 84
2.7% 6.3% 5.3%447 1149 1596
100.0% 100.0% 100.0%
Countpercent
Count
percent
Count
percentCountpercentCount
percentCountpercent
Stronglysupport
Somewhatsupport
Somewhatoppose
Stronglyoppose
Don't know/Noopinion
Total
Own dog(s) Has No dog(s)*Dog owner/Non-owner*
Total

Public Opinion Research Telephone Survey Regarding GGNRA Pet Management Issues
The Social Research Laboratory, Northern Arizona University 120
85 55 80 38 25818.6% 16.2% 20.4% 9.3% 16.2%
64 63 96 102 325
14.0% 18.6% 24.4% 25.1% 20.4%
108 51 58 58 275
23.6% 15.0% 14.8% 14.3% 17.2%188 152 132 182 654
41.0% 44.8% 33.6% 44.7% 41.0%13 18 27 27 85
2.8% 5.3% 6.9% 6.6% 5.3%458 339 393 407 1597
100.0% 100.0% 100.0% 100.0% 100.0%
Countpercent
Count
percent
Count
percentCountpercentCount
percentCountpercent
Stronglysupport
Somewhatsupport
Somewhatoppose
Stronglyoppose
Don't know/Noopinion
Total
Alameda Marin San Francisco San Mateo*R's county*
Total
Do you support or oppose allowing off-leash dog walking on trails used by hikers, bikers or horses?
95 72 16722.1% 16.8% 19.5%
84 90 174
19.6% 21.0% 20.3%
109 122 231
25.4% 28.4% 26.9%116 129 245
27.0% 30.1% 28.6%25 16 41
5.8% 3.7% 4.8%429 429 858
100.0% 100.0% 100.0%
Countpercent
Count
percent
Count
percentCountpercentCount
percentCountpercent
Stronglysupport
Somewhatsupport
Somewhatoppose
Stronglyoppose
Don't know/Noopinion
Total
Female Male*Respondent Gender*
Total

Public Opinion Research Telephone Survey Regarding GGNRA Pet Management Issues
The Social Research Laboratory, Northern Arizona University 121
73 29 64 16617.7% 14.6% 27.7% 19.7%
117 27 26 170
28.3% 13.6% 11.3% 20.2%
113 65 49 227
27.4% 32.8% 21.2% 27.0%89 73 78 240
21.5% 36.9% 33.8% 28.5%21 4 14 39
5.1% 2.0% 6.1% 4.6%413 198 231 842
100.0% 100.0% 100.0% 100.0%
Countpercent
Count
percent
Count
percentCountpercentCount
percentCountpercent
Stronglysupport
Somewhatsupport
Somewhatoppose
Stronglyoppose
Don't know/Noopinion
Total
18-44 45-64 65+*Age 3-way*
Total
43 53 44 140
16.3% 22.9% 24.0% 20.7%41 46 33 120
15.6% 19.9% 18.0% 17.7%
87 60 48 19533.1% 26.0% 26.2% 28.8%
84 63 45 19231.9% 27.3% 24.6% 28.4%
8 9 13 30
3.0% 3.9% 7.1% 4.4%263 231 183 677
100.0% 100.0% 100.0% 100.0%
Count
percentCount
percent
CountpercentCountpercentCount
percentCountpercent
Stronglysupport
Somewhatsupport
Somewhatoppose
Stronglyoppose
Don't know/Noopinion
Total
< $50,000$50,000 -$100,000 > $100,000
*Income 3-way*
Total

Public Opinion Research Telephone Survey Regarding GGNRA Pet Management Issues
The Social Research Laboratory, Northern Arizona University 122
17 15 45 41 47 16573.9% 13.3% 16.2% 16.5% 25.3% 19.4%
0 18 44 78 32 172
.0% 15.9% 15.8% 31.3% 17.2% 20.3%
0 36 81 67 45 229.0% 31.9% 29.1% 26.9% 24.2% 27.0%
6 40 103 50 45 24426.1% 35.4% 37.1% 20.1% 24.2% 28.7%
0 4 5 13 17 39
.0% 3.5% 1.8% 5.2% 9.1% 4.6%23 113 278 249 186 849
100.0% 100.0% 100.0% 100.0% 100.0% 100.0%
CountpercentCount
percent
Countpercent
CountpercentCount
percentCountpercent
Stronglysupport
Somewhatsupport
Somewhatoppose
Stronglyoppose
Don't know/Noopinion
Total
Grades1-11
HSdegree/GED
Somecollege/AA BA/BS degree Post-BA/BS
*Education 5-way*
Total
26 20 7 97 150
27.7% 10.9% 8.4% 21.1% 18.3%20 37 9 103 169
21.3% 20.1% 10.8% 22.4% 20.6%
26 62 16 121 22527.7% 33.7% 19.3% 26.3% 27.4%
19 48 51 119 23720.2% 26.1% 61.4% 25.9% 28.9%
3 17 0 20 40
3.2% 9.2% .0% 4.3% 4.9%94 184 83 460 821
100.0% 100.0% 100.0% 100.0% 100.0%
Count
percentCount
percent
CountpercentCountpercentCount
percentCountpercent
Stronglysupport
Somewhatsupport
Somewhatoppose
Stronglyoppose
Don't know/Noopinion
Total
OtherAsian
AmericanBlack / African
American White
** Race **
Total

Public Opinion Research Telephone Survey Regarding GGNRA Pet Management Issues
The Social Research Laboratory, Northern Arizona University 123
60 104 16421.2% 18.7% 19.5%
54 117 171
19.1% 21.0% 20.4%
82 145 22729.0% 26.0% 27.0%
82 157 23929.0% 28.2% 28.5%
5 34 39
1.8% 6.1% 4.6%283 557 840
100.0% 100.0% 100.0%
CountpercentCount
percent
Countpercent
CountpercentCount
percentCountpercent
Stronglysupport
Somewhatsupport
Somewhatoppose
Stronglyoppose
Don't know/Noopinion
Total
Yes, is ofHispanic
origin
No, is not ofHispanic
origin
*Hispanic/Non-Hispanic*
Total
90 76 16630.5% 13.5% 19.4%
50 124 174
16.9% 22.1% 20.3%
66 165 231
22.4% 29.4% 27.0%74 171 245
25.1% 30.4% 28.6%15 26 41
5.1% 4.6% 4.8%295 562 857
100.0% 100.0% 100.0%
Countpercent
Count
percent
Count
percentCountpercentCount
percentCountpercent
Stronglysupport
Somewhatsupport
Somewhatoppose
Stronglyoppose
Don't know/Noopinion
Total
Own dog(s) Has No dog(s)*Dog owner/Non-owner*
Total

Public Opinion Research Telephone Survey Regarding GGNRA Pet Management Issues
The Social Research Laboratory, Northern Arizona University 124
37 50 54 26 16714.3% 29.8% 23.1% 13.2% 19.5%
42 27 63 42 174
16.3% 16.1% 26.9% 21.3% 20.3%
87 38 52 53 230
33.7% 22.6% 22.2% 26.9% 26.8%84 43 53 65 245
32.6% 25.6% 22.6% 33.0% 28.6%8 10 12 11 41
3.1% 6.0% 5.1% 5.6% 4.8%258 168 234 197 857
100.0% 100.0% 100.0% 100.0% 100.0%
Countpercent
Count
percent
Count
percentCountpercentCount
percentCountpercent
Stronglysupport
Somewhatsupport
Somewhatoppose
Stronglyoppose
Don't know/Noopinion
Total
Alameda Marin San Francisco San Mateo*R's county*
Total
Do you support or oppose allowing off-leash dog walking only in designated areas that are separated from other visitors?
153 153 30635.7% 35.7% 35.7%
164 127 291
38.2% 29.7% 34.0%
59 68 127
13.8% 15.9% 14.8%39 61 100
9.1% 14.3% 11.7%14 19 33
3.3% 4.4% 3.9%429 428 857
100.0% 100.0% 100.0%
Countpercent
Count
percent
Count
percentCountpercentCount
percentCountpercent
Stronglysupport
Somewhatsupport
Somewhatoppose
Stronglyoppose
Don't know/Noopinion
Total
Female Male*Respondent Gender*
Total

Public Opinion Research Telephone Survey Regarding GGNRA Pet Management Issues
The Social Research Laboratory, Northern Arizona University 125
154 67 81 30237.3% 33.7% 35.1% 35.8%
133 64 90 287
32.2% 32.2% 39.0% 34.0%
72 27 26 125
17.4% 13.6% 11.3% 14.8%39 38 20 97
9.4% 19.1% 8.7% 11.5%15 3 14 32
3.6% 1.5% 6.1% 3.8%413 199 231 843
100.0% 100.0% 100.0% 100.0%
Countpercent
Count
percent
Count
percentCountpercentCount
percentCountpercent
Stronglysupport
Somewhatsupport
Somewhatoppose
Stronglyoppose
Don't know/Noopinion
Total
18-44 45-64 65+*Age 3-way*
Total
91 94 60 245
34.5% 40.5% 32.8% 36.1%81 60 71 212
30.7% 25.9% 38.8% 31.2%
43 43 20 10616.3% 18.5% 10.9% 15.6%
35 30 24 8913.3% 12.9% 13.1% 13.1%
14 5 8 27
5.3% 2.2% 4.4% 4.0%264 232 183 679
100.0% 100.0% 100.0% 100.0%
Count
percentCount
percent
CountpercentCountpercentCount
percentCountpercent
Stronglysupport
Somewhatsupport
Somewhatoppose
Stronglyoppose
Don't know/Noopinion
Total
< $50,000$50,000 -$100,000 > $100,000
*Income 3-way*
Total

Public Opinion Research Telephone Survey Regarding GGNRA Pet Management Issues
The Social Research Laboratory, Northern Arizona University 126
7 38 115 88 57 30529.2% 33.3% 41.2% 35.3% 30.5% 35.8%
13 34 95 93 56 291
54.2% 29.8% 34.1% 37.3% 29.9% 34.1%
0 26 35 32 33 126.0% 22.8% 12.5% 12.9% 17.6% 14.8%
4 7 33 21 34 9916.7% 6.1% 11.8% 8.4% 18.2% 11.6%
0 9 1 15 7 32
.0% 7.9% .4% 6.0% 3.7% 3.8%24 114 279 249 187 853
100.0% 100.0% 100.0% 100.0% 100.0% 100.0%
CountpercentCount
percent
Countpercent
CountpercentCount
percentCountpercent
Stronglysupport
Somewhatsupport
Somewhatoppose
Stronglyoppose
Don't know/Noopinion
Total
Grades1-11
HSdegree/GED
Somecollege/AA BA/BS degree Post-BA/BS
*Education 5-way*
Total
37 60 47 150 294
39.8% 32.8% 57.3% 32.5% 35.9%24 53 19 182 278
25.8% 29.0% 23.2% 39.5% 33.9%
20 43 4 54 12121.5% 23.5% 4.9% 11.7% 14.8%
10 25 5 54 9410.8% 13.7% 6.1% 11.7% 11.5%
2 2 7 21 32
2.2% 1.1% 8.5% 4.6% 3.9%93 183 82 461 819
100.0% 100.0% 100.0% 100.0% 100.0%
Count
percentCount
percent
CountpercentCountpercentCount
percentCountpercent
Stronglysupport
Somewhatsupport
Somewhatoppose
Stronglyoppose
Don't know/Noopinion
Total
OtherAsian
AmericanBlack / African
American White
** Race **
Total
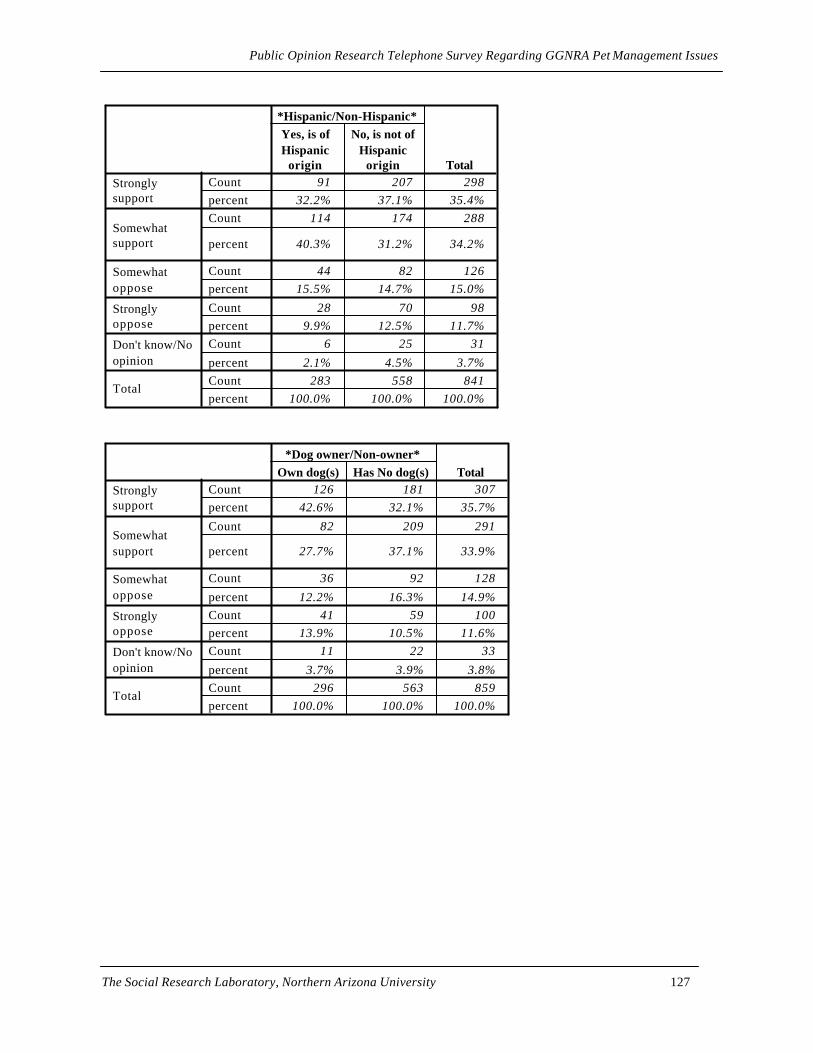
Public Opinion Research Telephone Survey Regarding GGNRA Pet Management Issues
The Social Research Laboratory, Northern Arizona University 127
91 207 29832.2% 37.1% 35.4%
114 174 288
40.3% 31.2% 34.2%
44 82 12615.5% 14.7% 15.0%
28 70 989.9% 12.5% 11.7%
6 25 31
2.1% 4.5% 3.7%283 558 841
100.0% 100.0% 100.0%
CountpercentCount
percent
Countpercent
CountpercentCount
percentCountpercent
Stronglysupport
Somewhatsupport
Somewhatoppose
Stronglyoppose
Don't know/Noopinion
Total
Yes, is ofHispanic
origin
No, is not ofHispanic
origin
*Hispanic/Non-Hispanic*
Total
126 181 30742.6% 32.1% 35.7%
82 209 291
27.7% 37.1% 33.9%
36 92 128
12.2% 16.3% 14.9%41 59 100
13.9% 10.5% 11.6%11 22 33
3.7% 3.9% 3.8%296 563 859
100.0% 100.0% 100.0%
Countpercent
Count
percent
Count
percentCountpercentCount
percentCountpercent
Stronglysupport
Somewhatsupport
Somewhatoppose
Stronglyoppose
Don't know/Noopinion
Total
Own dog(s) Has No dog(s)*Dog owner/Non-owner*
Total

Public Opinion Research Telephone Survey Regarding GGNRA Pet Management Issues
The Social Research Laboratory, Northern Arizona University 128
96 68 65 77 30637.2% 40.2% 27.8% 38.9% 35.6%
86 46 82 77 291
33.3% 27.2% 35.0% 38.9% 33.9%
39 23 39 28 129
15.1% 13.6% 16.7% 14.1% 15.0%31 20 36 13 100
12.0% 11.8% 15.4% 6.6% 11.6%6 12 12 3 33
2.3% 7.1% 5.1% 1.5% 3.8%258 169 234 198 859
100.0% 100.0% 100.0% 100.0% 100.0%
Countpercent
Count
percent
Count
percentCountpercentCount
percentCountpercent
Stronglysupport
Somewhatsupport
Somewhatoppose
Stronglyoppose
Don't know/Noopinion
Total
Alameda Marin San Francisco San Mateo*R's county*
Total
Do you support or oppose allowing off-leash dog walking at public beaches in the park?
119 113 23227.9% 26.4% 27.1%
147 141 288
34.4% 32.9% 33.7%
64 77 141
15.0% 18.0% 16.5%79 88 167
18.5% 20.6% 19.5%18 9 27
4.2% 2.1% 3.2%427 428 855
100.0% 100.0% 100.0%
Countpercent
Count
percent
Count
percentCountpercentCount
percentCountpercent
Stronglysupport
Somewhatsupport
Somewhatoppose
Stronglyoppose
Don't know/Noopinion
Total
Female Male*Respondent Gender*
Total

Public Opinion Research Telephone Survey Regarding GGNRA Pet Management Issues
The Social Research Laboratory, Northern Arizona University 129
121 53 55 22929.3% 26.6% 23.8% 27.2%
149 70 62 281
36.1% 35.2% 26.8% 33.3%
77 25 38 140
18.6% 12.6% 16.5% 16.6%56 48 62 166
13.6% 24.1% 26.8% 19.7%10 3 14 27
2.4% 1.5% 6.1% 3.2%413 199 231 843
100.0% 100.0% 100.0% 100.0%
Countpercent
Count
percent
Count
percentCountpercentCount
percentCountpercent
Stronglysupport
Somewhatsupport
Somewhatoppose
Stronglyoppose
Don't know/Noopinion
Total
18-44 45-64 65+*Age 3-way*
Total
46 69 65 180
17.5% 29.7% 35.3% 26.5%96 89 54 239
36.5% 38.4% 29.3% 35.2%
39 37 32 10814.8% 15.9% 17.4% 15.9%
78 30 26 13429.7% 12.9% 14.1% 19.7%
4 7 7 18
1.5% 3.0% 3.8% 2.7%263 232 184 679
100.0% 100.0% 100.0% 100.0%
Count
percentCount
percent
CountpercentCountpercentCount
percentCountpercent
Stronglysupport
Somewhatsupport
Somewhatoppose
Stronglyoppose
Don't know/Noopinion
Total
< $50,000$50,000 -$100,000 > $100,000
*Income 3-way*
Total
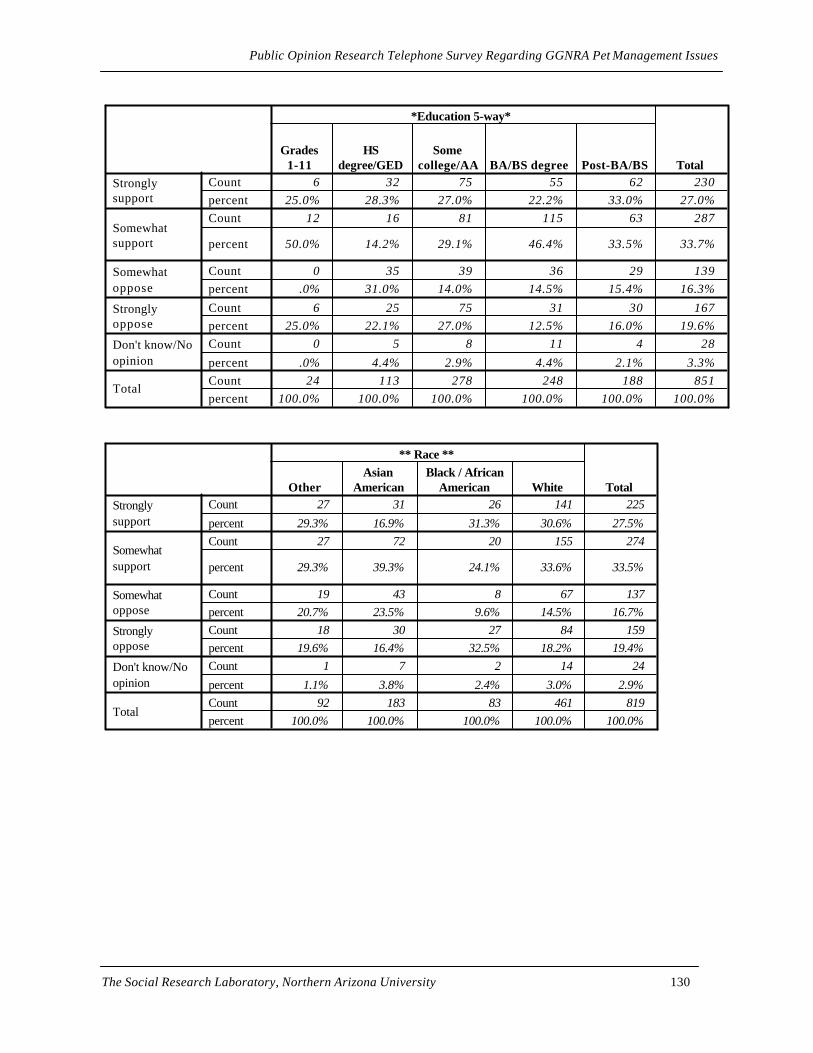
Public Opinion Research Telephone Survey Regarding GGNRA Pet Management Issues
The Social Research Laboratory, Northern Arizona University 130
6 32 75 55 62 23025.0% 28.3% 27.0% 22.2% 33.0% 27.0%
12 16 81 115 63 287
50.0% 14.2% 29.1% 46.4% 33.5% 33.7%
0 35 39 36 29 139.0% 31.0% 14.0% 14.5% 15.4% 16.3%
6 25 75 31 30 16725.0% 22.1% 27.0% 12.5% 16.0% 19.6%
0 5 8 11 4 28
.0% 4.4% 2.9% 4.4% 2.1% 3.3%24 113 278 248 188 851
100.0% 100.0% 100.0% 100.0% 100.0% 100.0%
CountpercentCount
percent
Countpercent
CountpercentCount
percentCountpercent
Stronglysupport
Somewhatsupport
Somewhatoppose
Stronglyoppose
Don't know/Noopinion
Total
Grades1-11
HSdegree/GED
Somecollege/AA BA/BS degree Post-BA/BS
*Education 5-way*
Total
27 31 26 141 225
29.3% 16.9% 31.3% 30.6% 27.5%27 72 20 155 274
29.3% 39.3% 24.1% 33.6% 33.5%
19 43 8 67 13720.7% 23.5% 9.6% 14.5% 16.7%
18 30 27 84 15919.6% 16.4% 32.5% 18.2% 19.4%
1 7 2 14 24
1.1% 3.8% 2.4% 3.0% 2.9%92 183 83 461 819
100.0% 100.0% 100.0% 100.0% 100.0%
Count
percentCount
percent
CountpercentCountpercentCount
percentCountpercent
Stronglysupport
Somewhatsupport
Somewhatoppose
Stronglyoppose
Don't know/Noopinion
Total
OtherAsian
AmericanBlack / African
American White
** Race **
Total

Public Opinion Research Telephone Survey Regarding GGNRA Pet Management Issues
The Social Research Laboratory, Northern Arizona University 131
84 144 22829.5% 25.9% 27.1%
101 184 285
35.4% 33.0% 33.8%
44 95 13915.4% 17.1% 16.5%
56 109 16519.6% 19.6% 19.6%
0 25 25
.0% 4.5% 3.0%285 557 842
100.0% 100.0% 100.0%
CountprecentCount
precent
Countprecent
CountprecentCount
precentCountprecent
Stronglysupport
Somewhatsupport
Somewhatoppose
Stronglyoppose
Don't know/Noopinion
Total
Yes, is ofHispanic
origin
No, is not ofHispanic
origin
*Hispanic/Non-Hispanic*
Total
130 102 23243.9% 18.1% 27.0%
81 207 288
27.4% 36.8% 33.6%
34 108 142
11.5% 19.2% 16.6%45 123 168
15.2% 21.9% 19.6%6 22 28
2.0% 3.9% 3.3%296 562 858
100.0% 100.0% 100.0%
Countpercent
Count
percent
Count
percentCountpercentCount
percentCountpercent
Stronglysupport
Somewhatsupport
Somewhatoppose
Stronglyoppose
Don't know/Noopinion
Total
Own dog(s) Has No dog(s)*Dog owner/Non-owner*
Total

Public Opinion Research Telephone Survey Regarding GGNRA Pet Management Issues
The Social Research Laboratory, Northern Arizona University 132
61 58 77 36 23223.6% 34.5% 33.0% 18.2% 27.1%
69 50 94 75 288
26.7% 29.8% 40.3% 37.9% 33.6%
59 18 36 29 142
22.9% 10.7% 15.5% 14.6% 16.6%62 28 21 56 167
24.0% 16.7% 9.0% 28.3% 19.5%7 14 5 2 28
2.7% 8.3% 2.1% 1.0% 3.3%258 168 233 198 857
100.0% 100.0% 100.0% 100.0% 100.0%
Countpercent
Count
percent
Count
percentCountpercentCount
percentCountpercent
Stronglysupport
Somewhatsupport
Somewhatoppose
Stronglyoppose
Don't know/Noopinion
Total
Alameda Marin San Francisco San Mateo*R's county*
Total

Appendix D Cross-tabulation Tables by
Visitor Status

Public Opinion Research Telephone Survey Regarding GGNRA Pet Management Issues
The Social Research Laboratory, Northern Arizona University 133
Appendix D -- Cross-tabulation Tables by Visitor Status
Do you currently have one or more dogs?
5 82 100 161 3487.0% 22.8% 21.3% 23.0% 21.8%
4 32 12 55 103
5.6% 8.9% 2.6% 7.9% 6.4%
62 246 358 483 1149
87.3% 68.3% 76.2% 69.1% 71.8%71 360 470 699 1600
100.0% 100.0% 100.0% 100.0% 100.0%
CountPercentCount
Percent
Count
PercentCountPercent
Yes, have only one dog
Yes, have more than onedog
No, don't have any dogs
Total
Never visited -R has never
visitedGGNRA ( or
doesn't know)
Low visitorship-visited
GGNRA butnot in the last
12 months
Mediumvisitorship - up
to 5 visits inlast 12 mon.
Highvisitorship - more than5 visits toGGNRA inlast 12 m
*Visitor Status to Parks*
Total
How many dogs do you have (own, keep, care for)?
5 82 100 161 34855.6% 72.6% 89.3% 74.5% 77.3%
1 24 11 31 6711.1% 21.2% 9.8% 14.4% 14.9%
0 5 1 20 26.0% 4.4% .9% 9.3% 5.8%
3 2 0 4 933.3% 1.8% .0% 1.9% 2.0%
0 0 0 0 0
.0% .0% .0% .0% .0%9 113 112 216 450
100.0% 100.0% 100.0% 100.0% 100.0%
CountPercentCountPercent
CountPercentCountPercentCount
PercentCountPercent
1 dog
2 dogs
3 dogs
4 dogs
5 or moredogs
Total
Never visited -R has never
visitedGGNRA ( or
doesn't know)
Low visitorship-visited
GGNRA butnot in the last
12 months
Mediumvisitorship - up
to 5 visits inlast 12 mon.
Highvisitorship - more than5 visits to
GGNRA inlast 12 m
*Visitor Status to Parks*
Total

Public Opinion Research Telephone Survey Regarding GGNRA Pet Management Issues
The Social Research Laboratory, Northern Arizona University 134
Have you ever taken your dog(s) for a walk in a GGNRA site?
36 44 142 22231.6% 38.9% 65.7% 50.1%
76 69 73 21866.7% 61.1% 33.8% 49.2%
2 0 1 31.8% .0% .5% .7%
114 113 216 443100.0% 100.0% 100.0% 100.0%
CountPercentCountPercent
CountPercentCountPercent
Yes
No
Don't know
Total
Low visitorship-visited
GGNRA butnot in the last
12 months
Mediumvisitorship - up
to 5 visits inlast 12 mon.
Highvisitorship - more than5 visits to
GGNRA inlast 12 m
*Visitor Status to Parks*
Total
How often do you take your dog(s) for a walk in a GGNRA site?
3 12 28 438.3% 27.9% 19.7% 19.5%
3 5 37 458.3% 11.6% 26.1% 20.4%
6 5 35 4616.7% 11.6% 24.6% 20.8%
9 17 42 6825.0% 39.5% 29.6% 30.8%
15 4 0 1941.7% 9.3% .0% 8.6%
36 43 142 221100.0% 100.0% 100.0% 100.0%
CountPercentCountPercent
CountPercentCountPercent
CountPercentCountPercent
Daily
Weekly
Monthly
Semi-annually
Don't know
Total
Low visitorship-visited
GGNRA butnot in the last
12 months
Mediumvisitorship - up
to 5 visits inlast 12 mon.
Highvisitorship - more than5 visits to
GGNRA inlast 12 m
*Visitor Status to Parks*
Total

Public Opinion Research Telephone Survey Regarding GGNRA Pet Management Issues
The Social Research Laboratory, Northern Arizona University 135
Have you ever had someone else take your dog(s) for a walk in a GGNRA site?
0 10 17 54 81.0% 8.8% 15.2% 25.0% 18.0%
9 97 91 159 356100.0% 85.1% 81.3% 73.6% 78.9%
0 7 4 3 14.0% 6.1% 3.6% 1.4% 3.1%
9 114 112 216 451100.0% 100.0% 100.0% 100.0% 100.0%
CountPercentCountPercent
CountPercentCountPercent
Yes
No
Don't know
Total
Never visited -R has never
visitedGGNRA ( or
doesn't know)
Low visitorship-visited
GGNRA butnot in the last
12 months
Mediumvisitorship - up
to 5 visits inlast 12 mon.
Highvisitorship - more than5 visits to
GGNRA inlast 12 m
*Visitor Status to Parks*
Total
Have you ever hired a commercial dog-walker to take your dog(s) for a walk in a GGNRA site?
0 1 6 10 17. 10.0% 35.3% 18.5% 21.0%0 9 11 44 64
. 90.0% 64.7% 81.5% 79.0%0 10 17 54 81. 100.0% 100.0% 100.0% 100.0%
CountPercentCount
PercentCountPercent
Yes
No
Total
Never visited -R has never
visitedGGNRA ( or
doesn't know)
Low visitorship-visited
GGNRA butnot in the last
12 months
Mediumvisitorship - up
to 5 visits inlast 12 mon.
Highvisitorship - more than5 visits to
GGNRA inlast 12 m
*Visitor Status to Parks*
Total

Public Opinion Research Telephone Survey Regarding GGNRA Pet Management Issues
The Social Research Laboratory, Northern Arizona University 136
Have you ever seen a dog allowed off-leash by a visitor at any GGNRA site?
113 168 518 79931.6% 35.7% 74.2% 52.4%
212 242 136 59059.2% 51.5% 19.5% 38.7%
33 60 44 1379.2% 12.8% 6.3% 9.0%
358 470 698 1526100.0% 100.0% 100.0% 100.0%
CountPercentCountPercent
CountPercentCountPercent
Yes
No
Don't know
Total
Low visitorship-visited
GGNRA butnot in the last
12 months
Mediumvisitorship - up
to 5 visits inlast 12 mon.
Highvisitorship - more than5 visits to
GGNRA inlast 12 m
*Visitor Status to Parks*
Total
How did dogs being allowed off-leash affect your visitor experience?
15 39 163 21713.4% 23.1% 31.7% 27.3%
25 28 121 174
22.3% 16.6% 23.5% 21.9%
70 98 223 39162.5% 58.0% 43.4% 49.2%
2 4 7 13
1.8% 2.4% 1.4% 1.6%112 169 514 795
100.0% 100.0% 100.0% 100.0%
CountPercentCount
Percent
CountPercentCount
PercentCountPercent
Added to experience
Detracted from experience
Did not affect experience
Don't know
Total
Low visitorship-visited
GGNRA butnot in the last
12 months
Mediumvisitorship - up
to 5 visits inlast 12 mon.
Highvisitorship - more than5 visits to
GGNRA inlast 12 m
*Visitor Status to Parks*
Total

Public Opinion Research Telephone Survey Regarding GGNRA Pet Management Issues
The Social Research Laboratory, Northern Arizona University 137
Are you familiar with National Park Service regulations regarding dog leash laws at GGNRA sites?
13 145 221 422 80118.1% 40.3% 47.0% 61.7% 50.5%
54 211 236 251 75275.0% 58.6% 50.2% 36.7% 47.4%
5 4 13 11 336.9% 1.1% 2.8% 1.6% 2.1%
72 360 470 684 1586100.0% 100.0% 100.0% 100.0% 100.0%
CountPercentCountPercent
CountPercentCountPercent
Yes
No
Don't know
Total
Never visited -R has never
visitedGGNRA ( or
doesn't know)
Low visitorship-visited
GGNRA butnot in the last
12 months
Mediumvisitorship - up
to 5 visits inlast 12 mon.
Highvisitorship - more than5 visits to
GGNRA inlast 12 m
*Visitor Status to Parks*
Total
Current regulations allow for walking dogs on-leash at most GGNRA sites and prohibit any off-leash dogwalking. Do you support or oppose this current regulation?
20 195 217 287 71927.4% 54.0% 46.2% 41.4% 45.0%
35 94 106 172 40747.9% 26.0% 22.6% 24.8% 25.5%
4 28 67 71 1705.5% 7.8% 14.3% 10.2% 10.6%
3 21 46 124 1944.1% 5.8% 9.8% 17.9% 12.1%
11 23 34 40 108
15.1% 6.4% 7.2% 5.8% 6.8%73 361 470 694 1598
100.0% 100.0% 100.0% 100.0% 100.0%
CountPercentCountPercent
CountPercentCountPercentCount
PercentCountPercent
Strongly support
Somewhat support
Somewhat oppose
Strongly oppose
Don't know/No opinion
Total
Never visited -R has never
visitedGGNRA ( or
doesn't know)
Low visitorship-visited
GGNRA butnot in the last
12 months
Mediumvisitorship - up
to 5 visits inlast 12 mon.
Highvisitorship - more than5 visits to
GGNRA inlast 12 m
*Visitor Status to Parks*
Total

Public Opinion Research Telephone Survey Regarding GGNRA Pet Management Issues
The Social Research Laboratory, Northern Arizona University 138
Do you support or oppose further limiting on-leash dog walking in the GGNRA?
3 87 99 115 3044.2% 24.1% 21.1% 16.5% 19.0%
33 41 80 73 22746.5% 11.4% 17.1% 10.5% 14.2%
11 120 113 193 43715.5% 33.2% 24.1% 27.7% 27.3%
12 79 112 250 45316.9% 21.9% 23.9% 35.9% 28.3%
12 34 65 66 177
16.9% 9.4% 13.9% 9.5% 11.1%71 361 469 697 1598
100.0% 100.0% 100.0% 100.0% 100.0%
CountPercentCountPercent
CountPercentCountPercentCount
PercentCountPercent
Strongly support
Somewhat support
Somewhat oppose
Strongly oppose
Don't know/No opinion
Total
Never visited -R has never
visitedGGNRA ( or
doesn't know)
Low visitorship-visited
GGNRA butnot in the last
12 months
Mediumvisitorship - up
to 5 visits inlast 12 mon.
Highvisitorship - more than5 visits to
GGNRA inlast 12 m
*Visitor Status to Parks*
Total
Do you support or oppose allowing off-leash dog walking in GGNRA sites?
1 30 87 154 2721.4% 8.3% 18.6% 22.1% 17.0%
12 72 97 185 36616.7% 20.0% 20.7% 26.5% 22.9%
26 50 87 102 26536.1% 13.9% 18.6% 14.6% 16.6%
29 169 148 229 57540.3% 46.9% 31.6% 32.9% 36.0%
4 39 50 27 1205.6% 10.8% 10.7% 3.9% 7.5%
72 360 469 697 1598100.0% 100.0% 100.0% 100.0% 100.0%
CountPercentCountPercent
CountPercentCountPercent
CountPercentCountPercent
Strongly support
Somewhat support
Somewhat oppose
Strongly oppose
Don't know/No opinion
Total
Never visited -R has never
visitedGGNRA ( or
doesn't know)
Low visitorship-visited
GGNRA butnot in the last
12 months
Mediumvisitorship - up
to 5 visits inlast 12 mon.
Highvisitorship - more than5 visits to
GGNRA inlast 12 m
*Visitor Status to Parks*
Total

Public Opinion Research Telephone Survey Regarding GGNRA Pet Management Issues
The Social Research Laboratory, Northern Arizona University 139
Do you prefer allowing dogs off-leash in all areas where on-leash walking is now allowed, or do you prefer allowing dogs off-leash ONLY in limited areas?
2 18 28 82 13015.4% 17.6% 15.2% 24.1% 20.3%
9 81 138 244 472
69.2% 79.4% 75.0% 71.8% 73.9%
0 2 1 4 7.0% 2.0% .5% 1.2% 1.1%
2 1 17 10 30
15.4% 1.0% 9.2% 2.9% 4.7%13 102 184 340 639
100.0% 100.0% 100.0% 100.0% 100.0%
CountPercentCount
Percent
CountPercentCount
PercentCountPercent
In all areas whereon-leash is allowed
Off-leash only in limitedareas
Neither
Don't know/No opinion
Total
Never visited -R has never
visitedGGNRA ( or
doesn't know)
Low visitorship-visited
GGNRA butnot in the last
12 months
Mediumvisitorship - up
to 5 visits inlast 12 mon.
Highvisitorship - more than5 visits to
GGNRA inlast 12 m
*Visitor Status to Parks*
Total
If GGNRA areas were designated for off-leash dog walking, do you favor off-leash dog
walking being available ALL the time or ONLY during limited times?
3 52 129 220 40427.3% 51.5% 70.5% 64.7% 63.6%
8 48 48 113 21772.7% 47.5% 26.2% 33.2% 34.2%
0 1 6 7 14.0% 1.0% 3.3% 2.1% 2.2%
11 101 183 340 635100.0% 100.0% 100.0% 100.0% 100.0%
CountPercentCountPercent
CountPercentCountPercent
All the time
During limited times
Don't know
Total
Never visited -R has never
visitedGGNRA ( or
doesn't know)
Low visitorship-visited
GGNRA butnot in the last
12 months
Mediumvisitorship - up
to 5 visits inlast 12 mon.
Highvisitorship - more than5 visits to
GGNRA inlast 12 m
*Visitor Status to Parks*
Total

Public Opinion Research Telephone Survey Regarding GGNRA Pet Management Issues
The Social Research Laboratory, Northern Arizona University 140
Do you prefer limiting hours in the day when off-leash dog-walking takes place, limiting days in the week when off-leash walking takes place, or both?
1 9 25 39 7414.3% 19.1% 51.0% 34.8% 34.4%
2 20 6 21 49
28.6% 42.6% 12.2% 18.8% 22.8%2 17 17 46 82
28.6% 36.2% 34.7% 41.1% 38.1%2 1 1 6 10
28.6% 2.1% 2.0% 5.4% 4.7%7 47 49 112 215
100.0% 100.0% 100.0% 100.0% 100.0%
CountPercentCount
PercentCountPercentCount
PercentCountPercent
Limiting hours
Limiting days
Both
Don't know
Total
Never visited -R has never
visitedGGNRA ( or
doesn't know)
Low visitorship-visited
GGNRA butnot in the last
12 months
Mediumvisitorship - up
to 5 visits inlast 12 mon.
Highvisitorship - more than5 visits toGGNRA inlast 12 m
*Visitor Status to Parks*
Total
Do you prefer limiting the hours for off-leash dog-walking to...?
0 5 8 24 37.0% 19.2% 19.0% 27.9% 23.6%
0 1 3 5 9.0% 3.8% 7.1% 5.8% 5.7%
3 10 5 14 32100.0% 38.5% 11.9% 16.3% 20.4%
0 9 19 34 62.0% 34.6% 45.2% 39.5% 39.5%
0 1 7 9 17
.0% 3.8% 16.7% 10.5% 10.8%3 26 42 86 157
100.0% 100.0% 100.0% 100.0% 100.0%
CountPercentCountPercent
CountPercentCountPercentCount
PercentCountPercent
Only morning hours
Only afternoon hours
Only evening/duskhours
No limit on hours (alltimes)
Don't know-No opinion
Total
Never visited -R has never
visitedGGNRA ( or
doesn't know)
Low visitorship-visited
GGNRA butnot in the last
12 months
Mediumvisitorship - up
to 5 visits inlast 12 mon.
Highvisitorship - more than5 visits to
GGNRA inlast 12 m
*Visitor Status to Parks*
Total
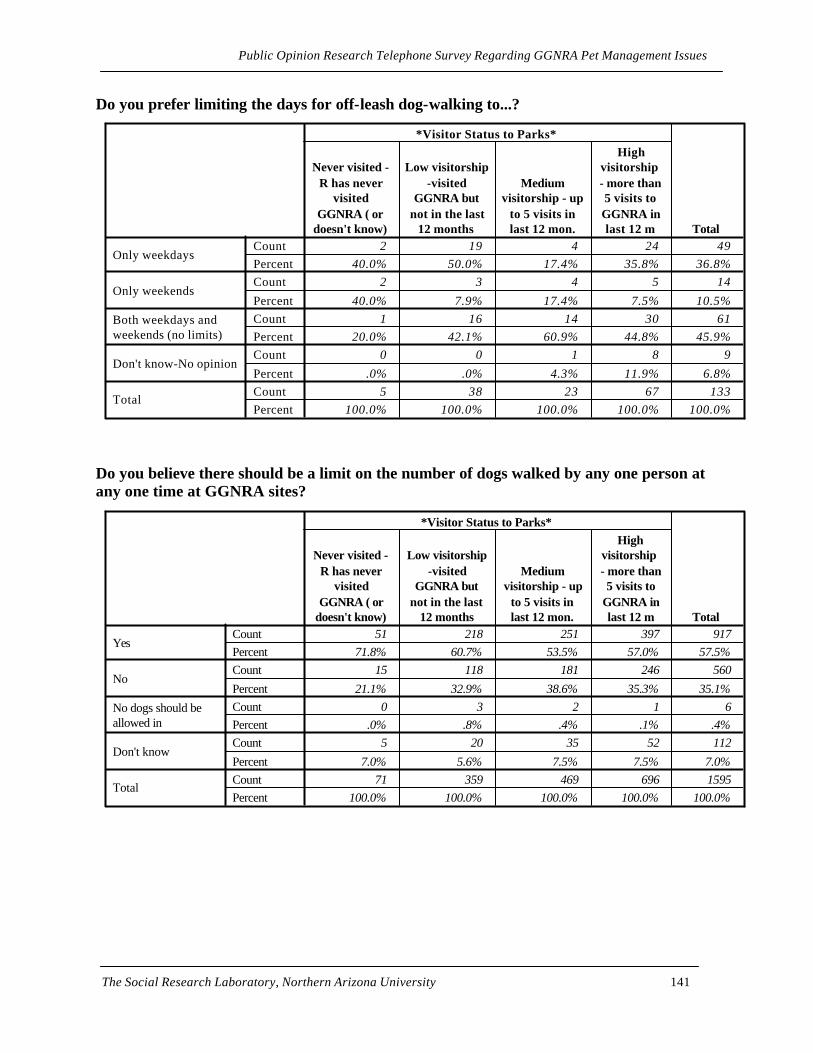
Public Opinion Research Telephone Survey Regarding GGNRA Pet Management Issues
The Social Research Laboratory, Northern Arizona University 141
Do you prefer limiting the days for off-leash dog-walking to...?
2 19 4 24 4940.0% 50.0% 17.4% 35.8% 36.8%
2 3 4 5 14
40.0% 7.9% 17.4% 7.5% 10.5%1 16 14 30 61
20.0% 42.1% 60.9% 44.8% 45.9%0 0 1 8 9
.0% .0% 4.3% 11.9% 6.8%5 38 23 67 133
100.0% 100.0% 100.0% 100.0% 100.0%
CountPercentCount
PercentCountPercentCount
PercentCountPercent
Only weekdays
Only weekends
Both weekdays andweekends (no limits)
Don't know-No opinion
Total
Never visited -R has never
visitedGGNRA ( or
doesn't know)
Low visitorship-visited
GGNRA butnot in the last
12 months
Mediumvisitorship - up
to 5 visits inlast 12 mon.
Highvisitorship - more than5 visits toGGNRA inlast 12 m
*Visitor Status to Parks*
Total
Do you believe there should be a limit on the number of dogs walked by any one person at any one time at GGNRA sites?
51 218 251 397 91771.8% 60.7% 53.5% 57.0% 57.5%
15 118 181 246 560
21.1% 32.9% 38.6% 35.3% 35.1%0 3 2 1 6
.0% .8% .4% .1% .4%5 20 35 52 112
7.0% 5.6% 7.5% 7.5% 7.0%71 359 469 696 1595
100.0% 100.0% 100.0% 100.0% 100.0%
CountPercentCount
PercentCountPercentCount
PercentCountPercent
Yes
No
No dogs should beallowed in
Don't know
Total
Never visited -R has never
visitedGGNRA ( or
doesn't know)
Low visitorship-visited
GGNRA butnot in the last
12 months
Mediumvisitorship - up
to 5 visits inlast 12 mon.
Highvisitorship - more than5 visits to
GGNRA inlast 12 m
*Visitor Status to Parks*
Total

Public Opinion Research Telephone Survey Regarding GGNRA Pet Management Issues
The Social Research Laboratory, Northern Arizona University 142
How many dogs do you believe a person should be allowed to walk at one time?
27 20 39 34 12052.9% 9.1% 15.6% 8.6% 13.1%
18 96 106 145 365
35.3% 43.8% 42.4% 36.5% 39.8%5 67 64 121 257
9.8% 30.6% 25.6% 30.5% 28.0%0 21 16 43 80
.0% 9.6% 6.4% 10.8% 8.7%1 10 6 40 57
2.0% 4.6% 2.4% 10.1% 6.2%0 5 19 14 38
.0% 2.3% 7.6% 3.5% 4.1%51 219 250 397 917
100.0% 100.0% 100.0% 100.0% 100.0%
CountPercentCount
PercentCountPercentCount
PercentCountPercentCount
PercentCountPercent
One
Two
Three
Four
Five or more
Don't know
Total
Never visited -R has never
visitedGGNRA ( or
doesn't know)
Low visitorship-visited
GGNRA butnot in the last
12 months
Mediumvisitorship - up
to 5 visits inlast 12 mon.
Highvisitorship - more than5 visits toGGNRA inlast 12 m
*Visitor Status to Parks*
Total
Do you support or oppose allowing off-leash dog walking in GGNRA sites?
4 28 64 162 2585.7% 7.8% 13.6% 23.2% 16.1%
7 74 106 138 32510.0% 20.6% 22.6% 19.8% 20.3%
26 82 76 92 27637.1% 22.8% 16.2% 13.2% 17.3%
30 149 203 272 65442.9% 41.4% 43.2% 39.0% 40.9%
3 27 21 34 85
4.3% 7.5% 4.5% 4.9% 5.3%70 360 470 698 1598
100.0% 100.0% 100.0% 100.0% 100.0%
CountPercentCountPercent
CountPercentCountPercentCount
PercentCountPercent
Strongly support
Somewhat support
Somewhat oppose
Strongly oppose
Don't know/No opinion
Total
Never visited -R has never
visitedGGNRA ( or
doesn't know)
Low visitorship-visited
GGNRA butnot in the last
12 months
Mediumvisitorship - up
to 5 visits inlast 12 mon.
Highvisitorship - more than5 visits to
GGNRA inlast 12 m
*Visitor Status to Parks*
Total

Public Opinion Research Telephone Survey Regarding GGNRA Pet Management Issues
The Social Research Laboratory, Northern Arizona University 143
Do you support or oppose allowing off-leash dog walking on trails used by hikers, bikers or horses?
2 33 47 84 1665.6% 18.0% 19.2% 21.5% 19.4%
5 22 54 93 17413.9% 12.0% 22.0% 23.8% 20.4%
23 50 73 84 23063.9% 27.3% 29.8% 21.5% 26.9%
3 74 58 109 2448.3% 40.4% 23.7% 27.9% 28.6%
3 4 13 20 40
8.3% 2.2% 5.3% 5.1% 4.7%36 183 245 390 854
100.0% 100.0% 100.0% 100.0% 100.0%
CountPercentCountPercent
CountPercentCountPercentCount
PercentCountPercent
Strongly support
Somewhat support
Somewhat oppose
Strongly oppose
Don't know/No opinion
Total
Never visited -R has never
visitedGGNRA ( or
doesn't know)
Low visitorship-visited
GGNRA butnot in the last
12 months
Mediumvisitorship - up
to 5 visits inlast 12 mon.
Highvisitorship - more than5 visits to
GGNRA inlast 12 m
*Visitor Status to Parks*
Total
Do you support or oppose allowing off-leash dog walking only in designated areas that are separated from other visitors?
5 60 80 161 30613.2% 33.0% 32.4% 41.1% 35.6%
13 84 94 100 29134.2% 46.2% 38.1% 25.5% 33.9%
16 18 35 59 12842.1% 9.9% 14.2% 15.1% 14.9%
4 11 30 55 10010.5% 6.0% 12.1% 14.0% 11.6%
0 9 8 17 34.0% 4.9% 3.2% 4.3% 4.0%
38 182 247 392 859100.0% 100.0% 100.0% 100.0% 100.0%
CountPercentCountPercent
CountPercentCountPercent
CountPercentCountPercent
Strongly support
Somewhat support
Somewhat oppose
Strongly oppose
Don't know/No opinion
Total
Never visited -R has never
visitedGGNRA ( or
doesn't know)
Low visitorship-visited
GGNRA butnot in the last
12 months
Mediumvisitorship - up
to 5 visits inlast 12 mon.
Highvisitorship - more than5 visits to
GGNRA inlast 12 m
*Visitor Status to Parks*
Total

Public Opinion Research Telephone Survey Regarding GGNRA Pet Management Issues
The Social Research Laboratory, Northern Arizona University 144
Do you support or oppose allowing off-leash dog walking at public beaches in the park?
4 26 55 146 23110.8% 14.2% 22.4% 37.3% 27.0%
8 48 110 123 28921.6% 26.2% 44.9% 31.5% 33.8%
19 38 34 50 14151.4% 20.8% 13.9% 12.8% 16.5%
4 66 38 59 16710.8% 36.1% 15.5% 15.1% 19.5%
2 5 8 13 28
5.4% 2.7% 3.3% 3.3% 3.3%37 183 245 391 856
100.0% 100.0% 100.0% 100.0% 100.0%
CountPercentCountPercent
CountPercentCountPercentCount
PercentCountPercent
Strongly support
Somewhat support
Somewhat oppose
Strongly oppose
Don't know/No opinion
Total
Never visited -R has never
visitedGGNRA ( or
doesn't know)
Low visitorship-visited
GGNRA butnot in the last
12 months
Mediumvisitorship - up
to 5 visits inlast 12 mon.
Highvisitorship - more than5 visits to
GGNRA inlast 12 m
*Visitor Status to Parks*
Total
DEMOGRAPHIC CROSS-TABULATIONS BY VISITOR STATUS
18 5 17 13 5342.9% 4.6% 9.0% 4.5% 8.4%
10 8 53 46 117
23.8% 7.3% 28.0% 15.8% 18.5%
2 12 27 37 78
4.8% 11.0% 14.3% 12.7% 12.4%4 24 27 66 121
9.5% 22.0% 14.3% 22.7% 19.2%8 60 65 129 262
19.0% 55.0% 34.4% 44.3% 41.5%42 109 189 291 631
100.0% 100.0% 100.0% 100.0% 100.0%
CountPercentCount
Percent
Count
PercentCountPercentCount
PercentCountPercent
Less than one year
1 yr up to but notincl. 3 yrs
3 yrs up to but notincl. 6 yrs
6 or more years
Don't know
Total
Never visited -R has never
visitedGGNRA ( or
doesn't know)
Low visitorship-visited
GGNRA butnot in the last
12 months
Mediumvisitorship - up
to 5 visits inlast 12 mon.
Highvisitorship - more than5 visits toGGNRA inlast 12 m
*Visitor Status to Parks*
Total

Public Opinion Research Telephone Survey Regarding GGNRA Pet Management Issues
The Social Research Laboratory, Northern Arizona University 145
25 229 220 334 80834.7% 63.6% 46.8% 47.9% 50.5%
47 131 250 364 792
65.3% 36.4% 53.2% 52.1% 49.5%72 360 470 698 1600
100.0% 100.0% 100.0% 100.0% 100.0%
CountPercentCount
PercentCountPercent
Female
Male
Total
Never visited -R has never
visitedGGNRA ( or
doesn't know)
Low visitorship-visited
GGNRA butnot in the last
12 months
Mediumvisitorship - up
to 5 visits inlast 12 mon.
Highvisitorship - more than5 visits to
GGNRA inlast 12 m
*Visitor Status to Parks*
Total
37 123 230 320 71054.4% 35.2% 51.2% 46.7% 45.8%
16 84 92 180 37223.5% 24.1% 20.5% 26.3% 24.0%
15 142 127 185 46922.1% 40.7% 28.3% 27.0% 30.2%
68 349 449 685 1551100.0% 100.0% 100.0% 100.0% 100.0%
CountPercentCountPercent
CountPercentCountPercent
18-44
45-64
65+
Total
Never visited -R has never
visitedGGNRA ( or
doesn't know)
Low visitorship-visited
GGNRA butnot in the last
12 months
Mediumvisitorship - up
to 5 visits inlast 12 mon.
Highvisitorship - more than5 visits to
GGNRA inlast 12 m
*Visitor Status to Parks*
Total
39 161 112 124 43673.6% 62.9% 36.6% 23.4% 38.1%
9 49 104 233 39517.0% 19.1% 34.0% 44.0% 34.5%
5 46 90 172 3139.4% 18.0% 29.4% 32.5% 27.4%
53 256 306 529 1144100.0% 100.0% 100.0% 100.0% 100.0%
CountPercentCountPercent
CountPercentCountPercent
< $50,000
$50,000 - $100,000
> $100,000
Total
Never visited -R has never
visitedGGNRA ( or
doesn't know)
Low visitorship-visited
GGNRA butnot in the last
12 months
Mediumvisitorship - up
to 5 visits inlast 12 mon.
Highvisitorship - more than5 visits to
GGNRA inlast 12 m
*Visitor Status to Parks*
Total

Public Opinion Research Telephone Survey Regarding GGNRA Pet Management Issues
The Social Research Laboratory, Northern Arizona University 146
0 31 9 5 45.0% 8.7% 2.0% .7% 2.8%
35 70 76 53 23450.7% 19.7% 16.5% 7.6% 14.8%
12 158 134 149 45317.4% 44.4% 29.1% 21.4% 28.6%
12 47 147 256 46217.4% 13.2% 31.9% 36.8% 29.2%
10 50 95 233 388
14.5% 14.0% 20.6% 33.5% 24.5%69 356 461 696 1582
100.0% 100.0% 100.0% 100.0% 100.0%
CountPercentCountPercent
CountPercentCountPercentCount
PercentCountPercent
Grades 1-11
HS degree/GED
Some college/AA
BA/BS degree
Post-BA/BS
Total
Never visited -R has never
visitedGGNRA ( or
doesn't know)
Low visitorship-visited
GGNRA butnot in the last
12 months
Mediumvisitorship - up
to 5 visits inlast 12 mon.
Highvisitorship - more than5 visits to
GGNRA inlast 12 m
*Visitor Status to Parks*
Total
5 30 62 66 1636.9% 9.0% 14.0% 10.0% 10.8%
48 55 141 95 339
66.7% 16.4% 31.8% 14.3% 22.4%5 57 30 59 151
6.9% 17.0% 6.8% 8.9% 10.0%14 193 210 443 860
19.4% 57.6% 47.4% 66.8% 56.8%72 335 443 663 1513
100.0% 100.0% 100.0% 100.0% 100.0%
CountPercentCount
PercentCountPercentCount
PercentCountPercent
Other
Asian American
Black / AfricanAmerican
White
Total
Never visited -R has never
visitedGGNRA ( or
doesn't know)
Low visitorship-visited
GGNRA butnot in the last
12 months
Mediumvisitorship - up
to 5 visits inlast 12 mon.
Highvisitorship - more than5 visits toGGNRA inlast 12 m
*Visitor Status to Parks*
Total

Public Opinion Research Telephone Survey Regarding GGNRA Pet Management Issues
The Social Research Laboratory, Northern Arizona University 147
27 132 184 169 51237.5% 37.5% 40.0% 24.6% 32.6%
45 220 276 517 1058
62.5% 62.5% 60.0% 75.4% 67.4%
72 352 460 686 1570100.0% 100.0% 100.0% 100.0% 100.0%
CountPercentCount
Percent
CountPercent
Yes, is of Hispanic origin
No, is not of Hispanicorigin
Total
Never visited -R has never
visitedGGNRA ( or
doesn't know)
Low visitorship-visited
GGNRA butnot in the last
12 months
Mediumvisitorship - up
to 5 visits inlast 12 mon.
Highvisitorship - more than5 visits to
GGNRA inlast 12 m
*Visitor Status to Parks*
Total
10 114 112 216 45213.9% 31.7% 23.8% 30.9% 28.2%
62 246 358 483 1149
86.1% 68.3% 76.2% 69.1% 71.8%72 360 470 699 1601
100.0% 100.0% 100.0% 100.0% 100.0%
CountPercentCount
PercentCountPercent
Own dog(s)
Has no dog(s)
Total
Never visited -R has never
visitedGGNRA ( or
doesn't know)
Low visitorship-visited
GGNRA butnot in the last
12 months
Mediumvisitorship - up
to 5 visits inlast 12 mon.
Highvisitorship - more than5 visits to
GGNRA inlast 12 m
*Visitor Status to Parks*
Total
45 156 141 115 45762.5% 43.5% 29.9% 16.5% 28.6%
4 25 98 210 337
5.6% 7.0% 20.8% 30.1% 21.1%7 55 82 250 394
9.7% 15.3% 17.4% 35.8% 24.6%16 123 150 123 412
22.2% 34.3% 31.8% 17.6% 25.8%72 359 471 698 1600
100.0% 100.0% 100.0% 100.0% 100.0%
CountPercentCount
PercentCountPercentCount
PercentCountPercent
Alameda
Marin
San Francisco
San Mateo
Total
Never visited -R has never
visitedGGNRA ( or
doesn't know)
Low visitorship-visited
GGNRA butnot in the last
12 months
Mediumvisitorship - up
to 5 visits inlast 12 mon.
Highvisitorship - more than5 visits toGGNRA inlast 12 m
*Visitor Status to Parks*
Total

Purpose of this Study The purpose of this technical research report is to provide a basis for the scientific understanding of regional public opinion on pet management regulations in the Golden Gate National Recreation Area (GGNRA). This research has been peer-reviewed and is not intended to provide specific policy guidelines or management recommendations on what to implement. This study has been undertaken under the auspices of the Golden Gate National Recreation Area with the project coordination and assistance of Mike Savidge in GGNRA, and the review and approval of the NPS Social Science Program and Office of Management & Budget for compliance with the Paperwork Reduction Act. This latter review and approval of the survey instrument and methodology was under the direction of Dr. Gary Machlis (Chief Visiting Social Scientist) and Brian Forist (Research Associate) of the NPS Social Science Program. It insures that the research served the following functions: first, that the information collected actually serves the particular agency needs; second, that the research is methodologically sound; and third, that the study does not place an undue burden on the public. For further information and/or copies of this report, please contact: Public Affairs Office GGNRA Ft. Mason, San Francisco, California 94123 Telephone: (415) 561-4732