Embed Size (px)
Citation preview

PT FAJAR SURYA WISESA TbkPT FAJAR SURYA WISESA Tbk
DECEMBER 2010DECEMBER 2010
Public ExposePublic Expose

Disclaimer
The information that follows is a presentation of general background information about PT Fajar Surya Wisesa Tbk (the “Company”) prepared by the Company as ofNovember 2010.
The information contained herein has not been independently verified and thus no representation or warranty, express or implied, is made as to the fairness,accuracy, currency, completeness or correctness of the information, opinions and conclusions contained in this presentation by the Company or any of its directors,officers, employees, advisors, affiliates or agents. Accordingly, no reliance should be placed on the fairness, accuracy, currency, completeness or correctness ofthis presentation, nor any inferences drawn from the manner in which the contents have been compiled and presented. In addition, no person is authorized to giveany information or to make any representation not contained in and not consistent with this material and, if given or made, such information or representation mustnot be relied upon as having been authorized by or on behalf of the Company.
This presentation contains statements relating to the Company’s financial condition, results of operations and business and the Company’s strategies and futureprospects which are forward-looking within the meaning of Section 27A of the Securities Act of 1933, as amended, and Section 21E of the Securities Exchange Actof 1934, as amended. Such forward-looking statements are only predictions and are not guarantees of future performance. You are cautioned that any suchforward-looking statements are and will be, as the case may be, subject to both known and unknown risks, uncertainties and factors relating to the operations andbusiness environments of the Company that may cause the actual results of the Company to be materially different from any future results expressed or implied insuch forward-looking statements. All forward-looking statements that are made in this presentation speak only as of the date of such statements. The Companyexpressly disclaims a duty to update any of the forward-looking statements.
Nothing in this presentation should be construed as a solicitation to buy or sell any security or product, or to engage in or refrain from engaging in any transaction.This presentation should not be used as the basis for any financial decision to invest in any securities or participation in any transaction. This presentation does notpurport to, and does not, contain all of the information that may be required to evaluate factors relevant to a recipient making any investment decisions. Each
2
purport to, and does not, contain all of the information that may be required to evaluate factors relevant to a recipient making any investment decisions. Eachrecipient should make its own independent appraisal of, and investigation into, the financial condition, creditworthiness, affairs, status and nature of the Company asthe basis of any investment decision. The Company does not intend to, or accept any obligation to, correct, update or revise the information or opinions in thispresentation. Opinions expressed in this presentation are subject to change without notice. To the maximum extent permitted by law, none of the Company or itsdirectors, officers, employees, advisors, affiliates or agents accepts any liability whatsoever, including, without limitation, for any loss howsoever arising from or inconnection with any use to which this presentation may be put by a recipient or otherwise or as a result of, or arising from anything expressly or implicitly containedin or referred to in this presentation.
This presentation has been prepared for information purposes only. Any recipient of this presentation and its directors, officers, employees, agents and affiliatesmust hold this presentation and any information provided in connection with this presentation in strict confidence and may not communicate, reproduce, distribute ordisclose to any other person, or refer to them publicly, in while or in part at any time except with our prior written consent.
BY ACCEPTING THIS PRESENTATION, THE RECIPIENT ACKNOWLEDGES AND AGREES THAT (1) IT WILL HOLD IN CONFIDENCE THE INFORMATIONCONTAINED HEREIN; (2) IT WILL NOT DISTRIBUTE OR REPRODUCE THIS PRESENTATION, IN WHOLE OR IN PART, EXCEPT AS PERMITTEDHEREUNDER; (3) THE RECIPIENT IS (A) NOT A “U.S. PERSON” (AS DEFINED IN REGULATION S UNDER THE SECURITIES ACT) OR A PERSON ACTINGFOR THE ACCOUNT OR BENEFIT OF ANY U.S. PERSON, (B) IS ACCUSTOMED TO RECEIVING THE TYPE OF INFORMATION CONTAINED IN THISPRESENTATION AND (C) IS A PERSON INTO WHOSE POSSESSION THIS PRESENTATION MAY BE LAWFULLY DELIVERED IN ACCORDANCE WITH THELAWS OF THE JURISDICTION IN WHICH IT IS LOCATED.
This presentation does not constitute an offer to sell or the solicitation of an offer to buy any securities in the United States or any other jurisdiction in which suchoffer, solicitation or sale would be unlawful prior to registration or qualification under the securities laws of any such jurisdiction. No securities may be offered or soldin the United States absent registration or an applicable exemption from registration requirements. Any public offering of securities to be made in the United Stateswill be made by means of a prospectus. Such prospectus will contain detailed information about the company making the offer and its management and financialstatements. No public offer of securities is to be made by the Company in the United States.
By accepting delivery of this presentation, the recipient agrees to accept and be bound by the statements, restrictions and limitations set forth herein.

Company Overview

Corporate Overview
PT Fajar Surya Wisesa Tbk. established in 1988 and listed on IDX in 1994 with a current market cap of approximately USD 785 million (1)
Second largest packaging paper producer in Indonesia with 91% sales to domestic market in 9M 2010
100% waste paper, 60% sourced domestically. Indonesia’s waste paper recovery rate is around 50%
ISO 9001:2000 certification, and ISO 14001:2004 certification
• Corporate Status
• Market Standing
• Capacity
• Raw Materials
• Quality Certifications
700,000 tons per annum (tpa) - 4 Paper Machines (“PMs”), expected to achieve 1 million tpa by 1Q 2011 with the addition of PM5, and estimate1.25 million tpa by 2012
4
ISO 9001:2000 certification, and ISO 14001:2004 certification
2,000 employees, 73% of them have been with FajarPaper for more than 10 years
• Quality Certifications
• Employees
• Financial Snapshot
• Total Debt As of 30 September 2010 total debt was around USD 209 million
9M 2010 9M 2009 2009IDR Bn USD MM IDR Bn USD MM IDR Bn USD MM
Sales 2,449 274 2,010 208 2,733 291
Net Income 256 29 178 18 277 29
EBITDA 520 58 381 39 570 61
Note1. As at 30 November 2010

Recycling of waste . . .
Consumer Goods Consumption Waste Paper Paper Manufacturing Packaging Paper Box-maker
. . . to produce 3 types of packaging papers . . .
Corrugated Medium (“CMP”)Middle corrugated layer
FajarPaper’s business
Simple Business Model
Local sourcing• Around 60% of materials
is sourced locally from waste collectors, box-makers and converters
• Imported materials are sourced from Singapore, US, Europe, Middle East, etc
• Strong relationships with suppliers (>10 years)
Containerboard Boxboard
Nestle Sanyo Kalbe Sinar Converse Faber Suzuki MattelIndofood Epson Antjol Lacoste CastellKraftfood Toshiba Wings NikeMayora Panasonic Kao PumaAqua Samsung Unilever
LG
Singapore2%
Malaysia3%
UAE2%
Sri Lanka1%
Others1%
Domestic91%
Middle corrugated layer
Linerboard (“KLB”)For inner and outer layers of corrugated sheets and boxes
Coated Duplex Board (“CDB”)For lightweight packaging materials
Source: Company data
… to meet demand from consumer oriented products
Food & Beverage Electronics PharmaceuticalsHousehold Goods &
Personal CareFootwear Stationery Automotives Toys
Sales Geographic Segmentation9M 2010 Sales
5

Key Milestones
150k T/yr300k T/yr
500k T/yr
700k T/yr
1,000k T/yr1,130k T/yr
1,250k T/yr
1988 1989 1990 1994 1995 2001 2003 2006 2010 2011 2012
6
PM1 installed
PM2 installed
PM3 and Power Plant 1 installed
PM7 and Power Plant 2 installed; USD 100 million bond issuance
Installation of Incinerator 2
and PM7 modification
Company established by Winarko Sulistyo
and Airlangga Hartarto
Company listed on the IDX
Incinerator 1 installed
Installation of PM5 with USD
70 million syndicated loanISO 14001:2004
Modification of PM2
PM1PM2PM3PM5PM7
� 150,000� 150,000� 200,000� 300,000 (Est)� 200,000
� Coated Duplex Board (“CDB”)� Kraft Liner Board (“KLB”)� Corrugating Medium Paper (“CMP”)� CMP� CMP, KLB
ISO 9001:2000
ProductsCapacity (ton/year)
Paper Machine
� 1990� 1989� 1995� 2011� 2006
Year

Investment Highlights

Key Investment Highlights
High Quality Products Used by Leading Consumer Bran ds1
Dominant Domestic Market Presence2
Green Company Concept Resulting in Low Cost Product ion3
4 Operational and Cost Efficiency Through Integrated Facilities
8
Experienced Management with a Proven Track Record 5
4 Operational and Cost Efficiency Through Integrated Facilities
Long-standing and Trustworthy Relationships with St akeholders6
Capitalizing on Improving Indonesia Macroeconomics a nd Increasing Consumer Spending8
7 Healthy Financials and Well Funded Growth Plans

SANYO PANASONIC
SAMSUNG LG
TOSHIBA EPSON
UNILEVER UNICHARM
KAO WINGS KALBE
MANDOM SINAR ANTJOL
NESTLE INDOFOOD
KRAFTFOODS
AQUA MAYORA
Trusted by the Leading Consumer Brands
FajarPaper’s products are used in the following industries
Food & Beverage ElectronicsHousehold Goods, Personal Care &
Pharmaceuticals
1
AutomotivesFootwear Toys & Stationery Ceramic
MULIA SUZUKINIKE PUMA
CONVERSE LACOSTE
9Note: Food & Beverage and Household Goods & Personal Care, part of Fast Moving Consumer Goods (FMCG), contribute around 75% of FajarPaper’s sales
AutomotivesFootwear Toys & Stationery Ceramic
MATTEL FABER CASTELL

Sack Kraft1%
Kraft Liner Board34%
Coated Duplex Board19%
Dominant Domestic Market Presence
• Sole focus is in the manufacturing of packaging paper
• No downstream activities to box-making
– does not compete with customers
– relation with customers >10 years
Close competitors:
Indah Kiat Pulp & Paper: located in Serang – West Java
Pakerin: located in Surabaya – East Java
FajarPaper is the second largest paper packaging manufacturer
Rapid increase in production capacity from the current 700,000 tpa to 1,000,000 tpa in 1Q 2011 to 1,250,000
tpa by 2012
2
Production (2009)
Corrugated Medium Paper
46%
Kraft Liner Board30%
Corrugated Medium Paper
51%
Coated Duplex Board19%
10
High Utilization Rates
Total Production 9M 2010 : 547,090 MTTotal Production 9M 2009 : 528,386 MTTotal Production 2009 : 708,665 MT
Capacity Utilization 9M 2010 : 104%Capacity Utilization 2009 : 101%
Total Production 9M 2010 : 547,090 MTTotal Production 9M 2009 : 528,386 MTTotal Production 2009 : 708,665 MT
Capacity Utilization 9M 2010 : 104%Capacity Utilization 2009 : 101%
Production 9 months (in 2010)

Green Company Concept Resulting in Low-cost Product ion
Local sourcing:
• Around 60% sourced locally from waste collectors, box-makers and converters, end-users
• Imports are sourced from Singapore, US, Europe, Middle East, Australia, etc
• Strong relationships with suppliers (>10 years)
Creating Value from Waste
3
11
Waste paper as the raw material:
• Fibre raw material requirements in finished product: 100% waste paper
• Sustainable input

Operational and Cost Efficiency Through Integrated Facilities
Self-generated Electricity
Waste incinerator
On-site 2 power plants• 70MW gas-fired cogeneration power plants, supplied by General
Electric (USA)• Re-use of waste heat to produce steams• PLN as a back-up power
Converting Waste into Energy
4
12
Effluent treatment plants• Re-use of 80% of treated water• Cost savings by recycling sludge• Capacity: 58,000 m3/day
Waste incinerator• Solid waste is burnt to produce steam energy for production • Cost savings and environmental benefit• First incinerator capacity: 95 bone dry ton per day• Installing a second waste incinerator for capacity of 150 bone
dry ton per day with investment cost of USD 12 million
Recycling Water
Experienced Management with a Proven Track Record i n Paper Industry& Shareholding of PT Fajar Surya Wisesa
5
Board of Commissioners
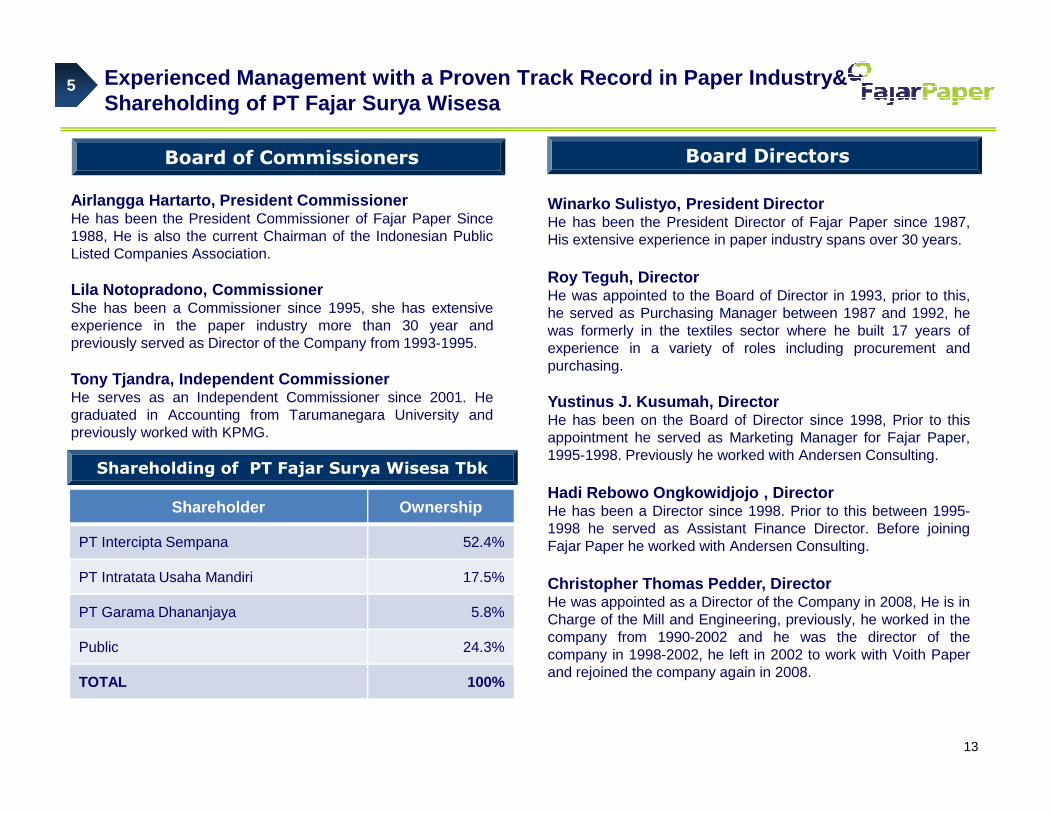
Airlangga Hartarto, President CommissionerHe has been the President Commissioner of Fajar Paper Since1988, He is also the current Chairman of the Indonesian PublicListed Companies Association.
Lila Notopradono, CommissionerShe has been a Commissioner since 1995, she has extensiveexperience in the paper industry more than 30 year andpreviously served as Director of the Company from 1993-1995.
Tony Tjandra, Independent CommissionerHe serves as an Independent Commissioner since 2001. Hegraduated in Accounting from Tarumanegara University and
Board Directors
Winarko Sulistyo, President DirectorHe has been the President Director of Fajar Paper since 1987,His extensive experience in paper industry spans over 30 years.
Roy Teguh, DirectorHe was appointed to the Board of Director in 1993, prior to this,he served as Purchasing Manager between 1987 and 1992, hewas formerly in the textiles sector where he built 17 years ofexperience in a variety of roles including procurement andpurchasing.
Yustinus J. Kusumah, Director
13
graduated in Accounting from Tarumanegara University andpreviously worked with KPMG.
Yustinus J. Kusumah, Director He has been on the Board of Director since 1998, Prior to thisappointment he served as Marketing Manager for Fajar Paper,1995-1998. Previously he worked with Andersen Consulting.
Hadi Rebowo Ongkowidjojo , Director He has been a Director since 1998. Prior to this between 1995-1998 he served as Assistant Finance Director. Before joiningFajar Paper he worked with Andersen Consulting.
Christopher Thomas Pedder, Director He was appointed as a Director of the Company in 2008, He is inCharge of the Mill and Engineering, previously, he worked in thecompany from 1990-2002 and he was the director of thecompany in 1998-2002, he left in 2002 to work with Voith Paperand rejoined the company again in 2008.
Shareholding of PT Fajar Surya Wisesa Tbk
Shareholder Ownership
PT Intercipta Sempana 52.4%
PT Intratata Usaha Mandiri 17.5%
PT Garama Dhananjaya 5.8%
Public 24.3%
TOTAL 100%

Long-standing and Trustworthy Relationships with Stakeholders
• Mostly more than 15 years
• Diversified customer base
• Top ten non-affiliated customers: around 30% of sales
Customers
• Long-standing relationships with BRI, HSBC and UOB for more than 15 years
• The Company obtained a USD 70 million syndicated loan in October 2008 for the construction of PM#5
– However, the Company took a prudent measure to postpone the construction by 12
Banks/Lenders
Relationships with customers, suppliers, bankers, employees and other stakeholders are valued and mostly beyond 10 years, providing solid foundation for future growth
6
14
• Mostly more than 10 years
• From waste paper to chemicals
• No account for more than 10% of total purchase in each cost component
• Diversified supply sources
Suppliers
• 73% have worked for more than 10 years in the Company
• Low turnover rate
Management & Employees
measure to postpone the construction by 12 months, which was well received by the lenders
• On 22 October 2010, the Company signed a USD 120 million facility with HSBC, UOB and OCBC in order to refinance its existing bonds maturing in October 2011

477543
683 706 709 715
1,0001,145
0
300
600
900
1,200
1,500
2005A 2006A 2007A 2008A 2009A 2010F 2011F 2012F
Production Volume (’000 tons)
Attractive Growth Profile7
153188
282 276 291
366
0
100
200
300
400
2005A 2006A 2007A 2008A 2009A 2010F
Revenue (2) (USD MM)
Source: Company filings, management estimates
Growth Rates - 13.8% 25.8% 3.4% 0.4% 0.8% 39.9% 14.5%
Source: Company filings
Installation of Incinerator 2 & PM#5
Modification of PM7
(1)
Growth Rates - 23.0% 50.0% (2.1%) 5.4% 25.8%
Source: Company filings, management estimates Source: Company filings
25 28
5949
61
78
0
30
60
90
2005A 2006A 2007A 2008A 2009A 2010F
Notes:1. 2010F Revenue, EBITDA and Net Income are from annualized Q3 2010 numbers2. Reported currency IDR. Translated into US Dollars for presentation
Source: Company filings
Margins 16.3% 14.9% 20.9% 17.6% 20.8% 21.6%
(1)
1
11 13
3
29
38
0
10
20
30
40
2005A 2006A 2007A 2008A 2009A 2010F(1)
Margins 0.4% 6.0% 4.6% 1.2% 10.1% 10.5%
Source: Company filings
EBITDA (2) (USD MM)))) Net Income (2) (USD MM)
15

Fully Funded Near Term Expansion
Specifications
• Conditions: 100% brand new • Type of paper: Corrugated Medium Paper (CMP)• Production capacity: 300,000 tons/year• Country of origin: various through various suppliers, such
as Voith (Germany/Austria), Aikawa & Toshiba (Japan), ABB (France), Yueli Machinery (Taiwan)
Estimated start-up • January 2011
Project New Paper Machine PM#5
7
16
Project cost • USD 85 million (USD 70 million – syndicated loan)
Current progress• Building construction 97% complete • Most of the main parts and equipment have already arrived
or been shipped

Well-planned Expansions for Continuing Growth
Specifications
• Type of paper: Corrugated Medium Paper (CMP), Kraft Liner Board (KLB)
• Production capacity increase from 200,000 tpa to 330,000 tpa• Reduced energy and raw material costs, improved quality
Modification time • 2 months
Project cost • + USD 40 million (Proposed Export Credit Agency financing)
Timing • End of 2011
Specifications
• Condition: New• Type: Fluidized-bed incinerator• Capacity: 150 Bone Dry Ton/day
Modification of PM#7
New Incinerator #2
7
2011
17
Specifications • Capacity: 150 Bone Dry Ton/day• Steam: 24 ton/hour • Country of Origin: South Korea
Project cost • Around USD 12 million
Timing • Mid of 2011
Specifications• Type of paper: Kraft Liner Board (KLB) • Production capacity increase from 150,000 tpa to 270,000 tpa• Reduced energy and raw material costs, improved quality
Modification time • 2 months
Project cost • + USD 30 million (Proposed Export Credit Agency financing)
Timing • Mid of 2012
Modification of PM#2
2012

531,700
669,900 674,382723,615 731,950
1,000,000
1,145,000
12%14%20%18%20%22%27%
50%54%46%48%50%41%43%
38%33%
34%32%28%28%
29%
2%2%9%
1%
0
300,000
600,000
900,000
1,200,000
2006 2007 2008 2009 2010F 2011F 2012F
Capitalizing on Improving Indonesia Macroeconomics a nd Increasing Consumer Spending
8
Production Growth (metric tons)
Sales Growth (metric tons)
542,897
682,665 706,119 708,647 715,000
1,000,000
1,145,000
12%14%20%19%19%21%26%
50%54%48%46%51%43%43%
38%33%
33%34%27%30%
26%
1%2%7%
5%
0
300,000
600,000
900,000
1,200,000
2006 2007 2008 2009 2010F 2011F 2012F
Coated duplex board Corrugating medium Kraft liner board Sack kraft
18
Growth Capacity is Underpinned by Indonesia’s Consumption Growth
Production Growth (metric tons)

Conclusion – FajarPaper’s Core Strategies and Key St rengths
Core Strategies Key Strengths
Well established and positioned with significant brand recognition, especially in the domestic market
Scale and long term relationships� Second largest Indonesian packaging paper manufacturer� Relationships with almost all customers for over 15 years� Direct contact with end-users� Providing reliable supply
Non-integrated company, provides competitive advantage as priority customer’s choice
Cost advantages / green company
19
Sustainable growth profile Growth in-line with Indonesia consumer goods spendi ng� Indonesia as the fourth most populous country with growing domestic
consumption presents a huge opportunity
Cost advantages / green company � Economical raw material usage (100% waste paper)� 60% of raw material needs sourced locally
Cost advantages: uses 100% waste paper and generates own energy
Efficiency and cost savings� Generates cheaper energy through power plants and incinerators
which also produce steam
High operational efficiency using recycling concepts
Healthy Financials and Well Funded Growth Plan
Prudent capacity expansion financing� Capacity expansion is financed through long term borrowings with
low interest rates – ensuring a healthy financial condition

Summary Balance Sheet Information
(IDR million) 2006 2007 2008 2009 9M 2010
PPE (net of depreciation) 2,765,224 2,722,123 2,620,338 2,550,452 2,713,437
Cash and cash equivalents 29,760 170,038 168,651 168,826 88,782
Trade accounts receivables 256,123 462,969 347,907 473,113 495,529
Other Assets 370,785 414,458 581,652 478,844 1,055,692
Total Assets 3,421,892 3,769,588 3,718,548 3,671,235 4,353,441
Bank loans 41,432 226,380 248,421 229,636 258,912
Year Ended 31st DecemberPeriod Ended
20
Bank loans 41,432 226,380 248,421 229,636 258,912
Trade accounts payable to third parties 100,022 107,344 87,070 91,654 182,910
Current maturities of long-term loans 86,060 98,453 102,245 ─ ─
Deferred tax liabilities – net 365,349 371,116 356,894 352,994 346,701
Long-term loans – net of current maturities 659,632 628,639 425,100 304,157 726,318
Bonds payable – net 837,768 890,957 1,057,347 915,636 878,003
Other Liabilities 157,515 150,615 133,612 192,570 176,518
Total Liabilities 2,247,778 2,473,504 2,410,689 2,086,647 2,569,362
Total Equity 1,174,114 1,296,084 1,307,859 1,584,588 1,784,079
Total Liabilities and Equity 3,421,892 3,769,588 3,718,548 3,671,235 4,353,441

Summary Income Statement Information
(IDR million) 2006 2007 2008 2009 9M - 2009 9M - 2010
Net Sales 1,693,081 2,655,795 3,027,012 2,733,300 2,009,814 2,449,478
COGS 1,449,834 2,121,716 2,520,687 2,196,485 1,653,902 1,952,545
Gross Profit 243,247 534,079 506,325 536,815 355,912 496,933
Operating Expenses 110,197 120,362 117,031 112,277 83,771 86,907
Income from Operations 133,050 413,718 389,295 424,538 272,141 410,026
Year Ended 31st December Period Ended
21
Income from Operations 133,050 413,718 389,295 424,538 272,141 410,026
Interest Income 1,030 1,128 3,270 3,205 2,480 2,141
Interest Expenses & Financing Charges (98,990) (179,408) (226,567) (177,289) (138,581) (109,519)
Others 114,289 (56,921) (130,504) 137,096 112,417 41,234
Other Income (Charges) – net 16,329 (235,201) (353,801) (36,988) (23,684) (66,144)
Income Before Tax 149,379 178,517 35,494 387,550 248,457 343,882
Tax Benefit (Expenses) (47,651) (56,547) 1,060 (110,821) (70,672) (87,399)
Net Income 101,728 121,970 36,554 276,729 177,785 256,483

133
414 389424 410
562
7.9%
15.6% 15.5%16.7% 17.7%
12.9%
0
200
400
600
800
2006 2007 2008 2009 9M 2010 LTM 3Q2010
0.0%
5.0%
10.0%
15.0%
20.0%
1,693
2,6563,027
2,7332,449
3,173
14.4%
20.1% 19.6% 20.3%21.4%16.7%
0
1,000
2,000
3,000
4,000
2006 2007 2008 2009 9M 2010 LTM 3Q2010
0.0%
5.0%
10.0%
15.0%
20.0%
25.0%
Top Line Growth with Improving Margins
IDR Bn
Margin (%)
IDR Bn
Margin (%)
Sales Growth, CAGR 17.0% Operating Profit Growth, CAGR 43.4%
252
554 533 569520
70814.9%
20.9% 20.8% 21.2% 22.3%17.6%
0
200
400
600
800
1000
2006 2007 2008 2009 9M 2010 LTM 3Q2010
0.0%
5.0%
10.0%
15.0%
20.0%
25.0%
2010
102122
37
276256
355
6.0%
4.6%
10.1% 10.5%11.2%
1.2%
0
100
200
300
400
500
2006 2007 2008 2009 9M 2010 LTM 3Q2010
0.0%
3.0%
6.0%
9.0%
12.0%
2010
22
IDR Bn
Margin (%)
IDR Bn
Margin (%)
Net Income Growth, CAGR 36.7% EBITDA Growth, CAGR 29.5%
Notes:LTM – Last Twelve Months (October 1 2009 – September 30 2010)FY2008 net income includes a one-off accounting loss on foreign exchange of USD 18 millionExchange rate: USD 1 = IDR 9,020, IDR 9,419, IDR 10,950, IDR 9,400, and IDR 8,924 for 2006, 2007, 2008, 2009, 3Q 2010 respectively

1.4 1.4 1.4
0.91.0
0.0
0.5
1.0
1.5
2006 2007 2008 2009 LTM 3Q 2010
8.7% 9.4%
2.8%
17.5%19.0%
0.0%
5.0%
10.0%
15.0%
20.0%
2006 2007 2008 2009 LTM 3Q2010
Improving Balance Sheet Strength
x%
ROE Debt to Equity
(1) (1)
2.5
3.1
2.4
3.2
4.8
0.0
2.0
4.0
6.0
2006 2007 2008 2009 LTM 3Q 2010
2006 2007 2008 2009 LTM 3Q 2010
6.4
3.4 3.5
2.6 2.7
0.0
2.0
4.0
6.0
8.0
2006 2007 2008 2009 LTM 3Q 2010
2010
23
x x
Debt to EBITDA EBITDA to Interest
Note:1. LTM 3Q 2010 = Last Twelve Months ended 3Q 2010 (October 1, 2009 – September 30, 2010)
(1) (1)

Q & A
For further information, please visit our website a t: www.fajarpaper.com