Embed Size (px)
Citation preview


PSYCHOGRAPHIC SEGMENTATION STUDY
OF SINGAPOREAN TOURISTS
BY
NGIAP CHEW LOH (CHRIS)
Submitted in Partial Fulfilment of the Requirements of the Degree
Master of Business in Hospitality Management in the Faculty of Business
Victoria University of Technology
1994

FTS THESIS 338.4791S4 LOH 30001004590123 Loh, Ngiap Chew
s?uriv°nf^?^''' segmentation study of Singaporean tounsts

ABSTRACT
The psychographic factor with respect to the preferences and attitudes of Singaporean tourists going on vacation was examined in this thesis.
. K'i'7 ''''^
Factor analysis was conducted on 16 psychographic statements taken from Schul and Crompton (1983) who extracted them from Hay Associate (1978) which yielded 5 basic tourist typologies. These are as follows: ^
Explorer: Tourists who like to experience new culture, learn new things and experience local customs when they go on vacation.
Organised Tourists: Tourists who preferred joining tours when they go on vacation.
Active Tourists: Tourists who preferred to do many things during Tourists their vacation.
Pleasure Seeker: Tourists who preferred to visit places based on what friends that have visited
before. In addition seeking relaxation and staying in the best acconmiodation during their vacation.
Sophisticated Seeker: Tourists who preferred active participation in a variety of interests whilst on
vacation, especially night life.
However, based on the five identified typologies, Australia has a widf variety of attractions and interests to cater for these segments of tourists. The results provide an insight into Singaporean tourists going on vacation. In addition, the co-relation between psychographic and demographic data shows weak or no significant relationship.

DECLARATION
This study contains the orginal work of the author except where noted in the report. It contains no material which has been submitted for examination or award of any degree in any university
/Vd^^
N. C. LOH CHRIS

ACKNOWLEDGEMENT
I would like to take this opportunity to express my sincere thank you to the following:
In the Faculty of Business at Victoria University of Technology:-
My Supervisor, Leo K. Jago - Lecturer in Tourism and Marketing Paul Whitelaw - Executive Director of the Centre for Hospitality and Tourism Research Professor Ray Anderson - Lecturer in Accounting and Law
for their support, editing and advice they have rendered throughout the process of compiling this thesis.
I would like to dedicate this thesis to my family members who supported and inspired me during my two years of academic study.
I would like to express my gratitude to Jennifer Hill who has been a constant source of motivation and inspiration.
My appreciation to my friend Douglas Josephides for editing this thesis.
To the Research Team in Singapore - My special thanks to my friends in Singapore for their research efforts especially to Anthony Wong, Theresa Wong and my family members for their time and devotion in helping to complete the survey.

TABLE OF CONTENTS
ABSTRACT PAGE DECLARATION ACKNOWLEDGEMENTS TABLE OF CONTENTS LIST OF TABLES LIST OF FIGURES
CHAPTER 1 - INTRODUCTION
1.1 BACKGROUND TO THE RESEARCH 1 1.2 THE PROBLEM 2 1.3 THE HYPOTHESIS 5 1.4 THE OBJECTIVE 8 1.5 JUSTIFICATION OF THE RESEARCH 9 1.6 LIMITATION & KEY ASSUMPTION OF THE
STUDY 17
CHAPTER 2 - LITERATURE REVIEW
2.1 SOURCE 19 2.2 BACKGROUND OF SINGAPORE AND
CHARACTERISTICS OF SINGAPORE TOURISTS 20 2.3 MOTIVATION FOR TRAVEL 25 2.4 DEHNITION OF PSYCHOGRAPHICS 27 ^ 2.5 APPLICATION OF PSYCHOGRAPHICS
SEGMENTATION 29 . 2.6 USES OF PSYCHOGRAPHIC SEGMENTATION 30
CHAPTER 3 - RESEARCH METHODOLOGY
3.1 DEFINITION OF TOURISTS 35 3.2 THE SAMPLE 35 3.3 THE QUESTIONNAIRE 37 3.4 PILOT STUDY 38 3.5 PROCEDURE 38 3.6 IDENTIFICATION OF VARIABLES 39

CHAPTER 4 - DATA COLLECTION & ANALYSIS
PAGE
4.1 DESCRIPTION OF SAMPLE 42 4.2 FACTOR ANALYSIS 48 4.3 CHI-SQUARE ANALYSIS 49 4.4 HYPOTHESIS TESTING 52 4.5 CONCLUSION 58
CHAPTER 5 - DISCUSSION & LIMITATION 60
CHAPTER 6 - CONCLUSION & RECOMMENDATION 74
APPENDICES
APPENDIX A: QUESTIONNAIRES 78
STATISTICAL ANALYSIS OF THE SAMPLES
APPENDIX B: FREQUENCY TABLE, MEANS AND 82 STANDARD DEVIATIONS
APPENDIX C: FACTOR ANALYSIS - INITIAL FACTOR METHOD; PRINCIPAL COMPONENTS 88

PAGE
APPENDIX D: FACTOR ANALYSIS - ROTATION METHOD; VARIMAX 89
APPENDIX E: PEARSON CORRELATION 90
APPENDIX F: FREQUENCY TABLE OF FIVE TYPOLOGY: "HEAVY" & "LIGHT" 91
APPENDIX G: CHI-SQUARE TEST 109
APPENDIX H: KOLMOGOROV SMIRNOV TEST 134
REFERENCES 154

LIST OF TABLES
TABLE 1: PRINCIPAL DESTINATION OF SINGAPOREANS TRAVELLING ABROAD 1990- 1991
PAGE
TABLE 2: SINGAPOREAN ARRIVALS BY PURPOSE OF VISIT 1980-1991 12
TABLE 3: VISITOR ARRIVALS TO AUSTRALIA 1990-1992 13
TABLE 4: SUMMARY OF CHARACTERISTIC OF SINGAPOREANS TRAVELLING ABROAD 1990-1991
TABLE 5: SUMMARY OF DEMOGRAPHIC SAMPLE
23
43
TABLE 6: MEAN AND STANDARD DEVIATION OF PSYCHOGRAPHIC STATEMENTS 47
TABLE 7: CHI-SQUARE TEST OF FIVE TYPOLOGY RESULTS 49
TABLE 8: BRIEF DESCRIPTION OF PSYCHOGRAPHIC STATEMENTS 63
TABLE 9: FIVE SELECTED HIGH LOADING PSYCHOGRAPHIC VARIABLES 70
TABLE 10: FREQUENCY TABLE OF FIVE HIGH LOADING FACTORS 72

LIST OF FIGURES
PAGE
FIGURE 1: GENDER 44
FIGURE 2: AGE 44
FIGURE 3: EDUCATION 45
FIGURE 4: MARITAL STATUS 45
FIGURE 5: ANNUAL TOTAL INCOME LEVEL 46

CHAPTER 1
INTRODUCTION
1.1 BACKGROUND TO THE RESEARCH
Reillys A. (1989:4) states that "Singaporeans are among the most travelled people in the world". Tan (1990:34) states that "Singaporeans these days are travelling more for pleasure than for business". Over, the last 10 years, the number of Singaporean tourists travelling to Australia has increased rapidly from 16,420 in 1980 to 116,800 in 1992(ABS catalogue 3404.0 table 2 «fe 3).
The objective of this study is to use psychographic statements to provide an insight of
Singaporeans who will travel overseas. What are their preferences and attitudes toward
travel? This study also attempts to analyse and classify these people into different
typologies based on their travel psychographic statements using Factor Analysis. It also
attempts to test the correlationship between five identified typologies and demographic data
using hypothesis testing.
A considerable body of literature is reviewed including motivation for travel and
psychographic segmentation.
This study is designed to explore the nature of Singaporean tourists by providing an initial
stage of the finding.

1.2 THE PROBLEM
During the last 10 years, Australia has become a popular destination for Singaporean
travellers. Singaporeans arriving in Australia have increased greatly from 16,420 in 1980 to
116,800 m 1992(ABS catalogue 3404.0 table 2 & 3). This growth rate is very signifcant
and plays an important role in contributing tourism dollars to Australian economy.
McMahon (1993:22) stated that "Australian Bureau of Statistics figures for 1992 showed
dramatic changes in the market composition with Asia dominating the picture."
McMahon (1993:23) further explains that "The 30 per cent increase in total arrivals during
1992 disguised the even more impressive increase, 45 per cent in holidaymakers. The ATC
is confident that increasing Asian affluence, Australia's proximity and aggressive marketing
should ensure continued growth."
Thus, Australia's popularity as a Singaporean tourist destination grew rapidly. Therefore,
there is a need to understand andidentify what factors contribute to the growth of tourism in
Australia from the Singapore.
It is imperative to understand through demographic and psychographic research,the type of Singaporean who chooses to go on vacation. According to"Insight" edited by Leone (1993:16), Asians are looking at Australia with renewed interest as a choice of destination, by the Australian Tourist Commission. Their fmding illustrated that Asians once visited Australia mainly for fun in-the-sun and its glamorous cities. As a change of image, Asians are now visiting Australia for its different cultures and its open environment.
Westwood (1993:3) stated that" potential tourists from Singapore, Hong Kong and Malaysia
remain to be convinced Australia is not a boring holiday destination." In addition,
according to Westwood (1993:3), the Australian Tourist Commission's - Manager of
Planning and Research, Mr. Godfrey Santer stated that Asian countries such as Singapore,
Hong Kong and Malaysia, where international travel was considered a status symbol did not
traditionally regard Australia as an exciting destination.

Therefore, the Australian Tourism Commission's General Manager Operations,Carole
Hancock stated in Travel Week by McMahon (1993:14), that the key issue facing the
ATC was to balance the need to develop new markets whilst continuing to nurture existing
markets in the region.
McCabe (1993: 4) stated that the Australian Tourist Commission has focused on three key
segment groups; "Cultural Discovery", "Fun-In-The-Sun" and "City Glamour" in order to
overcome an image problem, as Australia was perceived as an expensive, bland,boring
(without the status of Europe) and even racist tourist destination.
The objective was to promote Australia to different parts of the world.
McCabe (1993:4) reports that:
"According to tracking studies undertaken by the ATC last year,Australia is rated as
the first or second most desirable country to visit in nine of the 13 markets
addressed by the commssion. There is a feeling that more can be done to translate
this desire to visit into bookings.
Problems to be overcome include the "tyranny of distance" and related expense, and the persistence of outmoded perceptions of Australian as a destination.
But product design, development and distribution have also come under fire. Some
products are being mis-marketed; others are poorly designed for their target
audiences. Japanese travellers, for example, are shedding parts of their package
tours, a clearindication the product is not in tune with their needs."
Van Raaj (1986:2) stated that "Consumer wishes and desires should constitute the basis for
marketing strategies. Consumer preferences are partly dependent on what is available in the
market and partly on what consumers consider to be "Ideal" product or service". Therefore
market plarmers can work more effectively by understanding the market and the various
segments.

William (1982: 254) also stated that marketers are changing their approach in analysing
market segments by analysing the behavioural concepts such as attitudes, motives, and life
styles instead of conventional demographics such as age and socio-economical grouping.
Thus,with an increasing number of Singaporeans visiting Australia, it is important to
analyse what their preferences are and identify what segments of the population can be
classified into different typologies. In this way, marketing strategies can be developed to
cater for Singapore market. Ooi (1992:44) stated that "The outbound Singaporean travellers
are mostly from the upper and middle income families, singles and young professionals.
The younger generation are generally the Free Independent Travellers as it is perceived to
be cheaper and more adventurous. They preferred choices of holiday among young
consumers who are active leisure oriented resort/golf holidays and soft adventure holidays
with a quality destination experience."
Hence, it is imperative to study Singaporean tourists who go on a vacation. In this way, an
understanding of the market, can be obtained for effective fumre marketing strategies.
Marketing Strategies can be developed in terms of positioning versus the competitor, image,
the target market, media advertising, promotion and so on. Therefore, in order to cater the
characteristics of different markets, it is extremely important to identify the various
segments of Singaporean travellers.

1.3 HYPOTHESIS
The validity of the present study is based on the early studies by researchers (Schul and
Crompton, 1983) when suggested that search behaviour was better explamed by travel-
specific psychographics rather than the use of demographics.
Thus, the psychographic variables for psychographic segmentation were adapted from Schul
and Crompton (1983:25) who in turn adapted them from Hay Associated. (1978)
However, based on travel market segmentation in this industry, the following assumptions
have to made in this fmding.
* Due to the different demographic and psychographic characteristics of tourists,
their needs and demands will vary accordingly.
* Tourists come from a heterogenous population.
* A market segmentation can be developed and identified based on similar
characteristics.
Based on these assumptions, Singaporean tourists travelling abroad will be classified into
different typologies or groups (segment) according to their psychographic statements and
each typology or group (segment) will be correlated to the socio-demographic data in terms
of "Sex", "Age", "Marital Status", "Education" "Annual Total Income" and "Information
Source".
Five factors are being hypothesised to test the correlation. Each factor illustrates a segment
of tourists, having statistically related responses with respect to psychographic factors. It
was obtained by measurmg the differences in the travel psychographic variables formed
from factor analysis. Each factor was given a name, for example, Explorer.
Thus, the followings hypotheses were set:

FACTOR 1 - EXPLORER
Hypothesis 1
Ho: There is no difference between the socio-demographic based on "Sex", "Age", "Marital Status", "Education", "Annual Total Income" and "Information Source" profile in terms of high and low loading on psychographic profile of the Explorer.
H : That there is a difference. I
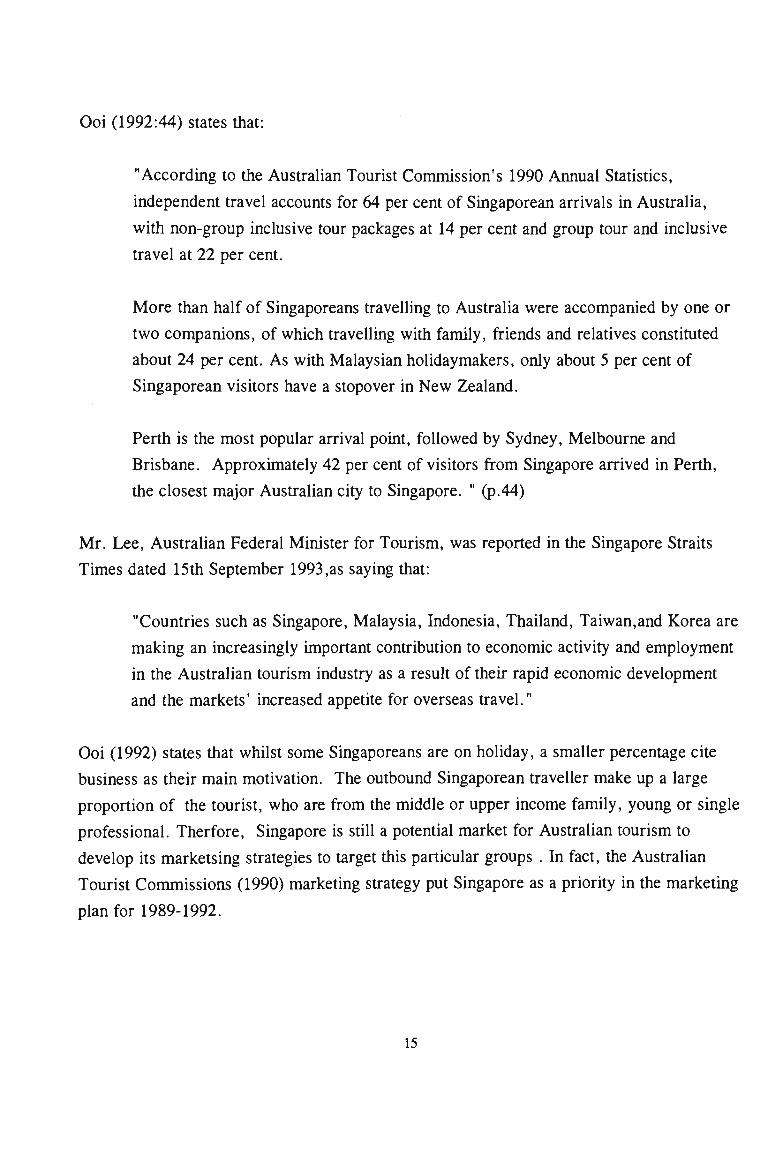
FACTOR 2 - ORGANISED TOURISTS
Hypothesis
Ho: There is no difference between the socio-demographic based on "Sex", "Age", "Marital Status", "Education", "Annual Total Income" and "Information Source" profile in terms of high and low loading on psychographic profile of the Organised Tourists.
H : That there is a difference. I
FACTOR 3 - ACTFVE TOURISTS
Hypothesis
Ho: There is no difference between the socio-demographic based on "Sex", "Age", "Marital Status", "Education", "Aimual Total Income" and "Information Source" profile in terms of high and low loading on psychographic profile of the Active Tourists.
H : That there is a difference. I

FACTOR 4 - PLEASURE SEEKER
Hypothesis
Ho: There is no difference between the socio-demographic based on "Sex", "Age", "Marital Stams", "Education", "Annual Total Income" and "Information Source" profile in terms of high and low loading on psychographic profile of the Pleasure Seeker.
H : That there is a difference. I
FACTOR 5 - SOPHISTICATED SEEKER
Hypothesis
Ho: There is no difference between the socio-demographic based on "Sex", "Age", "Marital Status", "Education", "Aimual Total Income" and "Information Source" profile in terms of high and low loading on psychographic profile of the Sophisticated Seeker.
H : That there is a difference. I

1.4 THE OBJECTIVES OF THE STUDY
In this research, the concept and application of psychographic segmentation has been used
to develop an understanding of Singaporean tourists going for vacation.
As the literature review illustrates, many schools of thought used this application in tourism research,such as Schul and Crompton (1978) m their study of Psychographic Segmentation of Tourists.
The objective of this study is to use psychographic statements to provide an insight into
Singaporeans travellmg abroad.
It also attempts to analyse and classify these people mto different typologies based on their
travel psychographic statements using Factor Analysis. It also attempts to test the
correlationships using hypothesis testing.
In applying the approach of psychographic study, this study attempts to provide an
understanding of Singaporean tourists. Schul and Crompton (1983), stated that this
approach allows marketers to visualise the tourists they are trying to reach.
This study will finally provide recommendations for public and private travel sectors
interested in the Singapore travel market.

1.5 JUSTIFICATION FOR THE RESEARCH
Ooi (1992:40) stated that "Singapore's strong economic growth has created a dynamic
consumer society. With high levels of disposable income, Singaporeans are pursuing a
more sophisticated lifestyle in which holiday travel is a growing trend."
As shown in Table 1, Malaysia was the Principal destination of Singaporeans travelling
abroad, 1990-91. TABLE 1
Principal Destinations of Singaporeans Travelling Abroad - 1990/1991 ('000) Destination
ASIAN NATIONS Indonesia Malaysia Philippines Thailand ASIA Hong Kong Japan Taiwan Korea Sri Lanka Australia UK NORTH AMERICA USA Hawaii Canada
1990
621.1 4,535.4 19.3 335.7
200.9 43.0 59.5 26.3 5.2 75.9 64.0
53.6 16.0 18.6
1991
710.7 3,230.6 15.7 320.1
229.4 42.9
30.2 4.2
50.0
57.3 13.5 18.3
% Change
14.4 -28.8 -18.7 -6.6
14.2 -0.2
14.8 -19.2
-21.9
6.9 -15.6 -1.6
Source: National Tourist Organisations

According to the above table, in 1990, Singaporeans preferred Australia as a tourist
destination in comparison to UK, USA, Canada, Japan, Taiwan and Korea. Further details
concerning Singaporeans travelling to Australia will follow.
SINGAPORE - THE MARKET FOR AUSTRALIA
Doman (1993:45) states that Singapore's economic advancement is a success story.
"Singapore is Australia's third largest export market - albeit as a result of heavy
Singapore demand for Australian gold, which accounts for around half of the $3.7
billion export flow to the city state during 1992. But there has also been healthy
growth in Australian processed and unprocessed food shipments to Singapore, with
high value added manufacturmg exports also increasing".
Osborne (1992:34) states that "Singapore remains Australia's most important Asian market
and fourth largest export market after Japan, the US and Korea".
Tourism in Australia is seen as very attractive to Singaporeans and Australias rise in
popularity also coincides with a large investment m Australia over the recent years.
Mitchell (1993) revealed in his survey of foreign ownership in Australia's tourism industry
that Singaporean investors were the "biggest players" in 1992.
Mitchell (1993) further purported that these findings dispelled the myth that the industry is
dominated by Japanese money. It was found that by 1992 that the South East Asia investor
accounted for nearly 80% of international investment in Australia's tourism property with
Singapore providing almost 23 %.
Mitchell (1993) states that Singaporean investors were Victoria's best clients, purchasing
eight properties at a total value of $92.97 million followed by Hong Kong which obtained
five properties for $92.97 million in 1991. Opportunities for Singaporeans to invest in
properties in Australia also boosts the tourism industry.
10

SINGAPORE OUTBOUND MARKET
McMahon (1993:22) stated that "Australian Bureau of statistics figures for 1992 showed
dramatic changes in the market composition with Asia dominating the picture. More than
1.1 million visitors or 40 per cent of the total figure of 2.603 million, came from Asia, with
Japan alone supplying nearly 25 per cent of the traffic." However, other Asian markets
grew rapidly such as Singapore which showed a 30% growth rate.
Over the last 10 years, Australia has become very popular as a destination for Singaporean
tourists. Table 2 shows the increasing visitation number of Singaporean visitors to
Australia between 1980 and 1991.
11

TABLE 2
Year
1980 1981 1982 1983 1984 1985 1986 1987 1988 1989 1990 1991
Singaporean Arrivals by Purpose of Visit - 1980-1991
H/Day
6640 8980 11950 17270 18040 20060 28270 37280 40180 42200 48200 60100
Visit Relative 3600 4000 4420 4910 5050 5400 6530 7760 9220 9500 10300 11300
Business
3040 3880 4160 4180 4650 5070 5250 5960 7160 7100 8300 9300
Convention
430 290 310 400 400 360 720 780 1330 800 800 1000
Other
2710 2470 3560 2990 4870 4440 4200 5180 5590 5600 8200 4500
Total
16420 19620 24400 29750 33010 35330 44970 56960 63480 65200 75900 87500
Source: Australian Bureau of statistics
Visitation from Singapore has increased tremendously and plays an important role in
contributing to the total tourism earnings of Australia.
A detailed analysis of outbound Singaporean tourists arriving in Australia is illustrated
below (Table 3).
12

TABLE 3
Visitor Arrivals to Australia - 1990-1992
1990 1991 1992
75,900 87,500
116,800 PURPOSE OF VISIT Holidays Visiting Relative Busmess Convention Other TOTAL
1990 48,200 10,300 8,300 800
8,200 75,900
1991 60,100 11,300 9,300 1,000 4,500
87,500
1992 87,100 11,500 10,000
900 7,300
116,800
Source: Australian Bureau of Statistics
Based on the above statistics, there were 116,800 visitors to Australia from Singapore in
1992 which represents, an increase of 33.48% over the previous year.
As indicated in the above statistics, more Singaporeans are travellmg to Australia for
holidays. The holiday catergory in 1992 was 44.9% higher than in 1991.
The business and visiting relatives market are growing, but the actual percentage increases
(that is, 4 per cent) are not as great as in the holiday segment . The increase in numbers of
holiday visitors suggests that cheaper fares and other incentives are available.
Ooi (1992:42) stated that "Rising costs for travel to longstanding favourite destinations like
Europe and North America have resulted in a switch by Smgaporeans to cheaper, nearer
and better value destinations such as Australia and New Zealand".
13 I

In addition, as reported in The New Paper in Singapore dated 13th October 1993:
"Australian Tourist Commission (ATC) figures show that, in the six months to June this year,the number of Singaporeans to visit Australia increased by 48 per cent over the last year.
The Singapore dollar, which averaged at S$1.20 to one Australian dollar in that
period, and the attractive fares offered by major airlines were incentives for
Smgaporeans to head Down Under."
In the Singapore Straits Times (1993:30) it was reported that the recession and the cheaper
dollar have made Australia more attractive to the traveller including Singaporeans who form
the fifth largest group of travellers to Australia.
The outbound market for Singaporeans occurs primarily during school holidays. A report
from the Singapore Straits times indicates that Singaporeans' most popular months of travel
to Australia were June, November and December.
In addition, there were also growing links between Singapore and Australia that were not
economically based which stimulated the Increasing traffic. For example, students studying
in Australia would likely encourage friends and parents to visit them. Ooi (1992:44) states
that "Analysis of selected destinations indicates that most Singaporeans stay in hotel
accommodation whilst abroad. Australia is an exception as more than a third of all visitors
stay in the homes of friends and relatives. Less than 20% stay in hotels and approximately
30% stay in rented accommodation." Thus, such factors play an important role in
generating Singaporean tourists to Australia.
Reilly (1989) stated that Singaporeans do not generally plan their holiday in advance. There
is an increasing trend of Free Independent Travellers. Singaporeans are becoming more
selective and more adventurous as they become accustomed to travel, especialUy
destinations outside Asia. However, 50% of Singaporean tourist have visited Australia more
than once, suggesting that when they are more familiar with their tourist destination, they
are likely to become independent travellers.
14
Ooi (1992:44) states that:
"According to the Australian Tourist Commission's 1990 Annual Statistics,
independent travel accounts for 64 per cent of Smgaporean arrivals in Australia,
with non-group inclusive tour packages at 14 per cent and group tour and inclusive
travel at 22 per cent.
More than half of Singaporeans travelling to Australia were accompanied by one or
two companions, of which travelling with family, fi^iends and relatives constituted
about 24 per cent. As with Malaysian holidaymakers, only about 5 per cent of
Singaporean visitors have a stopover in New Zealand.
Perth is the most popular arrival point, followed by Sydney, Melbourne and
Brisbane. Approximately 42 per cent of visitors from Singapore arrived in Perth,
the closest major Australian city to Singapore. " (p.44)
Mr. Lee, Australian Federal Minister for Tourism, was reported in the Singapore Straits
Times dated 15th September 1993,as saying that:
"Countries such as Singapore, Malaysia, Indonesia, Thailand, Taiwan,and Korea are
making an increasingly important contribution to economic activity and employment
in the Australian tourism industry as a result of their rapid economic development
and the markets' increased appetite for overseas travel."
Ooi (1992) states that whilst some Singaporeans are on holiday, a smaller percentage cite
business as their main motivation. The outbound Singaporean traveller make up a large
proportion of the tourist, who are from the middle or upper income family, young or single
professional. Therfore, Singapore is still a potential market for Australian tourism to
develop its marketsing strategies to target this particular groups . In fact, the Australian
Tourist Commissions (1990) marketing strategy put Singapore as a priority in the marketing
plan for 1989-1992.
15

Groves (1993) mentioned that a Singaporean travel agent on a fact fmding tour was told
Australians have been short sighted in concentrating on Japaneses tourists, as there are
many lucrative but untapped tourist markets. Wealthy Malaysian, Chinese and Americans
have yet to discover Australia.
Singapore in the near future will be considered a potential market for the Australian Tourist
industry. If the Australian Tourist Commission marketing strategy is mapped correctly.
Hoon (1990) stated that ATC's target for Asia is as follows:
ATCs TARGET FOR ASLV
COUNTRY Singapore Hong Kong Malaysia Indonesia Taiwan South Korea Thailand Asia (TOTAL)
1990 72,000 65,000 50,000 33,000 27,000 14,000 20,000
375,000
2000 200,000 210,000 150,000 125,000 250,000 250,000 75,000
1,615,000
Source: ATC : 1990
It can be seen from the above statistics that ATC is looking forward to rapid growth for the
Asian market.
The Australia Tourist Commission target for the year 2000 is 200,000 visitors from
Singapore. To achieve this goal, a marketing strategy must be developed that targets the
sector of the Singaporean market most likely to visit Australia. This will increase the cost
effectivenss of the campaign.
16

1.6 LIMITATIONS AND KEY ASSUMPTIONS USED IN THE STUDY
Based on this study, psychographic segmentation is subject to several limitations in
explormg the tourism industry. The objective of using the psychographic statements is to
illustrate the the psychographic nature of Singaporean tourists.
Lundberg (1980:278) states that "Psychographic research can take a variety of forms. It
can be collected by indepth interviews, focus groups, word association tests, projective
techniques and a number of similar techniques, most of which are subject to investigator
bias or unreliability of the technique or instrument used. Feelings and attimdes are
qualitative and labile. Nevertheless, the stuff of pleasure travel are emotions and attitudes
and to predict or mfluence pleasure travel the researcher must get into the minds of the
travellers".
Pearce (1980:123) states that the article by B. H. Farrell, "Tourism, Human Conflicts,
cases from the Pacific, (Annals, 1979 : 2: 122-126) argues that psychographic smdy of
tourism is highly desirable. He suggests that the mind of the tourist, local people and
developers are appropriate grounds for tourist researchers to explore. (1980 :122)
"Unfortunately, Farrell's attempt to explore the minds of tourists has resulted in a
meandermg path through a veritable jungle of difficult subject areas, and has led him
directly to a set of terminological fads and fashions.". Therefore,it is important to adapt the
right approach in this study, if not, it might lead to a wrong analysis.
Thus, one has to be careful with the interpretation of the result, as Wells (1975) discussed
in great depth concerning reliability,validity and application. This raises the question with
respect to the present study as to how reliable and valid the measurements can be.
17

According to Well (1975:205) "Like other measurements, psychographic measurements can
be reliable without being valid. They can be relatively free of random error but so full of
irrelevancies and biases that conclusions based on them are partly (or even completely)
false.The question of the validity of psychographics is difficult and complex and cannot be
answered simply."
Plog (1987) regarded demographics, as a useful tool in travel research but believed it failed
to explain the factors of motivation to travel. Psychographic measures, in contrast, answer
all the important questions about how, why and what.
Pearce (1980:122)" suggests that the minds of tourists, local people and developers are
appropriate grounds for tourist researchers to explore. This view is not a new one
(c.f Turner and Ash 1975:244), but judging from a recent catalogue of tourist
psychology references (Pizam and Chandraseker 1979:78-79) it is still worth recordmg."
Thus, within limitations, psychographic segmentation is a useful tool for research into the
tourism industry .
18

CHAPTER 2
LITERATURE REVIEW
2.1 Source
A literature search was conducted as to why people travel, as well as the concept of
psychographic segmentation so that it could be applicable in line with the defmition. In
addition, a background of Singapore and characteristics of Singaporean travellers was an
essential basis for the research. Other tourists variables and trends in relation to Singapore
tourist market for Australia was source.
In accordance with the nature of the thesis, the main focus was confmed to the
understandmg and preferences of Singapore Tourists' travellmg abroad for vacation.
Psychographic variables and demographic data was used to investigate the response of
Singaporean tourists.
In general, textbooks on tourism and marketing provide various defmitions in relation to
consumer behaviour. Tourism related research, Journal, such as Journal of Travel Research
and Annals of Tourism research was source as it provide a good reference to the literature
review.
A computerised search via APAIS, the Australian Leisure Index enabled identification of
articles pertaining to the issues. In addition, other publications of related organisations, such
as Australia Tourism Commission (ATC), Pacific Asia Travel Association (RATA)
provided reference to the studies of the Singapore market for Australia. An additional
literature search was based on journals like. Tourism Management, Travel & Tourism
Analyst and tourism related articles in the Singapore Straits Times, magazines,and the local
newspapers in Australia.
The literamre search was conducted for the period 1960 to 1993. The earlier literamre provided a useful defmition , framework and concept of psychographic for this thesis. As for the later part of the literamre, it provided a variety and indepth understandmg of the subject
19

2.2 BACKGROUND OF SINGAPORE AND CHARACTERISTICS OF SINGAPOREAN TOURISTS
Khan,Chou & Wong (1990:410) stated that "Tourism is a fast-growing industry in Singapore." It creates jobs, earns foreign exchange and plays an important role in contributing to economic growth and development.
Smgapore, has shown substantial growth since 1965 with the growth in the last ten years being dramatic. Doman (1993:22) stated that "Singapore's economic advancement is a success story not matched anywhere in the past 30 years. Year after year of double-digit growth rates have taken the tiny island city state to the verge of fully developed economic status." It has emerged as an industrial "Dragon" in Asia with tourism contributing greatly to this success.
With the development of the country and growing affluence of Singaporeans, there has been a great impact on life style. Rodan (1992:380) stated that" Singapore's rapid economic development has set in train important social changes. In particular, it has fostered the emergence of a substantial middle class with significant purchasing power that expresses itself in new lifestyle and aspirations."
Thus, with a total area of only 639.1 sq.km and a 2.7 million population living on an
island, social activities to cater for the masses are limited. Therefore the Singapore
Government and the Private Sector embarked on cultural and recreation programs for the
locals and the tourist industry alike such as bringing international acts like Les Misrables
and Michael Jacksons concerts to Singapore's numerous theatres.
In addition, other South East Asia countries like Malaysia, Indonesia and Thailand also
provide tourist destinations for Singaporeans as alternative outlets for leisure and relaxation
on short and long term basis.
The Bureau of Tourism Research reported in the Tourism and the Economy report in
October (1991:12) that "Singapore, the largest source country for travellers to Australia in
Asia (excl. Japan) is the most wealthy economy in Asia outside Japan."
20

Therefore, it is important to understand what motivates Singaporean tourists to travel
abroad for vacation in other countries like Hawaii, Australia, Paris, USA and Asia.
CHARACTERISTICS OF THE SINGAPOREAN TRAVELLER
According to Singapore Tourist Promotion Board reported in the Good Weekend (1992:6)
"The people of Singapore worked hard during the first 25 years of mdependence,
transforming their tiny island republic from a third world nation into one of the most
prosperous and advanced societies in Asia. After a quarter century of increasing growth,
people are now starting to chaimel their energy and expertise into leisure and cultural
pursuits."
Thus, it was important to gam an insight into the Singaporean traveller so that the countries
they were visiting were able to communicate the benefits and experiences that the
Singaporean tourists seek.
Ramt (1990) wrote that the first time Singaporean travellers are affected by three K's - Kia
su, Kia see and Kiam siap - which loosely translated from local dialects (Hokkien) mean j
not wanting to loose out, afraid of dying and stingy. Raint (1990:19) illustrated this by "At
a buffet, he does not want to queue and rushes for his food,piling his plate high. Being in
unfamiliar surroundmgs, he worries that he will be stranded if nobody meets him at the
airport and thinks his luggage has been lost if he does not see it at baggage claun within
minutes. And he never misses the chance to bargain and haggle over the price, no matter
what he buys."
Thus, in understanding this context, one gains an insight into the Singaporean
characteristics as a tourists on foreign soil. It provided an understanding to the host country
they visited.
21

There are also other characteristics of the Smgaporean traveller abroad. Kim (1993) stated
that Singaporeans look for five 'C's in a hotel - Convenience, Comfort, Cleanliness, Cost-
effectiveness and Chinese food when travelling abroad.
Singaporeans, when travelling overseas, typically would look out for Chinese restaurants or
places sellmg Singaporean food for them to dine.
Soh (1991) states that a true Singaporean will go out searching for their local food,
irrespective of where they are in the world. They will not be content with apple strudel or
wiener schnitzel. As a matter of fact, when they travel they look for food that is hygienic
and suited to their own diet. Thus, it clearly indicates an important aspect of the
characteristics of Singaporean travellers abroad.
Thomas (1987) stated that Singaporeans are known to be fussy when on vacation,
especially about items such as meals, hotels, tours. They want the best and want it
cheaply. They will shop around and bargain to get the best price in town.
Thomas (1989) stated that Singaporeans are notoriously safety conscious and perceive
destinations like Australia and New Zealand as non-threatening. This could account for the
increase of Singaporean tourists to Australia.
Table 4 contains a summary of characteristics of Singaporean travelling abroad, 1990 and
1991*
22

TABLE 4
Summary of Characteristics of Singaporean Travelling Abroad 1990 and 1991* (%)
1"' ^ ' ' "
Characteristics Philippines Thailand Indonesia Hawaii Australia Taiwan Sri Lanka MODE OF ARRIVAL Ah-
Isea 1 Land
98.9 1.1 . . . .
. . . .
. . . .
. . . .
26.4 73.6 . . . .
. . . .
. . . .
. . . .
. . . .
. . . .
. . . .
99.5 0.5 . . . .
. . . .
. . . .
. • • •
SEX Male Female
90.0 10.0
68.6 31.4
79.6 20.4
66.2 33.9
. . . .
. . . .
78.7 21.3
71.3 28.7
TYPE OF ACCOMMODATION Hotel Residence of Friends/Relati ves Others Not Stated
73.7 10.0
16.3 —
99.2 0.2
0.6 . . . .
64.6 2.6
32.0 0.8
90.3 6.9
2.8 . . . .
17.0 35.0
48.0 . . . .
. . . .
. . . .
. . . .
«
. . . .
. . . .
FREQUENCY OF VISIT First Visit Revisit Not Stated
34.2 65.8 . . . .
37.0 63.0 . . . .
18.5 70.4 2.1
70.7 29.3 . . . .
50.0 50 . . . .
. . . .
. . . .
. . . .
TRAVEL ARRANGEMENTS Package/ Group Tour Non-Package/ Group Tour Not Stated
2.6
97.4
. . . .
40.8
59.2
. . . .
19.2
78.5
2.3
40.0
60.0
. . . .
22.0
78.0
. . . .
. . . .
—
. . . .
LENGTH OF STAY Days Nights
6.8 —
. . . .
—
3.4 —
6.3 —
. . . .
25.0 . . . .
—
Source: National Tourist Organisation * Data for Australia, Taiwan and Sri Lanka are for 1990; all others are for 1991.
Based on Table 4, Australia has an equal percentage of furst time and return visitors from
Singapore.
23

In addition, a high percentage of travel arrangements are not in packages or group tours and
the length of stay amounts to 25 nights which quite high.However, not all data is available
for comment and comparison.
In conclusion, an understanding of the characteristics of Singapore travellers is an
unportant basis in the study of the tourism industry. It establishes the backbone of the
marketing strategy to target specific segments of potential tourists. An advertising or
promotional activity can be developed to woo tourists to Australia if the marketer
understands and identifies the characteristics of Singaporean tourists and the market
segments.
24

2.3 MOTIVATION FOR TRAVEL
Murray (1964:9) stated that" At any given time a person is motivated by a variety of internal and external factors. The strength of each motives and the pattern of motives influence the way we see the world, the things we think about, and the actions in which we engage".
Harssel (1988:147) state that " A motive can best defmed as "the need or deshe of an individual to do a particular thing."
In Peters (1960:39) Newcomb is quoted as saying:" An Organism is motivated when - and only when - it is characterized both by a state of drive and by a direction of behaviour towards some goal which is selected in preference to all other possible goals. Motive, then, is a concept which joins together drive and goal."
Thus, there are many reasons for people to travel. Improvements to transportation made it
possible for people to travel all around the world for various reasons. For instance, visiting
friends and relatives,business travellers,attending special events,
vacation and so on.
Dickman (1989) states that, the motivation for travel to other countries is the desire to see a particular thing such as the Sydney Opera House or seeing how people live and work or attending special events or seeing natural wonder, or animal life and art.
Gee,Choy & Makens (1984:40) stated that" A significant amount of travel is motivated by
factors that do not relate to destination attributes per se, but rather are dependent on specific
objectives involving business, education, health, religion,politics, and personal and/or
family emergencies. The motivations for these types of travel usually can be more readily
pinpointed than motivations for pleasure travel".
25

However, Mcintosh and Goeldner (1986:124) state that "An important part of the
consideration of tourism psychology and motivation is the fact that a person usually travels
for more than one reason.For example, if a person goes to an area for health reasons, the
fact that a series of symphony concerts is bemg held at the same place during the time of the
visit acts as an attraction and a reinforcement to the decision to go".
Mill and Morrison (1985) mentioned the approach to understanding tourist motivation is
insufficient by developing a list of reasons why people travel. First, the tourists may be
unaware of the true reasons behind their travel behaviour and may not wish to divulge the
real reason or motivation behind a trip. A second reason is that the such lists are
insufficient to explain consumer motivations.
Mill and Morrision (1985:3) therefore stated that," The development of such lists is a
necessary first step towards establishing a classification system that will enable us an
understanding and uthnately predict the tourist's decision making process".
Mill (1990:42) also stated that "By understanding what makes people travel we can do a
better job of advertising to them to induce them to travel. Additionally, we can do a better
job of catering to their needs if we know what those needs are."
Thus, the approach of understanding why people travel is very important so that we can
identify and classify market segments by developing a marketing strategy. Basically, people
travel for pleasure and expereince to learn about other countries' namral beauty and
cultures.
" Why do people travel to get to something or away from something, when we can
identify the experience they seek, we'll have come a long way in motivating the
traveller." Cornell H.R.A Quarterly (1971:3)
26

2.4 PSYCHOGRAPHIC SEGMENTATION
DEFINITION OF PSYCHOGRAPHIC
In the Dictionary of Marketing Research, Van Minden (1987:136) defined psychographics
as "A description of groups that goes beyond personal data and includes, for example,
psychological characteristics (such as personality traits). The basic premise is that a group
may be described more adequately in terms of interests, level of aspiration or aggression
than by place of residence or size of community".
However,there are many schools of thought with regards to the defmition of
psychographics, especially with respect to marketing aspects.Some view it as lifestyle,
others view it as activity or attitude.Therefore, the defmition is diversified and thus, there is
a need to analyse a few defmitions to provide a clear understanding of the concept.
Gee et al (1984) stated that Psychographics is referred to as the lifestyle characteristics of
consumers. A person's buying behaviour is affected by his or her lifestyle. Although
people come from the same subculture, social class or even occupational group, they may
have different lifestyles.
Mill and Morrison (1985:64) stated thaf'Psychographics has developed as a way of
describing consumer behaviour in terms of a distinctive way of living in order to determine
whether or not people with distinctive lifestyle have distinctive tiravel behaviours.
Psychographics is the development of psychological profiles of consumers and
psychologically based measures of types of distinctive modes of living or lifestyles"
Well (1975) stated, that although there is a need for a common definition of
psychographics, unfortunately there is no single definition that meets with general approval.
The Wells study of twenty-four articles on psychographics contamed more than thirty-two
defmitions.
- ^
27

However, in this approach, psychographic definition is based on Wells (1975) which
defines it as a term applied to various research concepts that go beyond demographic
research in segmenting the total market. It all depends on the objectives of the researchers
as to what extent the dimension added to demographics is to be included in the activities,
interest, opinions, needs, values, attitudes and personality traits.
Wells' defmition is very significant and appropriate for this research . Wells (1975:197)
stated that "Operationally, the psychographic research can be defmed as quantitative
research intended to place consumers on psychological as distinguished from demographic
dimensions. Because it goes beyong the standard and the accepted, it offers the possibility
of new insights and unusual conclusions. Because it is quantitative rather than discursive, it
opens the way to large, representative samples of respondents and to multivariate statistical
analysis of fmdings."
28

2.5 APPLICATION OF PSYCHOGRAPHIC SEGMENTATION
The psychographics concept and application in the field of marketing has been widely
accepted. As Pearce (1978:15) stated "Plog suggests that a traveller is distributed normally
along a continum from psychocentrism to allocentrism".
Plog (1991:64) stated "self-inhibited, non-adventurous person as psychocentric, based on
"psyche" referring to the self, and "centric" meaning the centring of much one's though or
concerns on the small problems in daily life."
Thus, this group of people is not keen to explore new places. In theh travel behaviour they
prefer to visit familiar places whereas the opposite applies to allocentrics. In identifying
these two types of personalities the reason why tourists visit certain destinations is
illustrated. As a result, a marketing strategy can be developed within the tourism industry
so that it can increase tourism m Australia.
However, psychographic measurement of personality is administered through a
questionnaire instrument. Plog (1987:204) stated that "The only way to find out why they
choose different vacation lifestyles is to get inside their heads to determine what makes
them tick." Plog (1987:206) "The typical approach is to :
* Employ factor analysis to determme the primary factors (psychographics types);
* Clarify the cutting points between these factors by means of cluster analysis and/ or
discriminant fiinction analysis;
* Utilise regression statistics to determme which consumer behaviour can be predicted
by each psychographic personality characteristics and to what degree."
In 1973, Plog divided travellers into allocentric and psychocentric classifications and
worked on the psychographic segmentation of tourists. He suggested that tourists will seek
different travel experiences based on their selection of travel and places of interest. This
approach is useful in marketing research as it offers an understanding of consumers basic
motivation for travel and relates these to places of interest.
29

2.6 USES OF PSYCHOGRAPHIC SEGMENATION
Psychographic segmentation is very useful if it is correctiy administered in the research. It
is especially useful for the marketer m developmg theh marketing strategy to determine or
identify which is the potential segment in the market to mfluence or capture. It enables the v
marketer to plan their promotional activities to target that specific segment in the market.
Churchill (1987) stated that lifestyle or psychographic analysis can help plan effective
strategies to reach the target market if the customers are known in terms of how they live,
what mterests them and what they like. The idea is to identify a segment of the population
who are likely to behave similarly toward the product and who share the same lifestyle.
Lungberg (1980) stated that psychographic research can be used in various ways. It can be collected based on indepth interviews, focus groups, word association tests, projective techniques and other kinds of psychological testing methods, most of which are subject to investigation bias or the inherent unreliability of the technique or instrumnent used.
Therefore, the feeling and attitudes are qualitative. As a result, pleasure travel is associated
with emotions and attitudes and the market researcher must try to understand the mind set
of travellers so as to predict or influence pleasure travel. Well (1975) in his study on
psychographic profiles revealed that many studies had drawn from a large set of general
lifestyle items.
In his critical discussion on psychographics. Well classified four major categories;
reliability, validity, applications to real world marketing problems and contributions to the
study of consumer behaviour.
He stated such methods offer ways of describing consumers that have advantages. However,
the question of reliability and validity require more study as to this approach. Nevertheless,
it offers new ways of looking at old problems, new dimensions for charting trends and a
new vocabulary in which consumer typologies may be illustrated.
30

Weber (1989) stated that psychological research provided the marketing manager with
detailed profiles to assist in the visualisation of the market being sought.It seeks to
determine the consumers aspects as to why they travel when others
don't. In addition to determining how they think, what are their attimdes and values, what
type of place is of interest or desire to visit whilst on holiday.
Hawes (1977:7) selected the ten most used travel related statements from a recent
nationwide survey for analysis. In his fmdings he implied that "the use of innocuous, easy
to administer, fun to answer AIO (Activities,Interests, and Opinions) statements may be
able to substitute for more direct, prying questions dealmg with family expenditures for
travel and recreation."
Holloway (1988:100) stated that psychographic variables can be segmented. "Research by
the Irish Tourist Board has found that holidays in Ireland tend to meet the needs in
Maslows's terms. This knowledge can be used by those promoting holidays to Ireland, by
their emphasising Ireland as a destination for self-reflection and tranquillity."
Yuan and McDonald (1990) using the concept of "push" and "pull" factors examined the
motivations of overseas travelling. They examined four countries:Japan, France, West
Germany and the United Kingdom. The results showed a selection of tourist destinations to
differ among the countries. It indicated the level of importance of the individuals travelling
from each country to satisfy the same unmet needs (push factors) and attractions for
choosing a selected destination (pull factors).
Harssel (1988:150) stated "The push factors for a vacation emanate exclusively from within
the traveller. They are often a reaction to the living or workmg environment and are
related to the social and psychological conditions unique to a particular individual. The pull
factors for a vacation are aroused by the destination itself. Push motives help explain why
people develop the desire to go on vacation; pull motives help explain the choice of
destination".
31

Accordmg to Dann (1977) exammation of tourist motivations based on the concepts of "Push" and "Pull" factors has been generally accepted.
Abbey (1979) stated that the lifestyles approach has been used as a means to explain the
reasons behind consumer behaviour. In his smdies. Abbey suggests that lifestyle variables
provide tour designers with some additional information far superior to demographic
profiles in communicating tourist preferences to designers of tour packages.
Mieczkownski (1990:168) stated that "Psychographic research uses combinations of multitudes of variables in order to provide detailed profiles of submarkets for the marketers who are trying to reach their clients in a most efficient way. Thus, the researchers identify combinations or clusters of measurable interacting and integrated variables (not just a sum of them) to arrive at psychographic submarkets. These lifestyle groupings are being correlated with certain leisure time patterns which also constimte clusters of preferred activities."
Hudman and Hawkins (1989) used psychographics to identify market objectives in order to
develop research that would identify the most likely people to use a particular service or
product.
Markowitz (1980:147) "summarised the importance of studying psychographics of the
tourists: Research travel motivations and attitudes why people travel, what is important
to them, what they get out of the travel experience, can create the context in which specific
products or communication strategies of a hotel, an airline or simply providing what
consumers feel and how his attitudes are changing is crucial to an understanidng of the
marketplace."
Gladwell (1990) in his finding users of an Indiana State Park Inn found evidence to suggest
that vacation lifestyle measures used can be identified. As a result, three groups were
identified as the Knowledgeable Traveller, Budget Conscious traveller and Traveller
Planner.
32

Mayo (1975) used multidimensional scaling and psychographics to fmd out why some
tourists are attracted to National Parks. It was found that some psychographic
characteristics were used to determine tourist atti-actions of National Parks. These tourists
were illustrated as being advenmrous, action oriented individuals and impulsive. They were
interested in outdoor activities and like to escape fi-om people and crowds. They regard
themselves as opinion leaders who do not plan their vacation in any great detail. He has
identified and classified the following seven segments: The Adventurer, The planner. The
Impulsive Decision Maker, The Action Oriented Person, The Outdoor Man, The Escapist
and the Self Designated Opinion Leader, helping to describe the tourist who is mostiy
attracted to National Parks.
Sinclaire and Stabler (1991) stated that psychological and sociological analyses indicated a
valuable contribution to consumer motivation, choice and holiday behaviour. It also
attempts to establish how tourism images are formed and how these images influence
consumer choice, together with the constraints to which consumers are subject. This
knowledge provides helpful information to travel marketers for formulating marketing
programs.
Schul and Crompton (1983) in their exploratory smdy used a limited number of travel
specific psychographic statements and sociodemographic variables to predict and explain
behaviour for a sample of international vacationers. They found that behaviour was a better
tool to explain travel specifics than demographics. It was found that the travel specific
lifestyle approach was related to the length of time over which external search behaviour
occurred.
Using factor analysis in their approach, they were able to identify six psychographic travel
factors: "Cultural Interest", "Comfort" "Familiarity/Convenience", "Activity", "Opinion
Leadership" and "Knowledge Seeker". Based on their smdy, it was seen that
psychographics was a useful tool in market research.
33

/
Cohen (1972) identified a continuum of tourists broken mto four catergories; "The
Organised Mass Tourist", "The Individual Mass Tourist", "The Explorer" and "The
Drifter". His classification indicated that a tourist's psyhographics are strongly influenced
by his or her societal and cultural background.
Many schools of thought have also attempted to use psychographics in their research to
identify new market segments for their marketing strategy. Lundberg (1980:279) stated that
"A 1976 study funded by the Boeing Commercial Airline Company used the interview
technique and a "focus" group technique to identify four psychographic groups who travel
little and it was felt they could be introduced to travel."
This study is similar to the studies presented in the literature review.The validity of the
approach has been proven and adapted in the early studies by Schul and Crompton (1983).
Therefore the concept of psychographic segmentation of the Smgaporean traveller a can be
adapted from various other studies.
Leiper (1990:10) stated that "Psychological research into motivations has demonstrated that tourists are not homogeneous, but have different and overlapping needs and motivation. Sttidies by Crompton (1979), Phillip Pearce (1982), Stear (1984), Krippendorf (1987) and others, and a summary by Douglas Pearce (1987) support that claim."
Weber (1989) stated that Psychographics allow an indepth grasp of the psychological side of
tourists. Therefore psychographic segmentation was an analytical tool in the research for
describing and understanding tourists.
34

s/
CHAPTERS
RESEARCH METHODOLOGY
3.1 THE DEFINITION OF TOURISTS
A definition of Tourists must be established at the commencement of the research.
According to Leiper (1990):
"A tourist can be defmed, in behavioural terms, as a person travellmg away from their normal residential region for a temporary period, staying away at least one night but not permanently, to the extent that the behaviour involves a search for leisure experiences from interaction with feamres or environmental characteristics of the place(s) they choose to visit", (p. 10)
3.2 THE SAMPLE
The data was gathered in Singapore during February 1993 whilst the author was on Summer vacation. The major basis for selecting the respondents were:
Aged 16 and over; Having travelled abroad for vacation;
It was the intention of the author to interview only people who have visited Australia, but
the thrust of the stody changed after the questionnaire had been administerered and the need
for some of the questions changed.
For the purpose of this smdy, due to the limitations of the time frame, a sample of 120
people was chosen as it was identified in line with the definition of a tourist who had
travelled abroad during the previous twelve months. Moreover, due to the financial and
availability of human resources at the time of the survey implementation in Singapore, the
sample size was then restricted to 120 respondents. In addition, it was the intention of the
author to gather a larger sample of 400 people, unfortunately people were reluctant to
answer the questionnaire on the spot. Therefore, it may not be a full representation of the
population, but this finding will form an initial stage of the research in analysing
Singaporean tourists.
35

A sample of 120 individuals were identified who have travelled abroad. The sample was
identified by interviews at a busy shopping street known as Orchard Road. In addition,
interviews were also conducted m various Organisations with the help of the author's
friends to identify whether anyone had travelled abroad or visited Australia for vacation.
Of the 120 questionnaires delivered to respondents, only 101 were fully completed. The sample of 101 was chosen, as it was identified in line with the defmition of a tourists who have visit other countries.
36

3.3 THE QUESTIONNAIRE
The questionnau-e was developed after smdying similar questionnaires developed in this
area. Information was sought from previous research relating to psychographic
segmentation which was used as a guide in this study.
There were two parts to the survey, the fu-st, of which involved demographic data which
provided a descriptive profile of the respondent.The first section consisted of travel
characteristics such as length of stay. In addition, socio-economic and
demographic data such as Age, Education, Marital Stams, Information source and Annual
Total Income. A nominal scale was used to allocate a value to the description.
The second part of the survey was an abstract of sixteen psychographic statements borrowed
from Schul and Crompton (1983) who extracted than from Hat Associates (1978). It
illustrated their feelings about their travel preference in term of interests, activities and
attimdes towards travel.
The^l6 psychographic statements were found to be suitable for this research because it
provided an insight of a potential tourist. As illustrated earlier, Schul and Crompton (1983)
examined the sixteen psychographic statements to gain an understanding of the tourists
profile and provided an insight to the target market. Therefore, this smdy shared the same
scenerio where a Likert Scale was applied with five catergories ranging from " 1 = Strongly
Agree" to 5 = Strongly Disagree".
Therefore, it was the intention of the author to use the abstract to identify various segments
of the Singaporean tourists.
An extract of sixteen psychographic statements was inserted in the questionnaire to gather
information regarding the respondents specific lifestyle. It also addressed a variety of
topics concerning their interests, activities and opinions with respect to their vacation
experience.
37

In each case, respondents were asked to use a likert scale to indicate their preference
ranging from "strongly agree" to "strongly disagree". This enabled the author to perform
statistical analysis on the data.
3.4 PILOT STUDY
A pilot smdy was conducted among a group of eight respondents. Feedback was also
sought from the respondents. A result of the pilot study will analyse. It indicated that the
questionnaire was clear and understandable, however the main area of concern was the
question of annual total income which was considered a sensitive issue by the respondents.
As a result it might not be well received by the respondents.
3.5 PROCEDURE
The distribution of the questionnaire was done with the help of the authors friends in
Singapore.
However, prior to the interview, each of the three research assistants was carefully
instructed on how to conduct the survey and the importance of identifying people who had
travelled abroad.
The questiormaire was distributed by identifying the people who had travelled abroad
recently. If a respondent stated "No" to the question regarding overseas travel then he/she
was not interviewed. If the respondents stated "Yes" to this screening question then the
questionnaire was administered.
The research was conducted at a number of Corporate and Government Offices. In
addition, it was also conducted m the busy shopping street known as Orchard Road.
However, not many were willing to respond because many could not bothered to fill in the
questionnaire.
38

No doubt, there are a substantial number of people who had travelled abroad but most were
relunctant to answer the questionnaire on the spot. Therefore only 101 completed
questionnaires were collected.
3.6 VARIABLE IDENTIFICATION
Independent variables.
The independent variables were described as travel characteristics, ui term of as Marital
Status, Age, Education, Information Source and Annual Total Income per year.
Dependent variables.
The dependent variables were only five significant variables chosen based on the five
highest loading out of sixteen psychographic statements using Factor Analysis. The
variables were then tested for the correlation and hypothesis. In addition frequency tables
and graphs, the Mean and Standard Deviation will be presented.
Hair et al (1990) defmes Factor Analysis as one of the statistical techniques whose primary
objective is data reduction and summarization with a minimum loss of information in the
process of condensing the information. It was also used to analyse inter-relationships
among a large number of variables and explain these variables in terms of the factors.
The five significant variables were identified and segmented and a name was given to the
typology based on their travel psychographic characteristics.
Pearson Correlation analysis was applied to test the correlation.Sekaran Uma (1992:265)
stated "A Pearson correlation matrix will provide this information - that is, will indicate the
direction, strength, and significance of the bivariate relationships among the variables in the
smdy". These results are presented in the next chapter.
39

However, based on the variables and the analysis of the mean and one tailed test of standard
deviation that the results fall beyond the range of "Strong Agreed " = 1 and "Agreed" = 2.
An arbitrary decision was made to re-code the data in SAS and to perform hypothesis
testing. In addition,to determine this extreme value can be catergorised into "Strong
Agreed" and "Agreed" range in the Likert Scale,
Thus, a frequency table of five Typologies was created (see Appendix F;. A Chi-Square
Test of independence was performed. Accordmg to Turner (1988:113)" The chi-square test
will determine whether there is any significant difference between the observed sample
frequencies of a catergorised variable and those frequencies which could be expected
according to the null hypothesis."
However, based on the results, one would assume that the sample cell was found to be
small to perform a good test (see Appendix G). It was indicated in most of the cells the
"warning" signal and stated "Chi-square test may not be a valid test".
Hence, to overcome this limitation. Turner (1988) applied the Kolmogrov-Smirnov
technique.
Turner (1988:123) stated that " The Kolmogorov-Smimov technique is used to determined
whether or not the two samples have been drawn from either the same population, or
populations with the same distribution". Thus, using Chi-square Table, Kolmogorov-
Smimov sample Test was used for testing.
The Kolmogorov-Smimov Two Sample Test
Turner(1988:123)
"The Kolmogorov-Smimov test is sensitive to any difference in the distributions
from which the two samples were drawn. If the two samples come from the same
population, or populations with the same distmbution, both samples should generate
cumulative distributions which do not vary significantiy. Therefore, if the
cumulative distributions of the two samples are far apart at any point, this suggests the samples come from different populations."
40

Calculation of the two sample tests.
First, the variables were arranged for each data set into frequency tables with a cumulative
frequency using the same intervals. The second step was to find out the differences between
the two cumulative distributions for each interval. The third step is to determine the largest
of these differences and call the value 'D'.
The final step was to determine the statistical significance of 'D' where Nl and N2 are large
and one tail test was performed using Chi-square table of critical value of two degrees of
freedom where X^ is calculated by using the formula below: s '\
Formula: X2 = 4D2 ( Nl * N2)
(Nl -f- N2)
Based on the calculation the value was obtained. The obtamed value X^ was compared with
critical value to obtain the stams.
The Critical value X^ shows that at 95% significance, the critical value of 5.99 was applied.
Thus, if ( X2 - obtained valued) exceeds critical X^ , the null hypothesis was rejected.
41

CHAPTER 4
DATA FINDING AND ANALYSIS
4.1 DESCRIPTION OF DATA
With the aid of SAS, a statistical software system, the data was analysed. SAS is a software
system capable of performing many statistical analyses from simple descriptive statistics to
complex and operational research statistics.
A frequency table (see Appendix B)was created and summaries of demographic data are
listed in Table 5 and Figures 1 to 5.
42

TABLES Summary of Demographic Sample
CATEGORY FREQUENCY PERCENTAGE % CUMULATIVE % SEX Male Female
41 60
40.6 59.4
40.6 100
AGE Under 21 22-30 31 -40 40 & Over
8 35 45 13
7.9 34.7 44.6 12.9
7.9 42.6 87.1 100
MARITAL STATUS Smgle Married Married/Children
31 57 13
30.7 56.4 12.9
30.7 87.1 100
HIGHEST LEVEL OF EDUCATION Secondary Tertiary Vocational/Techni cal Other
46 41 2
11
45.5 40.6 2.0
10.9
46.5 87.1 89.1
100 ANNUAL TOTAL INCOME Below 15,000 (S$) 15,000 - 24,999 25,000 - 35,000 Over
16
24 23 36
15.8
23.8 22.8 35.6
17.8
41.6 64.4 100
43

FIGURE 1:
GENDER Although a gender balance in the survey was intended, the actual result indicated a slight bias towards the female population as indicated 59.4% as oppose to 40.6% male.
(40.6%) MaU
(J9 4%) F<mal«
FIGURE 2:
AGE As shown in the plot below, over 79% of survey respondents were aged between 22-40 years old. however, nearly 45% of the respondents were aged between 31 to 40 years old. It was also stated by the Australian Tourist commission (1983), that potential Singaporean travellers were aged 30 years and over as found in the Holiday Market Report, January 1983.
(J4.7%) 12 • JO
(44.6V.) J 1.40
(7.9V.)UnJ<f : i
(i:.9V.)J0i Over
44

FIGURE 3:
EDUCATION As illustrated in the diagram, education was considered an important factor in the travelline
T^^JTJ^ '"'^'"^^'^ ^^•°°''° ""^^^ ' ^ P ' ' ^ ' completed their Secondary education whil^ 41.0/0 had attained a Tertiary qualification.
SECONDARY (46.0K)
(41.0%)
TERTIARY
^ (11.0%) OTHER
(2.0%)
VOC/TECH
FIGURE 4:
MARITAL STATUS As illustrated in the charge below, the total sampl single and 56.4% being married. e consisted of 30.7% of the people being
(56 4V.) Married
(JO.7%) SnjJe
(l2.9%)Marrie*Child
45

FIGURE 5:
ANNUAL TOTAL E^COME LEVEL Annual total income level is another factor that needs to be considered in assessing the propensity to travel. It was found that 36.4% of the sample earned an income over S$36,000. Thus, it assumed that they belong to upper income level.
Another 23.2% earned between S$25,000 and S$35,000 per annum and this segment may be referred to as middle income, whilst 24.2% earned between S$ 15,000 to S$25,000 per annum.
(24.2V,) I J.OOO • 24.999
(23.2V.) 25.000. 35.000
(16 2%) Below 15.000 (SS)
(36.4V.) Over 36.000
46

TABLE 6
Means and Standard Deviations of Psychographic Statements (16 items) N-101
No.
1.
2.
3.
4.
5.
6.
7.
8.
9.
10.
11.
12.
13.
14.
15.
16.
Psychographic Statements
When I travel abroad, I prefer to be on a guided tour.
The nicest vacation is one viiiere I can just relax and do nothing.
When I go on vacation, I look for adventiire and an opportimity to escape from the ordinary.
The best vacations are those that have a lot of night life.
It is important that I stay at the best places when on vacation.
I prefer to visit countries that have old monuments and other historical buildings.
I always like to mix with the local people and experience the local customs.
I mostly like to visit places that my friends have visited before.
One of the best parts of travelling is to visit new cultures and a new way of life.
When I go on a trip. I prefer to arrange my own sightseeing schedule and accommodation.
Most of my friends come to me for advice on what foreign countries to visit.
I like to visit places where I've been able to learn things that help me in education and/or business.
I try to do many things when I'm on vacation.
I prefer to visit places where I can understand the language.
It is important that there are plenty of things to entertain my children.
I prefer to visit places with a large variety of activities and sights.
Means
3.17
2.60
Q2 .03
3.26
2.79
2.69
0 2.16
3.31
0 '•''
2.51
2.98
^ 2 . 4 2
3.13
2.52
3.07
^ 2.03
S.D.
1.13
1.13
0.96
1.12
1.05
0.98
0.81
0.94
0.82
1.05
0.94
0.92
1.18
1.01
1.05
1.00
' /VV'
I'efi^f-^^ -5t>=
• ' . • r > '. '
% ucter
- ^ - / f ( I f *^
^,•t
47

4.2 FACTOR ANALYSIS DATA ANALYSIS OF PSYCHOGRAPHIC STATEMENTS
The psychographic statements were analysed and the Means as well as Standard Deviations were calculated and are listed in Table.6.
McClave and Benson (1981:39) defmed " The mean of a set of quantitative data is equal to
the sum of the measurements divided by the number of measurements contained in the data set."
The Mean of the sixteen individual psychographic statements was calculated and presented
in Table 6. It was found that five Questions 3^ 7, 9, J 2 & 16) out of the sixteen
psychographic statements showed a favourable response. Because the Means were
indicated less than 2.5 and close to 1 (which was defined 1 = strongly agree and 2 = J^^
agree). On the other hand, there were eleven responses (Questions
1,2,4,5,6,8,10,11,13,14,15) shown unfavourable as the Means illustrated more than 2.5 to
5 (3 = indifferent and 4 = disagree and 5 = strongly disagree).
In plotting this result, normal distribution curve was drawn. It was also assumed that the
respoiisg- taJhe sixteen psychographic statements were normally distributed.
Lapin (1991:68) defmed " The Normal Distribution applied to continous random variables,
such as times, weights and diameters measured on a continous scale. It is usually described
in terms of a bell shaped curves."
Shim et al (1986:220) defined that "The standard deviation measures the extent to which
data spread out or disperse." In analysing the standard deviation of the 16 psychographic
statements it was found that the response to the questionaire had a wide dispersion with a
range of 0,9^ to L13. However, a factor analysis was performed to determine the finding.
48

4.3 CHI-SQUARE TEST ANALYSIS
A Chi-square test was performed, (see Appendix G).
The resultsof the Chi-square test on the five typologies are illustrated in Table 11.
The result of this test was to determine whether or not the variables are related. Sekaran
(1992) stated that m general a significant of p< .05 was accepted conditional level in social
science research. Thus, in examining the data, it was found that Factor 5, "Sophisticated"
was significant with a score of 0.030 (see Appendix E). The rest of the variables were
considered insignificant as the variables failed to qualify the significance level of p< .05.
TABLE 7 Factor 1 - Explorer
CATEGORY Sex Age Maritial Status Education Aimual Total Income Source of Information
HEAVY 82 82 82 82 82
82
LIGHT 19 19 19 19 19
19
CHI-SQUARE PROB. 0.712 0.190 0.380 0.365 0.439
0.529
49

Factor 2 - Organised Tourists CATEGORY
Sex Age Maritial Stams Education Aimual Total Income Source of
1 Information
HEAVY 30 30 30 30 30
30
LIGHT 71 71 71 71 71
71
CHI-SQUARE PROB. 1 0.211 0.562 0.297 0.187 0.626
0.681
Factor 3 - Active Tourist CATEGORY
Sex Age Maritial Status Education Annual Total Income Source of Information
HEAVY 29 29 29 29 29
29
LIGHT 72 72 72 72 72
72
CHI-SQUARE PROB. 0.214 0.450 0.116 0.742 0.236
0.894
Factor 4 - Pleasure Seeker CATEGORY
Sex Age Maritial Status Education Annual Total Income Source of Information
HEAVY 20 20 20 20 20
20
LIGHT 81 81 81 81 81
81
CHI-SQUARE PROB. 0.143 0.556 0.688 0.891 0.124
0.252
50

CATEGORY Sex Age Maritial Status Education Annual Total Income Source of Information
Factor 5 - Sophisticated Seeker HEAVY
26 26 26 26 26
26
LIGHT 75 75 75 75 75
75
CHI-SQUARE PROB. t 0.039 0.810 0.842 0.736 0.390
0.105
However, the SAS indicated a warning signal mdicatmg Chi-square may not be a valid test.
It is essential to present the result as it is appropriate in explaining the use of Kolmogorov
Smirnov technique for data analysis. Thus, to overcome this problem Kolmogorov Smimov
technique was applied according to Tumer (1988). The calculations are attached m
Appendix H.
51

4.4 DATA ANALYSIS OF THE HYPOTHESIS TESTING
Based on the market segmentation studies of the tourism industry, the following assumptions have to made in this smdy;
* Due to the different demographic and psychographic characteristics of tourists,
theh needs and demands will vary accordingly.
* Tourists come from a heterogenous population.
* A market segmentation can be developed and identified based on similar
characteristics.
With these abovestated assumptions, five factors were formulated to test the hypthoses so as to determine the correlation between the social demographic data in terms of high and low loading on psychographic profile. As a result, a market segmentation perspective can be developed to target this type of market segment which illustrated the potential traveller. In addition, it was also attempted to identify any special characteristics evolved in this factor (typologies). Simultaneously, to examine are there any differences among each factor which the tourists are segmented.Thus, the Kohnogorov Smimov goodness-of-fit test was employed.
Sheskin (1984:47) stated that "The Kolmogorov Smimov goodness-of-fit test evaluates an
observed culmulative frequency distribution in relation to a hypothesized theoretical
cumulative frequency distribution".
Tumer (1988) stated that generally as a convention, 95% Significance or the level of
confidence level is acceptable, which is shown on a normal distribution as a z score of -I-
1.96. ^
52

Thus, critical value of 5.99^as used as a yard stick for measurement because it represented 95% confidence level ."' "'
FACTOR 1 - EXPLORER
Hypothesis 1
Ho: There is no difference between the socio-demographic based on "Sex", "Age", "Marital Status", "Education", "Annual Total Income" and "Information Source" profile in terms of high and low loading on psychographic profile of the Explorer.
H : That there is a difference. I
Based on Kolmogorov Smunov, it was found that there was no significant relationship (see Table below).
CATEGORY
Sex Age Marital Status Education Annual Total Income Information Source
X2 CRITICAL VALUE
5.99 5.99 5.99 5.99 5.99
5.99
X2 VALUE OBTAINED
0.13 1.69
> 0.87 > 1.32 y 1.84
> 0.96
STATUS
Accept Null Hypothesis Accept Null Hypothesis Accept Null Hypothesis Accept Null Hypothesis Accept Null Hypothesis
Accept Null Hypothesis
Thus, we conclude there is no relationship because the critical value, 5.99 is more than the obtained value. Therefore, null hypothesis was accepted.
53
FACTOR 2 - ORGANISED TOURISTS
Hypothesis
Ho: There is no difference between the socio-demographic based on "Sex", "Age", "Marital Status", "Education", "Annual Total Income" and "Information Source" profile in terms of high and low loading on psychographic profile of the Organised Tourists.
H : That there is a difference. I
54

Based on Kolmogorov Smirnov, it was found that there was no significant relationship (see
Table below).
CATEGORY
Sex Age Marital Status Education Annual Total Income Information Source
X2 CRITICAL VALUE
5.99 5.99 5.99 5.99 5.99
5.99
X2 VALUE OBTAINED
1.51 0.86 1.95 1.37 1.43
0.27
STATUS
Accept Null Hypothesis Accept Null Hypothesis Accept Null Hypothesis Accept Null Hypothesis Accept Null Hypothesis
Accept Null Hypothesis
Thus, we conclude there is no relationship because the critical value, 5.99 is more than the
obtamed value. Therefore, null hypothesis was accepted.
FACTOR 3 -ACTIVE TOURISTS
Hypothesis
Ho: There is no difference between the socio-demographic based on "Sex", "Age", "Marital Status", "Education", "Annual Total Income" and "Information Source" profile in terms of high and low loading on psychographic profile of the Active Tourists.
H That there is a difference.
55

Based on Kolmogorov Smimov, it was found that there was no significant relationship (see Table below).
CATEGORY
Sex Age Marital Stams Education Annual Total Income Information Source
X2 CRITICAL VALUE
5.99 5.99 5.99 5.99 5.99
5.99
X2 VALUE OBTAINED
1.48 2.58 3.25 0.12 2.82
0.61
STATUS
Accept Null Hypothesis Accept Null Hypothesis Accept Null Hypothesis Accept Null Hypothesis Accept Null Hypothesis
Accept Null Hypothesis
Thus, we conclude there is no relationship because the critical value, 5.99 is more than the
obtained value. Therefore, null hypothesis was accepted.
FACTOR 4 - PLEASURE SEEKER
Hypothesis
Ho: There is no difference between the socio-demographic based on "Sex", "Age", "Marital Status", "Education", "Annual Total Income" and "Information Source" profile in terms of high and low loading on psychographic profile of the Pleasure Seeker.
H That there is a difference.
56

Based on Kolmogorov Smimov, it was found that there was no significant relationship (see Table below).
CATEGORY
Sex Age Marital Stams Education Annual Total Income Information Source
X2 CRITICAL VALUE
5.99 5.99 5.99 5.99 5.99
5.99
X2 VALUE OBTAEVED
2.06 0.61 0.32 0.09 2.61
1.56
STATUS
Accept Null Hypothesis Accept Null Hypothesis 1 Accept Null Hypothesis 1 Accept Null Hypothesis Accept Null Hypothesis
Accept Null Hypothesis |
Thus, we conclude there is no relationship because the critical value, 5.99 is more than the
obtained value. Therefore, null hypothesis was accepted.
FACTOR 5 - SOPHISTICATE SEEKER
Hypothesis
Ho: There is no difference between the socio-demographic based on "Sex", "Age", "Marital Status", "Education", "Annual Total Income" and "Information Source" profile in terms of high and low loading on psychographic profile of the Sophisticated Seeker.
H That there is a difference.
57

Based on Kolmogorov Smimov, it was found that there was no significant relationship (see Table below).
CATEGORY
Sex Age Marital Status Education Annual Total Income Information Source
X CRITICAL VALUE
5.99 5.99 5.99 5.99 5.99
5.99
X2 VALUE OBTAINED
4.09 0.37 0.25 0.79 0.46
2.91
STATUS
Accept Null Hypothesis Accept Null Hypothesis Accept Null Hypothesis Accept Null Hypothesis Accept Null Hypothesis
Accept Null Hypothesis
Thus, we conclude there is no relationship because the critical value, 5.99 is more than the
obtained value. Therefore, null hypothesis was accepted.
CONCLUSION OF THE FINDING
In conclusion, it states that Demographic data in terms of Sex, Age, Marital Stams,
Education and Information Source as illustrate in the fmding were found to be insignificant
with regard to hypothesis testing. These variables were not found to be an effective way of
delineating the market segment.
On the other hand, using Psychographic statements provided a good tool in smdymg the
profile of the Singaporean tourists where five typologies was mapped out. These were as
follows:
Factor 1: Factor 2:
Factor 3:
Factor 4:
Factor 5:
"Explorer" " Organised Tourist"
"Active Tourist"
"Pleasure Seeker" and
"Sophisticated Seeker"
58

As a result, it provided the market planner to identify the difference in the market segment.
A marketing strategy can be developed and targeted to the right market segment of
Singaporean tourists going abroad for vacation.
Based on the hypothesis testing, it can conclude that there was no relationship between
psychographic and demographic data.
59

CHAPTERS
DISCUSSION
FACTOR ANALYSIS :PSYCHOGRAPHIC SEGMENTATION
After examining the means and standard deviations of the sample, factor analysis was performed. One needs to defme the_concept of factor analysis so as to provide a clear understanding of the fmding.
Han:, Anderson and Tatham (1990:235) defme "Factor analysis is a generic name given to class of multivariate statistical methods whose prunary purpose is data reduction and summarisation."
Kass and Tinsley (1979) regard factor analysis as a mathematical technique to allow the
reduction of a large number of interrelated variables to a smaller number of factors. The
main objective was to attain scientific parsimony or an economy of description.
Lewis (1984:67) stated "Its prunary purpose is to gather this large set of variables mto more
or less homogeneous composites of all the important variables in the larger set, so that each
composite variable becomes the surrogate for a number of other variables. The operating
principle is that a number oryariables really mean the same thing to a respondent along one ,
underlying dimension."
In applymg this approach, the data analysis,is considered one of the statistical techniques
where the primary objective is data reduction and summarisation with a minimum loss of
i^rmation in the process of condensing the information. It is also used to analyse the
inter-relationships among a large number of variables and explain these variables in terms
of ^e^ factors.
Eigenvalue is described as the amount of variance accounted for in a factor. It is calculated
as the sum of squares for a factor. It can also be used to determine the number of factors to
extract. For example a latent root criterion considers factors with an eigenvalue greater
than one to be significant.
60
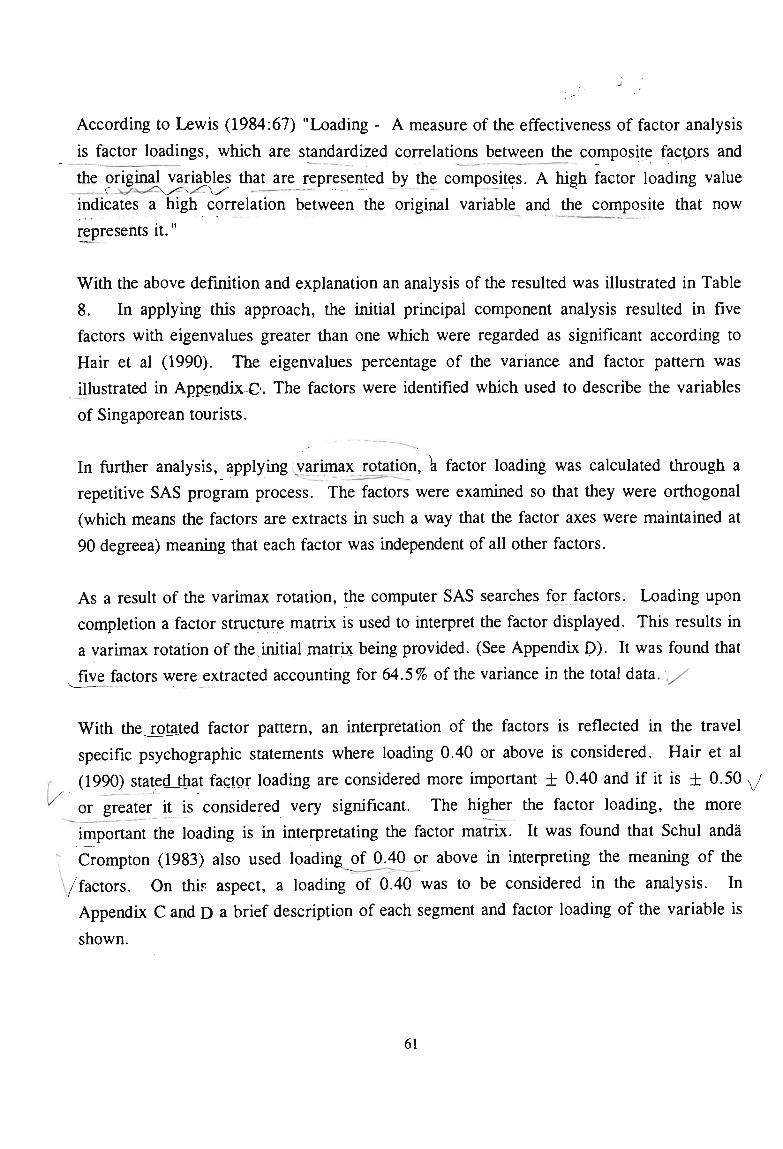
According to Lewis (1984:67) "Loading - A measure of the effectiveness of factor analysis
is factor loadings, which are standardized correlations between the composite factors and
the original variables that are represented by the composites. A high factor loading value
indicates a high correlation between the origmal variable and the composite that now
represents it."
With the above defmition and explanation an analysis of the resulted was illustrated in Table
8. In applying this approach, the mitial prmcipal component analysis resulted in five
factors with eigenvalues greater than one which were regarded as significant according to
Hair et al (1990). The eigenvalues percentage of the variance and factor pattem was
illustrated in Appendix^G'. The factors were identified which used to describe the variables
of Singaporean tourists.
In further analysis, apply mg vvarimax ration, \ factor loading was calculated through a
repetitive SAS program process. The factors were examined so that they were orthogonal
(which means the factors are extracts in such a way that the factor axes were maintained at
90 degreea) meaning that each factor was independent of all other factors.
As a result of the varimax rotation, the computer SAS searches for factors. Loading upon
completion a factor strucmre matrix is used to interpret the factor displayed. This results in
a varimax rotation of the initial matrix being provided. (See Appendix D). It was found that
five factors were extracted accountmg for 64.5% of the variance in the total data, .y
With the jotated factor pattern, an mterpretation of the factors is reflected in the travel
specific psychographic statements where loading 0.40 or above is considered. Hair et al
(1990) statedjthat factor loading are considered more important ±0.40 and if it is ± 0.50
or greater it is considered very significant. The higher the factor loading, the more
important the loading is in interpretating the factor matrix. It was found that Schul anda
Crompton (1983) also used loading^£^^40^r above m interpreting the meanmg of the
factors. On thir aspect, a loading of 0.40 was to be considered in the analysis. In
Appendix C and D a brief description of each segment and factor loading of tiie variable is
shown.
61

Thus, based on a principal components factor analysis with varimax rotatioiLapplied, five
segments were mapped out. This was based on the sixteen psychographic statements of the
characteristics of travel specific lifestyle. The five factors were described as "Explorer",
"Organised Tourists", "Active Tourists", "Pleasure Seeker" and "Sophisticated seeker",
(see illustration on Table 8).
Based on this Typologies, the characteristics of Singapore tourists were segmented. The
attimde and preferences for travelling abroad was indicated in this typology for providing
an insight into this smdy.
62

TABLES A Brief Description of the Psychographic Segments
FACTOR LOADING FACTOR 1 - EXPLORER New Culture O) Leara New Things -Experience Local Customs
.86593
.58846
.55122 FACTOR 2 - ORGANISED TOURISTS Peference for Guided Tour / / Entertainment for Children Advice to Friends > ^ Planning own Schedule
.85966
.59795 - . 54623i - .67336 1
FACTOR 3 - ACTIVE TOURISTS | Do Many Things / Understand Language "^ Adventurous & Escape the Ordinary /
.80081
.66135
.44557 FACTOR 4 - PLEASURE SEEKER Friends Visited Before 2 Relaxation / Best Places
.79528
.68674
.51960 FACTOR 5 - SOPHISTICATED SEEKER Night Life " ^ Variety of Activities xX Historical Monument
.68335
.46521 - .63792
63

FACTOR 1 - EXPLORER
As illustrated on Table 8, factor analysis has identified variables 9, 7 and 12 as factors which were mapped out bemg identified as "Explorer" with salient loading of 86.59% on Variable 9 which was " One of the best part of travellmg is to vish new culmres and a new way of life."
"Explorer" means that tourists like to experience new culmre, leam new things and experience local customs in the host countries.
Thus, it was suggested that Factor 1 people (Singaporean tourists) like to explore new
things and experience local customs. For example. The Australian Aboriginal way of life. It
serves as a motivation factor for Singapore tourists to travel to Australia.
Leone 1993 (ed.) states that new research studies conducted by the Australian Tourist's
Commission (ATC) on the attitudes and perceptions of potential middle and long haul
holiday travellers in Japan, Hong Kong, Indonesia, Korea, Malaysia, Taiwan, Thailand and
Singapore as well as other countries show that Asians, once visited Australia for fun in the
sun and its glamorous images of cities and are now changing their pattem of interest. They
now visit Australia for its different cultures and its open environment. This factor captures
the increasing interest of Smgaporeans interested in exploring new culture in Australia.
According to Mcintosh and Goeldner (1986:183-193), Cohen Literature "Toward A
Sociology of Intemational Tourism" in 1972 have classified these segments of the typology
as "The Explorer". "This type of tourist arranges his trip alone; he tries to get off the
beaten track as much as possible, but he nevertheless looks for comfortable accommodation
and to speak their language. The explorer dares to leave his "environmental bubble" much
more than the previous two types, but he is still careful toa be able to step back into it when
the going becomes too rough. Though novelty dominates, the tourist does not unmerse
himself completely in his host society, but retains some of the basic routines and comforts
of his native way of life."
Thus, The Explorer by Cohen and Explorer here share similar typologies. Basically, the
tourists looking for advenmre and escape from their normal daily life.
64

FACTOR 2 - ORGANISED TOURISTS
The second factor, identified as "Organised Tourists" also scored a high loading of .85966
in Variable 1, which was "When I travel abroad, I prefer to be on a guided tour. It was
identified that the traveller in this segment preferred to use a guided tour and was concemed
about entertainment for their children. One would assume that they were not confident in
travelling alone. Thomas (1987:26) stated "Comparatively few Singaporeans acmally travel
alone. The vast majority move as a family group or with a party of colleagues from work.
Thus, the package is the ideal way for them to travel."
It also mdicated that travellers in this pool were not advenmrous but safety conscious while travelling abroad. Thomas (1989) stated that Singaporeans were notoriously safety conscious and perceive destinations like Australia and New Zealand as non-threatening. They did not like to plan their schedule or give advice to friends in regard to place of destinations. These fmdings were mdicated by a negative value in the loading.
One would assume they expected tour operators to plan and organise for them and they also
did not like to give advice to friends on what foreign countries to visit because different
people have different expectations and perceptions of destinations. Thus, they did not want
to be blamed if the vacation mmed out far from their expectations. As the saying goes "
Beauty lies in the eye of the beholder" .
Mcintosh and Goeldner (1986:185) stated that Cohen (1972) m his study regard this group
of tourists as "The Organised Mass Tourist" in his typology. He described "The organised
mass tourists is the least adventurous tourists and remains largely confmed to his
"environmental bubble" throughout his trip.The guide tour, conducted in an air-conditioned
bus, travelling at high speed through a steaming countryside, represents the prototype ofa
the organised mass tourist. This tourist type buys a package tour as if it were just another
commodity in the modem mass market. The itinerary of his trip is fixed in advance, and all
his stops are well-prepared and guided; he makes almost no decisions for himself and stays
almost exclusively in the microenvironment of his country. Familiarity is at a maximum,
novelty at a minimum."
Thus, these factors share similar characteristics with the Cohen (1972) typology.
65

This typology suggests that there was a pool of Singaporeans who still prefer to go on a
guided tour when they go on vacation.Thus, one would assume that they were very "safety
conscious" when travelling abroad and not confident enough to travel alone. As a result,
this indicates to the Tourism Industry that any publicity regarding a dangerous destination
will deter this group of Singaporean tourists fi-om visiting Australia because they were very
sensitive to the environment in choosing a destination.
In addition. Tour Operators can design tour packages ,that are compatible with these attimdes and preferences for vacation.
FACTOR 3 - ACTIVE TOURISTS
Variable 3, 13 and 14 were identified as Active Tourist. These variables seem to suggest
that the tourist, when on vacation preferred to visit places where they could understand the
host language and looked for adventure and escape from the ordinary.
The traveller in Factor 3 preferred to do as many things as possible during their vacation. They preferred to visit places with a large variety of activities and subjects and as a result, they felt satisfied in what they had achieved during their vacation. This can be explained due to the social behavioural trait known as "Kiasusim" in local context.
Bremer (1988:44) stated that "Kiasuism may be defmed as an attimde by which a person
undergoes, on the one hand, extreme disquiet if he discovers that has not got full value for
his expenditure of money, time and effort, and on the other, a distmct sense of exhilaration
if he discovers that he has got much more than the full value for that expenditure. The
ultimate distress is when he has got nothing for something, and the ultimate joy when he has
got something for nothing."
There are various manifestations of Kiasuism. An example can be illustrated why they try to
do many things when they are on vacation. For instance Bremer (1988:49) states that "The
Singaporean on tour provides an extremely interesting case study. Having paid a large sum
of money for the tour, the Singaporean makes sure that he gets his every cent's worth, right
from the moment he boards the plane to the moment he sets foot back on Smgapore soil.
66

He carries his pocket calculator with him to satisfy himself that tiie fo(xl, accommodation,
facilities, entertainment, free gifts, etc., which form the tour package are exactiy accounted
for." Thus, this can be seen as an explaination why they try to do many things when they
go on vacation.
According to Tan (1990), Peter Choo, Managing Director of Scenic Traveller observation,
on Singaporean tourists cited that Singaporean found it was boring if they went on vacation
havmg nothing to do even if it was only three days.
However, the Factor 3 people, suggested that they were active but not very advenmrous and
seek to escape from the ordinary life. Its reflected familiarity was still the key elements m
seeking many activies.
Thus, an understanding of this profile of Singaporean tourists enables the marketer to design travel products to cater for this segment of "Kiasu" tourists. As a result, the design of the travel products must include more social activities like sight seeing, shopping, cultural activities and package tours. In this way it can cater for this segment of "Kiasu" tourists who prefer to do many things whilst on vacation.
FACTOR 4 - PLEASURE SEEKERS
Variable 2, 5 and 8 were identified as "Pleasure Seeker". The Factor 4 traveller preferreda
to visit places based on information from friends on where they have visited. One would
assume that this group is travelling for vacation as a stams symbol.
Accordmg to Tan (1990), a most recent survey conducted by Frank Small Research found
that in general Singaporeans perceived holiday travel as a status symbol.This group of
travellers were keen to share their experiences and show photographs taken on their
vacations with their friends.
In addition,they preferred to relax and stay at the best place during vacation. Thomas (1989)
stated that Singaporean tourists were notoriously safety conscious travellers, even when
they were not travellmg with family. This indicates why they tend to visit places that
friends have already visited. Moreover, they showed a preference for relaxation and
preferred to stay in the best accommodation when on vacation. This could be due to the
stressful lifestyle.
67

Ooi (1992) conmiented that Singaporeans seeking a respite from the pressures of city life
would continue to take short vacations. This would explain why, when on vacation they
preferred to relax and stay at the best accommodation, enjoying their vacation to the fullest.
One would assume, they tried to pursue a sophisticated lifestyle.
This typology of the Singaporean tourist can be regarded as seeking pleasure in travelling
by following the foot steps of their friends. They would not venmre into a joumey to a
new destinations if none of their associates or friends had visited beforehand. One can
assume that these people know what to expect when travelling to a destination based on
their friends information.
Thus, it is important that Singaporean tourists to Australia have a wonderful experience in
Australia so that they promote it when they retum home. As the saying goes " It only takes
one rotten apple to mm the barrel".
68

FACTOR 5 - SOPHISTICATED SEEKER
Variables 4, 6 and 16 were identified as "Sophisticated Seeker".
It was identified that the travellers in this segment showed preference for night life as the best vacation. They preferred to visit places with a variety of activities. However, they did not like to visit countries that have old monuments and other historical building. As shown by the factor loadings being negative for these elements.
However, night life was regarded as an important aspect for Factor 5 tourists who preferred night life activities includmg casino, dancing, eating, visiting musical/opera, concert and movies. These clearly suggest that the tourist was strongly attracted to a variety of activities whilst on vacation.
Oliver and Chan (1989) stated that based on their research smdy on Hong Kong as a travel
destmation in South-East Asia: A Mutidimensional Approach revealed that entertainments
and attractions were regarded as the most important factors leading to tourists satisfaction
for Singapore tourists.
Thus, the "Sophisticate Seeker" illustrated that there was a pool of Singaporean tourists
seeking preference for such activites when on vacation.
This typology suggested that Singaporean tourists were very sophisticated in regard to
social activities in their life-style when they go on vacation. This Sophisticated Seeker
shows a preference for night activities in term of night shoppmg, casino gambling, concerts
and other night life. Thus, each seeks their own activities. As the saying goes " To each
its own" and "One mans meat is another mans poison".
69
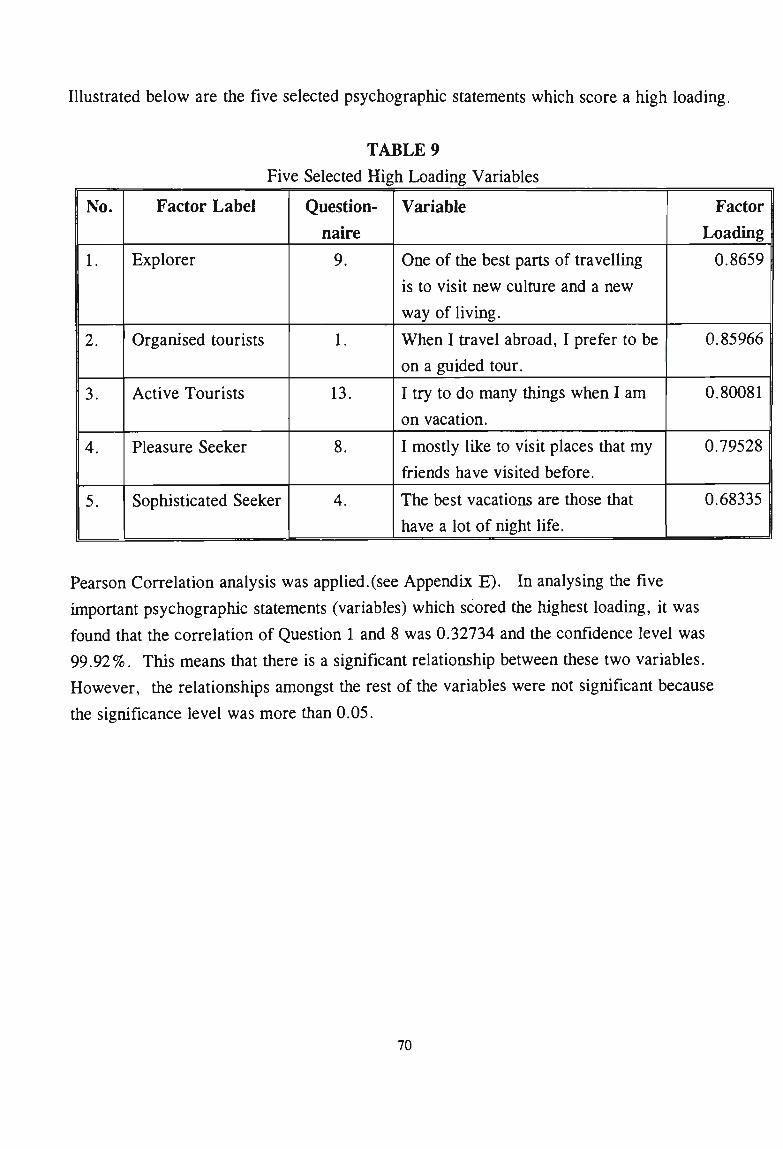
Illustrated below are the five selected psychographic statements which score a high loading.
TABLE 9 Five Selected High Loading Variables
No.
1.
2.
3.
4.
5.
Factor Label
Explorer
Organised tourists
Active Tourists
Pleasure Seeker
Sophisticated Seeker
Questionnaire
9.
1.
13.
8.
4.
Variable
One of the best parts of travelling
is to visit new culmre and a new
way of living.
When I travel abroad, I prefer to be
on a guided tour.
I try to do many things when I am
on vacation.
I mostly like to visit places that my
friends have visited before.
The best vacations are those that
have a lot of night life.
Factor Loading
0.8659
0.85966
0.80081
0.79528
0.68335
Pearson Correlation analysis was applied.(see Appendix E). In analysing the five
important psychographic statements (variables) which scored the highest loading, it was
found that the correlation of Question 1 and 8 was 0.32734 and the confidence level was
99.92%. This means that there is a significant relationship between these two variables.
However, the relationships amongst the rest of the variables were not significant because
the significance level was more than 0.05.
70

Therefore statement 1 : "When I travel abroad, I prefer to be on a guided tour" shares
similar characteristics with statement 8, " I mostly like to visit places that my friends have
visited before me." Both indicated travellers who are not adventurous and are very safety
conscious wishing to ensure that the destination is safe.
Tumer and Ash (1975:284) stated that "Holidays will be seen as status symbols rather than
as chances to improve one's understanding of new cultures. They will still feel unsure of
themselves and will thus play safe, sticking to established tourist centres, rather than
spreading out into more adventuresome area."
On the other hand, the three high loading variable: 9, 8 and 4 were:
Variable 9: One of the best parts of travelling is to visit new culture and a new way of living.
Variable 8: I try to do many things when I'm on vacation.
Variable 4: The best vacations are those that have alot of night life.
and have shown no correlationship at all. Each factor established an independent fmding of
its own. They show different preferences, from one to another in motivation for travel.
Based on the variables and the analysis of the mean and one tailed test of standard deviation
that the results fall beyond the range of "strongly agree" = 1 and "agree" = 2. However,
an arbitrary decision was made to recode the data in SAS and to perform hypothesis testing.
A frequency table (see Table 10) of five typologies was created. In addition, to determine
this extreme value can be categorised into "strongly agree" and "agree" range in the Likert
Scale.
71

Thus, where it was defined "strongly agree" = 1 and "agree" = 2 was classified under
"heavy" in the terminology. Neither "disagree and agree" = 3, "disagree" = 4, "strongly
disagree" = 5 was classified as "light". A description of "heavy" and "light" terminology
was used, where a frequency table was generated.
Hypothesis testing was applied to see any difference in the demographic profiles of these visitors. Thus, the Chi-Square test was applied with regard to the 5 factors that fitted into the demographic profile. The result is reported below:
TABLE 10 Frequency Table of Five Factor (Typology)
FACTOR (VARIABLE)
Explorer Organised Tourist Active Tourist Pleasure Seeker Sophisticated Seeker
HEAVY %
81.2 29.7 28.7 19.8 25.7
LIGHT %
18.8 70.3 71.3 80.2 74.3
1
Based on the frequency table, 81.2% of the population showed a favourable respond in term
of Explorer. On the other hand, the majority of the population mdicated "Light" in term of
Organised Tourist, Active Tourist, Pleasure Seeker and Sophisticate Seeker as illustrated in
the above table.
In conclusion, as presented in our results, it indicated that the demographic data, showed
weak or no relationships.Thus, it indicated that more activities need to be created to cater
for this pool of tourists. Therefore, one would conclude that the relationship between the
five factors were not significant as predictorsa of Singaporean tourists travelling abroad for
vacation. However, m terms of demographic data it is useful and important in examining
the market segment in terms of education, income and gender which also effects tourism.
These factors illusfrate the importance of tourism research. The use of psychographic
segmentation provides a more meaningful and significant result.
72

Therefore, as presented in the discussion, marketing strategies for development of the
travel services or product will enhance the Australian market as a tourist destination for
these segments of Singaporean tourists to Australia. In addition, it is important to
understand the profile of Singaporean tourists and how they choose their holiday
destination. It is essential that marketers in the tourism industry develop strategies that
position then: product in the most favourable perspective. Woodside and Pitts (1976:15)
stated that "Lifestyle research may offer particular useful findings for developing travel
products.for example package tours and theme parks."
The Australian Tourist Commission (ATC) has already focused on three key segment
groups - Culmral Discovery, City Glamor and Fun in the sun - to overcome an image
problem, because Australia was perceived as expensive,bland or boring even racist.In this
way the ATC hopes to capture a bigger segment of tourists from Asia.
The latest advertising campaign in Asia is known as "Australia: the Feeling is Magic". Its focus is on different holiday experiences and the ATC hopes that the aggressive marketing approach will pay off ensuring a steady growth in tourism.
LEMITATIONS OF THE STUDY
In this study, psychographic segmentation were explored in the Singapore toursit market
with subject to several limitations, however, the main objective is to identify potential
traveller to Australia.
Firstiy, due to the research being conducted for this thesis, the sampling timeframe was a
major limitation. Due to the lack of financial and human resources at the time of survey
implementation , the sample size was then restricted to 120 respondents.
Singaporeans participating in this study was required to complete the survey on the spot
(shopping mall) were reluctant to do so. As a result, a number of Singaporeans were
reluctant to participate. Consequently, the data collected may not be a traly representative
of the entire population.
73

CHAPTER 6
CONCLUSION
In conclusion, this study forms an intitial stage in the research and the author believes there
is much scope for more work. However, based on the fmding it will illustrate the
significance of the research and make recommendation to the finding.
The analysis of the result, it has identified five market segments of Singaporean tourists. It
provides an insight of Singaporean tourists in determining their preference when going on
vacation. It also illustrates the travellers characteristics of the objectives for going on
vacation and what expectations they desire.
Thus, it suggests some implication that in the travel industry there is a pool of potential
tourists from Singapore that term under the five segments. These market segments are as
follows: "Explorer", "Organised Tourist", "Active Tourist", "Pleasure Seeker" and
"Sophisticated Seeker". With these five identified segments, Australia has the resource and
attractions to offer to these segments of tourists from Singapore.
Therefore, the key to success in the maketing strategy is to gain an insight of what
Singaporean tourists perceive for a tourist destination when they go on vacation. The host
country in tum can develop the marketmg plan to communicate the tourist product to the
potential Singaporean tourist by promoting to the right segment, because different products
are targeted at different audiences. This can be achieved by creating awareness
programmes, advertising, trade shows, brochuring and stress the importance of creating an
image to the right segment. As a result the key component is to generate the interest that
motivates Singaporean tourists to Australia.
In using psychographic segmentation study, it is important to understand the potential
tourist from Singapore going on vacation. Based on hypothesis testing, psychographic
statements and demographic data shows no significant co-relationship, but demographic is
still a vital tool in the research work. Demographic data is still considered a major criteria
in determining potential tourists in the tourism mdustry because it provided the
characteristics of the tourists which can be used for market segmentation.
74

Thus, with the growing interest of Singaporean tourists visiting Australia the growth for tiiis market will continue to increase m the future. Therefore, it is imperative to use psychographic smdy to shape the marketing strategy because tourists psychographics will change as time goes by.
In conclusion, this research has shed some light in using psychographic statements to identified the relevant market segment. This research is only in its initial stage to illusfrate an awareness of the potential tourist from Singapore.
RECOMMENDATIONS
With the identification of the five market segments, travel products and services can be developed by the marketer that are appropriate to the key segments of the Singaporean market.
Thus the recommendation for the five identified segments are as follows:
"Explorer" This segment of Singaporean tourists like to experience new culture. Therefore, Australian Tourism can promote the unique Australian Aboriginal Culmre to this segment of the population. Marketers can also expand the market by developing aboriginal tourist products for merchandising.
As for "Organised Tourists" marketers can provide Tour Packages to include Airfare or just
Tour Package only to this segment of tourists. However, marketing strategies must
emphasise safety of the destination because this segment is very sensitive to unsafe
destinations. Thus, personal selling is important for this segment as reassuring is the key
issue.
75

"Active Tourists" - This segment of tourists can be marketed by promoting " Australia a
places of many Interest" mcluding Outback and Australian wild life "Pleasure Seeker" -The
marketing strategy for this segment of tourists was to promote Australia as a Garden City,
Beach Resort and Shopping Paradise.
"Sophisticate Seeker" - A marketing sfrategy can be developed by creating more night
activities and tourist spots to meet the demand of the tourists. Activities include Casino
Gambling and Late Night Shopping.
Thus, the five psychographic factors have provided useful insights. Although
psychographic study is a relatively new field, it provides information not readily available
elsewhere.
A product strategy must be developed for Singaporean tourists which indicates to each market segment what travel potential is offered in Australia. Advertising appeal, using slogans such as "Australia is Magic" must be an on-going process to keep market segments informed. As a result, it will create awareness in the tourist industry.
Thus, besides marketing sfrategies, customer service plays an important factor in wooing
this segment of tourists to Australia.
Customer services play an important part in promoting tourism and good service will
receive good feedback and create a good reputation in the tourism industry. Therefore,
understanding the customers needs and delivering the products will enhance the flow of
fumre tourists to the country.
76

Thus, with the increasing growth in overseas travel, Australia can be one of the
potential markets for Singaporean tourists. The ATC Annual Report (1992:15)
stated that the "Tracking studies carried out in Singapore on the fu-st two to go
on air revealed that Australia has moved from fourth to fu-st place as the most
popular holiday destination for Singaporeans, both in terms of awareness and
intent." As a result, it hopes to maintain Australia's profile at the forefront in
projecting itself to the Singapore market.
All in all, this study only form an initial stage of the finding. It provides an
insight into the profile of Singapore tourists. Thus, with the identifications of the
five segments, it will enable Australia Tourism Industry Marketing Department
in refocusing its marketing strategies. In addition, it l elps to develop and
design the travel products that attract these potential markets by using
promotional advertising to reach them.
77

APPENDDC A: QUESTIONNAIRE
Please circle your answer to the following questions or where appropriate.
Sex (a) Male
(b) Female
In which age group do you belong?
What is your marital status?
What is the highest level of education you have completed?
In which range of annual total income do you belong to?
Have you visited Australia before?
(a)
(b)
(c)
(d)
(a)
(b)
(c)
(a)
(b)
(c)
(d)
(a)
(b)
(c)
(d)
(a)
(b)
Under 21
22 - 30
31 -40
40 Years &. Over
Single
Married
Married/Children
Secondary
Tertiary
Vocation/Technical
Other
Below $15,000
$15,000 to $25,000
$25,000 to $35,000
Over $36,000
Yes
No
78

7. Where did you obtain your information in respect to visiting Australia?
8. How long did you stay in Australia?
In Australia, where have you visited?
10. How much did you allocate for your expenditure on your trip?
(a)
(b)
(c)
(d)
(e)
(a)
(b)
(c)
(a)
(b)
(c)
(d)
(e)
(0
(a)
(b)
(c)
(d)
Friends/Relatives
Television
Magazine
Travel Agent
Other
1 week or less
Over 1 week
1 month or more
Sydney
Melbourne
Gold Coast
Alice Springs
Adelaide
Perth
Less than $1,000
$1,001 to $3,000
$3,001 to $5,000
Over $5,000
79

B. Below you will find a list of statements about your activities, interest and opinions regarding various aspects of the vacation experience and type of preferred destinations. Please circle for each item depending on your feelings. Each number represents your feelings as follows.
1. Strongly Agree 2. Agree 3. Neither Disagree nor Agree 4. Disagree 5. Strongly Disagree
1. When I travel abroad, I prefer to be on a guided tour. ^L 2. 4. .>. -^yi
2. The nicest vacation is one where I can relax and do nothing. 1. 2.
3. When I go on vacation, I look for adventure and an opportunity to escape from the ordinary. 1.
4. The best vacations are those that have a lot of night life. 3.
5. It is important that I stay at the best places when on vacation. 1. 2.
6. I prefer to visit countries that have old monuments and other historical buildings. 1. 2. 3. 4. 5.
7. I always like to mix with the local people and experience the local customs. 1. 2. 3. 4. 5.
8. I most like to visit places that my friends have visited before me. 1. 2. 3. 4. 5.
80

9. One of the best parts of travelling is to visit new cultures and new ways of living. 1. 2.
10. When I go on a trip, I prefer to arrange my own sightseeing schedule and accommodation. 1. 3. 4.
11. Most of my friends come to me for advice on what foreign countries to visit
12. I like to visit places where I've been able to leam things that help me in education and/ or business. 3. 4.
13. I try to do too many things when I'm on vacation. 4.
14. I prefer to visit places where I can understand the language. 1. 2. 3. 4. 5.
15. It is important that there is plenty to entertain the children at the places I go on vacation. 1. 2. 3. 4. 5.
16. I prefer to visit places with a large variety of activities and sights. 1. 2. 3. 4. 5.
81

APPENDIX B: SEX
A_01 Frequency Percent Cirulative Frequency
CuTulative Percent
MALE FEMALE
41 60
40.6 59.4
41 101
40.6 100.0
AGE
A_02 Frequency Percent Cunulative Frequency
Cunulative Percent
UNDER 21 8 7.9 8 7.9 22-30 35 34.7 43 42.6 31-40 45 44.6 88 87.1 40 YEARS AND OVE 13 12.9 101 100.0
MARITAL STATUS
A_03 Frequency Percent Cumulative Frequency
emulative Percent
SINGLE MARRIED MARRIED/CHILDREN
31 57 13
30.7 56.4 12.9
31 88 101
30.7 87.1 100.0
A_04
0 SECONDARY TERTIARY VOCATIONAL/TECHN OTHER
EDUCATION
Frequency
1 46 41 2 11
Percent
1.0 45.5 40.6 2.0 10.9
emulative Frequency
1 47 88 90 101
Cunulative Percent
1.0 46.5 87.1 89.1 100.0
INCOME
A_05
0 BELOW SI 5000 $15000 TO $25000 $25000 TO $35000 OVER $36000
Frequency
2 16 24 23 36
Percent
2.0 15.8 23.8 22.8 35.6
Cunulative Frequency
2 18 42 65 101
Cunulative Percent
2.0 17.8 41.6 64.4 100.0
PREVIOUS VISIT
A_06 Frequency Percent Cunulative Frequency
Cunulative Percent
NULL RESPONSE (N YES
2 99
2.0 98.0
2 101
2.0 100.0
82

INFORMATION SOURCE
A_07
NULL RESPONSE FRIENDS/ RELATIV TELEVISION MAGAZINES TRAVEL AGENT OTHER
A_08
NULL RESPONSE 1 WEEK OR LESS OVER ONE WEEK 1 MONTH OR MORE
Frequency
1 47 3 16 23 11
LENGTH
Frequency
1 39 51 10
Percent
1.0 46.5 3.0 15.8 22.8 10.9
OF STAY
Percent
1.0 38.6 50.5 9.9
Cunulative Frequency
1 48 51 67 90 101
Cunulative Frequency
1 40 91 101
Cunulative Percent
1.0 47.5 50.5 66.3 89.1 100.0
Cunulative Percent
1.0 39.6 90.1 100.0
VISIT SYDNEY
A_09_A Frequency Percent Cunulative Frequency
Cunulative Percent
NULL RESPONSE (N YES
59 42
58.4 41.6
59 101
58.4 100.0
VISIT MELBOURNE
A_09_B Frequency Percent Cunulative Frequency
Cunulative Percent
NULL RESPONSE (N YES
68 33
67.3 32.7
68 101
67.3 100.0
VISIT GOLD COAST
A_09_C Frequency Percent Cunulative Frequency
Cunulative Percent
NULL RESPONSE (N YES
50 51
49.5 50.5
50 101
49.5 100.0
VISIT ALICE SPRINGS
Cunulative Cunulative A_09_0 Frequency Percent Frequency Percent
NULL RESPONSE (N 101 100.0 101 100.0
VISIT ADELAIDE
A_09_E Frequency Percent Cunulative Cuiulative Frequency Percent
NULL RESPONSE (N YES
93 8
92-1 7.9
93 101
92.1 100.0
83

PERTH
A_09_F Frequency Percent Cunulative Frequency
Cunulative Percent
NULL RESPONSE (N YES
63 38
62.4 37.6
63 101
62.4 100.0
NULL LESS
A_10
RESPONSE THAN $1000
$1,001 TO $3000 $3001 OVER
TO $5000 $5000
EXPENDITURE
Frequency
1 16 59 14 11
Percent
1.0 15.8 58.4 13.9 10.9
Cunulative Frequency
1 17 76 90 101
Cunulative Percent
1.0 16.8 75.2 89.1 100.0
STRONGLY AGREE
B_01
AGREE
NEITHER DISAGREE DISAGREE STRONGLY DISAGRE
GUIDED TOUR
Frequency
5 25 34 21 16
Percent
5.0 24.8 33.7 20.8 15.8
Cunulative Frequency
5 30 64 85 101
Cunulative Percent
5.0 29.7 63.4 84.2 100.0
RELAX
B_02
STRONGLY AGREE AGREE NEITHER DISAGREE DISAGREE STRONGLY DISAGRE
Frequency
20 29 26 23 3
Percent
19.8 28.7 25.7 22.8 3.0
Cunulative Frequency
20 49 75 98 101
Cunulative Percent
19.8 48.5 74.3 97.0 100.0
ADVENTURE AND ESCAPE
B_03
NULL RESPONSE STRONGLY AGREE AGREE NEITHER DISAGREE DISAGREE STRONGLY DISAGRE
Frequency
1 29 47 17 4 3
Percent
1.0 28.7 46.5 16.8 4.0 3.0
Cunulative Frequency
1 30 77 94 98 101
Cunulative Percent
1.0 29.7 76.2 93.1 97.0 100.0
STRONGLY AGREE NEITHER I DISAGREE STRONGLY
B_04
AGREE
)ISAGREE
DISAGRE
NIGHT
Frequency
7 19 29 33 13
LIFE
Percent
6.9 18.8 28.7 32.7 12.9
Cunulative Frequency
7 26 55 88 101
Cunulative Percent
6.9 25.7 54.5 87.1 100.0
84

B_05
STRONGLY AGREE AGREE NEITHER DISAGREE DISAGREE STRONGLY DISAGRE
BEST
Frequency
12 29 31 26 3
PLACES
Percent
11.9 28.7 30.7 25.7 3.0
Cunulative FrequefKy
12 41 72 98 101
Cunulative Percent
11.9 40.6 71.3 97.0 100.0
HISTORY
B_06
STRONGLY AGREE AGREE NEITHER DISAGREE DISAGREE STRONGLY DISAGRE
Frequency
10 36 33 19 3
Percent
9.9 35.6 32.7 18.8 3.0
Cunulative Frequency
10 46 79 98 101
Cunulative Percent
9.9 45,5 78.2 97.0 100.0
STRONGLY AGREE
B_07
AGREE
NEITHER DISAGREE DISAGREE STRONGLY DISAGRE
LOCAL
Frequency
19 53 24 4 1
CUSTOMS
Percent
18.8 52.5 23.8 4.0 1.0
Cunulative Frequency
19 72 96 100 101
Cunulative Percent
18.8 71.3 95.0 99.0 100.0
FRIENDS VISITED
B_08
STRONGLY AGREE AGREE NEITHER DISAGREE DISAGREE STRONGLY DISAGRE
B_09
STRONGLY AGREE AGREE NEITHER DISAGREE DISAGREE STRONGLY DISAGRE
B_10
STRONGLY AGREE AGREE NEITHER DISAGREE DISAGREE STRONGLY DISAGRE
Frequency
1 19 40 30 11
NEW
Frequency
29 53 16 1 2
OWN
Frequency
20 29 34 16 2
Percent
1.0 18.8 39.6 29.7 10.9
CULTURE
Percent
28.7 52.5 15.8 1.0 2.0
SCHEDULE
Percent
19.8 28.7 33.7 15.8 2.0
Cumulative Frequency
1 20 60 90 101
Cunulative Frequency
29 82 98 99 101
Cunulative Frequency
20 49 83 99 101
Cunulative Percent
1.0 19.8 59.4 89.1 100.0
Cunulative Percent
28.7 81.2 97.0 98.0 100.0
Cunulative Percent
19.8 48.5 82.2 98.0 100.0
85

SAS
ADVICE TO "FRIENDS
12:22 Wednesday, July 14, 1993 5
B_11 Frequency Cunulative Cunulative
Percent Frequency Percent
STRONGLY AGREE AGREE NEITHER DISAGREE DISAGREE STRONGLY DISAGRE
6 21 49 19 6
5.9 20.8 48.5 18.8 5.9
6 27 76 95 101
5.9 26.7 75.2 94.1 100.0
LEARN THINGS
B_12 Frequency Percent Cunulative Frequency
Cunulative Percent
STRONGLY AGREE AGREE NEITHER DISAGREE DISAGREE
16 41 30 14
15.8 40.6 29.7 13.9
16 57 87 101
15.8 56.4 86.1 100.0
TOO MANY THINGS
B_13
NULL RESPONSE STRONGLY AGREE AGREE NEITHER DISAGREE DISAGREE STRONGLY DISAGRE
Frequency
1 9 19 31 29 12
Percent
1.0 8.9 18.8 30.7 28.7 11.9
Cunulative Frequency
1 10 29 60 89 101
Cunulative Percent
1.0 9.9 28.7 59.4 88.1 100.0
UNDERSTAND LANGUAGE
B_14
STRONGLY AGREE AGREE NEITHER DISAGREE DISAGREE STRONGLY DISAGRE
Frequency
16 35 35 11 4
Percent
15.8 34.7 34.7 10.9 4.0
Cunulative Frequency
16 51 86 97 101
Cunulative Percent
15.8 50.5 85.1 96.0 100.0
ENTERTAIN CHILDREN
B_15
STRONGLY AGREE AGREE NEITHER DISAGREE DISAGREE STRONGLY DISAGRE
Frequency
7 22 38 25 9
Percent
6.9 21.8 37.6 24.8 8.9
Cumulative Frequency
7 29 67 92 101
Cunulative Percent
6.9 28.7 66.3 91.1 100.0
VARIETY
B_16
NULL RESPONSE STRONGLY AGREE AGREE NEITHER DISAGREE DISAGREE STRONGLY DISAGRE
Frequency
1 32 43 15 8 2
Percent
1.0 31.7 42.6 14.9 7.9 2.0
Cunulative Frequency
1 33 76 91 99 101
Cunulative Percent
1.0 32.7 75.2 90.1 98.0 100.0
86

Std Dev N Obs Variable Label Minimun Maximum Mean
0.4935224
0.8105737
0.6386868
0.9502475
1.1632151
0.1400141
1.5396412
0.6594327
0.4953247
0.4713578
0.5024692
0
0.2714100
0.4868570
0.8648241
1.1260199
1.1320707
0.9639030
1.1194058
1.0518254
0.9873457
0.8091066
0.9353350
0.8170219
1.0451207
0.9378720
0.9194273
1.1803675
1.0158155
1.0512604
101 A_01
A_02
A_03
A_04
A_05
A_06
A_07
A_08
A_09_A
A_09_B
A_09_C
A_09_0
A_09_E
A_09_F
A_10
B_01
B_02
B_03
B_04
B_05
B_06
B_07
B_08
B_09
B_10
BJ1
BJ2
B_13
B_14
B_15
B_16
SEX
AGE
MARITAL STATUS
EDUCATION
INCOME
PREVIOUS VISIT
INFORMATION SOURCE
LENGTH OF STAY
VISIT SYDNEY
VISIT MELBOURNE
VISIT GOLD COAST
VISIT ALICE SPRINGS
VISIT ADELAIDE
PERTH
EXPENDITURE
GUIDED TOUR
RELAX
ADVENTURE AND ESCAPE
NIGHT LIFE
BEST PLACES
HISTORY
LOCAL CUSTOMS
FRIENDS VISITED
NEU CULTURE
OUN SCHEDULE
ADVICE TO FRIENDS
LEARN THINGS
TOO MANY THINGS
UNDERSTAND LANGUAGE
ENTERTAIN CHILDREN
VARIETY
101
101
101
101
101
101
101
101
101
101
101
101
101
101
101
101
101
101
101
101
101
101
101
101
101
101
101
101
101
101
101
1.0000000
1.0000000
1.0000000
0
0
0
0
0
0
0
0
0
0
0
0
1.0000000
1.0000000
0
1.0000000
1.0000000
1.0000000
1.0000000
1.0000000
1.0000000
1.0000000
1.0000000
1.0000000
0
1.0000000
1.0000000
0
2.0000000
4.0000000
3.0000000
4.0000000
4.0000000
1.0000000
5.0000000
3.0000000
1.0000000
1.0000000
1.0000000
0
1.0000000
1.0000000
4.0000000
5.0000000
5.0000000
5.0000000
5.0000000
5.0000000
5.0000000
5.0000000
5.0000000
5.0000000
5.0000000
5.0000000
4.0000000
5.0000000
5.0000000
5.0000000
5.0000000
1.5940594
2.6237624
1.8217822
1.7623762
2.7425743
0.9801980
2.4554455
1.6930693
0.4158416
0.3267327
0.5049505
0
0.0792079
0.3762376
2.1782178
3.1782178
2.6039604
2.0297030
3.2574257
2.7920792
2.6930693
2.1584158
3.3069307
1.9504950
2.5148515
2.9801980
2.4158416
3.1287129
2.5247525
3.0693069
2.0297030
87

SAS 12:52 Wednesday, July 14, 1993 4
Initial Factor Method: Principal Cotnponents
Prior Conrunality Estimates: ONE
Eigenvalues of the Correlation Matrix: Total = 16 Average - 1 APPENDIX C:
Eigenvalue Difference Proportion Cunulative
Eigenvalue Difference Proportion Cumulative
1 2 3 4 5 6 7 8 3.646938 2.147105 1.593428 1.316497 1.099739 0.995308 0,875538 0.699900 1.499833 0.553676 0.276932 0.216758 0.104430 0.119770 0.175638 0.069231 0.2279 0.1342 0.0996 0.0823 0.0687 0.0622 0.0547 0.0437 0.2279 0.3621 0.4617 0.5440 0.6127 0.6749 0.7297 0.7734
9 0.630669 0.018580 0.0394 0.8128
10 0.612088 0.067975 0.0383 0.8511
11 0.544113 0.060738 0.0340 0.8851
12 0.483375 0.052325
0.0302 0.9153
13 0.431050 0.035797 0.0269 0.9422
14 0.395253 0.037579 0.0247 0.9669
15 0.357674 0.186349 0.0224 0.9893
16 0.171325
0.0107 1.0000
5 factors will be retained by the NFACTOR criterion.
Factor Pattern
FACT0R1 FACT0R2 FACT0R3 FACT0R4 FACT0R5
B 11 B"03 B " 0 7 B~10 B"16 B " 1 2 B"14
B~01 B"15 B"05 B " 0 6 B~09 B'04 B " 0 8
B'02 B"13
0.70454 0.66446 0.64394 0.62206 0.56407 0.48923 0.44652 -0.28530 0.12234 0.47364 0.37123 0.38666 0.42065 0.12193 0.39743 0.43905
-0.30301 0.04594 -0.14968 -0.39198 0.32552 -0.17522 0.37140 0.69356 0.64983 0.52486 •0.14661 -0.18247 0.20404 0.54432 0.14304 0.10285
•0.12302 0.07036 0.29977 -0.34276 0.04545 0.23594 0.00273 0.42784 0.17889 -0.31386 0.59227 0.58136 -0.51870 -0.06028 -0.17763 0.04130
0.08535 -0.09532 0.09393 0.09659 -0.30222 -0.10829 -0.25619 0.11747 -0.26057 0.09510 0.23535 0.20222 0.03047 0.61783 0.53179 -0.51070
0.01538 -0.02747 -0.15127 0.12888 0.31000 0.24710 -0.28784 0.13292 0.19325 -0.05863 -0.39282 0.50175 0.32154 -0.11673 -0.17663 -0.45445
ADVICE TO FRIENDS ADVENTURE AND ESCAPE LOCAL CUSTOMS OUN SCHEDULE VARIETY LEARN THINGS UNDERSTAND LANGUAGE GUIDED TOUR ENTERTAIN CHILDREN BEST PLACES HISTORY NEU CULTURE NIGHT LIFE FRIENDS VISITED RELAX TOO MANY THINGS
Variance explained by each factor
FACTOR1 FACT0R2 FACT0R3 FACT0R4 FACT0R5 3.646938 2,147105 1.593428 1.316497 1.099739
Final Connunality Estimates: Total = 9.803707
B 01 0.776934
B 09 0.813425
B 02 0.523964
B 10 0.684031
B 03 0.458409
B 11 0.610845
B 04 0.591944
B 12 0.398501
B 05 0.610797
B 13 0.672389
B 06 0,719783
B 14 0.485813
B 07 0,558629
B 15 0,574484
B 08 0.710T22
B 16 0.613Z36
88

SAS 12:52 Wednesday, July 14, 1993
Rotation Method: Varimax
APPENDIX D
B 09 B"12 B " 0 7 B"01 B"15 B"11
B"IO B"13 B~14 B~03 B" 0 8 B " 0 2 B"05 B"04 B ' 1 6 B"06
Orthogonal Transfomation Matrix
1 2 3 4
1 2 3 4 5
0.64549 -0.18604 0.56790 0.08731 0.46754
-0.35603 0.75839 0.50293
•0.07909 0,19719
0,54448 0,32700 0.01536
-0.55543 -0,53654
0,33388 0,41473
-0,17158 0.79462
-0.23592
0.22056 0.33361
-0.62839 •0.21494 0.63166
Rotated Factor Pattern
FACTOR1 FACT0R2 FACT0R3 FACT0R4 FACT0R5
0.86593 0.58846 0.55122 0.00218 0.12727 Oai5592, 0.34849 0.03066
,0.06374 l>.ft3915
0.09929 -0.13111 -0.22927 0.85966 0.59795
-0.54623 -0.67336 -0.10676 0.08757
-0.16422 -0,05743 0,26720 0,09290 -0,19923 0,01074 0.05249
-0.22173 -0.00401 -0.06744 0.14027 -0.09415 0,08054 0,33527 0,21182 -0,21201
-0,05854 0,32290 0,22698 0,08245 0,80081 0.66135 0.44557
-0.03707 0.05984 0.40333>
0.09200 -0.19490 0.09835 /^0.W790 0.15393 0.41581 VO.44014 -0.04156 0.24333
0.18096 -0.04169 0.02701 0.30943 0.19487 0.12298 0.15028 0.28247
-0.11644 0.16698 0.159S7 0.79528 0.68674 0.51906 0.26242 0.00225 0.24121
•0.07210 0.09392 0.12080 0.03983 0.02113 0.41931 0.68335 0,46521
•0 63792
NEU CULTURE "^ LEARN THINGS - LOCAL CUSTOMS GUIDED TOUR ENTERTAIN CHILDREN ADVICE TO FRIENDS
TOO MANY THINGS UNDERSTAND LANGUAGE ADVENTURE AND ESCAPE FRIENDS VISITED RELAX BEST PLACES NIGHT LIFE VARIETY HISTORY
Variance explained by each factor
FACTOR1 FACT0R2 FACT0R3 FACT0R4 FACT0R5 2,358178 2.151252 2.033865 1.715240 1.545171
Final Communality Estimates: Total « 9,803707
B 01 0.776934
B 09 0.813425
B 02 0.523964
B 10 0.684031
B 03 0.458409
B 11 0.610845
B 04 0.591944
B 12 0.398?01
B 05 0,610797
B 13 0,672589
B 06 0,719783
B 14 0.485813
B 07 0.558629
B 15 0.574484
B 08 O.7IOT22
B 16 0.613636
89

APPENDDC E SAS
CORRELATION "ANALYSIS
5 'VAR' Var iables: 8 09 B 01 8 13 B 08
15:02 Thursday, November 25, 1993 1
S 04
Variable
B 09 B'OI B"13 B'08 B'04
N
101 101 101 101 101
Mean
1.950495 3.178218 3.128713 3.306931 3.257426
Simple
Std Oev
0.817022 1.126020 1.180367 0.935335 1.119406
Statistics
Sum
197.000000 321.000000 316.000000 334.000000 329.000000
Minimun
1.000000 1.000000
0 1.000000 1.000000
Haximun
5.000000 5.000000 5.000000 5.000000 5.000000
Label
NEU CULTURE GUIDED TOUR TOO MANY THINGS FRIENDS VISITED NIGHT LIFE
Pearson Correlation Coefficients / Prob > |R| under Ho: Rho=0 / N = 101
B 09 6 01 B 13 B 08 B 04
B 09 NEU CULTURE
B 01 GUIDED TOUR
6 13 TOO MANY THINGS
B 08 FRIENDS VISITED
B 04 NTGHT LIFE
i.oodcn>^s^ 0.0 ^ " ^
0.03143 0.7551
-0.05554 0.5812
•0.00609 0.9518
•0.02966 0.7684
0.03143 •-^.^^^0.7551
ITO5DO«»,^ 0.0 ^ " ^
•0.16038 0.1091
0.32734 0.0008
-0.07643 0.4475
-0.05554 0.5812
-0.16038 ... ^ 0.1091
0.0 '•"....
•0.02708 0.7880
0.08820 0.3805
-0.00609 0.9518
0.32734 0.0008
•0.02708 0.7880
i"ro«Qao
0.17211 0.0853
-0,02966 0.7684
-0.07643 0.4475
0.08820 0,3805
0.17211 0.0853
^T>QflPpO O.ff""^
90

APPENDIX F
ilEQUESCY TABLE OF
IVE TYPOLOGY^
"HEAVY" & "UGHT"
F_1
Heavy Light
Frequency
82 19
SAS
Explorer
Cunulative Percent Frequency
81.2 82 18.8 101
Cunulative Percent
81.2 100.0
10:30 Friday, December 10, 1993 1
Organised
F_2 Frequency Percent Cunulative Frequency
Cumulative Percent
Heavy Light
30 71
29.7 70.3
30 101
29,7 100,0
F_3
Heavy Light
f_
Heavy Light
Frequency
29 72
Frequency
20 81
Active Tourist
Cunulative Percent Frequency
28,7 29 71,3 101
Pleasure Seeker
Cunulative Percent Frequency
19,8 20 80,2 101
Cunulative Percent
28.7 100.0
Cunulative Percent
19.8 100,0
Sophisticate
F_5 Frequency Percent Cunulative Frequency
Cumulative Percent
Heavy Light
26 75
25,7 74,3
26 101
25,7 100,0
91

Organised
10:30 Friday, December 10, 1993 27
F_2 Frequency Cuiulative Cunulative
Percent Frequency Percent
Heavy Light
30 71
29.7 70.3
30 101
29.7 100.0
Active Tourist
F_3 Frequency Percent Cunulative Frequency
Cunulative Percent
Heavy Light
29 72
28.7 71.3
29 101
28.7 100.0
Pleasure Seeker
F_4 Frequency Percent Cunulative Frequency
Cunulative Percent
Heavy Light
20 81
19.8 80.2
20 101
19.8 100.0
Sophisticate
F_5 Frequency Percent Cunulative Frequency
Cunulative Percent
Heavy Light
26 75
25.7 74,3
26 101
25.7 100.0
92

Where Factor 1 Loads Heavy
SEX'
10:30 Friday, Oecemoer 10, 1993
Cunulative Cunulative A_01 Frequency Percent Frequency Percent
MALE FEMALE
34 48
41.5 58.5
34 82
41.5 100.0
AGE
A_02 Frequency Percent Cumulative Frequency
Cunulative Percent
UNDER 21 22-30 31-40 40 YEARS AND OVE
6 31 37 8
7.3 37.8 45.1 9,8
6 37 74 82
7,3 45,1 90.2 100.0
MARITAL STATUS
A_03 Frequency Percent Cunulative Frequency
Cunulative Percent
SINGLE HARRIED MARRIED/CHILDREN
27 46 9
32.9 56.1 11.0
27 73 82
32.9 89.0 100.0
EDUCATION
A_04 Frequency Pepcent Cunulative Frequency
Cunulative Percent
SECONDARY TERTIARY VOCATIONAL/TECHN OTHER
35 35 1
10
43.2 43.2 1.2
12.3
35 70 71 81
43.2 86.4 87.7 100.0
Frequency Missing = 1
INCOME
A_05
BELOU $15000 $15000 TO $25000 $25000 TO $35000 OVER $36000
Frequency
15 20 18 27
Percent
18.8 25.0 22.5 33.7
Cunulative Frequency
15 35 53 80
Cunulative Percent
18.8 43.7 66.2 100.0
Frequency Missing = 2
93

Where Factor 1 Loads Heavy 10:30 Friday, December 10, 1993 3
INFORMATION SOURCE
A_07
NULL RESPONSE FRIENDS/ RELATIV TELEVISION MAGAZINES TRAVEL AGENT
F requency
1 39 3 12 20
Percent
1.2 47.6 3.7 14.6
• 24.4
Cunulative Frequency
1 40 43 55 75
Cunulative Percent
1.2 48.8 52.4 67.1 91.5
OTHER 7 8.5 82 100.0
94

Where Factor 2 Loads Heavy
SEX
10:30 Friday, December 10, 1993
A_01 Frequency Cunulative Cunulative
Percent Frequency Percent
MALE FEMALE
15 15
50.0 50.0
15 30
50.0 100.0
AGE
A_02 Frequency Percent Cunulative
Frequency Cunulative
Percent
UNDER 21 22-30 31-40 40 YEARS AND OVE
2 9 13 6
6.7 30.0 43.3 20.0
2 11 24 30
6.7 36.7 80.0 100.0
MARITAL STATUS
A_03 Frequency Percent Cunulative Frequency
Cunulative Percent
SINGLE MARRIED MARRIED/CHILDREN
6 19 5
20.0 63.3 16.7
6 25 30
20.0 83.3 100.0
EDUCATION
A_04 Frequency Percent Cunulative Frequency
Cunulative Percent
SECONDARY TERTIARY OTHER
16 8 5
55.2 27.6 17.2
16 24 29
55.2 82.8 100.0
Frequency Missing = 1
INCOME
A_05 Frequency Percent Cunulative Frequency
Cunulative Percent
BELOU $15000 $15000 TO $25000 $25000 TO $35000 OVER $36000
17.9 32.1 17.9 32.1
5 14 19 28
Frequency Missing = 2
17.9 50.0 67.9
100.0
95

Uhere Factor 2 Loads Heavy 10:30 Friday, December 10, 1993
INFORMATION SOURCE
A_07
FRIENDS/ RELATIV TELEVISION MAGAZINES TRAVEL AGENT OTHER
Frequency
13 2 6 6 3
Percent
43.3 6.7 20.0 20.0 10.0
Frequency
13 15 21 27 30
Percent
43.3 50.0 70.0 90.0 100.0
96

Uhere Factor 3 Loads Heavy
SEX"
10:30 Friday. December 10, 1993
A_01 Frequency Cunulative Cuiulative
Percent Frequency Percent
MALE FEMALE
9 20
31.0 69.0
9 29
31.0 100.0
AGE
A_02 Frequency Percent Cunulative Frequency
Cunulative Percent
UNDER 21 22-30 31-40 40 YEARS AND OVE
3 13 10 3
10.3 44.8 34.5 10.3
3 16 26 29
10.3 55.2 89.7 100.0
MARITAL STATUS
A_03 Frequency Percent Cunulative Frequency
Cunulative Percent
SINGLE MARRIED MARRIED/CHILDREN
13 12 4
44.8 41.4 13.8
13 25 29
44.8 86.2 100.0
EDUCATION
A_04 Frequency Percent Cumulative Frequency
Cunulative Percent
SECONDARY TERTIARY OTHER
14 11 4
48.3 37.9 13.8
14 25 29
48.3 86.2 100.0
INCOME
A_05 Frequency Percent Cunulative Frequency
Cunulative Percent
BELOU $15000 $15000 TO $25000 $25000 TO $35000 OVER $36000
4 4 10 11
13.8 13.8 34.5 37.9
4 8 18 29
13.8 27.6 62.1 100.0
INFORMATION SOURCE
A_07
FRIENDS/ RELATIV TELEVISION MAGAZINES TRAVEL AGENT OTHER
Frequency
12 1 6 6 4
Percent
41.4 3.4 20.7 20.7 13.8
Cunulative Frequency
12 13 19 25 29
Cunulative Percent
41.4 44.8 65.5 86.2 100.0
97

uhere Factor 4 Loads Heavy
SEX
10:30 Friday, December 10, 1993
A_01 Frequency
MALE FEMALE
Cunulative Cunulative Percent Frequency Percent
11 9
55.0 45.0
11 20
55.0 100.0
AGE
A_02 Frequency Percent Cunulative
Frequency Cunulative
Percent
UNDER 21 22-30 31-40 4 0 YEARS AND OVE
1 7 11 1
5. 35, 55, 5,
1 8 19 20
5.0 40.0 95.0 100.0
MARITAL STATUS
A_03 Frequency Percent Cunulative Frequency
Cunulative Percent
SINGLE MARRIED MARRIED/CHILDREN
5 13 2
25.0 65.0 10.0
5 18 20
25.0 90.0 100.0
EDUCATION
A_04 Frequency Percent Cumulative Frequency
Cunulative Percent
SECONDARY TERTIARY OTHER
45.0 45.0 10.0
9 18 20
45.0 90.0 100.0
INCOME
A_05 Frequency Percent Cunulative Frequency
Cunulative Percent
$15000 TO $25000 $25000 TO $35000 OVER $36000
35.0 30.0 35.0
7 13 20
35.0 65.0 100.0
INFORMATION SOURCE
A_07 Frequency Percent Cunulative Frequency
Cunulative Percent
FRIENDS/ RELATIV TELEVISION MAGAZINES TRAVEL AGENT OTHER
7 2 2 6 3
35.0 10.0 10.0 30.0 15.0
7 9 11 17 20
35.0 45.0 55.0 85.0 100.0
98

MALE FEMALE
A_01
Uhere Factor 5 Loads
Frequency
15 11
SEX
Percent
57.7 42.3
Heavy
Cunulative Frequency
15 26
1
Cunulative Percent
57.7 100.0
10:30 Friday, December 10, 1993 8
AGE
A_02 Frequency Percent Cunulative Frequency
Cunulative Percent
UNDER 21 22-30 31-40 40 YEARS AND OVE
2 9 13 2
7.7 34.6 50.0 7.7
2 11 24 26
7.7 42.3 92.3 100.0
MARITAL STATUS
A_03 Frequency Percent Cunulative Frequency
Cunulative Percent
SINGLE MARRIED MARRIED/CHILDREN
7 15 4
26.9 57.7 15.4
7 22 26
26.9 84.6 100.0
EDUCATION
A_04 Frequency Percent Cunulative Frequency
Cunulative Percent
SECONDARY TERTIARY VOCATIONAL/TECHN OTHER
10 12 1 3
38.5 46.2 3,8 11.5
10 22 23 26
38.5 84.6 88.5 100.0
A 05
INCOME
Cunulative Cunulative Frequency Percent Frequency Percent
BELOU $15000 $15000 TO $25000 $25000 TO $35000 OVER $36000
3 9 4 10
11.5 34.6 15.4 38.5
3 12 16 26
11.5 46.2 61.5 100.0
INFORMATION SOURCE
A_07
NULL RESPONSE FRIENDS/ RELATIV TELEVISION MAGAZINES TRAVEL AGENT OTHER
Frequency
1 12 2 6 4 1
Percent
3.8 46.2 7.7
23.1 15.4 3.8
Cunulative Frequency
1 13 15 21 25 26
Cunulative Percent
3.8 50.0 57.7 80,8 96.2 100.0
99

where Factor 1 Loads Light
SEX
10:30 Friday, December 10, 1993
A_01 Frequency Cunulative Cunulative
Percent Frequency Percent
MALE FEMALE
7 12
36.8 63.2
7 19
36.8 100.0
A_02 Frequency
AGE
Cunulative Cunulative Percent Frequency Percent
UNDER 21 22-30 31-40 40 YEARS AND OVE
10.5 21.1 42.1 26.3
2 6 14 19
10.5 31.6 73.7 100.0
MARITAL STATUS
A_03 Frequency Percent Cunulative Frequency
Cunulative Percent
SINGLE MARRIED MARRIED/CHILDREN
4 11 4
21.1 57.9 21.1
4 15 19
21.1 78.9 100.0
EDUCATION
A_04 Frequency Cunulative Cumulative
Percent Frequency Percent
SECONDARY TERTIARY VOCATIONAL/TECHN OTHER
11 6 1 1
57.9 31.6 5.3 5.3
11 17 18 19
57.9 89.5 94.7 100.0
INCOME
A_05 Frequency Percent Cunulative Frequency
Cunulative Percent
BELOU $15000 $15000 TO $25000 $25000 TO $35000 OVER $36000
5.3 21.1 26.3 47.4
1 5 10 19
5.3 26.3 52.6 100.0
INFORMATION SOURCE
A_07 Frequency Percent Cumulative Frequency
Cunulative Percent
FRIENDS/ RELATIV MAGAZINES TRAVEL AGENT OTHER
42.1 21.1 15.8 21.1
8 12 15 19
42.1 63.2 78.9 100.0
100
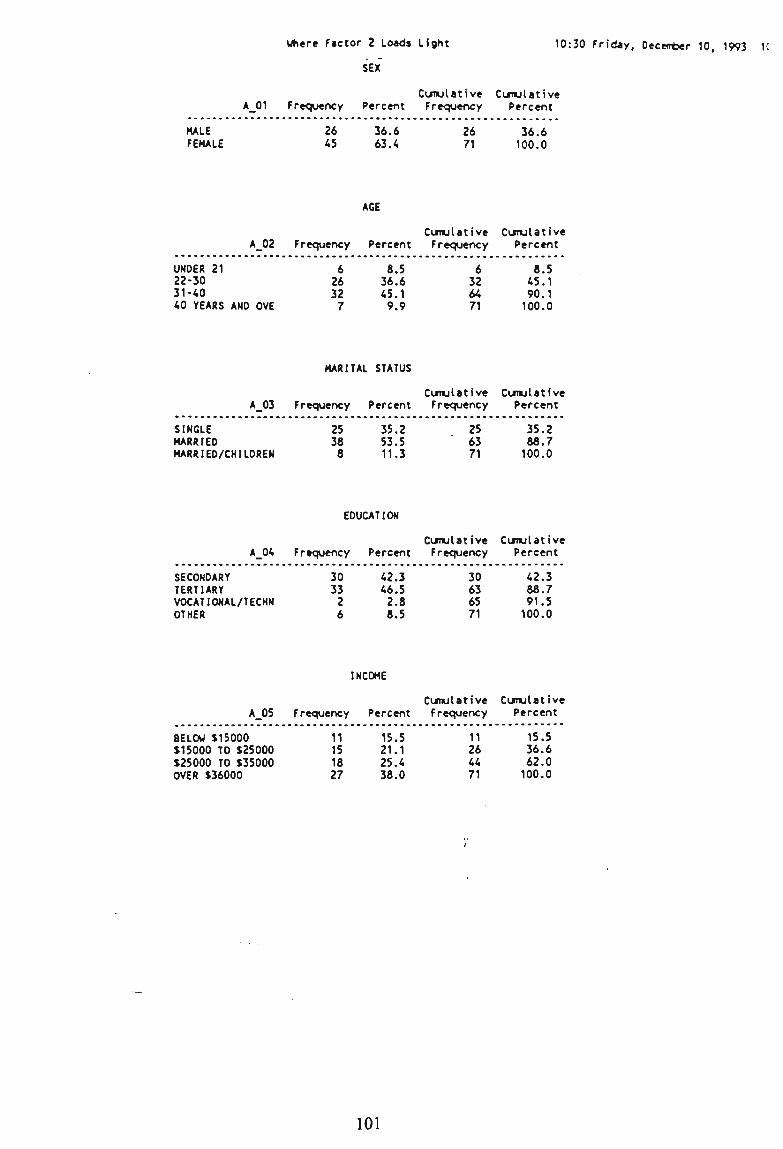
Uhere Factor 2 Loads Light
SEX
10:30 Friday, December 10, 1993 K
MALE FEMALE
Cunulative Cunulative A_01 Frequency Percent Frequency Percent
26 45
36.6 63.4
26 71
36.6 100.0
AGE
A_02 Frequency Percent Cunulative Frequency
Cunulative Percent
UNDER 21 6 8.5 22-30 26 36.6 31-40 32 45.1 40 YEARS AND OVE 7 9.9
6 32 64 71
8.5 45.1 90.1
100.0
A 03
MARITAL STATUS
Cunulative Cunulative Frequency Percent Frequency Percent
SINGLE MARRIED MARRIED/CHILDREN
25 38
8
35.2 53.5 11.3
25 63 71
35.2 88.7
100.0
EDUCATION
A_04 Frequency Percent Cunulative Frequency
Cunulative Percent
SECONDARY TERTIARY VOCATIONAL/TECHN OTHER
30 33 2 6
42.3 46.5 2.8 8.5
30 63 65 71
42.3 88.7 91.5 100.0
INCOME
A_05 Frequency Percent Cunulative Frequency
Cunulative Percent
BELOU $15000 11 15.5 $15000 TO $25000 15 21.1 $25000 TO $35000 18 25.4 OVER $36000 27 38.0
11 26 44 71
15.5 36.6 62.0 100.0
101

Uhere Factor 2 Loads Light 10:30 Friday, 0ecent>er 10, 1993 1'
INFORMATION SOURCE
A_07
NULL RESPONSE FRIENDS/ RELATIV TELEVISION MAGAZINES TRAVEL AGENT OTHER
Frequency
1 34 1 10 17 8
Percent
1.4 47.9 1.4
14.1 23.9 11.3
Cunulative Frequency
1 35 36 46 63 71
Cunulative Percent
1.4 49.3 50.7 64,8 88.7 100.0
102

Uhere Factor 3 Loads Light
SEX
10:30 Friday, December 10, 1993 1
A_01 Frequency Cunulative Cunulative
Percent Frequency Percent
MALE FEMALE
32 40
44,4 55,6
32 72
44.4 100.0
AGE
A_02 Frequency Percent Cumulative Frequency
Cunulative Percent
UNDER 21 22-30 31-40 40 YEARS AND OVE
5 22 35 10
6,9 30,6 48,6 13.9
5 27 62 72
6,9 37,5 86.1 100.0
MARITAL STATUS
A_03 Frequency Percent Cunulative Frequency
Cunulative Percent
SINGLE MARRIED MARRIED/CHILDREN
18 45 9
25,0 62,5 12.5
18 63 72
25,0 87,5 100,0
EDUCATION
A_04 Frequency Percent Cunulative Frequency
Cunulative Percent
SECONDARY TERTIARY VOCATIONAL/TECHN OTHER
32 30 2 7
45.1 42.3 2.8 9,9
32 62 64 71
45.1 87,3 90.1 100.0
Frequency Missing = 1
INCOME
A_05 Frequency Percent Cunulative Frequency
Cunulative Percent
BELOU $15000 $15000 TO $25000 $25000 TO $35000 OVER $36000
12 20 13 25
17.1 28.6 18.6 35.7
12 32 45 70
Frequency Missing = 2
17.1 45.7 64.3
100.0
103

uhere Factor 3 Loads Light 10:30 Friday, Decenber 10, 1993 13
INFORMATION' SOURCE
A_07
NULL RESPONSE FRIENDS/ RELATIV TELEVISION MAGAZINES TRAVEL AGENT
Frequency
1 35 2 10 17
Percent
1.4 48.6 2.8 13.9 23.6
Cunulative Frequency
1 36 38 48 65
Cunulative Percent
1.4 50.0 52.8 66.7 90.3
OTHER 7 9.7 72 100.0
104

Uhere Factor 4 Loads Light
SEX
10:30 Friday, December 10, 1993 1
Cunulative Cunulative A 01 Frequency Percent Frequency Percent
MALE FEMALE
30 51
37.0 63.0
30 81
37.0 100.0
A 02
AGE
Cunulative Cunulative Frequency Percent Frequency Percent
UNDER 21 22-30 31-40 40 YEARS AND OVE
7 28 34 12
8.6 34.6 42.0 14.8
7 35 69 81
8.6 43.2 85.2 100.0
A 03
MARITAL STATUS
Cunulative Cunulative Frequency Percent Frequency Percent
SINGLE MARRIED MARRIED/CHILDREN
26 44 11
32.1 54.3 13.6
26 70 81
32,1 86,4 100.0
EDUCATION
A_04 Frequency Percent Cunulative Frequency
Cunulative Percent
SECONDARY TERTIARY VOCATIONAL/TECHN OTHER
37 32 2 9
46.2 40.0 2,5 11.3
37 69 71 80
46.2 86.2 88.7 100.0
Frequency Missing = 1
INCOME
A 05 Cunulative Cunulative
Frequency Percent Frequency Percent
BELOU $15000 $15000 TO $25000 $25000 TO $35000 OVER $36000
16 17 17 29
20.3 21.5 21.5 36.7
16 33 50 79
20.3 41.8 63.3 100.0
Frequency Missing = 2
105

Uhere Factor 4 Loads Light 10:30 Friday, Decenter 10, 1993 15
INFORMATION" SOURCE
A_07
NULL RESPONSE FRIENDS/ RELATIV TELEVISION MAGAZINES TRAVEL AGENT
Frequency
1 40 1
14 17
Percent
1.2 49.4 1.2
17.3 21.0
Cunulative Frequency
1 41 42 56 73
Cunulative Percent
1.2 50.6 51.9 69.1 90.1
OTHER 8 9.9 81 100.0
106

Where factor 5 Loads Light
SEX
10:30 Friday, December 10, 1993
MALE FEMALE
Cunulative Cunulative A_01 Frequency Percent Frequency Percent
26 49
34.7 65.3
26 75
34.7 100.0
l i
AGE
A_02 Frequency Percent Cunulative Frequency
Cunulative Percent
UNDER 21 6 8,0 22-30 26 34,7 31-40 32 42,7 40 YEARS AND OVE 11 14,7
6 32 64 75
8,0 42.7 85.3 100.0
MARITAL STATUS
A_03 Frequency Percent Cunulative Frequency
Cunulative Percent
SINGLE MARRIED MARRIED/CHILDREN
24 42 9
32.0 56.0 12.0
24 66 75
32.0 88.0 100,0
EDUCATION
A_04 Frequency Percent Cunulative Frequency
Cunulative Percent
SECONDARY TERTIARY VOCATIONAL/TECHN OTHER
36 29 1 8
48,6 39.2 1.4
10.8
36 65 66 74
48.6 87.8 89.2 100.0
Frequency Missing = 1
INCOME
A_05 Frequency Percent Cunulative Frequency
Cunulative Percent
BELOU $15000 $15000 TO $25000 $25000 TO $35000 OVER $36000
13 15 19 26
17.8 20.5 26.0 35.6
13 28 47 73
Frequency Missing = 2
17.8 38.4 64.4
100.0
107

Uhere Factor 5 Loads Light 10:30 Friday, Decenter 10, 1993 i:
INFORMATION' SOURCE
A_07
FRIENDS/ RELATIV TELEVISION MAGAZINES TRAVEL AGENT OTHER
Frequency
35 1
10 19 10
Percent
46.7 1.3
13.3 25.3 13.3
Cunulative Frequency
35 36 46 65 75
Cunu I a t i ve Percent
46.7 48.0 61.3 86.7 100.0
108

10:30 Friday, December 10. 1993 50
APPENDIX G
CHI-SQUARE TEST
TABLE OF A'_0^ BY F_1
A_01(SEX) FJ (Explorer)
Frequency ! Percent | Row Pet j Col Pet JHeavy [Light | - - - - - - - • • ¥ • ' • *
MALE I 34 I 7 I ; 33.66 j 6.93 | I 82.93 I 17.07 j I ,41.46 1 36.84^
- •.•-......•........>
FEMALE j 48 I 12 | j 47.52 I 11.88 j j 80,00 j 20,00 ; I .^8.54 I 63,16 ' + ••• •
Total 82. 81.19
19 18.81
Total
41 40.59
60 59.41
101 100.00
STATISTICS FOR TABLE OF A 01 BY F 1
Statistic DF
Sample Size = 101
Value Prob
Chi-Square Likelihood Ratio Chi-Square Continuity Adj. Chi-Square Mantel-Haenszel Chi-Square Fisher's Exact Test (Left)
(Right) (2-Tail)
Phi Coefficient Contingency Coefficient Cramer's V
1 1 1 1
0.137 0.138 0.012 0.135
0,037 0,037 0.037
0.712 0.711 0.912 0.713 0.733 0.460 0.799
TABLE OF A_02 BY F_l
A_02(AGE) FJ(Explorer)
Frequency Percent Row Pet Col Pet
UNDER 21
22-30
31-40
40 YEARS AND
Total
j
OVE j
1
Heavy
6 5,94 75,00 .7,32
31 30,69 88,57
J7.80
37 36.63 82,22 -45,12
8 7,92
61,54 ,9,76
82 81,19
Light
2 1.98
25.00
Total
8 7.92
10.53 1
4 3.96 11.43 21.05
8 7.92 17.78 42.11
5 4,95
38,46 26,32
19 18.81
35 34.65
45 44.55
13 12.87
101 100.00
109

STATISTICS FOR TABLE OF A 02 BY F 1
Statistic DF Value
10:30 Friday, December 10, 1993 51
Prob
Chi-Square Likelihood Ratio Chi-Square Mantel-Haenszel Chi-Square Phi Coefficient Contingency Coefficient Cramer's V
3 3 1
4.768 4.346 1.698 0.217 0.212 0.217
0.190 0.226 0.193
Sample Size « 101 UARNING: 25X of the cells have expected counts less
than 5. Chi-Square may not be a valid test.
TABLE OF A_03 BY F_l
A_03(MARITAL STATUS) F_l(Explorer)
Frequency Percent Row Pet Col Pet
SINGLE
MARRIED
MARRIED/CHILDREN
Heavy
27 26.73 87.10 32,93
46 45.54 80.70 56.10
9 8.91
69.23 10.98
Light
4 3.96 12,90 21,05
11 10,89 19,30 57,89
4 3.96
30,77 21,05
Total 82 81.19
19 18.81
Total
31 30.69
57 56,44
13 12.87
101 100.00
STATISTICS FOR TABLE OF A 03 BY F 1
Statistic OF
Sample Size » 101
Value Prob
Chi-Square Likelihood Ratio Chi-Square Mantel-Haenszel Chi-Square Phi Coefficient Contingency Coefficient Cramer's V
2 2 1
1.934 1.855 1,822 0,138 0,137 0,138
0,380 0.396 0.177
110

10:30 Friday, December 10, 1993 5.
TABLE OF A_04 BY F_1
A_04(EDUCATION) FJ (Explorer)
Frequency Percent Row Pet Col Pet
SECONDARY
TERTIARY
VOCATIONAL/TECHN
OTHER
Total
Frequency Missing
Heavy
35 35.00 76.09 43.21
35 35.00 85.37 43.21
1 1.00
50.00 1.23
10 10.00 90.91 12.35
Light 1
1 ! 11.00 1 23.91 1 57.89 1
6 ; 6.00 j 14.63 1 31.58 1
1 1 1.00 1
50.00 1 5.26 1
1 i 1.00 9.09 5.26
81 19 81.00 19.00
= 1
Total
46 46.00
41 41.00
2 2.00
11 11.00
100 100.00
STATISTICS FOR TABLE OF A 04 BY F 1
Statistic DF Value Prob
Chi-Square Likelihood Ratio Chi-Square Mantel-Haenszel Chi-Square Phi Coefficient Contingency Coefficient Cramer's V
3 3 1
3.180 3.026 1.077 0.178 0.176 0.178
0.365 0.388 0.299
Effective Sample Size - 100 Frequency Missing = 1 UARNING: 38X of the cells have expected counts less
than 5. Chi-Square may not be a valid test.
Ill

10:30 Friday, December 10, 1993 5:
TABLE
A 05(INCOME)
OF A_05 BY F_1
F_1(£xplorer)
Frequency Percent Row Pet Col Pet
BELOU $15000
$15000 TO $25000
$25000 TO $35000
OVER $36000 1
Heavy Light
15 ! 1 15.15 93.75
1.01 6.25
18.75 1 5.26
20 20.20 83.33 25.00
4 4.04 16.67 21.05
18 1 5 18.18 78.26 22.50
27 27.27 75.00 33.75
5.05 21.74 26.32
9 9.09 25.00 47.37
Total
Frequency Missing = 2
80 80.81
19 19.19
Total
16 16.16
24 24.24
23 23.23
36 36,36
99 100,00
STATISTICS FOR TABLE OF A 05 BY F 1
Statistic DF Value Prob
Chi-Square Likelihood Ratio Chi-Square Mantel-Haenszel Chi-Square Phi Coefficient Contingency Coefficient Cramer's V
3 3 1
2,706 3,139 2,488 0,165 0,163 0.165
0.439 0.371 0.115
Effective Sample Size = 99 Frequency Missing » 2 UARNING: 38X of the cells have expected counts less
than 5. Chi-Square may not be a valid test.
112

10:30 Friday, December 10, 1993 54
TABLE OF A_07 BY F_1
A_07(INFORMATION SOURCE) F_l(Explorer)
Total
Frequency Percent Row Pet Col Pet
NULL RESPONSE
FRIENDS/ RELATIV
TELEVISION j
MAGAZINES 1
TRAVEL AGENT ]
OTHER j
1 1 1
Heavy
1 0.99
100.00 1.22
39 38.61 82.98 47.56
3 1 2.97 1
100.00 j 3.66 1
12 1 11.88 1 75.00 1 14.63 I
20 j 19.80 1 86.96 1 24.39 1
7 1 6.93 1 63.64 j 8.54 j
Light i
0 1 0.00 ! 0.00 0.00 1
8 1 7.92 j 17.02 1 42.11 j
0 1 0.00 j 0.00 j 0.00 i
4 ; 3.96 1 25.00 j 21.05 1
3 j 2.97 j 13.04 1 15.79 1
4 j 3.96 j
36.36 1 21.05 1
Total 82 81.19
19 18.81
1 0.99
47 46.53
3 2.97
16 15.84
23 22.77
11 10.89
101 100.00
STATISTICS FOR TABLE OF A_07 BY FJ
Statistic DF Value Prob
Chi-Square Likelihood Ratio Chi-Square Mantel-Haenszel Chi-Square Phi Coefficient Contingency Coefficient Cramer's V
5 5 1
4.146 4.552 0.782 0.203 0.199 0.203
0.529 0.473 0.377
Sample Size = 101 UARNING: 58X of the cells have expected counts less
than 5. Chi-Square may not be a valid test.
113

TABLE OF A 01 BY F 2
10:30 Friday, December 10, 1993 55
A_01(S£X) F_2(Organised)
Frequency Percent Row Pet Col Pet
MALE
FEMALE
Total
JHeavy jLight | Total
15
i ^5 I 14.85 I 25.00
50.00
30 29.70
26
36.59 I 63.41 50.00 ! 36.62
45 44.55 75.00 63.38
! 41 I 40.59
60 59.41
71 70.30
101 100.00
STATISTICS FOR TABLE OF A 01 BY F 2
Statistic DF Value
Sample Size = 101
TABLE OF A 02 BY F 2
Prob
Chi-Square Likelihood Ratio Chi-Square Continuity Adj. Chi-Square Mantel-Haenszel Chi-Square Fisher's Exact Test (Left)
(Right) (2-Tail)
Phi Coefficient Contingency Coefficient Cramer's V
1 1 1 1
1.566 1.551 1.060 1.550
0.125 0.124 0.125
0.211 0.213 0.303 0.213 0.929 0.152 0.269
A_02(AGE)
Frequency Percent Row Pet Col Pet
UNDER 21
22-30
31-40
40 YEARS AND
Total
1 1 1 1
!. 1
1
1 1 1 1
1
1 1 1
1 1
1
1 1 1 1 1 1
OVE j 1 1 1 1
F_2(0rganised)
leavy jl
2 ! 1.98 j
25.00 6.67 1
' i 8.91 j 25.71 1 30.00 1
13 1 12.87 1 28.89 j 43.33 1
* i 5.94 I
46.15 1 20.00 1
30 29.70
ight
6 5,94
75.00 8.45
26 25.74 74.29 36.62
32 31.68 71.11 45.07
7 6.93 53.85 9.86
71 70.30
Total
! 8 7,92
35 34.65
45 44.55
13 12.87
101 100.00
114

STATISTICS FOR TABLE OF A_02 BY F_2
Statistic DF Value
10:30 Friday, Decefflber 10, 1993 56
Prob
Chi-Square Likelihood Ratio Chi-Square Mantel-Haenszel Chi-Square Phi Coefficient Contingency Coefficient Cramer's V
3 3 1
2.051 1.933 1.326 0.142 0.141 0,142
0.562 0.587 0.249
Sample Size » 101 UARNING: 25X of the cells have expected counts less
than 5. Chi-Square may not be a valid test.
TABLE OF A_03 BY F_2
A_03(MARITAL STATUS) F_2(0rganised)
Frequency Percent Row Pet Col Pet
SINGLE
MARRIED
MARRIED/CHILDREN
Total
! fieavy
6 5,94 19,35 20,00
19 18,81 33,33 , 63,33 1
5 1 4,95 j
38.46 j 16.67 1
30 29.70
Light 1
25 1 24.75 80.65 j 35.21 j
38 1 37.62 1 66,67 j 53,52
8 1 7,92 1
61,54 1 11,27 1
71 70,30
Total
31 30,69
57 56,44
13 12.87
101 100.00
STATISTICS FOR TABLE OF A 03 BY F 2
Statistic DF
Sample Size = 101
Value Prob
Chi-Square Likelihood Ratio Chi-Square Mantel-Haenszel Chi-Square Phi Coefficient Contingency Coefficient Cramer's V
2 2 1
2.427 2.534 2.196 0.155 0,153 0,155
0.297 0,282 0,138
115

10:30 Friday, December 10, 1993 57
TABLE OF A_04 BY F_2
A_04(EDUCATION) F_2(0rganised)
Frequency Percent Row Pet Col Pet
SECONDARY
TERTIARY
VOCATIONAL/TECHN
OTHER
Heavy
16 16,00 34.78 55,17
Light
30 30.00 65.22 42,25
8 j 33 8,00 1 33,00 19.51 1 80,49 27.59 j 46.48
0 0,00 0,00 0,00
5 5,00
45,45 17.24
2 2,00
100,00 2.82
6 6.00 54.55 8.45
Total 29 29.00
71 71,00
Total
46 46.00
41 41,00
2 2,00
11 11,00
100 100,00
Frequency Missing = 1
STATISTICS FOR TABLE OF A 04 BY F 2
Statistic DF Value Prob
Chi-Square Likelihood Ratio Chi-Square Mantel-Haenszel Chi-Square Phi Coefficient Contingency Coefficient Cramer's V
3 3 1
4,803 5,359 0,008 0,219 0,214 0,219
0.187 0.147 0.929
Effective Sample Size « 100 Frequency Missing = 1 UARNING: 38X of the cells have expected counts less
than 5. Chi-Square may not be a valid test.
116

10:30 Friday, December 10, 1993 5f
TABLE OF A_05 BY F_2
A_05(INCOME) F_2(0rganised)
Frequency Percent Row Pet Col Pet Heavy Light J
BELOU $15000 1 5 1 11 |
$15000 TO $25000
$25000 TO $35000
OVER $36000
Total
Frequency Mis^ng
5.05 31.25 17.86
9 9.09
37.50 32.14
5 5.05 21.74 17.86
9 9.09
25.00 32.14
28 28.28
= 2
11.11 1 68.75 1 15.49 1
15 1 15.15 1 62.50 1 21.13 1
18 1 18.18 j 78.26 1 25.35 i
27 j 27.27 1 75.00 1 38.03
71 71.72
Total
16 16.16
24 24.24
23 23.23
36 36.36
99 100.00
STATISTICS FOR TABLE OF A 05 BY F 2
Statistic OF Value Prob
Chi-Square Likelihood Ratio Chi-Square Mantel-Haenszel Chi-Square Phi Coefficient Contingency Coefficient Cramer's V
Effective Sample Size = 99 Frequency Missing s 2
3 3 1
1.751 1.727 0.767 0.133 0.132 0.133
0.626 0.631 0.381
117

10:30 Friday, December 10, 1993 5?
TABLE OF A_07 BY F_2
A_07(INFORMATION SOURCE) F_2(0rganised)
Frequency Percent Row Pet Col Pet
NULL RESPONSE
FRIENDS/ RELATIV
TELEVISION
MAGAZINES
TRAVEL AGENT
OTHER
Total
JHeavy
! 0 ; 0.00 1 0.00 1 0.00
1 13 1 12.87 ; 27.66 1 43.33
i 2 1 1.98 1 66.67 j 6.67
I 6 1 5.94 j 37,50 j 20,00
! 6 1 5,94 j 26,09 i 20,00
1 3 1 2,97 1 27,27 1 10,00
30 29,70
ILight i
1 1 0,99 1
100,00 1 1,41 1
34 1 33.66 j 72.34 1 47.89 1
1 1 0.99 1
33.33 i 1.41 1
10 ; 9.90 1
62.50 ; 14.08 j
17 I 16.83 ; 73.91 1 23.94 1
8 ; 7.92 1
72.73 1 11.27 I
71 70.30
Total
1 0.99
47 46.53
3 2.97
16 15.84
23 22.77
11 10.89
101 100,00
STATISTICS FOR TABLE OF A_07 BY F_2
Statistic OF Value Prob
Chi-Square Likelihood Ratio Chi-Square Mantel-Haenszel Chi-Square Phi Coefficient Contingency Coefficient Cramer's V
5 5 1
3,121 3,167 0,002 0,176 0,173 0,176
0.681 0.674 0.962
Sample Size = 101 WARNING: 50X of the cells have expected counts less
than 5, Chi-Square may not be a valid test.
118

10:30 Friday, December 10, 1993 60
TABLE OF A_01 BY F_3
A_01(SEX) F_3(Active Tourist)
Frequency | Percent j Row Pet j Col Pet {Heavy {Light { Total - - - . . . . . . 4 . . . . . . . . . , • . . . - •
MALE I 9 I 32 I 41 j 8,91 I 31,68 I 40,59 I 21,95 j 78.05 I I 31.03 I 44.44 I
- - • - . . . . . . . + . . . . . . . . •
FEMALE j 20 ; 40 ; 60 I 19,80 i 39,60 I 59,41 I 33,33 I 66,67 | j 68.97 I 55,56 j .».. 4. 4.
Total 29 72 101 28,71 71,29 100,00
STATISTICS FOR TABLE OF A 01 BY F 3
Statistic DF Value
Sample Size = 101
TABLE OF A_02 BY F_3
A 02(AGE) F 3(Active Tourist)
Prob
Chi-Square Likelihood Ratio Chi-Square Continuity Adj, Chi-Square Mantel-Haenszel Chi-Square Fisher's Exact Test (Left)
(Right) (2-Tail)
Phi Coefficient Contingency Coefficient Cramer's V
1 1 1 1
1,542 1.574 1,036 1.526
-0.124 0.123 -0.124
0.214 0.210 0.309 0.217 0.154 0.930 0.266
Frequency Percent Row Pet Col Pet
UNDER 21
22-30
31-40
40 YEARS AND
JHeavy
OVE 1
3 2.97
37.50 10.34
13 12.87 37.14 44.83
10 9.90 22.22 34.48
3 2.97 23.08 10.34
ILight
i 1
5 4.95 62.50 6.94
22 21.78 62.86 30.56
35 34.65 77.78 48.61
10 9.90 76.92 13.89
! Total
8 7.92
35 34.65
45 44.55
13 12.87
Total 29 28.71
72 71.29
101 100.00
119

STATISTICS FOR TABLE OF A 02 BY F 3
Statistic OF Value
10:30 Friday, December 10, 1993 61
Prob
Chi-Square Likelihood Ratio Chi-Square Mantel-Haenszel Chi-Square Phi Coefficient Contingency Coefficient Cramer's V
3 3 1
2.645 2.628 1.907 0.162 0.160 0.162
0.450 0.453 0.167
Sample Size - 101 UARNING: 25X of the cells have expected counts less
than 5. Chi-Square may not be a valid test.
TABLE OF A_03 BY F_3
A_03(MARITAL STATUS) F_3(Active Tourist)
Frequency Percent Row Pet Col Pet
SINGLE
MARRIED
MARRIED/CHILDREN
Total
jl leavy
13 12.87 41.94 44,83
12 11,88 21,05 41.38
4 3,96
30.77 13.79
29 28.71
ILight 1
1 ,1 1 1 1 1
1
1 1 i 1 1
1 1 1
1 1 1
18 ! 17,82 58,06 j 25.00 1
45 1 44,55 1 78,95 1 62,50 j
9 I 8.91 j
69.23 1 12.50 1
72 71.29
Total
31 30.69
57 56.44
13 12.87
101 100.00
STATISTICS FOR TABLE OF A 03 BY F 3
Statistic OF
Sample Size = 101
Value Prob
Chi-Square Likelihood Ratio Chi-Square Mantel-Haenszel Chi-Square Phi Coefficient Contingency Coefficient Cramer's V
2 2 1
4.309 4,227 1,741 0,207 0,202 0,207
0.116 0,121 0,187
120

10:30 Friday, December 10, 1993 6."
TABLE OF A_04 BY F_3
A_04(EDUCATION) F_3(Active Tourist)
Frequency Percent Row Pet Col Pet
SECONDARY
TERTIARY
VOCATIONAL/TECHN
OTHER
Total
[Heavy
14 14,00 30,43 48,28
11 11,00 26,83 37,93
0 0.00 0.00 0.00
4 4.00
36.36 13.79
29 29.00
{Light {
1 1 1
32 { 32.00 j 69.57 j 45.07 1
30 1 30.00 { 73.17 { 42.25 j
2 1 2.00 1
100.00 j 2.82 I
7 1 7.00 I 63.64 1 9.86 j
71 71.00
Total
46 46.00
41 41.00
2 2.00
11 11.00
100 100.00
Frequency Missing = 1
STATISTICS FOR TABLE OF A_04 BY F_3
Statistic DF Value Prob
Chi-Square Likelihood Ratio Chi-Square Mantel-Haenszel Chi-Square Phi Coefficient Contingency Coefficient Cramer's V
3 3 1
1.246 1.788 0.008 0.112 0.111 0.112
0.742 0.618 0.929
Effective Sample Size = 100 Frequency Missing = 1 UARNING: 38X of the cells have expected counts less
than 5. Chi-Square may not be a valid test.
121

10:30 Friday, December 10, 1993
TABLE OF A_05 BY F_3
A 05(INCOH£) F 3(Active Tourist)
Frequency Percent Row Pet Col Pet
BELOU SI 5000
$15000 TO $25000
$25000 TO $35000
OVER $36000
Total
Frequency Missinj
{Heavy
'
Light Total
4 j 12 { 16 4.04 25.00
12,12 75,00
13,79 { 17,14
4 4,04 16.67 13.79
16.16
20 1 24 20.20 83.33 28,57
24.24
10 { 13 ! 23 10.10 43.48
13.13 56,52
34.48 { 18,57
11 11,11 30.56 37,93
29 29,29
2
23.23
25 1 36 25,25 69,44 35,71
36.36
70 99 70,71 100,00
STATISTICS FOR TABLE OF A 05 BY F 3
Statistic DF
Effective Sample Size = 99 Frequency Missing = 2
Value Prob
Chi-Square Likelihood Ratio Chi-Square Mantel-Haenszel Chi-Square Phi Coefficient Contingency Coefficient Cramer's V
3 3 1
4,252 4,311 0,940 0,207 0,203 0,207
0,236 0.230 0.332
122

10:30 Friday, December 10, 1993 64
TABLE
A 07(INFORMATION
OF A_07 BY F_3
SOURCE) F_3(Active Tourist)
Total
Frequency Percent Row Pet Col Pet
NULL RESPONSE
FRIENDS/ RELATIV
TELEVISION
MAGAZINES
TRAVEL AGENT
OTHER
jHeavy
0 0,00 0.00 0,00
12 11,88 25,53 41.38
1 0.99
33.33 3.45
6 ' 5,94
37,50 20,69
6 { 5,94
26,09 20,69
4 j 3,96 1
36,36 j 13,79 j
Light {
1 1 0,99 1
100,00 { 1,39 {
35 { 34.65 { 74.47 1 48.61 j
2 1 1.98 1
66.67 1 2.78 {
10 1 9.90 1 62.50 { 13.89 i
17 { 16.83 { 73.91 { 23.61 {
7 1 6,93 j 63.64 { 9.72 {
Total 29 28.71
72 71.29
1 0.99
47 46,53
3 2.97
16 15,84
23 22,77
11 10.89
101 100.00
STATISTICS FOR TABLE OF A 07 BY F 3
Statistic DF Value Prob
Chi-Square Likelihood Ratio Chi-Square Mantel-Haenszel Chi-Square Phi Coefficient Contingency Coefficient Cramer's V
Sample Size = 101 WARNING: 50X of the cells have expected counts less
than 5. Chi-Square may not be a valid test.
5 5 1
1.662 1.897 0.469 0.128 0.127 0.128
0.894 0.863 0.494
123

10:30 Friday, December 10. 1993 65
TABLE OF A_01 BY F_4
A_01(SEX) F_4(Pleasure Seeker)
Frequency j Percent { Row Pet I Col Pet {Heavy {Light { Total • •• MALE { 11 { 30 I 41
I 10.89 { 29.70 I 40.59 I 26.83 I 73.17 j I 55.00 I 37.04 I
... ---•—......^........4 FEMALE I 9 I 51 | 60
i 8.91 { 50.50 I 59.41 { 15.00 I 85.00 { { 45.00 j 62.96 |
... — ........>. ..>........4
Total 20 81 101 19.80 80.20 100.00
STATISTICS FOR TABLE OF A 01 BY F 4
Statistic DF Value
Sample Size ^ 101
TABLE OF A_02 BY F_4
A 02(AGE) F 4(Pleasure Seeker)
Prob
Chi-Square Likelihood Ratio Chi-Square Continuity Adj. Chi-Square Mantel-Haenszel Chi-Square Fisher's Exact Test (Left)
(Right) (2-Tail)
Phi Coefficient Contingency Coefficient Cramer's V
1 1 1 1
2.146 2.112 1.466 2.125
0.146 0.144 0.146
0.143 0.146 0.226 0.145 0.956 0.114 0.203
Frequency Percent Row Pet Col Pet
UNDER 21
22-30
31-40
40 YEARS AND
{Heavy
OVE !
1 0.99 12.50 5.00
7 6.93
20.00 35.00
11 10.89 24.44 55.00
1 0.99 7.69 5.00
{Light
7 6.93
87.50 8.64
28 27.72 80.00 34.57
34 33.66 75.56 41.98
12 11.88 92.31 14.81
Total 20 19.80
81 80.20
Total
8 7.92
35 34.65
45 44.55
13 12.87
101 100.00
124

STATISTICS FOR TABLE OF A 02 BY F 4
Statistic OF Value
10:30 Friday. December 10, 1993 6t
Prob
Chi-Square Likelihood Ratio Chi-Square Mantel-Haenszel Chi-Square Phi Coefficient Contingency Coefficient Cramer's V
3 3 1
2.081 2.363 0.021 0.144 0.142 0.144
0.556 0.500 0.884
Sample Size = 101 UARNING: 25X of the cells have expected counts less
than 5. Chi-Square may not be a valid test.
TABLE OF A_03 BY F_4
A 03(MARITAL STATUS) F 4(Pleasure Seeker)
Frequency Percent Row Pet Col Pet
SINGLE
MARRIED
MARRIED/CHILDREN
Total
{Heavy
I
5 4.95 16.13 25.00
13 12.87 22.81 65.00
2 1.98
15.38 10.00
20 19.80
{Light {
1
26 { 25.74 1 83.87 1 32.10 j
44 1 43.56 j 77.19 1 54.32 j
11 { 10-89 1 84.62 13.58 {
81 80,20
Total
31 30,69
57 56,44
13 12.87
101 100.00
STATISTICS FOR TABLE OF A 03 BY F 4
Statistic DF
Sample Size = 101
Value Prob
Chi-Square Likelihood Ratio Chi-Square Mantel-Haenszel Chi-Square Phi Coefficient Contingency Coefficient Cramer's V
2 2 1
0,747 0,760 0,049 0.086 0.086 0.086
0.688 0,684 0,825
125

10:30 Friday, 0ecent)er 10. 1993 67
TABLE OF A_04 BY F_4
A 04(EDUCATI0N) F 4(Pleasure Seeker)
Frequency j Percent j Row Pet 1 Col Pet {Heavy Light
SECONDARY { 9 | 37 1 9.00 37.00 { 19.57 1 80.43 { 45.00 1 46.25
TERTIARY j 9 | 32 { 9.00 32.00 { 21.95 78.05 j 45.00 j 40.00
VOCATIONAL/TECHN { 0 | 2 { 0.00 2.00
0.00 1 100.00 0.00 1 2.50
OTHER 1 2 9 j 2.00 9.00 j 18.18 81.82
10.00 11.25
Total
Frequency Missing » 1
20 20.00
I • *
80 80.00
Total
46 46.00
41 41.00
2 2.00
11 11,00
100 100,00
STATISTICS FOR TABLE OF A_04 BY F_4
Statistic DF Value Prob
Chi-Square Likelihood Ratio Chi-Square Mantel-Haenszel Chi-Square Phi Coefficient Contingency Coefficient Cramer's V
3 3 1
0,626 1,017 0.026 0.079 0.079 0,079
0,891 0,797 0.873
Effective Sample Size = 100 Frequency Missing = 1 UARNING: 38X of the cells have expected counts less
than 5. Chi-Square may not be a valid test.
126

10:30 Friday. December 10. 1993 6-
TABLE OF A_05 BY F_4
A_05(INCOME) F_4(Pleasure Seeker)
Frequency Percent Row Pet Col Pet Heavy Light
BELOU $15000 1 0 { 16
$15000 TO $25000
$25000 TO $35000
OVER $36000
0,00 0,00 0,00
16.16 100.00 20.25
7 1 17 7,07 29,17 35,00
17.17 70.83 21.52
6 1 17 6,06
26,09 17.17 73.91
30.00 1 21.52
7 7.07 19,44 35,00
29 29,29 80,56 36.71
Total 20 20,20
I - ••
79 79,80
Total
16 16.16
24 24.24
23 23,23
36 36,36
99 100,00
Frequency Missing = 2
STATISTICS FOR TABLE OF A 05 BY F 4
Statistic DF Value Prob
Chi-Square Likelihood Ratio Chi-Square Mantel-Haenszel Chi-Square Phi Coefficient Contingency Coefficient Cramer's V
3 3 1
5,754 8.787 0.836 0.241 0.234 0.241
0.124 0.032 0.361
Effective Sample Size = 99 Frequency Missing = 2 UARNING: 38X of the cells have expected counts less
than 5, Chi-Square may not be a valid test.
T)-?

10:30 Friday. December 10. 1993 6=
TABLE OF A_07 BY F_4
A 07(INFORMATION SOURCE) F 4(Pleasure Seeker)
Total
Frequency Percent Row Pet Col Pet
NULL RESPONSE
FRIENDS/ RELATIV
TELEVISION
MAGAZINES
TRAVEL AGENT
OTHER
JHeavy {Light
0 0,00 0,00 0,00
7 6,93 14,89 35,00
2 1,98
66.67 10,00
2 1,98 12,50 10,00
6 5,94
26,09 30,00
3 2,97 '
27,27 { 15,00 '
1 0,99
100,00 1,23
40 39,60 85.11 49.38
1 0,99
33,33 1,23
14 13.86 87.50 17.28
17 16.83 73.91 20.99
8 7.92
72.73 9.88
1 0.99
47 46.53
3 2,97
16 15.84
23 22,77
11 10.89
Total 20 19.80
81 101 80.20 100.00
STATISTICS FOR TABLE OF A_07 BY F_4
Statistic OF Value Prob
Chi-Square Likelihood Ratio Chi-Square Mantel-Haenszel Chi-Square Phi Coefficient Contingency Coefficient Cramer's V
5 5 1
6.605 5.794 1.249 0.256 0.248 0.256
0.252 0.327 0.264
Sample Size = 101 UARNING: 58X of the cells have expected counts less
than 5. Chi-Square may not be a valid test.
128

10:30 Friday. December 10, 1993
TABLE OF A_01 BY F_5
A_01(SEX) F_5(Sophistieate)
Frequency j Percent | Row Pet j Col Pet {Heavy {Light | Total
- -f •••-- •
MALE { 15 I 26 { 41 I 14.85 j 25.74 { 40.59 i 36.59 j 63.41 I 57.69 { 34.67 { • • •
FEMALE { 11 { 49 { 60 { 10.89 { 48.51 59.41 I 18.33 I 81.67 I { 42.31 i 65.33 {
- - - - - 4 . . . . . . . . . . . . . . . . . 4 . Total 26 75 101
25.74 74.26 100.00
STATISTICS FOR TABLE OF A_01 BY F_5
Statistic DF Value Prob
Chi-Square 1 4.245 0.039 Likelihood Ratio Chi-Square 1 4.190 0.041 Continuity Adj, Chi-Square 1 3,344 0,067 Mantel-Haenszel Chi-Square 1 4,203 0,040 Fisher's Exact Test (Left) 0,989
(Right) 3.44E-02 (2-Tail) 6.25E-02
Phi Coefficient 0.205 Contingency Coefficient 0.201 Cramer's V 0.205
Sample Size s 101
TABLE OF A_02 BY F_5
A_02(AGE) F_5(Sophisticate)
Frequency Percent Row Pet Col Pet
UNDER 21
22-30
31-40
40 YEARS AND
Total
1 1 1
(Heavy {Light
OVE j
1 1
2 j 1.98 1
25.00 j 7.69 1
9 1 8.91 { 25.71 1 34.62 1
13 I 12.87 1 28.89 j 50.00 1
2 { 1.98 j
15.38 { 7.69 {
26 25.74
Total
6 { 8 5.94 75.00 8.00
26 25.74 74.29 34.67
32 31.68 71.11 42.67
11 10.89 84.62 14.67
75 74.26
7.92
35 34.65
45 44.55
13 12,87
101 100.00
129

STATISTICS FOR TABLE OF A 02 BY F 5
Statistic DF Value
10:30 Friday, December 10, 1993 7'
Prob
Chi-Square Likelihood Ratio Chi-Square Mantel-Haenszel Chi-Square Phi Coefficient Contingency Coefficient Cramer's V
Sample Size > 101 UARNING: 25X of the cells have expected counts less
than 5. Chi-Square may not be a valid test.
3 3 1
0.965 1.043 0.117 0.098 0.097 0.098
0.810 0.791 0.732
TABLE OF A_03 BY F_5
A_03(MARITAL STATUS) F_5(Sophistieate)
Total
Frequency Percent Row Pet Col Pet
SINGLE
MARRIED
MARRIED/CHILDREN
Heavy
7 6,93 22.58 26.92
15 14.85 26.32 57.69 ,
4 { 3,96 {
30,77 1 15,38 1
Light
23 24 .76
77,42 32
41 73 56
8 69 12
.00
42 .58 .68 .00
9 91 23 00
Total 26 25.74
75 74.26
31 30,69
57 56,44
13 12,87
101 100.00
STATISTICS FOR TABLE OF A 03 BY F 5
Statistic DF
Sample Size = 101
Value Prob
Chi-Square Likelihood Ratio Chi-Square Mantel-Haenszel Chi-Square Phi Coefficient Contingency Coefficient Cramer's V
2 2 1
0.344 0,342 0.339 0.058 0.058 0,058
0.842 0.843 0.560
130

10:30 Friday. December 10, 1993 72
TABLE OF A_04 BY F_5
A_04(EDUCATION) F_5(Sophisticate)
Frequency Percent Row Pet Col Pet
SECONDARY
TERTIARY
Heavy
10 10.00 21,74 38,46
12 12.00 29.27 46.15
Light
36 36,00 78,26 48,65
29 29,00 70.73 39.19
VOCATIONAL/TECHN { 1 | 1
OTHER
1,00 50,00 3,85
3 3,00 27.27 11,54
1.00 50.00 1.35
8 8.00
72.73 10.81
Total 26 26.00
74 74.00
Total
46 46.00
41 41.00
2 2.00
11 11.00
100 100.00
Frequency Missing = 1
STATISTICS FOR TABLE OF A 04 BY F 5
Statistic DF Value Prob
Chi-Square Likelihood Ratio Chi-Square Mantel-Haenszel Chi-Square Phi Coefficient Contingency Coefficient Cramer's V
3 3 1
1.270 1.206 0.437 0.113 0.112 0.113
0.736 0.752 0.509
Effective Sample Size > 100 FrequerKy Missing > 1 UARNING: 38X of the cells have expected counts less
than 5. Chi-Square may not be a valid test.
m

10:30 Friday, December 10, 1993 T.
TABLE OF A_05 BY F_5
A_05(INCOME) F_5(Sophisticate)
Frequency Percent Row Pet Col Pet
BELOU S15000
$15000 TO $25000
$25000 TO $35000
OVER $36000
Total
(Heavy
Frequency Missing =
Light {
3 { 13 { 3.03 18.75 11.54
9 9.09
37.50 34.62
4 4.04 17.39 15.38
10 10.10 27.78 38.46
26 26.26
2
13.13 { 81.25 1 17.81 {
15 { 15.15 i 62.50 1 20.55 {
19 { 19.19 { 82.61 1 26.03 {
26 { 26.26 j 72.22 { 35.62 1
73 73.74
Total
16 16.16
24 24.24
23 23.23
36 36.36
99 100.00
STATISTICS FOR TABLE OF A_05 BY F_5
Statistic DF Value Prob
Chi-Square Likelihood Ratio Chi-Square Mantel-Haenszel Chi-Square Phi Coefficient Contingency Coefficient Cramer's V
3 3 1
3,009 3.014 0,003 0,174 0,172 0,174
0,390 0,390 0.958
Effective Sample Size = 99 Frequency Missing = 2
132

10:30 Friday, December 10, 1993 7i
TABLE OF A_07 BY F_5
A_07(INFORMATION SOURCE) F_5(Sophisticate)
Total
Frequency Percent Row Pet Col Pet
NULL RESPONSE
FRIENDS/ RELATIV
TELEVISION
MAGAZINES
TRAVEL AGENT
OTHER j
Heavy
' 1 0,99
100,00 3,85
12 11,88 25,53 46.15
2 1.98
66.67 7.69
6 1 5.94
37.50 23.08 1
4 { 3,96 j 17,39 I 15,38 1
1 { 0,99 j 9,09 ] 3.85
'Light {
0 I 0.00 { 0.00 j 0.00 1
35 { 34.65 j 74.47 { 46.67 1
1 { 0.99 1
33.33 i 1.33 {
10 1 9.90 {
62.50 1 13.33 1
19 1 18.81 { 82.61 ! 25.33 {
10 { 9.90 i
90.91 { 13.33 {
Total 26 25.74
75 74.26
1 0.99
47 46.53
3 2.97
16 15.84
23 22.77
11 10.89
101 100.00
STATISTICS FOR TABLE OF A 07 BY F 5
Statistic DF Value Prob
Chi-Square Likelihood Ratio Chi-Square Mantel-Haenszel Chi-Square Phi Coefficient Contingency Coefficient Cramer's V
5 5 1
9.106 8.864 1.708 0.300 0.288 0.300
0.105 0.115 0.191
Sample Size = 101 UARNING: 50X of the cells have expected counts less
than 5. Chi-Square may not be a valid test.
133

APPENDIX H
KOLMOGONOR SMIRNOV SAMPLE TESTING
FACTOR 1 (EXPLORER)
CATERGORY HEAVY LIGHT DIFFERENCE
SEX
Male Female
41.46 100
36.84 100.00
4.62 0
AGE
Under 21 22 - 30 31 - 40 40 Over
7.32 45.12 90.24 100
10.53 31.58 73.69
100.00
3.21 13.54 16.55 0
.'•i.fivRITAL STATUS
ingle 32.93 i-larried 89.03 Married/Children 100
21 78
100
05 .94 00
11. 10. C
88 09 )
EDUCATION
Secondary Tertiary Voc/Tech. Other
43.21 86.42 87.65 100
57.89 89.47 94.73 100.00
14 .68 3.05 7.0 0
ANNUAL TOTAL INCOME
3.3low $15,000 18.75 .1)15,000 - $25,000 43.75 $25,000 - $35,000 66.25 $36,000 Over 100.00
5.26 26.31 52.63
100,00
1 3 , 4 9 17 .44 1 3 . 6 2
0
134

FACTOR 1 (EXPLORER)
CATERGORY
INFORMATION SOURCE
null Friends/ Relatives TV Magazine Travel Agent Other
HEAVY
1.22
48.78 52.44 67.07 91,46
100
LIGHT
0
42.11 42.11 63.16 78.95 100.00
DIFFERENCE
1.22
6.67 6,67 3,91
12,51 0
135

MANUAL CALCULATION OF KOLMOGOROV SMIRNOV TESTING SAMPLE
2 FORMULA: 4D X (Nl X N2)
(Nl + N2)
SEX : 4 (,0462 X ,0462) X (1558)
101
0.131
:-.• .'E :
4 (.1655 X .1655) X (1588)
101
1.690
MivRITAL: STATUS
4 ( . 1 1 8 8 X , 1 1 8 8 ) X ( 1 5 5 8 )
1 0 1
= 0 , 8 7 0
136

MANUAL CALCULATION OF KOLMOGOROV SMIRNOV TESTING SAMPLE
2 FORMULA: 4D X (Nl X N2)
(Nl + N2)
EDUCATION : 4 (,1468 X .1468) X (1539)
100
1.326
ANNUAL TOTAL INCOME:
4 (.1744 X .1744) X (1520)
100
1.849
INFORMATION: SOURCE
4 ( . 1 2 5 1 X . 1 2 5 1 ) X (1558)
101
= 0 . 9 6 5
137

FACTOR 2 (ORGANISED TOURIST)
CATERGORY HEAVY LIGHT DIFFERENCE
SEX
Male Female
50 100
36.62 100
13.38 0
AGE
Under 21 22 - 30 31 - 40 40 Over
6.67 36.67 80.00 100
8.45 45.07 90.14
100.00
1.78 8.40
10.14 0
MARITAL STATUS
Single 20 Married 83.33 Married/Children 100
35.21 88.73 100.00
15.21 5.40 0
EDUCATION
Secondary Tertiary Voc/Tech. Other
55.17 82.76 82.76
100
42.25 88.73 91.55
100.00
12.92 5.97 8.97 0
ANNUAL TOTAL INCOME
Below $15,000 17.86 $15,000 - $25,000 50.00 $25,000 - $35,000 67.86 '36,000 Over 100
1 5 . 4 9 3 6 . 6 2 6 1 . 9 7
1 0 0 . 0 0
2 . 3 7 1 3 . 3 8
5 . 8 9 0
138

FACTOR 2 (ORGANISED TOURIST)
CATERGORY HEAVY LIGHT DIFFERENCE
INFORMATION SOURCE
Null Friends/ Relatives TV Magazine Travel Agent Other
0
43.33 50.00 70.00 90.00 100
1.14
49.03 50.71 64.79 88.73
100.00
1.14
5 0 5 1 0
70 71 21 27
139

MANUAL CALCULATION OF KOLMOGOROV SMIRNOV TESTING SAMPLE
2 FORMULA: 4D X (Nl X N2)
(Nl + N2)
SEX : 4 (.1338 X .1338) X (2130)
101
1.510
AGE:
4 (.1014 X .1014) X (2130)
101
0.867
MARITAL: STATUS
4 (.1521 X .1521) X (2130)
101
= 1.951
140

MANUAL CALCULATION OF KOLMOGOROV SMIRNOV TESTING SAMPLE
2 FORMULA: 4D X (Nl X N2)
(Nl + N2)
EDUCATION : 4 (0.1291 X 0.1292) X (2059)
100
1.374
ANNUAL TOTAL INCOME:
4 (.1338 X .1338) X (1988)
99
1.437
INFORMATION: SOURCE
4 (.0570 X .0570) X (2130)
101
= 0.274
141

FACTOR 3 (ACTIVE TOURIST)
CATERGORY HEAVY LIGHT DIFFERENCE
SEX
Male Female
31.03 100
44 .44 100
13.41 0
AGE
Under 21 22 - 30 31 - 40 40 Over
10.34 55.17
89.65 100.00
6.94 37.50 86.11
100.00
3.40 17.67 3.54 0
MARITAL STATUS
Single 44.83 Married 86.21 Married/Children 100.00
25.00 87.50 100.00
19.83 1.29 0
EDUCATION
Secondary Tertiary Voc/Tech. Other
48.28 86.21 86.21 100.00
45.07 87.32 90.14
100.00
3.21 1.11 3.93 0
ANNUAL TOTAL INCOME
Below $15,000 13.79 $15,000 - $25,000 27.58 $25,000 - $35,000 62.08 $36,000 Over 100.00
17.14 45.71 64.28
100.00
3 18 2 0
35 13 20
142

FACTOR 3 (ACTIVE TOURIST)
CATERGORY HEAVY LIGHT DIFFERENCE
INFORMATION SOURCE
Null Friends/ Relatives TV Magazine Travel Agent Other
0
41.38 44.83 65.52 86.21
100.00
1.39
50.00 52.78 66.67 90.28
100.00
1.39
8.62 7.95 1.15 4.07 0
143

MANUAL CALCULATION OF KOLMOGOROV SMIRNOV TESTING SAMPLE
2 FORMULA: 4D X (Nl X N2)
(Nl + N2)
SEX : 4 (.1341 X .1341) X (2088)
101
1.487
AGE: 4 (.1767 X .1767) X (2088)
101
2.581
MARITAL: STATUS
4 (0.1767 X .1767) X (2088)
101
= 2.581
144

MANUAL CALCULATION OF KOLMOGOROV SMIRNOV TESTING SAMPLE
2 FORMULA: 4D X (Nl X N2)
(Nl + N2)
EDUCATION : 4 (0.0393 X 0.0393) X (205 9)
100
0.127
ANNUAL TOTAL INCOME:
4 (.1813 X .1813) X (2088)
99
0.82
INFORMATION: SOURCE
4 (.0862X .0862) X (2088)
101
= 0.6144
145

FACTOR 4 (PLEASURE SEEKER)
CATERGORY HEAVY LIGHT DIFFERENCE
SEX
Male Female
55.00 100
37.04 100
17.96 0
GE
Under 21 22 - 30 31 - 40 40 Over
5 . 0 0 4 0 . 4 5 9 5 . 0 0
1 0 0 . 0 0
8 . 6 4 4 3 . 2 1 8 5 . 1 9
1 0 0 . 0 0
3 . 6 4 3 . 2 1 9 . 8 1
0
MARITAL STATUS
Single 25.00 Married 90.00 Married/Children 100.00
32.10 86.42 100.00
7.10 3.58
0
EDUCATION
Secondary Tertiary Voc/Tech. Other
45.00 90.00 90.00
100.00
46.25 86.25 88.75
100.00
1.25 3.75 1.25 0
ANNUAL TOTAL INCOME
Below $15,000 0.00 $15,000 - $25,000 35.00 $25,000 - $35,000 65.00 $36,000 Over 100.00
2 0 . 2 5 4 1 . 7 7 6 3 . 2 9
1 0 0 . 0 0
2 0 . 2 5 6 . 7 7 1 . 7 1 0
146

FACTOR 4 (PLEASURE SEEKER)
CATERGORY
INFORMATION SOURCE
0 Friends/ Relatives TV Magazine Travel Agent Other
HEAVY
0
35.00 45.00 55.00 85.10
100.00
LIGHT
1.23
50.61 51.84 69.12 90.11
100.00
DIFFERENCE
1.23
15.61 6.84
14.12 5.11 0
147

M.\NUAL CALCULATION OF KOLMOGOROV SMIRNOV TESTING SAMPLE
2 FORMULA: 4D X (Nl X N2)
(Nl + N2)
SEX : 4 (.1796 X .1796) X (1620)
101
2.06
AGE; 4 (.0981 X .0981) X (1620)
101
0.6174
MARITAL: STATUS
4 (0.0710 X.0710) X (1620)
101
= 0.323
148

MANUAL CALCULATION OF KOLMOGOROV SMIRNOV TESTING SAMPLE
2 FORMULA: 4D X (Nl X N2)
(Nl + N2)
EDUCATION : 4 ( 0 . 0 3 7 5 X 0 . 0 3 7 5 ) X (1600)
100
0 . 0 9 0
.ANNUAL TOTAL INCOME:
4 ( . 2 0 2 5 X . 2 0 2 5 ) X ( 1 5 8 0 )
99
2 . 6 1 7 7
INFORMATION: SOURCE
4 (.1561 X .1561) X (1620)
101
= 1.563
149
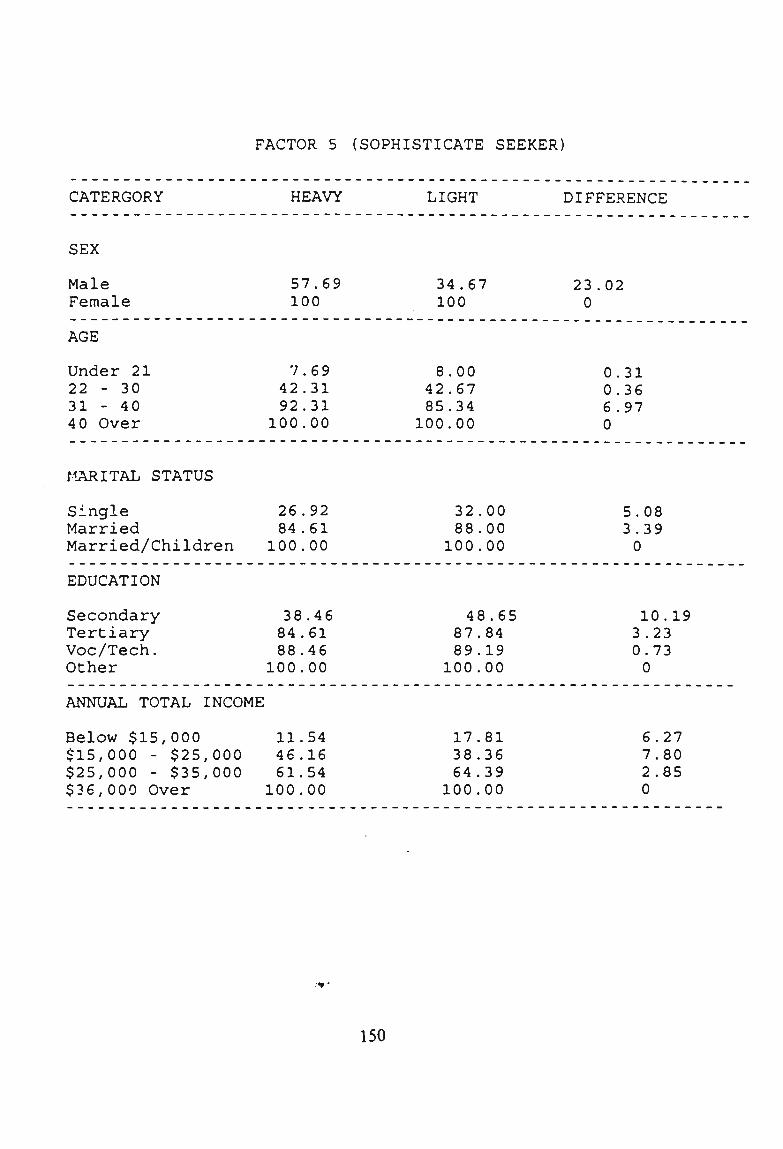
FACTOR 5 (SOPHISTICATE SEEKER)
CATERGORY HEAVY LIGHT DIFFERENCE
SEX
Male Female
57.69 100
34.67 100
23 0
02
AGE
Under 21 22 - 30 31 - 40 40 Over
7.69 42.31 92.31
100.00
8.00 42.67 85.34
100.00
0 0 6 0
31 36 97
MARITAL STATUS
Single Married Married/Children
EDUCATION
Secondary Tertiary Voc/Tech. Other
26.92 84.61
100.00
38.46 84.61 88.46
100.00
32.00 88.00
100.00
5.08 3.39 0
48.65 87.84 89.19 100.00
10.19 3.23 0.73 0
ANNUAL TOTAL INCOME
Below $15,000 11.54 $15,000 - $25,000 46.16 $25,000 - $35,000 61.54 $36,000 Over 100.00
1 7 . 8 1 3 8 . 3 6 6 4 . 3 9
1 0 0 . 0 0
6 . 2 7 7 . 8 0 2 . 8 5 0
150

FACTOR 5 (SOPHISTICATE SEEKER)
CATERGORY HEAVY LIGHT DIFFERENCE
INFORMATION SOURCE
Null Friends/ Relatives TV Magazine Travel Agent Other
3.85
50.00 57.69 80,77 96.15
100.00
0.00
46.67 48.00 61.33 86.66
100.00
3.85
3.85 9.69
19.44 9.49 0
151

MANUAL CALCULATION OF KOLMOGOROV SMIRNOV TESTING SAMPLE
2 FORMULA: 4D X (Nl X N2)
(Nl + N2)
SEX : 4 (.2302 X .2302) X (1950)
101
4.092
AGE; 4 (.0697 X .0697) X (1950)
101
0.375
MARITAL STATUS
4 (0.0595 X.0595) X (1144)
101
0.1605
0.16
152

MANUAL CALCULATION OF KOLMOGOROV SMIRNOV TESTING SAMPLE
2 FORMULA: 4D X (Nl X N2)
(Nl + N2)
EDUCATION : 4 (0.1019 X 0.1019) X (1924)
100
0.799
ANNUAL TOTAL INCOME:
4 (.0780 X .0780) X (1898)
99
0.4666
INFORMATION: SOURCE
4 ( . 1 9 4 4 X . 1 9 4 4 ) X (1950)
1 0 1
= 2 . 9 1 8
153

REFERENCE T JST
Abbey J.R., 1979, "Does Lifestyle Profiling Work?" Journal of Travel Research. Summer pp. 8-14.
Australian Bureau of Statistics (1980 & 1992) "Table 20 & 14. Short-Term Movement Arrivals of Overseas Visitors Country by Residence and Main Purpose of Joumey". Overseas Arrivals and Departures. Catalogue No. 3404.0
Australian Tourist Commission, 1983. "Holiday Market Report on South East Asia, January mi", ATC, Canberra.
Australian Tourist Commission, 1992. "Market Report - Asia", ATC - Annual Report 1992. ATC, Canberra.
Bremer A.A. (1988). "Kiasuism: A Socio-Historico-Cultural Perspective", in Catheerine Lim, O Singapore Stories in Celebration.. Time Books Intemational Singapore.
Bureau Travel Research (1991). "The Intemational Economy", Tourism and the Economy, October 1991 Report, pp. 12-13.
Carmody G. 1992 Tourism and Travel, "Aviation the Servant of Tourism, Not Visa Versa" -Australian Financial Review. 22nd April, p. 34.
Canter D. 1982, "Review: Psychology and Tourism Management", Tourism Management. Vol. 3 No. 1, September, pp. 193-195.
Census of Population Office, Department of Statistics 1991, "Census of Population 1990 -Advance Data Reseale". SNP Publishers Pty Ltd, Singapore.
Charles D. Schewe & Roger J Calantone 1978, "Psychographic Segmentation of Tourists", Journal of Travel Research. Vol. XVI No. 3, pp. 14-20.
Churchill JR.G. 1987, Marketing Research - Methodological Foundation 4th Edn. The Dryden Press, USA, pp. 218-219.
154
Cohen E. 1972, "Toward a Sociology of Intemational Tourism", Joumal of Social Research,39:l, reprinted in Mcintosh, R.W, and Goeldner C. R, (1986). "Motivation for Travel and Choosing Travel Products " Tourism:Principles. Practices. Philosophies. USA:John Wiley & Sons, Inc. pp. 183-193.
Crompton J. 1979,"Motivation for Pleasure Vacation," Annals of Tourism Research. Vol 6, pp. 408-424.
Dann G. 1977,"Anomie, Ego-Enchancement and Tourism".Annals of Tourism Research 4, pp. 184-194.
Dickman S. 1989, Tourism: An Introductory Text. Macarthur Press, Australia.
Doman M. 1993, "Singapore, Entering the Big League", Financial Review. April 22 pp. 45.
Evans, J.R. & Berman B. 1988, Understanding Consumers Marketing. MacMillan, New York.
Gee C.Y, Choy J.L & Makens J.C 1984. The Travel Industry. The AVI Publishing Company, Connecticut.
Gitelson R. 1992, "Adolescent Travel Experiences Shaping Post-Adolescent Travel Rphaviniir". Annal of Tourism Research. Vol. 19 pp. 128-130.
Gladwell N.J. 1990, "A Psychographic and Sociodemographic Analysis of State Park Inn Users", .Tnumal of Travel Research Vol. XXVIII, No. 4 Spring pp. 15-20.
Groves M. 1993, "Tourism's Myopic View", Herald Sun - Sunday. 23rd May. pp. 124.
Hair ,J.F.; Anderson, R.E & Tathen, R.L. 1990, Multivariate Data Analysis. 2nd edn, Macmillan Publishing Company, New York.
Harssel J.V. 1988, Tourism and Exploration. 2nd edn. National Publishers of Black Hill Inc. Elmsford N.Y.
Hawes D.K. 1977, "Psychographics Are Meaningful...Not Merely Interesting", Jpumal of Travel Research Vol. XV No. 4 Spring pp. 1-7.
155

Hay Asociates 1978, United JGngdom: A Study of The Intemational Travel Market, Washington D.C.:U.S. Travel Service Department of Commerce.
Holloway J.C and Plant R.V. 1988, "The Tourist Market", Marketing For Tourism. U.K.:Pitman.
Hoon Y.S. 1990, The Yen For Yen - Should it be Cured?, PATA Travel New.s. August pp.40-45.
Hudman L.E. & Hawkins D.E. 1989, Tourism In Contemporary Society - An Introductory Text. A National Publisher Book - Prentice Hall Inc, New Jersey.
Hunt J. D. 1975, "Image As A Factor In Tourism Development'. Joumal of Travel Research. Vol 13, Winter pp. 18-23.
Kass & Tinsley 1979, "Factor Analysis", Joumal of Leisure Research. Vol 11, No. 2.
Khan, Chou & Wong 1990,"Tourism Multiplier Effects on Singapore". Annals of Tourism Resegich. Vol 17 (3) pp. 408-418.
Kim P.K.I993, "Three Open London Hotel To Target At Singaporeans", The Straits Times. February 16, p.40.
King B. 1992, "Market Segments - The Australian and New Zealand Long Haul Travel Market", The Economist Intelligence - Travel and Tourism Analyst No. 6 pp. 47-53.
Kinnear & Taylor, 1976, "Psychographic: Source Additional Findings", Joumal of Marketing Research. Vol: (XIII), November, pp.422-5.
Kotler, P. 1976, Marketing Management. Analysis. Planning and Control. 3rd edn.Prentice-Hall Inc, Englewood Cliffs, New Jersey.
Kotler et al 1980, Marketing In Australia. Prentice-Hall Englewood Cliffs New Jersey.
Krippendorf J. 1987: "The Holiday Makers:Understanding The Impacts of Leigure and Travel, Heineman;London.
156

Lapin L. L. 1991, Quantitative Methods for Business Decisions with Ca.ses. 5th edn., Harcourt Brace Jovanvich Publishers, USA.
Leiper N. 1990. Tourism System and Interdisciplinary Perspective. Massey University Printery, New Zealand.
Leone S. (ed.) 1993, "Singapore New Trade Opportunities", Insight - Australia Foreign Affairs and Trade Issue. Vol 2. No. 5, April, pp. 15.
Leone S. (ed.) 1993, "Tourists Lookmg To Culture Enviroment," Insight. Australia Foreign Affairs and Trade Issue. Vol 2.No. 5 April, pp. 16.
Lewis R.C.1984, "Isolating Differences In Hotel Attributes", Cornell H. R. A. Ouarteriy. November, pp.64-77.
Lundberg, D.E. 1980, "Travel Market Research" The Tourist Business 4th edn. CBI Publishing Company, Inc. Boston, Massachusett.
Lundberg, D.E. 1985, The Tourist Business. 5th Edn, Van Nostrand Reinhold, N.Y.
Markowitz E. 1980, "Beyond Demographics: A Hard Look At Soft Data", in proceeding of Annual Conference Of Travel Research Association, pp. 147-50.
Mayo E. 1975, "Tourism & The National Parks: A Psychographic & Attitudial Study", Joumal of Travel Research. Summer 14, pp. 14-18.
Ma2jursky D. 1989, "Past Experience and Future Tourism Decisions", Annals of Tourism Research. Vol. 16, pp.333-334.
McCabe C. 1993, "ATC Plans Overseas Marketing Shake-Up", Travel Week Australia. No. 791, March p. 4.
McClave J. T. 1981, A First Course in Business Statistic. Dellen Publishing Company, USA.
Mcintosh R.W. & Goeldner C.R. 1986, Tourism: Principles, Practices. Philosophies. 5th Edn. John Wiley and Sons Inc. USA.
157

McMahon I. 1993, "Asia: The Jewel in The Crown. PATA Travel News, July p.22-24.
McMahon I. (ed.) 1993, "Taxing Problems aas ATE Opens", Travel Week Australia. June, pp.1 & 14.
Michman R.D.I991, Lifestyle Market Segmentation. Praeger Publishers, USA.
Mieczkowski Z. 1990, World Trends In Tourism and Recreation. I*eter Lang Publishing, New York.
Mill R.C. & Morrison A.M. 1985, The Tourism System: An Introductory Text: Prentice-Hall Inc, Englewood Cliffs N.J. pp. 64-65.
MillR.C. 1990, The Intemational Business. Prentice-Hall Intemational Edition. USA.
Mitchell B. 1993, "Business - Asian Money Finds An Exiciting Home In Victoria", The Sunday Age April 18, p. 15.
Mitchell B. 1993, "Real Estate - Singapore Leads Investment", The Sunday Age. May 23, pp.15.
Moffet L. 1992, "Tourism & Travel - Industry Gets A Guernsey - Suddenly It's Officially Recognised". Financial Review. April 22, pp. 27-34.
Morrison A.M. 1989, Hospitality and Travel Marketing. Dehnar Publishers, Albany New York.
Murray E. J. 1964, Motivation and Emotion. Prentice Hall, Inc. Englewood Cliffs, New Jersey.
Obsbome P. 1992, "Growing Trade In Singapore For Australia", Financial Review. 23 April, p.34.
Oliver H. M. & Chan C. F. 1990, "HongKong as a Travel Destination in South East Asia: A multi-dimension approach". Tourism Management. June, pp. 123-132.
Ooi L.P. 1992, "Outbound Markets - Malaysia and Singapore Outbound", The Economist Intelligence Unit - Travel and Tourism Analyst 4 pp. 27-47.
158

Pearce Douglas 1987, Tourism Today - A Geographical Analysis. Longman Group Limited, HongKong, p. 15.
Pearce P. L. 1980, "Tourism's Human Conflicts - Towards More Psychological Approach", Annals Tourism Research VII(l) pp. 122-126.
Pearce P. 1982, The Social Psychology of Tourist Behaviour. Oxford:Pergamon.
Peters R. S. 1960, The Concept of Motivation. Humanities Press, Routledge and Kegan Paul, New York.
Pigram J.J. & Duim J. B. 1976, "Monitoring Recreation Behaviour", Joumal of Travel Research Vol. 15 pp. 14-18.
Pizam A. & Chandraseker V. 1979.Joumal of Travel Research Index, Joumal of Travel Research. XVIII: whole Volume.
Plog S.C. 1973, "Why Destinstion Areas Rise And Fall In Popularity", Cornell H.R.A.Ouarteriv. November pp. 13-16.
Plog, S.C. 1987, "Understanding Psychographics In Tourism Research" in Ritchie J. R. & Goeldner C. R. Travel. Tourism & Hospitality Research - A Handbook for Managers and Researches. New York: John Wiley and Sons.
Plog S.C. 1991, "Leisure Travel:Marketing h A Growth Market....Again". John Wiley and Sons Inc. USA.
Rainnt J. 1990, "Meet The Asean Traveller; Singapore: Minding Their Ks' and Ss'", PATA Travel News. January pp. 18-21.
Reilly A. 1989, "Australia Market Seminar - The Asian Travel Market For Australia", Australian Tourism Commission, pp. 1-9.
Rodan G. 1992, "Singapore:Emerging Tensions In The Dictatorships Of The Middle Class", The Pacific Review. Vol. 5 No. 4, pp. 370-381.
Schul P. & Crompton J.L. 1983, "Search Behaviour of Intemational Vacationers:Travel-Specific Life-Style and Sociodemographic Variables", Joumal of Travel Research. Fall, pp.25-30.
Sekaran U. 1992. Research Methods for Business: A Skill Building Approach. 2nd edn., John Wiley & Sons Inc., Singapore.
159

Sheskin D. 1984, Statistical Tests and Experimental Design - A Guide Book, Gardner Press, Inc. New York and London, p. 47.
Shim, Siegeln and Simon 1986, The Vast - Pocket MBA. Prentice - Hall, Inc. Englewood Cliffs, New Jersey.
Sinclair M. T & Stabler M.J. 1991, The Tourism Industry: An Intemational Analysis. Redwood Press Ltd, Meelksham, U.K.
Singapore - The Newspaper 1993, "Windfalls from Aussie Dollar", October 13 p. 16.
Singapore - The Straits Times 1993, "Tourism Industry Booming In Australia', July 9 p.30.
Singapore Tourist Promotion Board 1992, "What News in Singapore?."Good Weekend -The Age Magazine.Januarv pp.6.
Siong N.P. (eds). 1992, Singapore Facts & Picture 1992. Ministry of Information and The Arts, Mentor Printers, Singapore.
SwensonC.A. 1992, Selling To A Segmented Market - The Lifestyle Approach. NTC Business Books, Lincolnwood Chicago, USA.
Stear L. 1981,"Design ofa Curriculum for Destination Studies." Annals of Tourism Research Vol 8, pp. 85-95.
Tan CL. 1990, "Travelling For That Status Symbol". PATA Travel News. March pp. 34-39.
Tan J. 1992, "Singapore 1992". Ministry of Information and Arts, Singapore National Printer Ltd, Singapore pp. 65.
Thomas G. 1987, "Stricking Out Alone", PATA Travel News. June pp. 24-26.
Thomas G. 1989, "Here Come The Singaporeans", PATA Travel News. March pp. 26-30.
Tumer L. and Ash J. 1975, The Golden Hordes - Intemational Tourism and the Pleasure Periphery. Constable and Company Ltd., Britain.
Tumer W. L. 1988, Business Statistics. Footscray Institute of Technology, Victoria.
160

Van Minden J. J.R 1987, Dictionary of Marketing Research: The Bath Press; Avon p. 136.
Van Raaij, W.F. 1986, "Consumer Research On Tourism: Mental And Behavioural Constructs", Annals of Tourism Reserach 13, pp. 1-9.
Weber S. 1989, "Psychographic Segmentation". Tourism Marketing And Management Handbook. Prentice Hall, U.K.
Wells W.D. 1975, "Psychographic: A Critical Review", Joumal of Marketing Research. Vol. XII May pp. 196-213.
Westwood M. 1993, "Japanese Show Yen For Fun In The Sun", The Australian. March, pp.3.
"Why Do People Travel?", The Cornell Hotel and Restaurant Administration Ouarteriy. Volume 11 No. 4 February 1971, pp. 2-12.
William T.G. 1982, "Psychographic Research In Consumer behaviour:Fundamentals And Strategies". West Publishing Co. Minnesota, USA, pp. 254.
Woodside A.G. & Pitts R.E. 1976, "Effects of Consumer Life Styles, Demographics and Travel Activities on Foreign and Domestic Travel Behaviour", Joumal of Travel Research. Winter 14, pp. 13-15.
Woodside A.G. & Sherrell D. 1977, "Traveler, Evoked, Inept, And Inert, Sets of Vacation Destinations". Joumal of Travel Research Vol. XVI Summer pp. 14-18.
Yuan S. & Mcdonald 1990, "Motivational Determinates Of Intemational Leisure Time", Joumal of Travel Research. Summer pp. 42-44.
Zikmund, W.G. 1991, "Sample Designs and Sampling Procedure". Exploring Marketing Research. 4th ed. USA: The Dryden Press.
161