Embed Size (px)
Citation preview
2016 PROFESSIONAL STATUS SURVEY: EXECUTIVE SUMMARY

© NSGC 2016 1
T A B L E O F C O N T E N T S
Facts About the Genetic Counseling Profession .. . . . . . . . . . . . . . . . . . . . . . . . . . . . . . . . . . 2
Introduction .. . . . . . . . . . . . . . . . . . . . . . . . . . . . . . . . . . . . . . . . . . . . . . . . . . . . . . . . . . . . . . . . . . . . . . . . . . . . . . . . . . . . . . 3
Methodology .. . . . . . . . . . . . . . . . . . . . . . . . . . . . . . . . . . . . . . . . . . . . . . . . . . . . . . . . . . . . . . . . . . . . . . . . . . . . . . . . . . . . . 4
About the NSGC ... . . . . . . . . . . . . . . . . . . . . . . . . . . . . . . . . . . . . . . . . . . . . . . . . . . . . . . . . . . . . . . . . . . . . . . . . . . . . . . 4
Work Settings .. . . . . . . . . . . . . . . . . . . . . . . . . . . . . . . . . . . . . . . . . . . . . . . . . . . . . . . . . . . . . . . . . . . . . . . . . . . . . . . . . . . 5
Specialty Areas .. . . . . . . . . . . . . . . . . . . . . . . . . . . . . . . . . . . . . . . . . . . . . . . . . . . . . . . . . . . . . . . . . . . . . . . . . . . . . . . . . 7
Primary Roles .. . . . . . . . . . . . . . . . . . . . . . . . . . . . . . . . . . . . . . . . . . . . . . . . . . . . . . . . . . . . . . . . . . . . . . . . . . . . . . . . . . . 8
Salaries .. . . . . . . . . . . . . . . . . . . . . . . . . . . . . . . . . . . . . . . . . . . . . . . . . . . . . . . . . . . . . . . . . . . . . . . . . . . . . . . . . . . . . . . . . . . 11
Benefits . . . . . . . . . . . . . . . . . . . . . . . . . . . . . . . . . . . . . . . . . . . . . . . . . . . . . . . . . . . . . . . . . . . . . . . . . . . . . . . . . . . . . . . . . . . . 12
Professional Activities . . . . . . . . . . . . . . . . . . . . . . . . . . . . . . . . . . . . . . . . . . . . . . . . . . . . . . . . . . . . . . . . . . . . . . 13
Grants .. . . . . . . . . . . . . . . . . . . . . . . . . . . . . . . . . . . . . . . . . . . . . . . . . . . . . . . . . . . . . . . . . . . . . . . . . . . . . . . . . . . . . . . . . . . . . 14
Teaching .. . . . . . . . . . . . . . . . . . . . . . . . . . . . . . . . . . . . . . . . . . . . . . . . . . . . . . . . . . . . . . . . . . . . . . . . . . . . . . . . . . . . . . . . . . 14
Job Satisfaction .. . . . . . . . . . . . . . . . . . . . . . . . . . . . . . . . . . . . . . . . . . . . . . . . . . . . . . . . . . . . . . . . . . . . . . . . . . . . . . . 15
© NSGC 2016 2
F A C T S A B O U T T H E G E N E T I C C O U N S E L I N G P R O F E S S I O N
Did you know...?
• Genetic Counselor was named one of the “25 Amazing Healthcare Support Jobs” for 2016 in an article published by U.S. News and World Report1.
• The U.S. Bureau of Labor Statistics2 projects a growth rate of 29% for genetic counseling positions over the years 2014 2024. This far exceeds the average growth rate of 7% for all occupations.
• Genetic counselors work in a variety of settings, including university medical centers, private and public hospitals/medical facilities, diagnostic laboratories, health maintenance organizations, not-for-profit organizations, and government organizations and agencies.
• Genetic counselors can work in multiple specialty areas, including prenatal, cardiovascular disease, cancer, metabolic disease, neurology, pediatrics, infertility, pharmacogenetics, genomic medicine, and others.
• Increasing demands for genetic expertise in varied fields provides genetic counselors new ways of using their training in genetic counseling. These include working in administration, research, public and professional education, web content development, public health, laboratory support, public policy, and consulting.
• The average salary for a full-time genetic counselor is $81,377 but can reach up to $250,000 depending on specialty area and experience.
• Most genetic counselors have a Master’s degree in human genetics and/or genetic counseling.
• Nine of ten genetic counselors (90%) report they are satisfied with their job.
• The National Society of Genetic Counselors (NSGC), was formed by master's level genetic counselors in 1979, eight years after the first master's degree training program graduation. NSGC now has over 3,000 members.
• The American Board of Genetic Counseling (ABGC) certifies genetic counselors. As of the date of this survey, ABGC has over 4,000 certified genetic counselors, an increase of 75% over 2006.
• The Accreditation Council for Genetic Counseling (ACGC) accredits genetic counseling training programs. As of 2016, there are 35 accredited training programs in the U.S. and Canada.
1http://money.usnews.com/money/careers/slideshows/25-amazing-health-care-support-jobs-for-2016 2http://www.bls.gov/ooh/healthcare/genetic-counselors.htm
© NSGC 2016 3
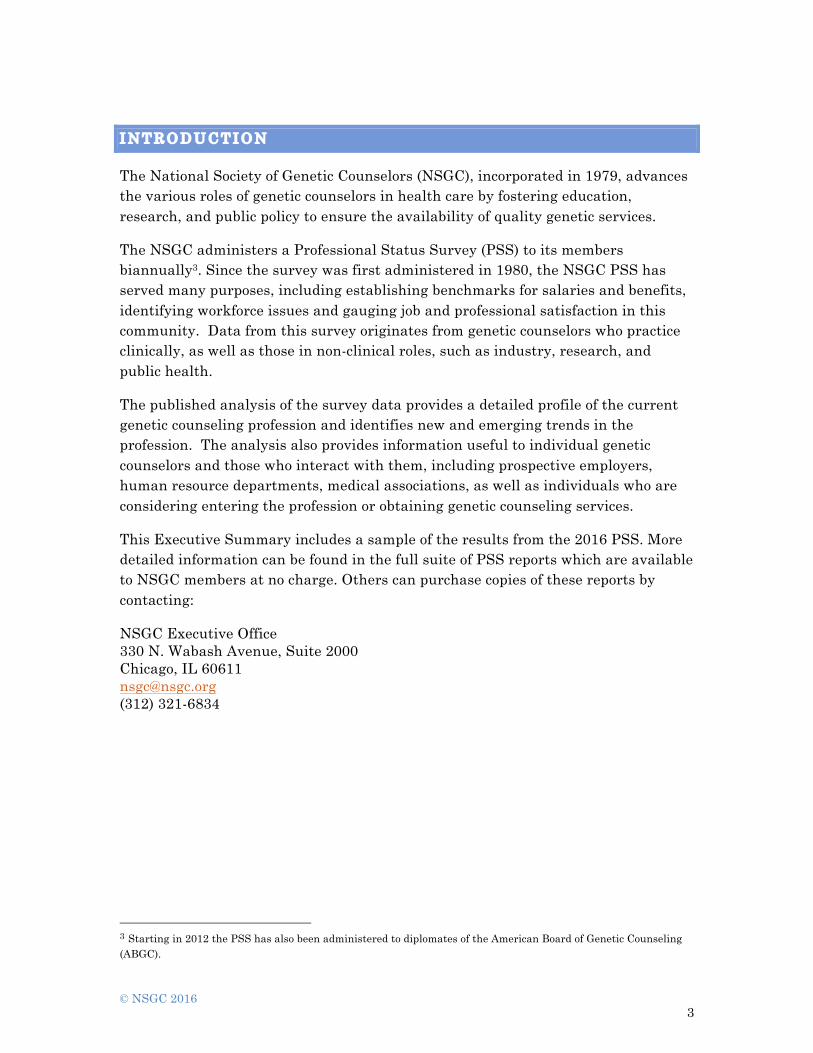
I N T R O D U C T I O N
The National Society of Genetic Counselors (NSGC), incorporated in 1979, advances the various roles of genetic counselors in health care by fostering education, research, and public policy to ensure the availability of quality genetic services.
The NSGC administers a Professional Status Survey (PSS) to its members biannually3. Since the survey was first administered in 1980, the NSGC PSS has served many purposes, including establishing benchmarks for salaries and benefits, identifying workforce issues and gauging job and professional satisfaction in this community. Data from this survey originates from genetic counselors who practice clinically, as well as those in non-clinical roles, such as industry, research, and public health.
The published analysis of the survey data provides a detailed profile of the current genetic counseling profession and identifies new and emerging trends in the profession. The analysis also provides information useful to individual genetic counselors and those who interact with them, including prospective employers, human resource departments, medical associations, as well as individuals who are considering entering the profession or obtaining genetic counseling services.
This Executive Summary includes a sample of the results from the 2016 PSS. More detailed information can be found in the full suite of PSS reports which are available to NSGC members at no charge. Others can purchase copies of these reports by contacting:
NSGC Executive Office 330 N. Wabash Avenue, Suite 2000 Chicago, IL 60611 [email protected] (312) 321-6834
3 Starting in 2012 the PSS has also been administered to diplomates of the American Board of Genetic Counseling (ABGC).

© NSGC 2016 4
M E T H O D O L O G Y
The PSS was administered to members of NSGC) and to diplomates of the American Board of Genetic Counselors (ABGC) from January 5 through February 29, 2016. A total of 2,205 completed surveys were received from the 4,048 solicited4, resulting in a 54% percent response rate from all sources5. This year’s effort to increase survey participation led to a 14% increase in respondents over 2014, resulting in the largest pool of respondents in the survey’s history.
The comprehensive survey addressed over 200 questions in the following areas:
• Respondent Background • Professional Status/Job Description • Work Environment • Salary and Benefits • Board Certification/Licensure/Credentialing • Faculty Appointments • Professional Activities • Job Satisfaction
A B O U T T H E N S G C
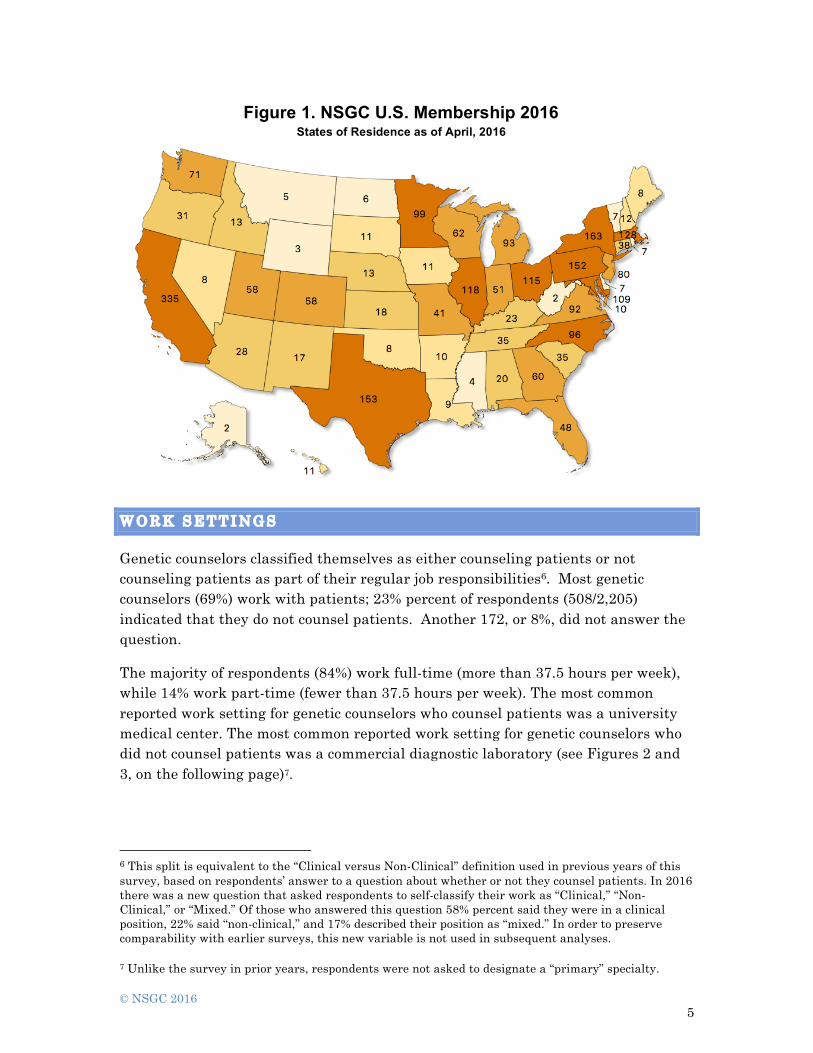
Since it was established 30 years ago, the NSGC has grown into an organization of over 3,000 dynamic individuals with expertise in genetics, counseling, education, and research. This professional organization, in partnership with genetic counseling graduate programs, continues to make concerted efforts to increase professional diversity in all areas, including educational background, ethnicity, religion, gender, and age. Many practicing genetic counselors work in a major metropolitan area; however, almost half of NSGC members serve smaller and more rural communities (see Figure 1 on the following page).
4 The final count of potential participants to the survey is 4,123, for a 53.5% response rate. That 4,123 also accounts for 104 hard bounce emails, 59 soft bounce emails, and 2 individuals who branched out of the survey because they responded they are currently students enrolled in a genetic counseling program. That means that our adjusted number of viable survey invitations was 4,048. 5Email lists were pulled from both NSGC and ABGC with duplicates removed. People with different emails listed for ABGC and NSGC may have received the survey invitation twice, so the actual number of surveys sent out to unique individuals may be slightly lower than what is reported.
© NSGC 2016 5
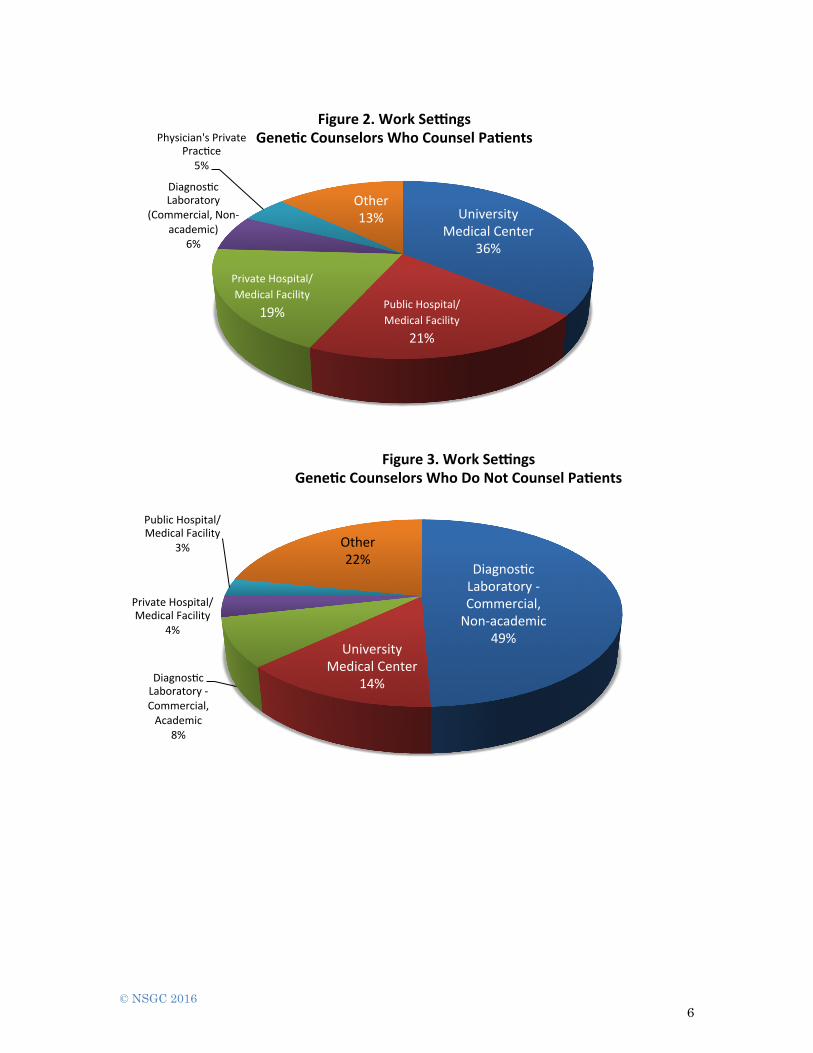
W O R K S E T T I N G S
Genetic counselors classified themselves as either counseling patients or not counseling patients as part of their regular job responsibilities6. Most genetic counselors (69%) work with patients; 23% percent of respondents (508/2,205) indicated that they do not counsel patients. Another 172, or 8%, did not answer the question.
The majority of respondents (84%) work full-time (more than 37.5 hours per week), while 14% work part-time (fewer than 37.5 hours per week). The most common reported work setting for genetic counselors who counsel patients was a university medical center. The most common reported work setting for genetic counselors who did not counsel patients was a commercial diagnostic laboratory (see Figures 2 and 3, on the following page)7.
6 This split is equivalent to the “Clinical versus Non-Clinical” definition used in previous years of this survey, based on respondents’ answer to a question about whether or not they counsel patients. In 2016 there was a new question that asked respondents to self-classify their work as “Clinical,” “Non-Clinical,” or “Mixed.” Of those who answered this question 58% percent said they were in a clinical position, 22% said “non-clinical,” and 17% described their position as “mixed.” In order to preserve comparability with earlier surveys, this new variable is not used in subsequent analyses. 7 Unlike the survey in prior years, respondents were not asked to designate a “primary” specialty.
Figure 1. NSGC U.S. Membership 2016 States of Residence as of April, 2016
© NSGC 2016 6
UniversityMedicalCenter
36%
PublicHospital/MedicalFacility
21%
PrivateHospital/MedicalFacility
19%
DiagnosAcLaboratory
(Commercial,Non-academic)
6%
Physician'sPrivatePracAce5%
Other13%
Figure2.WorkSe.ngsGene2cCounselorsWhoCounselPa2ents
DiagnosAcLaboratory-Commercial,Non-academic
49%University
MedicalCenter14%DiagnosAc
Laboratory-Commercial,Academic
8%
PrivateHospital/MedicalFacility
4%
PublicHospital/MedicalFacility
3% Other22%
Figure3.WorkSe.ngsGene2cCounselorsWhoDoNotCounselPa2ents
© NSGC 2016 7
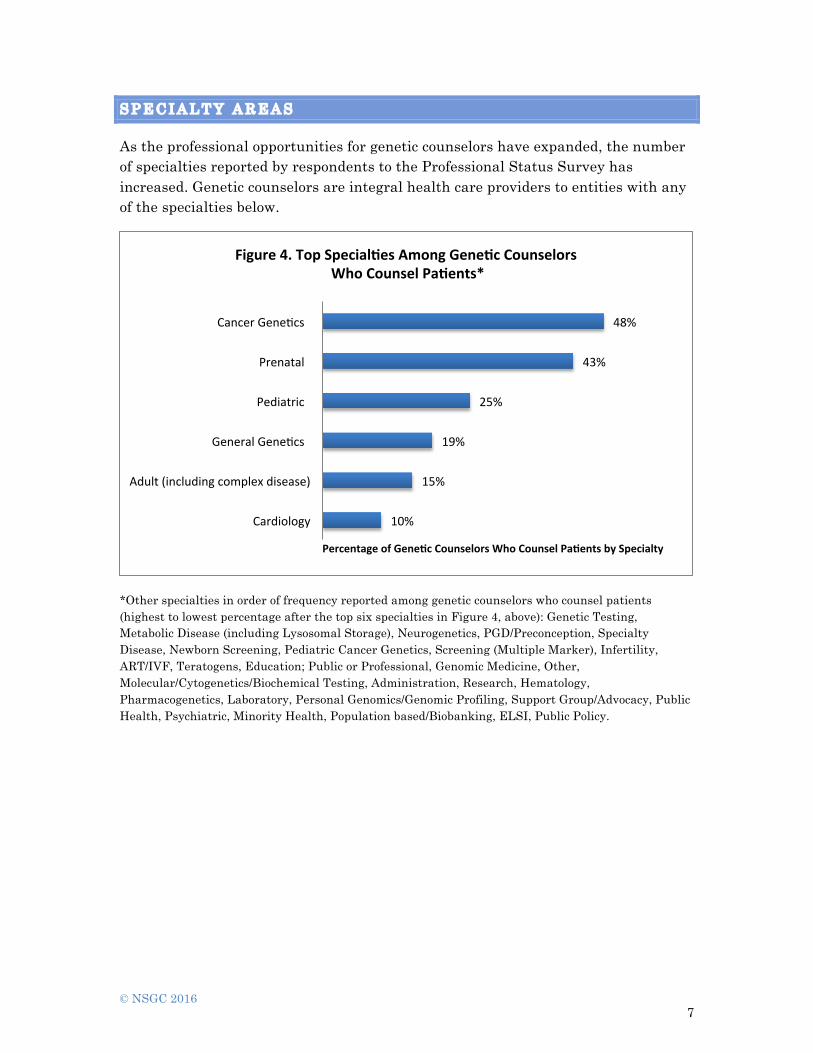
S P E C I A L T Y A R E A S
As the professional opportunities for genetic counselors have expanded, the number of specialties reported by respondents to the Professional Status Survey has increased. Genetic counselors are integral health care providers to entities with any of the specialties below.
*Other specialties in order of frequency reported among genetic counselors who counsel patients (highest to lowest percentage after the top six specialties in Figure 4, above): Genetic Testing, Metabolic Disease (including Lysosomal Storage), Neurogenetics, PGD/Preconception, Specialty Disease, Newborn Screening, Pediatric Cancer Genetics, Screening (Multiple Marker), Infertility, ART/IVF, Teratogens, Education; Public or Professional, Genomic Medicine, Other, Molecular/Cytogenetics/Biochemical Testing, Administration, Research, Hematology, Pharmacogenetics, Laboratory, Personal Genomics/Genomic Profiling, Support Group/Advocacy, Public Health, Psychiatric, Minority Health, Population based/Biobanking, ELSI, Public Policy.
10%
15%
19%
25%
43%
48%
Cardiology
Adult(includingcomplexdisease)
GeneralGeneAcs
Pediatric
Prenatal
CancerGeneAcs
PercentageofGene2cCounselorsWhoCounselPa2entsbySpecialty
Figure4.TopSpecial2esAmongGene2cCounselorsWhoCounselPa2ents*

© NSGC 2016 8
*Other specialties in order of frequency reported among genetic counselors who counsel patients (highest to lowest percentage after the top six specialties in Figure 5, above): Administration, Laboratory, Genomic Medicine, Neurogenetics, General Genetics, Cardiology, Other Adult (including complex disease), Metabolic Disease (including Lysosomal Storage), Newborn Screening, Research, Specialty Disease, Public Health, Screening (Multiple Marker), Personal Genomics/Genomic Profiling, Pharmacogenetics, Public Policy, Pediatric Cancer Genetics, ELSI, Infertility, ART/IVF, PGD/Preconception, Hematology Population based/Biobanking, Support Group/Advocacy, Teratogens, Psychiatric, Minority Health.
P R I M A R Y R O L E S
Genetic counselors have diverse professional roles. After identifying their primary specialty, respondents were asked questions about the percentage of time they spent in different roles within their specialty. Each respondent’s percentages added up to 100%. The averages are shown below.
15%
15%
19%
21%
31%
32%
Pediatric
EducaAon;PublicorProfessional
Molecular/CytogeneAcs/BiochemicalTesAng
Prenatal
GeneAcTesAng
CancerGeneAcs
PercentageofGene2cCounselorsWhoDoNotCounselPa2entsbySpecialty
Figure5.TopSpecial2esAmongGene2cCounselorsWhoDoNotCounselPa2ents*

© NSGC 2016 9
* “Other” roles in order of frequency among genetic counselors who counsel patients: Customer Liaison, Supervision/Management, Clerical, Writing, Management – Project, Advocacy, IRB/Regulatory, Marketing (of services, products, etc.), Business Development, Recruiting/Hiring, Management, Grant Writing, Sales, Management – Grant, Healthcare Administration, Financial/Contract/Budget Development or Management, Public Policy.
* “Other” roles” in order of frequency reported (highest to lowest percentage): Clinical Coordination, Marketing (of services, products, etc.), Management – Project, Business Development, Sales Management, Management – Clinical, Clinical Care, Financial/Contract/Budget Development or Management, Recruiting/Hiring, IRB/Regulatory, Healthcare Administration, Advocacy, Grant Writing, Management – Grant, Public Policy, Clerical.
75%7%
4%3%2%2%
7%
Figure6.PercentageofTimeCommiHedtoEachRole*:Gene2cCounselorsWhoCounselPa2ents
ClinicalCare
ClinicalCoordinaAon
Teaching/EducaAon/SupervisingStudents
Research/StudyCoordinator
Management-Clinical
LaboratorySupport
Other
25%
13%
8%6%5%
5%
38%
Figure7.PercentageofTimeCommiHedtoEachRole*:Gene2cCounselorsWhoDoNotCounsel
Pa2entsLaboratorySupport
CustomerLiaison
Teaching/EducaAon/SupervisingStudentsSupervision/Management
Research/StudyCoordinator
WriAng
Other

© NSGC 2016 10
Twenty-two percent of respondents (409/2,187) hold a faculty appointment. About two-thirds of these faculty appointments are at the place of employment and the remainder are appointments at other institutions. Only 11 of the faculty members reported being in a tenure track appointment.
*“Other” faculty positions (survey write-ins) included: Adjunct Faculty, Adjunct Professor, Adjunct Assistant Professor, Adjunct Associate Professor, Adjunct Clinical Assistant Professor, Assistant in Medicine, Senior Associate Professor, and Core Faculty.
0.4%0.4%0.8%1.2%1.2%2%3%
5%5%
7%9%
13%13%
19%20%
ResearchAssociate/Assistant/ProfessorResearchScienAst/InvesAgator
PreceptorProfessor
ClinicalProfessorVolunteerFaculty
ClinicalAssociateProfessorAssociateProfessor
AffiliateFacultyClinicalAssistantProfessor
Other*ClinicalInstructor/Lecturer
AssistantProfessorAdjunctInstructorInstructor/Lecturer
Figure8.FacultyPosi2ons

© NSGC 2016 11
S A L A R I E S
Specific salary information for full-time genetic counselors is available through the NSGC by viewing the “Salary and Benefits Report.” Salary information is segmented by clinical and non-clinical genetic counselors using the following variables:
• Gender • Region • State/Province • Years of Experience • Region by Years of Experience • Specialty Areas • Specialty Areas by Years of Experience • Work Setting • Job Classification • Earned Degrees • Faculty Titles • Certification Status • Licensure • Major Metropolitan Areas
The Salary & Benefits Report provides detailed analyses of salaries in the genetic counseling profession. The report also provides information about per diem and hourly rates, bonuses and commissions, average raises and extra income, benefits, vacation time, conference funding and employer-funded extras for genetic counselors.

© NSGC 2016 12
B E N E F I T S
The table below shows how often employers provided the following benefits to full-time genetic counselors. More detailed information about benefits for part-time workers is provided in the Salary and Benefits Report.
Table1.Benefitsprovidedbyemployer:Full-TimeGeneticCounselors
TotalN %
Healthinsurance 1,966 93%Dentalinsurance 1,918 90%Lifeinsurance 1,735 82%Disability(shortorlongterm)insurance 1,696 80%Visionplan 1,700 80%Education/Conferencefunding 1,665 78%Retirementsavings(withemployermatch) 1,548 73%Pre-taxexpenseaccounts(childcare,medical) 1,355 64%Accidentaldeathanddismembermentinsurance 1,242 58%EmployeeAssistanceProgram 951 45%Wellness 939 44%Paidmaternityleave 741 35%Tuitionreimbursement 740 35%Legalassistance 518 24%Parking 457 22%Pension 452 21%Retirementsavings(withoutemployermatch) 447 21%Cellphone/planreimbursement 363 17%Stockoptions/Employeestockpurchaseplan 303 14%Transportation 286 13%Gymmembership 265 12%Backupdaycare/sickchilddaycare 171 8%Profitsharing 129 6%Other* 78 4%Noneoftheabove 50 2%Total 2125 100%
“Other” benefits (survey write-ins) included: Discount programs, car allowance, commuter credit, discretionary spending account, college tuition reimbursement, clothing allowance, relocation reimbursement, pet insurance, paid maternity leave, onsite subsidized daycare, onsite subsidized healthcare and professional memberships.
© NSGC 2016 13
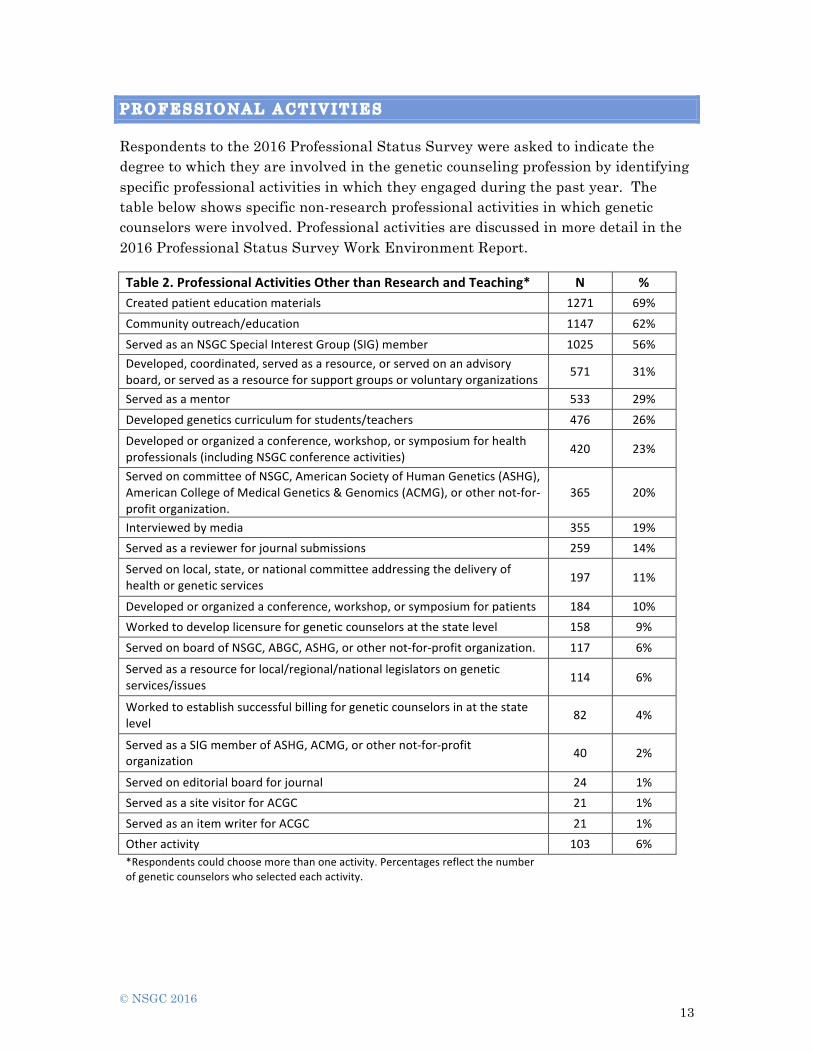
P R O F E S S I O N A L A C T I V I T I E S
Respondents to the 2016 Professional Status Survey were asked to indicate the degree to which they are involved in the genetic counseling profession by identifying specific professional activities in which they engaged during the past year. The table below shows specific non-research professional activities in which genetic counselors were involved. Professional activities are discussed in more detail in the 2016 Professional Status Survey Work Environment Report.
Table2.ProfessionalActivitiesOtherthanResearchandTeaching* N %Createdpatienteducationmaterials 1271 69%
Communityoutreach/education 1147 62%
ServedasanNSGCSpecialInterestGroup(SIG)member 1025 56%Developed,coordinated,servedasaresource,orservedonanadvisoryboard,orservedasaresourceforsupportgroupsorvoluntaryorganizations
571 31%
Servedasamentor 533 29%
Developedgeneticscurriculumforstudents/teachers 476 26%
Developedororganizedaconference,workshop,orsymposiumforhealthprofessionals(includingNSGCconferenceactivities)
420 23%
ServedoncommitteeofNSGC,AmericanSocietyofHumanGenetics(ASHG),AmericanCollegeofMedicalGenetics&Genomics(ACMG),orothernot-for-profitorganization.
365 20%
Interviewedbymedia 355 19%Servedasareviewerforjournalsubmissions 259 14%
Servedonlocal,state,ornationalcommitteeaddressingthedeliveryofhealthorgeneticservices 197 11%
Developedororganizedaconference,workshop,orsymposiumforpatients 184 10%Workedtodeveloplicensureforgeneticcounselorsatthestatelevel 158 9%
ServedonboardofNSGC,ABGC,ASHG,orothernot-for-profitorganization. 117 6%
Servedasaresourceforlocal/regional/nationallegislatorsongeneticservices/issues 114 6%
Workedtoestablishsuccessfulbillingforgeneticcounselorsinatthestatelevel
82 4%
ServedasaSIGmemberofASHG,ACMG,orothernot-for-profitorganization 40 2%
Servedoneditorialboardforjournal 24 1%ServedasasitevisitorforACGC 21 1%
ServedasanitemwriterforACGC 21 1%Otheractivity 103 6%*Respondentscouldchoosemorethanoneactivity.Percentagesreflectthenumberofgeneticcounselorswhoselectedeachactivity.

© NSGC 2016 14
G R A N T S
The percentage of genetic counselors reporting they received grant funding (between January 2014 and December 2015) decreased slightly from 7.4% in the 2014 PSS to 6.7% in the 2016 PSS (p<.05). This finding was also evident in the 2014 PSS, at which time a larger decrease from the previous PSS was noted (10% in the 2012 PSS to 7.4% in the 2014 PSS, p<.01).
Of the 136 who received grant funding, 97 (71%) reported their funding in dollar amounts. The grants awarded ranged from $200 to $12 million.
T E A C H I N G
The majority of PSS respondents reported involvement in teaching and education, primarily of current or training genetic counselors, physicians, and other health professionals.
Table3.AudiencesofGeneticCounselorTeachingandEducationActivities* N %
Geneticcounselors/students 1,452 72%Physicians/medicalstudents/residents/fellows 1,319 65%Nurses/nursingstudents 519 26%Otherhealthprofessionals 446 22%Undergraduatestudents 418 21%Laboratoryprofessionals/technicians/residents/fellows 328 16%Communityorganizations(includingchurches)/laypublic 272 14%PhysicianAssistants/students 266 13%Kindergarten-12thgrade 252 13%Advocacy/supportgroups 247 12%Graduatestudentsotherthangeneticcounselingstudents 223 11%Salesteam 222 11%Businessorothernon-healthprofessionals 116 6%None 113 6%Socialworkers/students 93 5%Otherteachingaudience 37 2%
*Respondentscouldchoosemorethanoneteachingaudience.

© NSGC 2016 15
J O B S A T I S F A C T I O N
Nine of ten genetic counselors (1,952/2,1768; 90%) reported they were satisfied with their job. Respondents were most satisfied with the professional opportunities that were associated with their work including scientific content, learning opportunities, counseling patients (for those who counseled patients as part of their job), and the opportunity for personal growth.
Respondents expressed less satisfaction with their professional opportunities as they related to career growth, particularly opportunities for advancement and earning potential (Figure 9).
More details are available in the Professional Satisfaction Report, available through the NSGC. The report examines the various facets of satisfaction with the genetic counseling profession.
8 2,176 respondents answered the question about their job satisfaction.
41%
41%
64%
65%
70%
72%
88%
92%
95%
96%
59%
59%
73%
73%
71%
75%
86%
93%
55%
94%
0% 20% 40% 60% 80% 100% 120%
EarningpotenAal
Opportunityforadvancement
Respectfrombusiness/othercommuniAes
Opportunitytodevelop/administerprograms
Respectfrommedicalcommunity
Professionalgrowth
Personalgrowth
LearningopportuniAes
PaAentcontact/counseling
ScienAficcontent
PercentofGeneAcCounselorswhowere"SaAsfied"or"VerySaAsfied"
Figure9.Gene2cCounselors'Sa2sfac2onwithVariousAspectsoftheGene2cCounselingProfession
DoesNotCounselPaAents CounselsPaAents

© NSGC 2016 16
Copies of more detailed reports from the 2016 PSS can be obtained by contacting:
NSGC Executive Office 330 N. Wabash Avenue, Suite 2000
Chicago, IL 60611 [email protected] (312) 321-6834