1
Treatment Group mCD11c F4/80 Transgene expression T cell marker expression J ROI gene expression ROI gene expression Key to Treatment Group: “c” = CAR-T alone, “cv” = CAR-T+NG-347 Chemokine genes (nCounter) N T-SIGn cancer gene therapy and anti-EGFR CAR-T cells synergize in combination therapy to clear A549 lung tumor xenografts and lung metastases in NSG mice Olmo Sonzogni 1 , Daniel Zak 1 , Katy West 2 , Rochelle Lear 2 , Alice Muntzer 2 , Brian R. Champion 2 and James B. Rottman 1 BACKGROUND AND HYPOTHESIS Background CAR-T cells are emerging as powerful treatments for hematologic malignancies but are not yet effective for solid tumors due to many challenges that include: Physical barriers that render the tumor difficult to infiltrate by CAR-T Immunosuppressive tumor microenvironment (TME) T-SIGn (Tumor-Specific Immuno-Gene Therapy) viral vectors are derived from the oncolytic adenovirus enadenotucirev (EnAd) that are “armed” with transgenes. Dosed systemically and replicate exclusively in tumor cells Deliver transgene payloads selectively into TME Currently being evaluated in multiple clinical trials Hypothesis: T-SIGn vectors will enhance CAR T efficacy through direct tumor lysis and: 1. Stimulation of the host innate immune response, thus promoting production of proinflammatory cytokines and leukocyte recruitment 2. The release of tumor neoantigens, thus promoting activation of the adaptive immune system through epitope spreading 3. “Reprogramming” of the tumor microenvironment by directly delivering chemoattractant/immunostimulatory transgene molecules to further recruit and activate innate and adaptive immunity Fig. 1. Schematic summary of potential T- SIGn and CAR-T synergy and interactions with the endogenous immune system to fight cancer. Agents : CAR-T->human EGFR target human T cells, costimulatory molecule 4-1BB and CD3. T-SIGn vectors: NG-347 (CD80, MIP1a, IFNa transgenes); NG-641 (CXCL9 and 10, IFNa, hFAP-TAc*); EnAd (unarmed T-SIGn vector) (*hFAP-TAc is not active in mouse). (1) T-SIGn REPROGRAMMING OF THE XENOGRAFT TUMOR MICRO-ENVIRONMENT Digital spatial profiling (DSP) transcriptional analysis of xenografts from mice treated with the T- SIGn virus NG-347 demonstrates TME rewiring towards a proinflammatory environment Fig. 2. A Samples for DSP analysis. B DSP technology https://www.nanostring.com/products/geomx-digital-spatial-profiler/geomx-dsp-overview/ A B C D E overview (Nanostring, Inc.). C Xenograft regions of interest (ROI) selected for gene expression analysis from an NG-347-treated mouse. D Heatmap & enriched pathway signatures of 110 significantly induced genes in NG-347 ROIs vs. controls. E Expression profiles of representative IFN response and antigen presentation genes, stratified by virus transgene expression. AACR 2021; Poster # 1582 This study was sponsored by bluebird bio and PsiOxus Therapeutics 1 Bluebird bio, Cambridge, MA, USA; 2 PsiOxus Therapeutics, Oxfordshire, United Kingdom 0 10 20 30 40 0 200 400 600 Days post treatment start Tumor Volume (mm 3 ) C. [email protected] B. [email protected] J. [email protected] I. [email protected] 100 H. NG347-Veh A. Veh-Veh CAR-T cell dose 25.2e6 E (2) T-SIGn FOLLOWED BY CAR-T CELLS RESULTS IN SYNERGISTIC ANTI-TUMORAL RESPONSE 0 10 20 30 40 0 200 400 600 Days post treatment start Tumor Volume (mm 3 ) G. [email protected] F. [email protected] J. [email protected] I. [email protected] H. NG347-Veh A. Veh-Veh 100 CAR-T cell dose 4.2e6 C 0 10 20 30 40 0 200 400 600 Days post treatment start Tumor Volume (mm 3 ) E. [email protected] D. [email protected] J. [email protected] I. [email protected] H. NG347-Veh A. Veh-Veh 100 CAR-T cell dose 12.6e6 D IHC Adenovirus protein revealing level of infection in the xenograft at CAR-T day (D6) A B Figure 3. A Schema summarizing the experimental procedure. A549 cells were injected on the flank of NSG mice and allowed to grow until tumor volumes reached ~100mm 3 (D0). Mice were then randomized and injected IV with NG-347 at D0 and D3 followed by CAR-T cells at D6. B IHC staining for adenovirus capsid at D6 (CAR-T administration day). C-E Biweekly tumor volume measurements reveal strong efficacy of the NG-347+CAR-T combination, even at CAR-T cells doses that are completely ineffective (C, D) or partially effective (E) when used as single agent. Veh=Vehicle, IV=intravenously, UTD=untransduced T cells, D=day Combining T-SIGn NG-347 with EGFR CAR-T cells yields synergistic anti-tumor activity D0 (~100mm 3 ) K In this study, we assess anti-tumor synergy in the A549 xenograft model between the T-SIGn oncolytic virus and an anti-EGFR CAR-T Immunostimulatory T-SIGn transgene cargo plays a critical role in the anti-tumor synergy between EGFR CAR-T and NG-347 0 10 20 30 40 0 200 400 600 Days post treatment start Tumor Volume (mm 3 ) A. Veh-Veh H. EnAd-CAR-T@1e6 I. NG-347-CAR-T@1e6 J. NG-641-CAR-T@1e6 100 T-SIGn+1e6 CAR-T cells 0 10 20 30 40 0 200 400 600 Days post treatment start Tumor Volume (mm 3 ) A. Veh-Veh B. EnAd-Veh C. NG-347-Veh D. NG-641-Veh 100 T-SIGn+Vehicle 0 10 20 30 40 0 200 400 600 Days post treatment start Tumor Volume (mm 3 ) A. Veh-Veh K. EnAd-UTD@4e6 L. NG-347-UTD@4e6 M. NG-641-UTD@4e6 100 T-SIGn+4e6 UTD T cells D0 (~100mm 3 ) Figure 4. To assess the contribution of the immunostimulatory transgene cargo to the anti-tumor synergy of the NG-347+CAR-T combination, the A549 xenograft experiments were repeated with different T-SIGn variants. As before, NSG mice were inoculated with A549 cells and once the tumors reached ~ 100mm 3 animals were randomized and injected IV with vehicle (blue) or (green) NG-347 (which expresses IFNa, MIP1a, CD80), (purple) NG-641 (which expresses CXCL9/ 10, IFNa, inactive hFAP-TAc*) or (red) EnAd (no transgene) at D0 and D3. At D6 either vehicle (B), UTD (C), or CAR-T cells at 4e6 (D) or 1e6 (E) were administered. CAR-T cells only increased the efficacy of the T-SIGn viruses that expressed immunostimulatory transgenes (NG-347 and NG-641). A B C 0 10 20 30 40 0 200 400 600 Days post treatment start Tumor Volume (mm 3 ) A. Veh-Veh E. EnAd-CAR-T@4e6 F. NG-347-CAR-T@4e6 G. NG-641-CAR-T@4e6 100 T-SIGn+4e6 CAR-T cells D E (4) ROLE OF T-SIGn TRANSGENE CARGO IN THE SYNERGISTIC ANTITUMOR ACTIVITY OF THE NG-347+CAR-T COMBINATION Transcriptional analysis of xenografts at D13 (D7 post CAR-T) demonstrates robust NG-347-driven immune cell recruitment and activation within the xenograft, providing a mechanistic basis for the enhanced efficacy observed in the mice treated with the NG-347+CAR-T combination (3) T-SIGn VECTORS ENHANCE ACTIVATION OF CAR-T CELLS RESULTING IN ENHANCED EFFICACY AGAINST PRIMARY TUMORS AND METASTASES -20 20 40 60 0 200 400 600 Days post treatment start Tumor Volume (mm 3 ) 036 100 D. Veh-CAR-T@12e6 H. NG-347-Veh J. NG-347-UTD@12e6 A. Veh-Veh I. Veh-UTD@12e6 H. NG-347-Veh E. NG-347-CAR-T@12e6 J. NG-347-UTD@12e6 A. Veh-Veh I. Veh-UTD@12e6 D. Veh-CAR-T@12e6 0 5 10 15 20 25 30 35 40 Metastatic Foci / Animal C D13 # Lung Metastatic Foci detected H. NG-347-Veh E. NG-347-CAR-T@12e6 J. NG-347-UTD@12e6 A. Veh-Veh I. Veh-UTD@12e6 D. Veh-CAR-T@12e6 0 5 10 15 20 40 60 80 Metastatic Foci / Animal D52 D38 D38 D30 End points D CAR-T cells dose 12e6 NG-347 genome and transgene expression in D13 FFPE samples A E F B G L Figure 4. A Experimental procedure. Mice were euthanized at D13 (7 days post CAR-T, n=3/group) for RT-qPCR Data NG347-Veh NG347-UTD NG347-CAR-T Veh-Veh Veh-UTD Veh-CAR-T 10 1 10 2 10 3 10 4 10 5 10 6 10 7 Copies IFN cDNA/reaction NG347-Veh NG347-UTD NG347-CAR-T Veh-Veh Veh-UTD Veh-CAR-T 10 1 10 2 10 3 10 4 10 5 10 6 10 7 Copies Penton cDNA/reaction NG347-Veh NG347-UTD NG347-CAR-T Veh-Veh Veh-UTD Veh-CAR-T 10 1 10 2 10 3 10 4 10 5 10 6 10 7 Copies CD80_2A cDNA/reaction NG347-Veh NG347-UTD NG347-CAR-T Veh-Veh Veh-UTD Veh-CAR-T 10 1 10 2 10 3 10 4 10 5 10 6 10 7 Copies MIP1_2A cDNA/reaction NG-347 Transgenes CD80-2A MIP1a-2A Penton IFNa2 Virus Capsid Protein H I The T-SIGn family of armed oncolytic adenoviruses is currently being evaluated in human clinical trials (administered to more than 150 patients) The combination of T-SIGn + anti-EGFR CAR T cells showed a synergistic effect by clearing A549 xenografts and inhibiting lung metastases even at CAR T cell doses that were found completely inefficacious as single therapy (Fig.3&4) Transcriptional analysis of the xenografts reveal the role of the T-SIGn vector in preparing the niche for T cells activation by rewiring the TME toward a more stimulatory/T cell friendly environment (Fig.2) resulting in a strong activation signature within the T cell compartment and recruitment of innate immune cells (Fig.3). Inflammatory transgene expression delivery by the T-SIGn virus was found to be essential for the enhanced efficacy of the CAR-T cells/T-SIGn combination (Fig.4) T-cell activation genes (nCounter) M DSP Image NG-347+CAR-T Morphology markers: mCD11b, CD45, DNA CAR-T NG347+CAR-T mCD11b CD45 DNA CONCLUSIONS Watanabe, N. et al. (2020). Molecular Therapy, 29(2). https://doi.org/10.1016/j.ymthe.2020.10.023 transcriptional analysis (E to N), confirming synergistic impact of NG-347+CAR-T on tumor growth (B), and assessing metastasis (C & D). (C) D13 or (D) endpoint quantification of metastatic foci spontaneously arising from sub Q A549 primary tumors indicates synergistic anti-metastases impact of NG-347+CAR-T. Endpoint was defined by primary tumor burden and is indicated on top of the columns. Lung metastases were quantified by enumeration of foci detected by pan-keratin IHC on a single cross-section across all lung lobes. E Representative xenograft ROIs from a NG-347+CAR-T treated mouse selected for DSP analysis. F Correlations between NG-347 transgenes (left) and T cell markers (right) allow stratification of ROIs in terms of NG-347 transgene & T cell marker gene expression (G). H Correlation (99%CI) between T cell markers and mouse innate genes shows co-recruitment of the compartments for the NG-347+CAR-T treated xenografts but not for CAR-T cells alone. I Representative images showing co-recruitment of T cells (CD45) and mouse innate cells (CD11b) for NG347+CAR-T (left) but not for CAR-T alone (right). J DSP results showing normalized counts for F4/80 (upper panel, mouse macrophages)) and mCD11c (lower panel, mouse dendritic cells) for the T cells/Virus groups defined in G. Notably categories with med to high T cells and virus show higher F4/80 and CD11c counts. K Differential expression and pathway enrichment analysis of stratified ROI groups reveals robust innate immune and T cell activation in T cell infiltrated ROIs expressing NG-347 transgenes. L Detection of viral capsid and transgene mRNAs by RT-PCR on the D13 samples. M and N nCounter analysis of whole xenograft slides confirms DSP results showing robust T cell (M) and chemokines (N) gene up-regulation in xenografts from mice treated with the NG-347+CAR-T combination. ROI Groups Control NG-347 Log2 fold-change compared to average of “No Virus/Low T cells” group for Vehicle+CAR-T

PsiOxus AACR 2021 Poster

  • Upload
    others

  • View
    4

  • Download
    0

Embed Size (px)

Citation preview

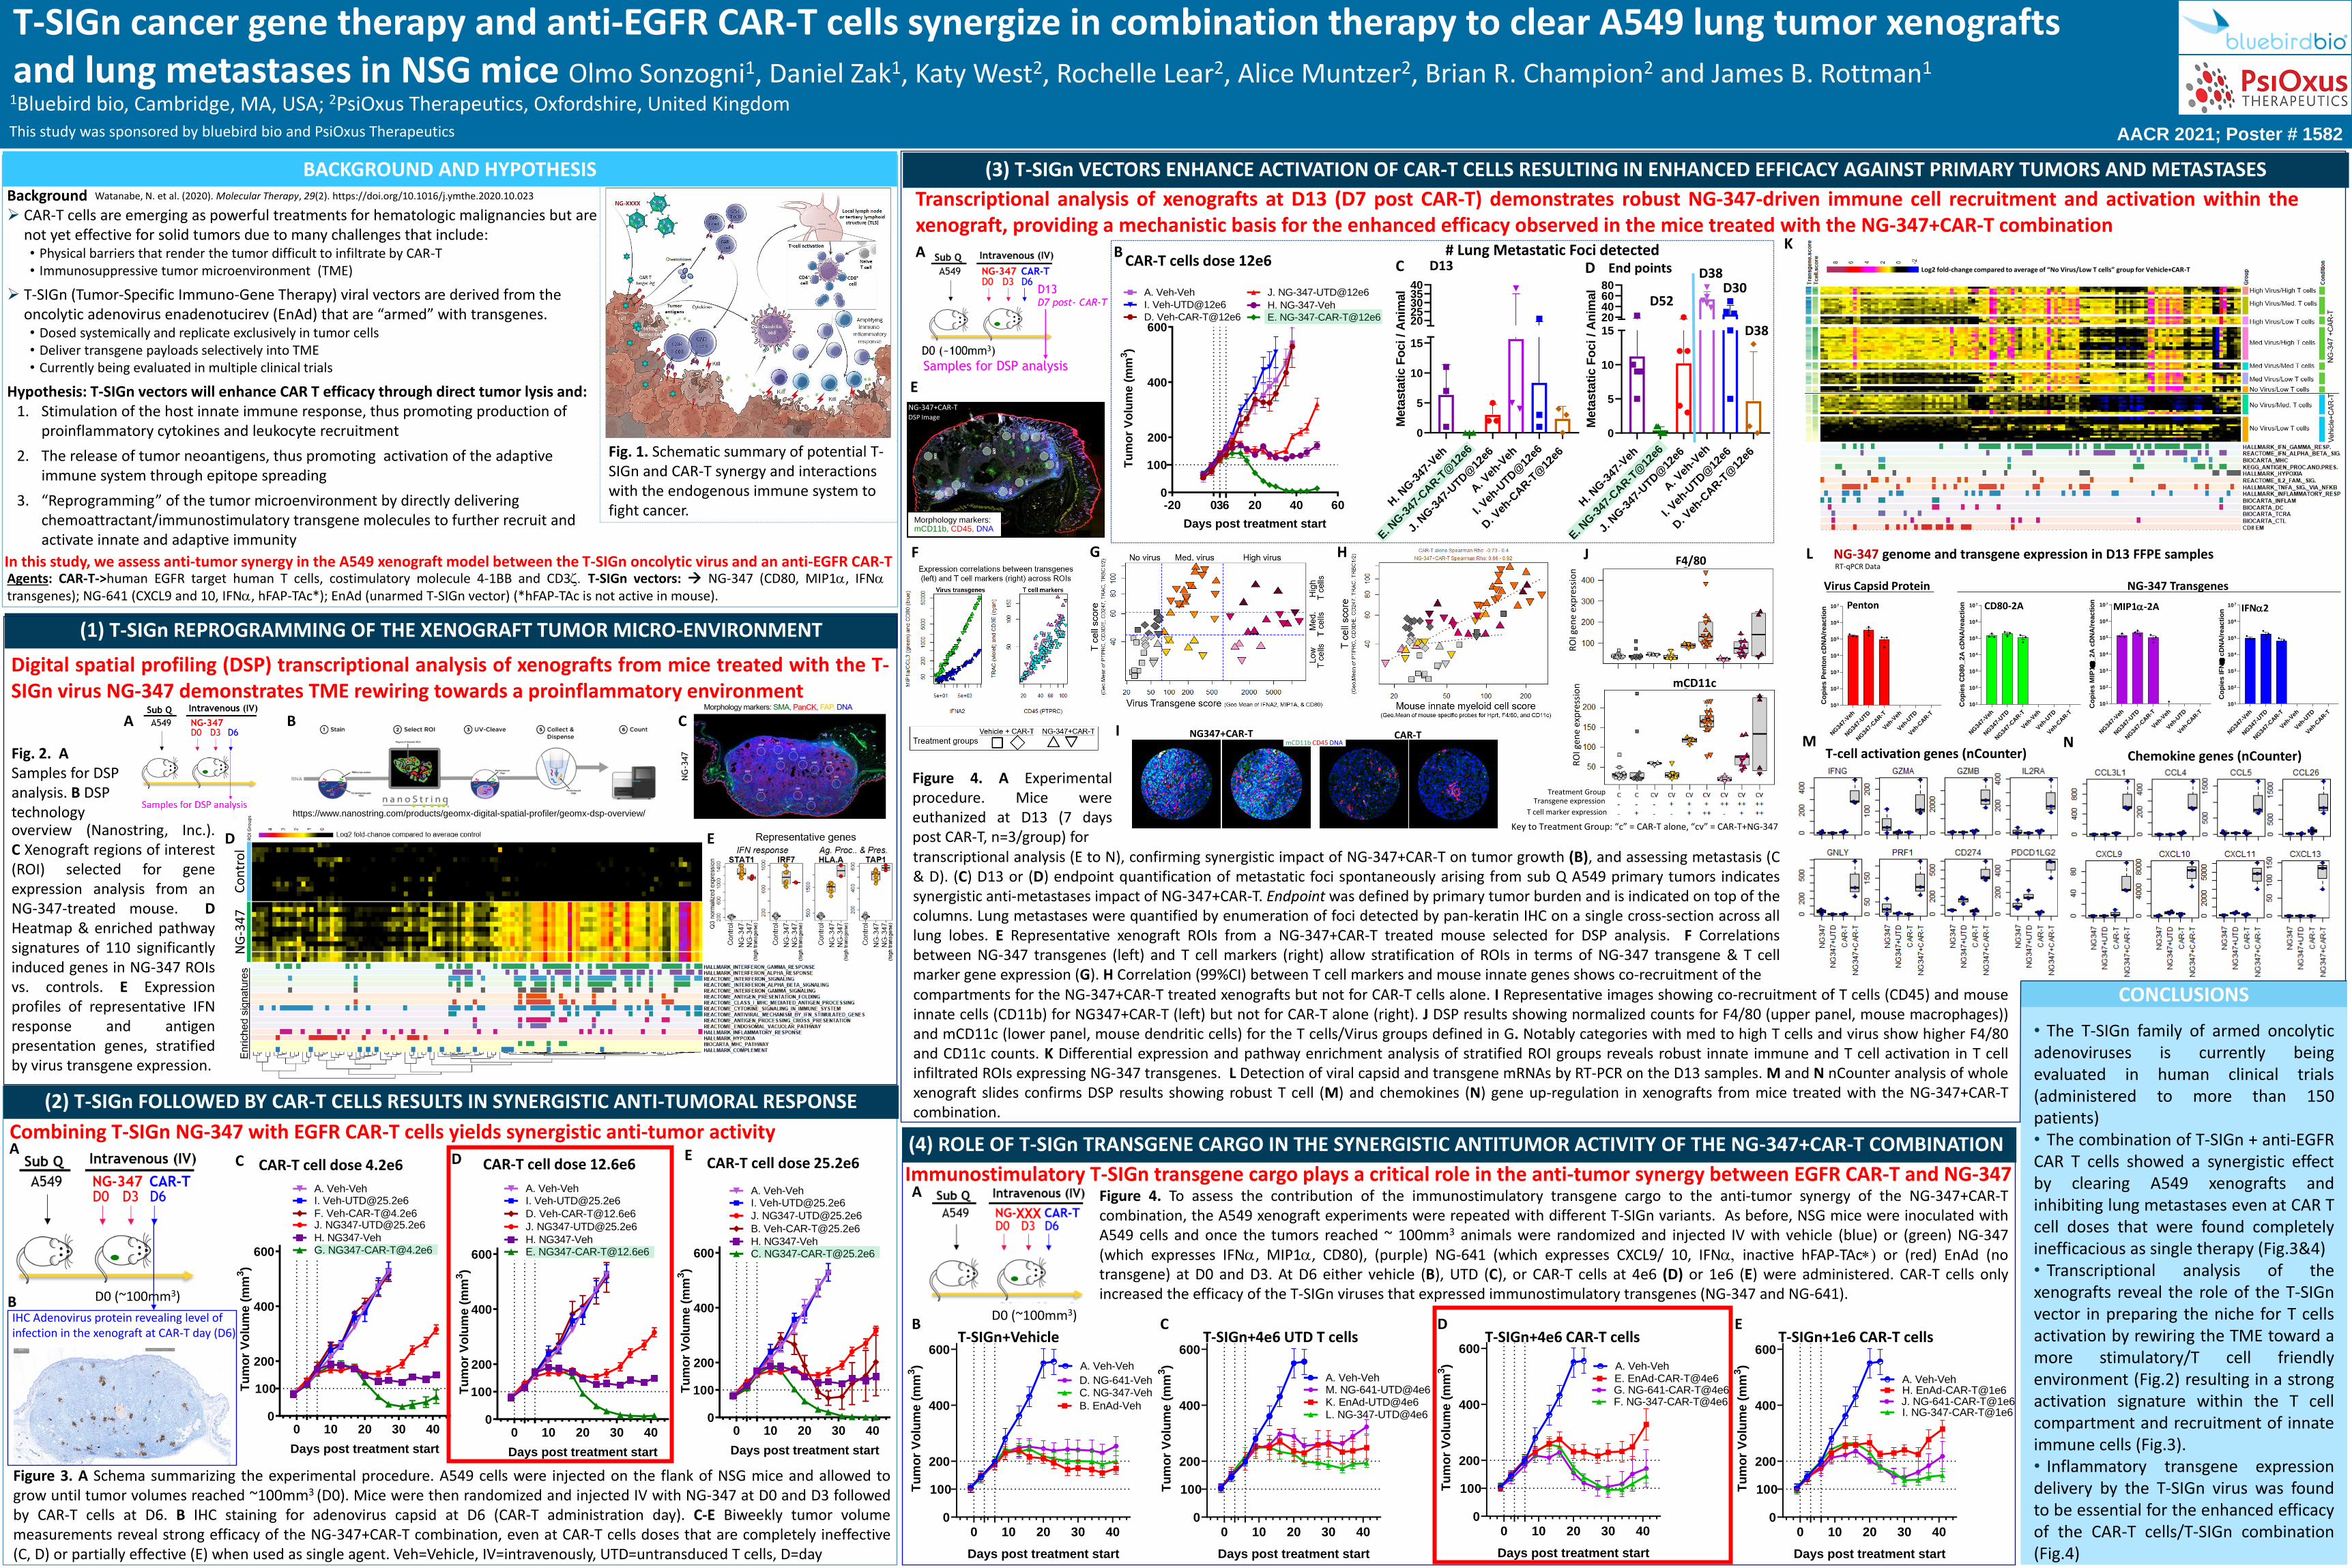
This study is sponsored by bluebird bio

Treatment Group

mCD11c

F4/80

Transgene expression

T cell marker expression

J

RO

I gen

e ex

pre

ssio

nR

OI g

ene

exp

ress

ion

Key to Treatment Group: “c” = CAR-T alone, “cv” = CAR-T+NG-347

Chemokine genes (nCounter)N

T-SIGn cancer gene therapy and anti-EGFR CAR-T cells synergize in combination therapy to clear A549 lung tumor xenografts and lung metastases in NSG mice Olmo Sonzogni1, Daniel Zak1, Katy West2, Rochelle Lear2, Alice Muntzer2, Brian R. Champion2 and James B. Rottman1

BACKGROUND AND HYPOTHESISBackground➢ CAR-T cells are emerging as powerful treatments for hematologic malignancies but are

not yet effective for solid tumors due to many challenges that include:• Physical barriers that render the tumor difficult to infiltrate by CAR-T• Immunosuppressive tumor microenvironment (TME)

➢ T-SIGn (Tumor-Specific Immuno-Gene Therapy) viral vectors are derived from the oncolytic adenovirus enadenotucirev (EnAd) that are “armed” with transgenes.• Dosed systemically and replicate exclusively in tumor cells• Deliver transgene payloads selectively into TME• Currently being evaluated in multiple clinical trials

Hypothesis: T-SIGn vectors will enhance CAR T efficacy through direct tumor lysis and:1. Stimulation of the host innate immune response, thus promoting production of

proinflammatory cytokines and leukocyte recruitment

2. The release of tumor neoantigens, thus promoting activation of the adaptive immune system through epitope spreading

3. “Reprogramming” of the tumor microenvironment by directly delivering chemoattractant/immunostimulatory transgene molecules to further recruit and activate innate and adaptive immunity

Fig. 1. Schematic summary of potential T-SIGn and CAR-T synergy and interactions with the endogenous immune system to fight cancer.

Agents: CAR-T->human EGFR target human T cells, costimulatory molecule 4-1BB and CD3. T-SIGn vectors: → NG-347 (CD80, MIP1a, IFNa

transgenes); NG-641 (CXCL9 and 10, IFNa, hFAP-TAc*); EnAd (unarmed T-SIGn vector) (*hFAP-TAc is not active in mouse).

(1) T-SIGn REPROGRAMMING OF THE XENOGRAFT TUMOR MICRO-ENVIRONMENT

Digital spatial profiling (DSP) transcriptional analysis of xenografts from mice treated with the T-SIGn virus NG-347 demonstrates TME rewiring towards a proinflammatory environment

Fig. 2. A Samples for DSP analysis. B DSP technology https://www.nanostring.com/products/geomx-digital-spatial-profiler/geomx-dsp-overview/

A B C

D E overview (Nanostring, Inc.).C Xenograft regions of interest(ROI) selected for geneexpression analysis from anNG-347-treated mouse. DHeatmap & enriched pathwaysignatures of 110 significantlyinduced genes in NG-347 ROIsvs. controls. E Expressionprofiles of representative IFNresponse and antigenpresentation genes, stratifiedby virus transgene expression.

AACR 2021; Poster # 1582This study was sponsored by bluebird bio and PsiOxus Therapeutics

1Bluebird bio, Cambridge, MA, USA; 2PsiOxus Therapeutics, Oxfordshire, United Kingdom

0 10 20 30 400

200

400

600

Days post treatment start

Tu

mo

r V

olu

me (

mm

3)

C. [email protected]

B. [email protected]

J. [email protected]

I. [email protected]

100

H. NG347-Veh

A. Veh-Veh

CAR-T cell dose 25.2e6E

(2) T-SIGn FOLLOWED BY CAR-T CELLS RESULTS IN SYNERGISTIC ANTI-TUMORAL RESPONSE

0 10 20 30 400

200

400

600

Days post treatment start

Tu

mo

r V

olu

me (

mm

3)

G. [email protected]

F. [email protected]. [email protected]

I. [email protected]

H. NG347-Veh

A. Veh-Veh

100

CAR-T cell dose 4.2e6C

0 10 20 30 400

200

400

600

Days post treatment start

Tu

mo

r V

olu

me (

mm

3)

E. [email protected]

D. [email protected]

J. [email protected]

I. [email protected]

H. NG347-Veh

A. Veh-Veh

100

CAR-T cell dose 12.6e6D

IHC Adenovirus protein revealing level of infection in the xenograft at CAR-T day (D6)

A

B

Figure 3. A Schema summarizing the experimental procedure. A549 cells were injected on the flank of NSG mice and allowed togrow until tumor volumes reached ~100mm3 (D0). Mice were then randomized and injected IV with NG-347 at D0 and D3 followedby CAR-T cells at D6. B IHC staining for adenovirus capsid at D6 (CAR-T administration day). C-E Biweekly tumor volumemeasurements reveal strong efficacy of the NG-347+CAR-T combination, even at CAR-T cells doses that are completely ineffective(C, D) or partially effective (E) when used as single agent. Veh=Vehicle, IV=intravenously, UTD=untransduced T cells, D=day

Combining T-SIGn NG-347 with EGFR CAR-T cells yields synergistic anti-tumor activity

D0 (~100mm3)

K

In this study, we assess anti-tumor synergy in the A549 xenograft model between the T-SIGn oncolytic virus and an anti-EGFR CAR-T

Immunostimulatory T-SIGn transgene cargo plays a critical role in the anti-tumor synergy between EGFR CAR-T and NG-347

0 10 20 30 400

200

400

600

Days post treatment start

Tu

mo

r V

olu

me (

mm

3)

A. Veh-VehH. EnAd-CAR-T@1e6

I. NG-347-CAR-T@1e6J. NG-641-CAR-T@1e6

100

T-SIGn+1e6 CAR-T cells

0 10 20 30 400

200

400

600

Days post treatment start

Tu

mo

r V

olu

me (

mm

3) A. Veh-Veh

B. EnAd-Veh

C. NG-347-VehD. NG-641-Veh

100

T-SIGn+Vehicle

0 10 20 30 400

200

400

600

Days post treatment start

Tu

mo

r V

olu

me (

mm

3)

A. Veh-Veh

K. EnAd-UTD@4e6L. NG-347-UTD@4e6

M. NG-641-UTD@4e6

100

T-SIGn+4e6 UTD T cells

D0 (~100mm3)

Figure 4. To assess the contribution of the immunostimulatory transgene cargo to the anti-tumor synergy of the NG-347+CAR-Tcombination, the A549 xenograft experiments were repeated with different T-SIGn variants. As before, NSG mice were inoculated withA549 cells and once the tumors reached ~ 100mm3 animals were randomized and injected IV with vehicle (blue) or (green) NG-347(which expresses IFNa, MIP1a, CD80), (purple) NG-641 (which expresses CXCL9/ 10, IFNa, inactive hFAP-TAc*) or (red) EnAd (notransgene) at D0 and D3. At D6 either vehicle (B), UTD (C), or CAR-T cells at 4e6 (D) or 1e6 (E) were administered. CAR-T cells onlyincreased the efficacy of the T-SIGn viruses that expressed immunostimulatory transgenes (NG-347 and NG-641).

A

B C

0 10 20 30 400

200

400

600

Days post treatment start

Tu

mo

r V

olu

me (

mm

3) A. Veh-Veh

E. EnAd-CAR-T@4e6

F. NG-347-CAR-T@4e6G. NG-641-CAR-T@4e6

100

T-SIGn+4e6 CAR-T cellsD E

(4) ROLE OF T-SIGn TRANSGENE CARGO IN THE SYNERGISTIC ANTITUMOR ACTIVITY OF THE NG-347+CAR-T COMBINATION

Transcriptional analysis of xenografts at D13 (D7 post CAR-T) demonstrates robust NG-347-driven immune cell recruitment and activation within thexenograft, providing a mechanistic basis for the enhanced efficacy observed in the mice treated with the NG-347+CAR-T combination

(3) T-SIGn VECTORS ENHANCE ACTIVATION OF CAR-T CELLS RESULTING IN ENHANCED EFFICACY AGAINST PRIMARY TUMORS AND METASTASES

-20 20 40 600

200

400

600

Days post treatment start

Tu

mo

r V

olu

me (

mm

3)

036

100

D. Veh-CAR-T@12e6H. NG-347-Veh

J. NG-347-UTD@12e6

E. NG-347-CAR-T@12e6

A. Veh-Veh

I. Veh-UTD@12e6

H. N

G-3

47-V

eh

E. N

G-3

47-C

AR-T

@12

e6

J. N

G-3

47-U

TD@

12e6

A. V

eh-V

eh

I. Veh

-UTD

@12

e6

D. V

eh-C

AR-T

@12

e6

0

5

10

15

2025303540

Meta

sta

tic F

oci / A

nim

al

C D13# Lung Metastatic Foci detected

H. N

G-3

47-V

eh

E. N

G-3

47-C

AR-T

@12

e6

J. N

G-3

47-U

TD@

12e6

A. V

eh-V

eh

I. Veh

-UTD

@12

e6

D. V

eh-C

AR-T

@12

e6

0

5

10

15

20406080

Meta

sta

tic F

oci / A

nim

al

D52

D38

D38

D30

End pointsDCAR-T cells dose 12e6

NG-347 genome and transgene expression in D13 FFPE samples

A

E

F

B

G L

Figure 4. A Experimentalprocedure. Mice wereeuthanized at D13 (7 dayspost CAR-T, n=3/group) for

RT-qPCR Data

NG34

7-Veh

NG34

7-UTD

NG34

7-CAR-T

Veh

-Veh

Veh

-UTD

Veh

-CAR-T

101

102

103

104

105

106

107

Co

pie

s IF

N

cD

NA

/reacti

on

NG34

7-Veh

NG34

7-UTD

NG34

7-CAR-T

Veh

-Veh

Veh

-UTD

Veh

-CAR-T

101

102

103

104

105

106

107

Co

pie

s P

en

ton

cD

NA

/rea

cti

on

NG34

7-Veh

NG34

7-UTD

NG34

7-CAR-T

Veh

-Veh

Veh

-UTD

Veh

-CAR-T

101

102

103

104

105

106

107

Co

pie

s C

D80

_2A

cD

NA

/re

ac

tio

n

NG34

7-Veh

NG34

7-UTD

NG34

7-CAR-T

Veh

-Veh

Veh

-UTD

Veh

-CAR-T

101

102

103

104

105

106

107

Co

pie

s M

IP1

_2A

cD

NA

/reacti

on

NG-347 Transgenes

CD80-2A MIP1a-2APenton IFNa2

Virus Capsid Protein

H

I

• The T-SIGn family of armed oncolyticadenoviruses is currently beingevaluated in human clinical trials(administered to more than 150patients)• The combination of T-SIGn + anti-EGFRCAR T cells showed a synergistic effectby clearing A549 xenografts andinhibiting lung metastases even at CAR Tcell doses that were found completelyinefficacious as single therapy (Fig.3&4)• Transcriptional analysis of thexenografts reveal the role of the T-SIGnvector in preparing the niche for T cellsactivation by rewiring the TME toward amore stimulatory/T cell friendlyenvironment (Fig.2) resulting in a strongactivation signature within the T cellcompartment and recruitment of innateimmune cells (Fig.3).• Inflammatory transgene expressiondelivery by the T-SIGn virus was foundto be essential for the enhanced efficacyof the CAR-T cells/T-SIGn combination(Fig.4)

T-cell activation genes (nCounter)M

DSP Image

NG-347+CAR-T

Morphology markers: mCD11b, CD45, DNA

CAR-TNG347+CAR-TmCD11b CD45 DNA

CONCLUSIONS

Watanabe, N. et al. (2020). Molecular Therapy, 29(2). https://doi.org/10.1016/j.ymthe.2020.10.023

transcriptional analysis (E to N), confirming synergistic impact of NG-347+CAR-T on tumor growth (B), and assessing metastasis (C& D). (C) D13 or (D) endpoint quantification of metastatic foci spontaneously arising from sub Q A549 primary tumors indicatessynergistic anti-metastases impact of NG-347+CAR-T. Endpoint was defined by primary tumor burden and is indicated on top of thecolumns. Lung metastases were quantified by enumeration of foci detected by pan-keratin IHC on a single cross-section across alllung lobes. E Representative xenograft ROIs from a NG-347+CAR-T treated mouse selected for DSP analysis. F Correlationsbetween NG-347 transgenes (left) and T cell markers (right) allow stratification of ROIs in terms of NG-347 transgene & T cellmarker gene expression (G). H Correlation (99%CI) between T cell markers and mouse innate genes shows co-recruitment of thecompartments for the NG-347+CAR-T treated xenografts but not for CAR-T cells alone. I Representative images showing co-recruitment of T cells (CD45) and mouseinnate cells (CD11b) for NG347+CAR-T (left) but not for CAR-T alone (right). J DSP results showing normalized counts for F4/80 (upper panel, mouse macrophages))and mCD11c (lower panel, mouse dendritic cells) for the T cells/Virus groups defined in G. Notably categories with med to high T cells and virus show higher F4/80and CD11c counts. K Differential expression and pathway enrichment analysis of stratified ROI groups reveals robust innate immune and T cell activation in T cellinfiltrated ROIs expressing NG-347 transgenes. L Detection of viral capsid and transgene mRNAs by RT-PCR on the D13 samples. M and N nCounter analysis of wholexenograft slides confirms DSP results showing robust T cell (M) and chemokines (N) gene up-regulation in xenografts from mice treated with the NG-347+CAR-Tcombination.

RO

I Gro

up

sC

on

tro

lN

G-3

47

Log2 fold-change compared to average of “No Virus/Low T cells” group for Vehicle+CAR-T