Embed Size (px)
DESCRIPTION
Tumor cell line profiling of eighteen cancer therapeutics to evaluate relationships between tumor genotypes and cancer cell sensitivities
Citation preview
2011 AACR 102nd Annual Meeting
Title: Tumor cell line profiling of eighteen cancer
therapeutics to evaluate relationships between
tumor genotypes and cancer cell sensitivities
Authors: Yulia Y. Ovechkina, Christine O'Day, Karen Marcoe, Robert Keyser, Karen
Bernards, Jessica Chesnut-Speelman, Phuong T.B. Nguyen, Jenny Mulligan, Teddy
Lin, Rodney Shively, Jim Hnilo, Brian Nelson. Ricerca Biosciences, LLC, Bothell,
WA
Introduction
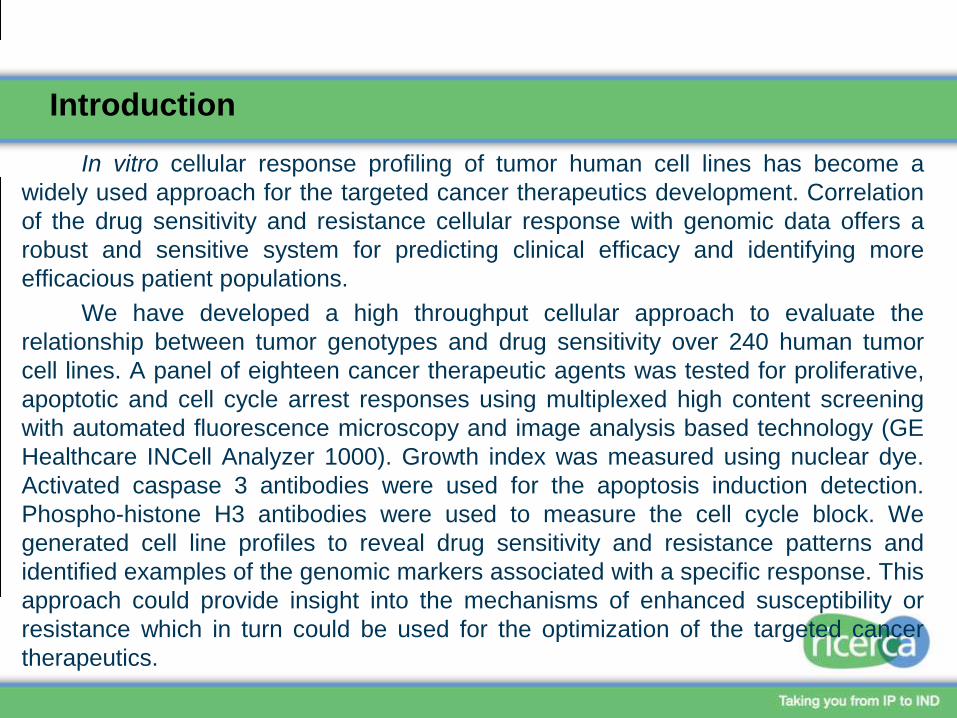
In vitro cellular response profiling of tumor human cell lines has become a
widely used approach for the targeted cancer therapeutics development. Correlation
of the drug sensitivity and resistance cellular response with genomic data offers a
robust and sensitive system for predicting clinical efficacy and identifying more
efficacious patient populations.
We have developed a high throughput cellular approach to evaluate the
relationship between tumor genotypes and drug sensitivity over 240 human tumor
cell lines. A panel of eighteen cancer therapeutic agents was tested for proliferative,
apoptotic and cell cycle arrest responses using multiplexed high content screening
with automated fluorescence microscopy and image analysis based technology (GE
Healthcare INCell Analyzer 1000). Growth index was measured using nuclear dye.
Activated caspase 3 antibodies were used for the apoptosis induction detection.
Phospho-histone H3 antibodies were used to measure the cell cycle block. We
generated cell line profiles to reveal drug sensitivity and resistance patterns and
identified examples of the genomic markers associated with a specific response. This
approach could provide insight into the mechanisms of enhanced susceptibility or
resistance which in turn could be used for the optimization of the targeted cancer
therapeutics.
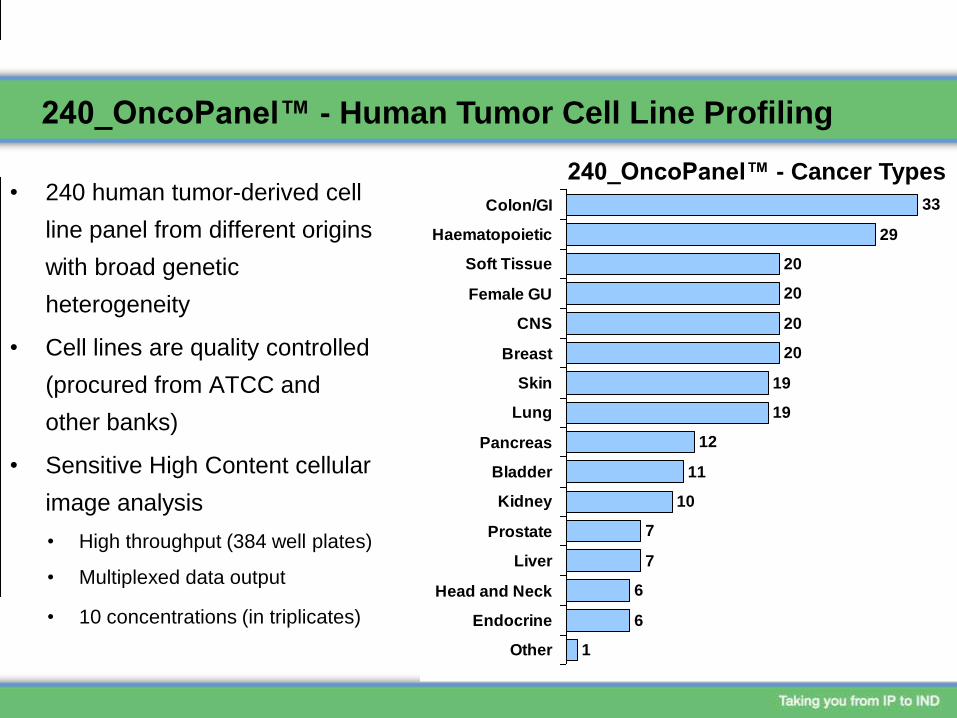
• 240 human tumor-derived cell
line panel from different origins
with broad genetic
heterogeneity
• Cell lines are quality controlled
(procured from ATCC and
other banks)
• Sensitive High Content cellular
image analysis
• High throughput (384 well plates)
• Multiplexed data output
• 10 concentrations (in triplicates)
240_OncoPanel™ - Human Tumor Cell Line Profiling
1
6
6
7
7
10
11
12
19
19
20
20
20
20
29
33
Other
Endocrine
Head and Neck
Liver
Prostate
Kidney
Bladder
Pancreas
Lung
Skin
Breast
CNS
Female GU
Soft Tissue
Haematopoietic
Colon/GI
240_OncoPanel™ - Cancer Types
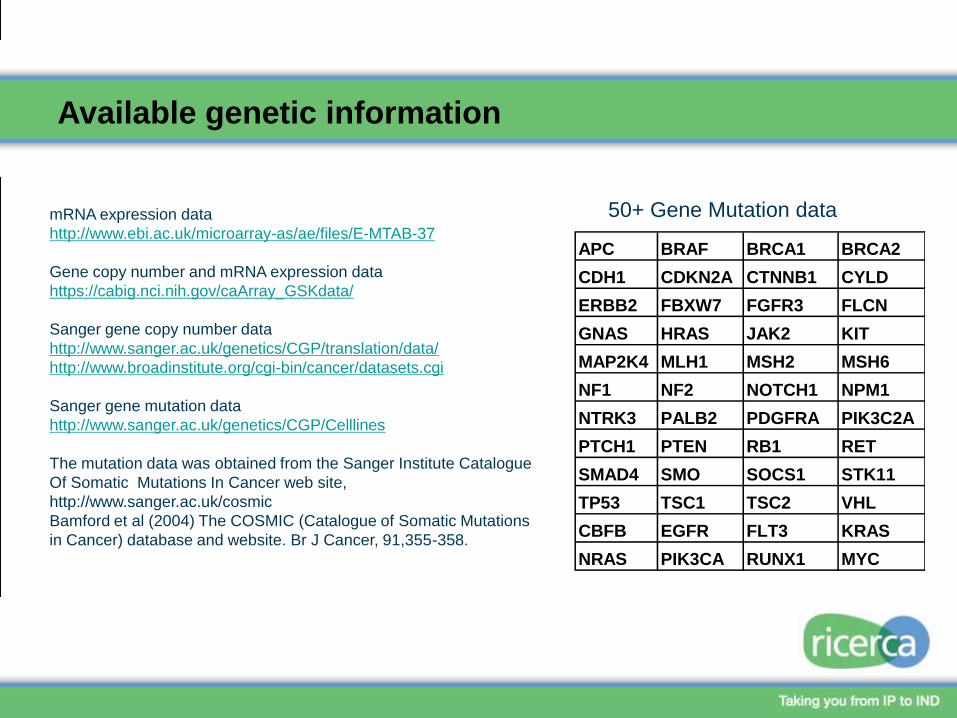
Available genetic information
mRNA expression data
http://www.ebi.ac.uk/microarray-as/ae/files/E-MTAB-37
Gene copy number and mRNA expression data
https://cabig.nci.nih.gov/caArray_GSKdata/
Sanger gene copy number data
http://www.sanger.ac.uk/genetics/CGP/translation/data/
http://www.broadinstitute.org/cgi-bin/cancer/datasets.cgi
Sanger gene mutation data
http://www.sanger.ac.uk/genetics/CGP/Celllines
The mutation data was obtained from the Sanger Institute Catalogue
Of Somatic Mutations In Cancer web site,
http://www.sanger.ac.uk/cosmic
Bamford et al (2004) The COSMIC (Catalogue of Somatic Mutations
in Cancer) database and website. Br J Cancer, 91,355-358.
50+ Gene Mutation data
APC BRAF BRCA1 BRCA2
CDH1 CDKN2A CTNNB1 CYLD
ERBB2 FBXW7 FGFR3 FLCN
GNAS HRAS JAK2 KIT
MAP2K4 MLH1 MSH2 MSH6
NF1 NF2 NOTCH1 NPM1
NTRK3 PALB2 PDGFRA PIK3C2A
PTCH1 PTEN RB1 RET
SMAD4 SMO SOCS1 STK11
TP53 TSC1 TSC2 VHL
CBFB EGFR FLT3 KRAS
NRAS PIK3CA RUNX1 MYC
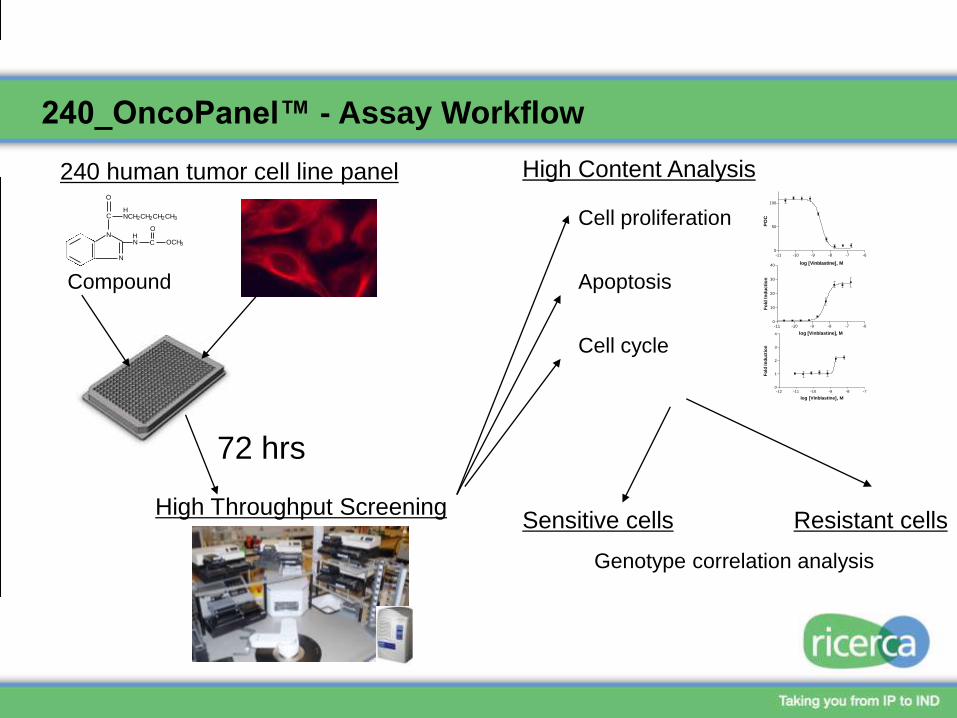
High Throughput Screening
Cell proliferation
Cell cycle
Apoptosis
High Content Analysis
Compound
C
N
N
O
N C
O
OCH3
H
NCH2CH2CH2CH3
H
240 human tumor cell line panel
Sensitive cells Resistant cells
Genotype correlation analysis
240_OncoPanel™ - Assay Workflow
72 hrs
-11 -10 -9 -8 -7 -60
50
100
log [Vinblastine], M
PO
C
-11 -10 -9 -8 -7 -60
10
20
30
40
log [Vinblastine], M
Fo
ld In
du
cti
on
-12 -11 -10 -9 -8 -70
1
2
3
4
log [Vinblastine], M
Fo
ld I
nd
ucti
on
Criteria for Positive Responses
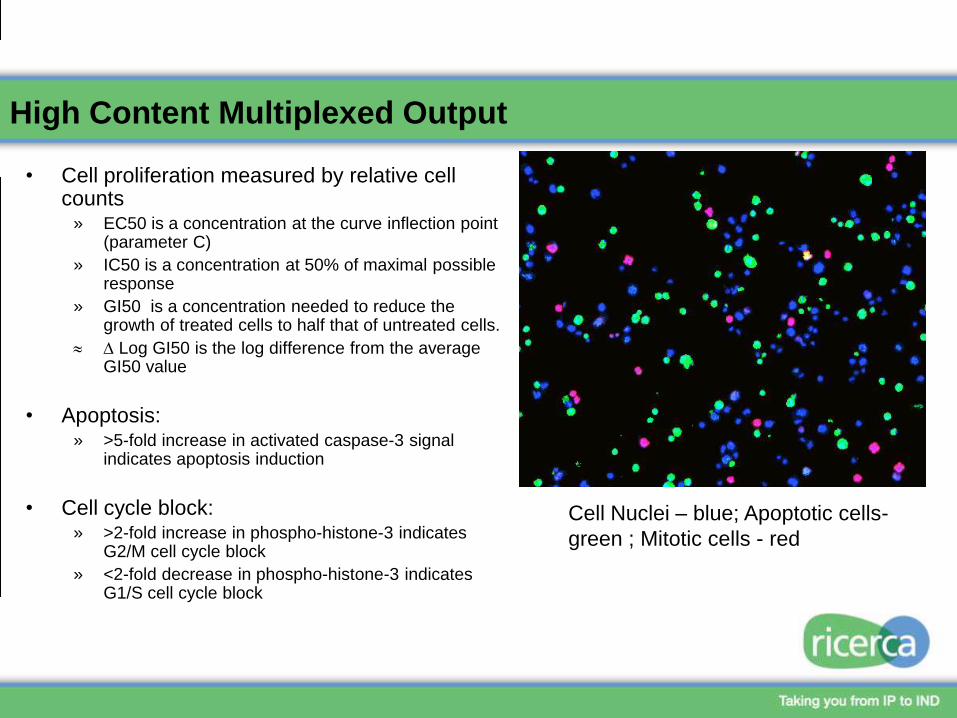
• Cell proliferation measured by relative cell counts
» EC50 is a concentration at the curve inflection point (parameter C)
» IC50 is a concentration at 50% of maximal possible response
» GI50 is a concentration needed to reduce the growth of treated cells to half that of untreated cells.
D Log GI50 is the log difference from the average GI50 value
• Apoptosis:» >5-fold increase in activated caspase-3 signal
indicates apoptosis induction
• Cell cycle block:» >2-fold increase in phospho-histone-3 indicates
G2/M cell cycle block
» <2-fold decrease in phospho-histone-3 indicates G1/S cell cycle block
High Content Multiplexed Output
Cell Nuclei – blue; Apoptotic cells-
green ; Mitotic cells - red
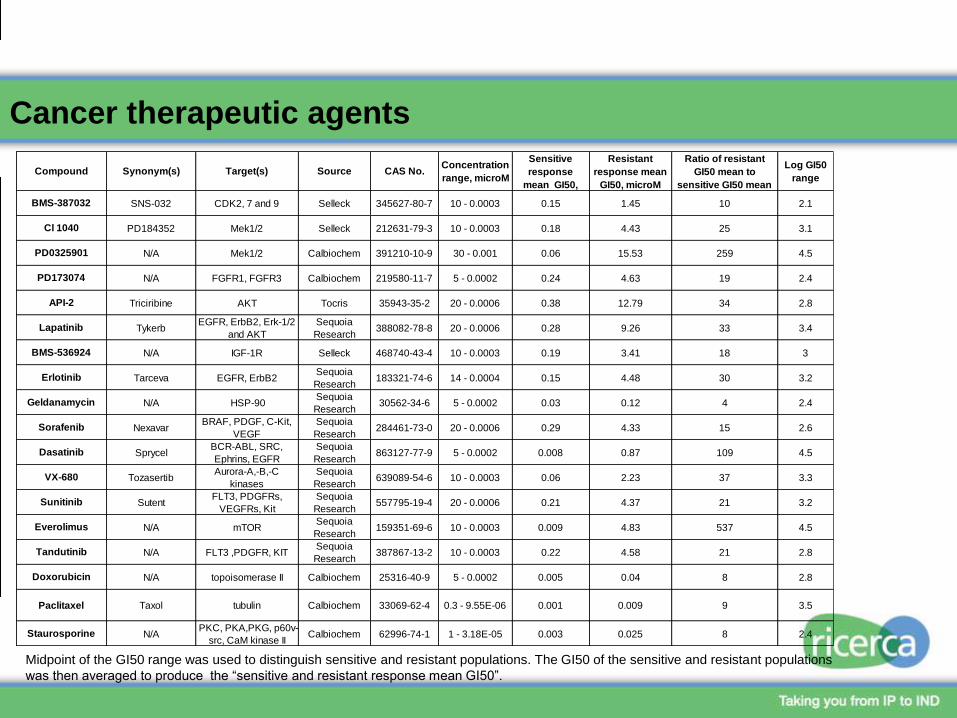
Cancer therapeutic agents
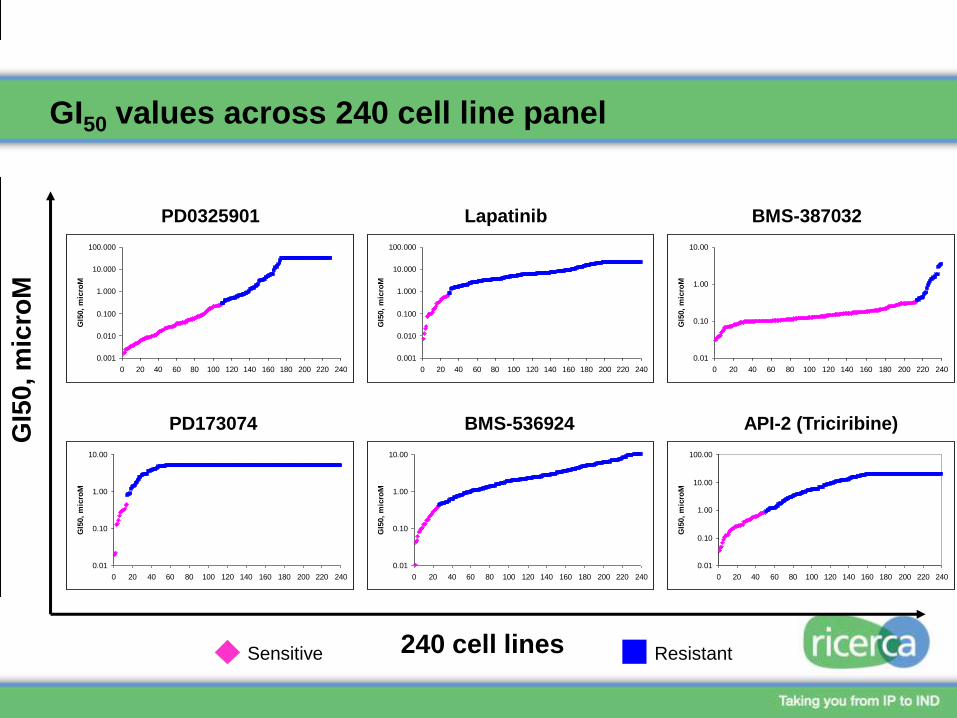
Midpoint of the GI50 range was used to distinguish sensitive and resistant populations. The GI50 of the sensitive and resistant populations
was then averaged to produce the “sensitive and resistant response mean GI50”.
Compound Synonym(s) Target(s) Source CAS No.Concentration
range, microM
Sensitive
response
mean GI50,
Resistant
response mean
GI50, microM
Ratio of resistant
GI50 mean to
sensitive GI50 mean
Log GI50
range
BMS-387032 SNS-032 CDK2, 7 and 9 Selleck 345627-80-7 10 - 0.0003 0.15 1.45 10 2.1
Cl 1040 PD184352 Mek1/2 Selleck 212631-79-3 10 - 0.0003 0.18 4.43 25 3.1
PD0325901 N/A Mek1/2 Calbiochem 391210-10-9 30 - 0.001 0.06 15.53 259 4.5
PD173074 N/A FGFR1, FGFR3 Calbiochem 219580-11-7 5 - 0.0002 0.24 4.63 19 2.4
API-2 Triciribine AKT Tocris 35943-35-2 20 - 0.0006 0.38 12.79 34 2.8
Lapatinib TykerbEGFR, ErbB2, Erk-1/2
and AKT
Sequoia
Research 388082-78-8 20 - 0.0006 0.28 9.26 33 3.4
BMS-536924 N/A IGF-1R Selleck 468740-43-4 10 - 0.0003 0.19 3.41 18 3
Erlotinib Tarceva EGFR, ErbB2Sequoia
Research 183321-74-6 14 - 0.0004 0.15 4.48 30 3.2
Geldanamycin N/A HSP-90Sequoia
Research 30562-34-6 5 - 0.0002 0.03 0.12 4 2.4
Sorafenib NexavarBRAF, PDGF, C-Kit,
VEGF
Sequoia
Research 284461-73-0 20 - 0.0006 0.29 4.33 15 2.6
Dasatinib SprycelBCR-ABL, SRC,
Ephrins, EGFR
Sequoia
Research 863127-77-9 5 - 0.0002 0.008 0.87 109 4.5
VX-680 TozasertibAurora-A,-B,-C
kinases
Sequoia
Research 639089-54-6 10 - 0.0003 0.06 2.23 37 3.3
Sunitinib SutentFLT3, PDGFRs,
VEGFRs, Kit
Sequoia
Research 557795-19-4 20 - 0.0006 0.21 4.37 21 3.2
Everolimus N/A mTOR Sequoia
Research 159351-69-6 10 - 0.0003 0.009 4.83 537 4.5
Tandutinib N/A FLT3 ,PDGFR, KITSequoia
Research 387867-13-2 10 - 0.0003 0.22 4.58 21 2.8
Doxorubicin N/A topoisomerase II Calbiochem 25316-40-9 5 - 0.0002 0.005 0.04 8 2.8
Paclitaxel Taxol tubulin Calbiochem 33069-62-4 0.3 - 9.55E-06 0.001 0.009 9 3.5
Staurosporine N/APKC, PKA,PKG, p60v-
src, CaM kinase IICalbiochem 62996-74-1 1 - 3.18E-05 0.003 0.025 8 2.4
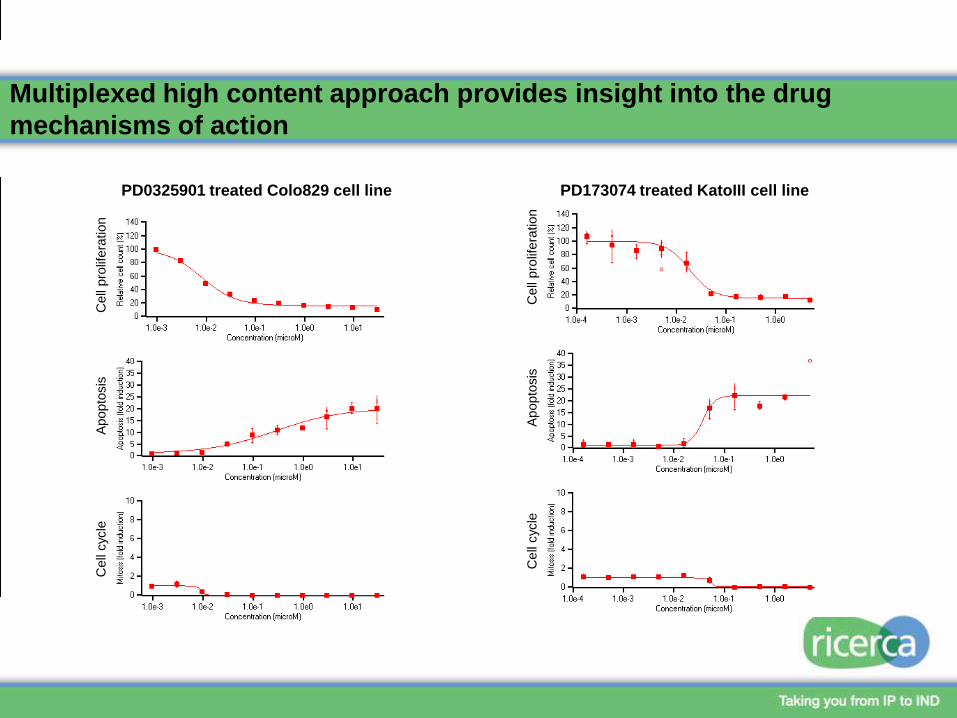
Multiplexed high content approach provides insight into the drug
mechanisms of action
PD0325901 treated Colo829 cell line PD173074 treated KatoIII cell line
Cell
pro
lifera
tion
Apopto
sis
Cell
cycle
Cell
pro
lifera
tion
Apopto
sis
Cell
cyc
le
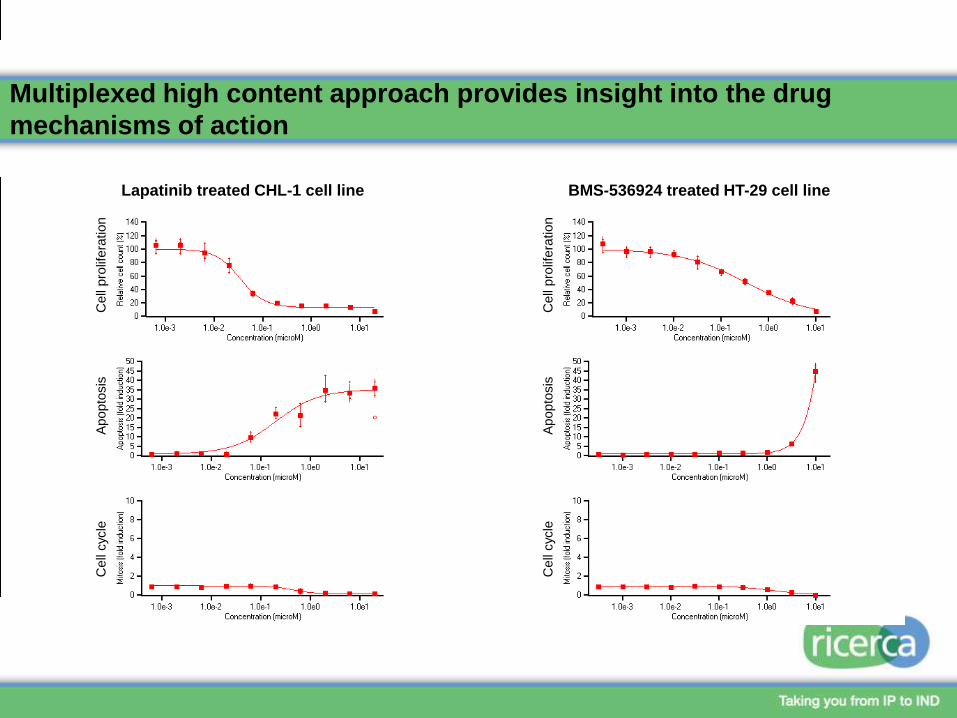
Lapatinib treated CHL-1 cell line
Cell
pro
lifera
tion
Apopto
sis
Cell
cyc
le
BMS-536924 treated HT-29 cell line
Cell
pro
lifera
tion
Apopto
sis
Cell
cycle
Multiplexed high content approach provides insight into the drug
mechanisms of action
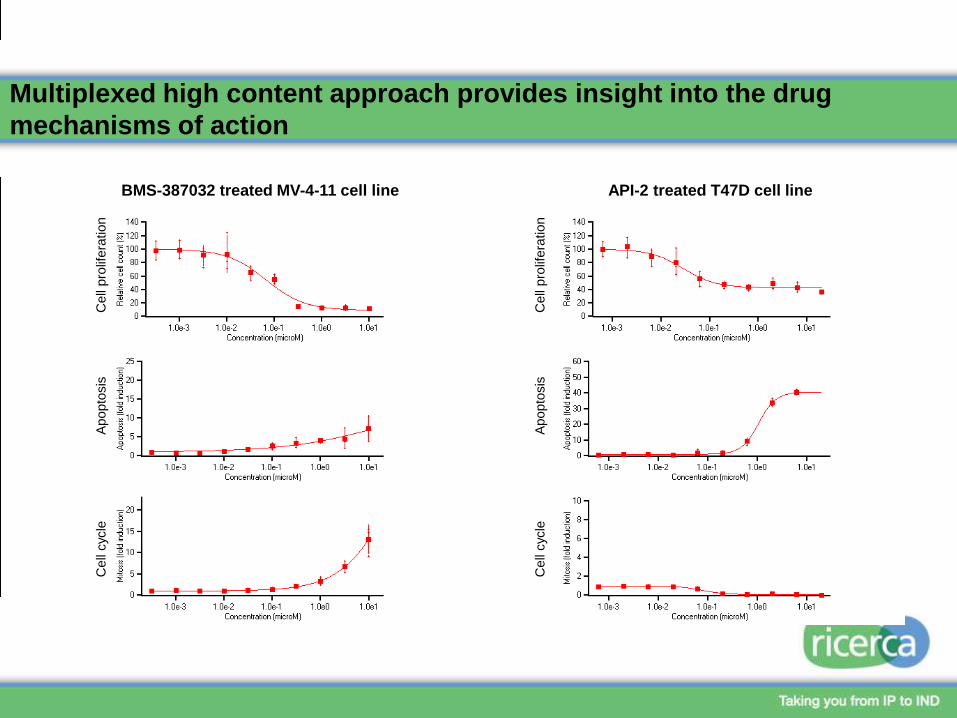
BMS-387032 treated MV-4-11 cell line
Cell
pro
lifera
tion
Apopto
sis
Cell
cyc
le
API-2 treated T47D cell line
Cell
pro
lifera
tion
Apopto
sis
Cell
cycle
Multiplexed high content approach provides insight into the drug
mechanisms of action
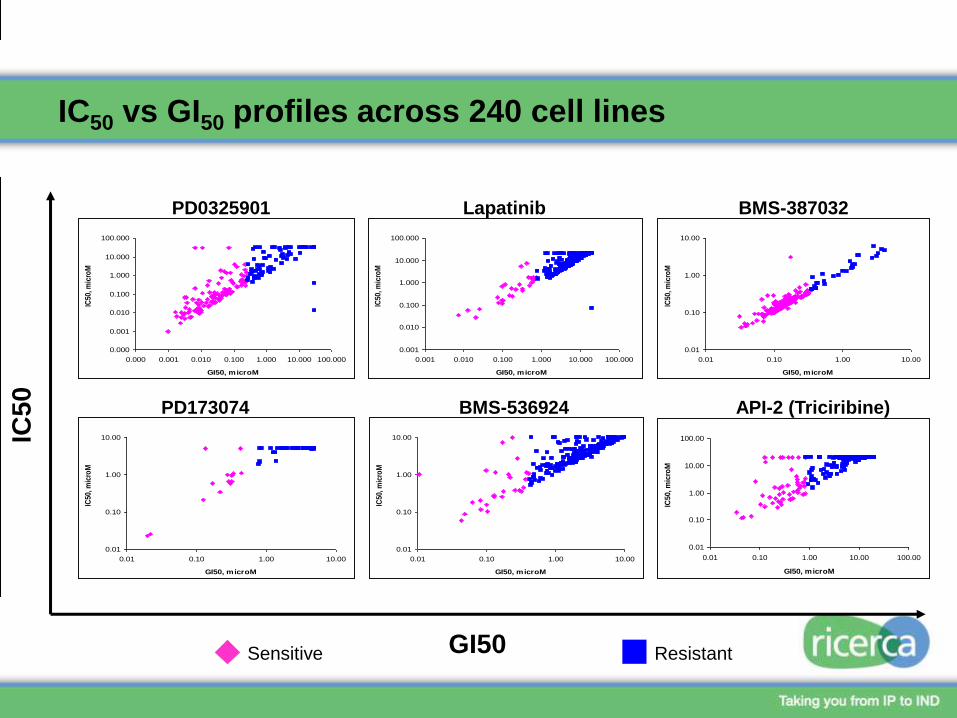
IC50 vs GI50 profiles across 240 cell lines
0.000
0.001
0.010
0.100
1.000
10.000
100.000
0.000 0.001 0.010 0.100 1.000 10.000 100.000
GI50, microM
IC50
, mic
roM
ResistantSensitive
IC5
0
GI50
PD0325901
0.01
0.10
1.00
10.00
0.01 0.10 1.00 10.00
GI50, microM
IC50
, mic
roM
PD173074
0.01
0.10
1.00
10.00
0.01 0.10 1.00 10.00
GI50, microM
IC50
, mic
roM
BMS-536924
0.01
0.10
1.00
10.00
0.01 0.10 1.00 10.00
GI50, microM
IC50
, mic
roM
BMS-387032
0.01
0.10
1.00
10.00
100.00
0.01 0.10 1.00 10.00 100.00
GI50, microM
IC50, m
icro
M
API-2 (Triciribine)
0.001
0.010
0.100
1.000
10.000
100.000
0.001 0.010 0.100 1.000 10.000 100.000
GI50, microMIC
50, m
icro
M
Lapatinib
ResistantSensitive
IC5
0
GI50
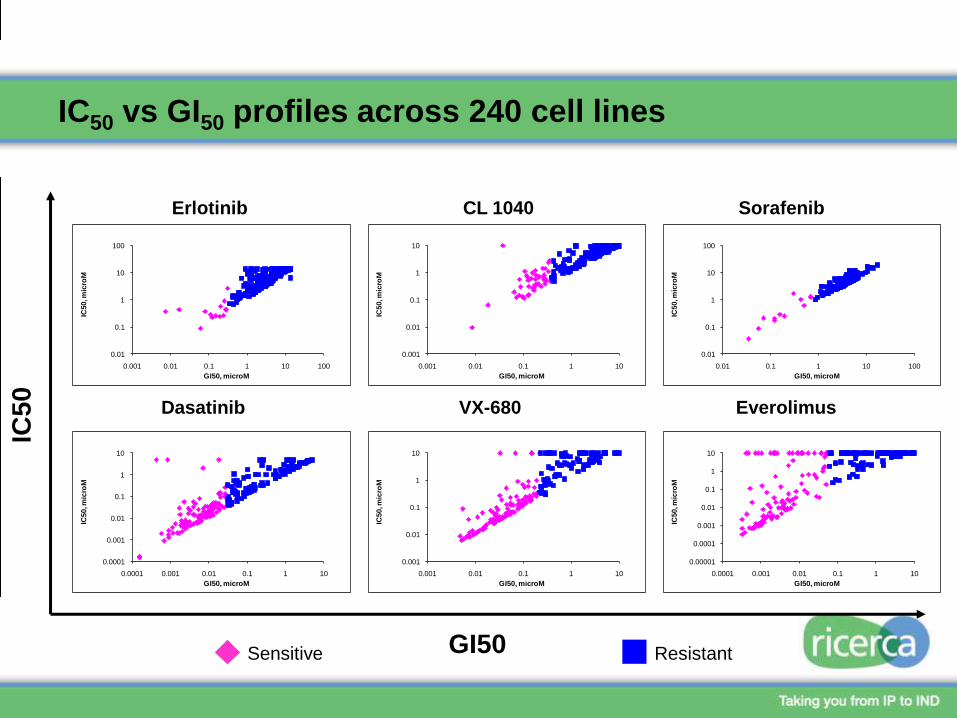
Erlotinib
Dasatinib
CL 1040
VX-680
Sorafenib
Everolimus
0.01
0.1
1
10
100
0.001 0.01 0.1 1 10 100
IC50, m
icro
M
GI50, microM
0.001
0.01
0.1
1
10
0.001 0.01 0.1 1 10
IC50, m
icro
MGI50, microM
0.01
0.1
1
10
100
0.01 0.1 1 10 100
IC50, m
icro
M
GI50, microM
0.0001
0.001
0.01
0.1
1
10
0.0001 0.001 0.01 0.1 1 10
IC50, m
icro
M
GI50, microM
0.001
0.01
0.1
1
10
0.001 0.01 0.1 1 10
IC50, m
icro
M
GI50, microM
0.00001
0.0001
0.001
0.01
0.1
1
10
0.0001 0.001 0.01 0.1 1 10
IC50, m
icro
M
GI50, microM
IC50 vs GI50 profiles across 240 cell lines
ResistantSensitive
IC5
0
GI50
Sunitinib
Paclitaxel
Tandutinib
Staurosporine
Doxorubicin
Geldanamycin
0.01
0.1
1
10
100
0.01 0.1 1 10 100
IC50, m
icro
M
GI50, microM
0.1
1
10
0.01 0.1 1 10
IC50, m
icro
MGI50, microM
0.0001
0.001
0.01
0.1
1
0.0001 0.001 0.01 0.1 1
IC50, m
icro
M
GI50, microM
0.00001
0.0001
0.001
0.01
0.1
1
1.00E-05 1.00E-04 1.00E-03 1.00E-02 1.00E-01 1.00E+00
IC50, m
icro
M
GI50, microM
0.0001
0.001
0.01
0.1
1
0.0001 0.001 0.01 0.1 1
IC50, m
icro
M
GI50, microM
0.001
0.01
0.1
1
10
0.001 0.01 0.1 1 10
IC50, m
icro
M
GI50, microM
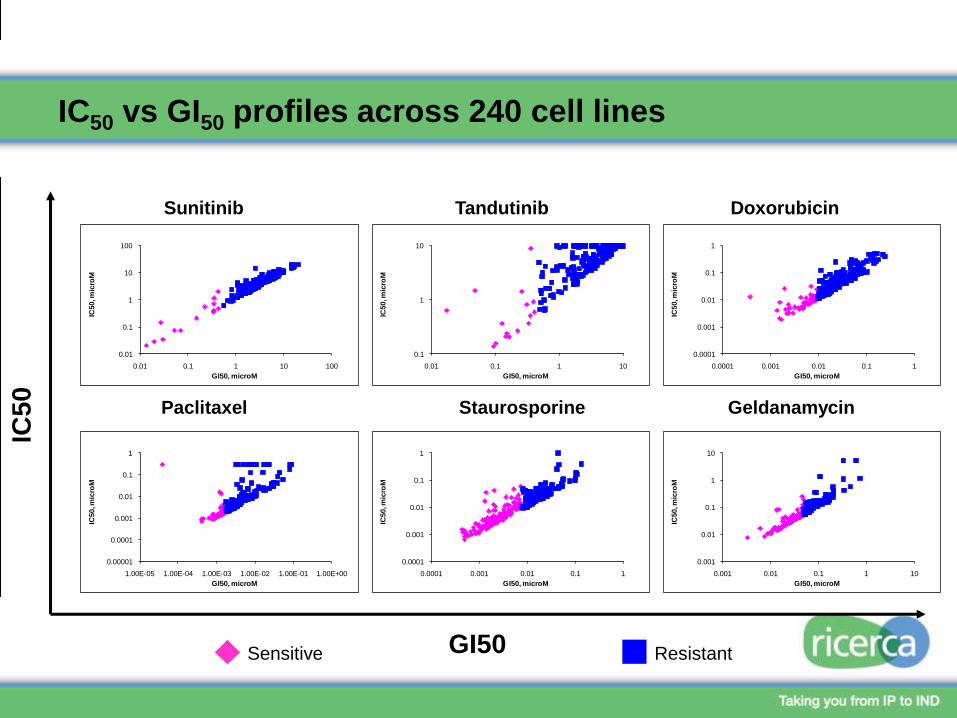
IC50 vs GI50 profiles across 240 cell lines
0.001
0.010
0.100
1.000
10.000
100.000
0 20 40 60 80 100 120 140 160 180 200 220 240
GI5
0,
mic
roM
0.01
0.10
1.00
10.00
0 20 40 60 80 100 120 140 160 180 200 220 240
GI5
0,
mic
roM
0.01
0.10
1.00
10.00
0 20 40 60 80 100 120 140 160 180 200 220 240
GI5
0,
mic
roM
0.001
0.010
0.100
1.000
10.000
100.000
0 20 40 60 80 100 120 140 160 180 200 220 240
GI5
0,
mic
roM
GI50 values across 240 cell line panel
ResistantSensitive 240 cell lines
GI5
0, m
icro
M
PD0325901
PD173074
Lapatinib
BMS-536924
BMS-387032
0.01
0.10
1.00
10.00
0 20 40 60 80 100 120 140 160 180 200 220 240
GI5
0,
mic
roM
0.01
0.10
1.00
10.00
100.00
0 20 40 60 80 100 120 140 160 180 200 220 240
GI5
0,
mic
roM
API-2 (Triciribine)
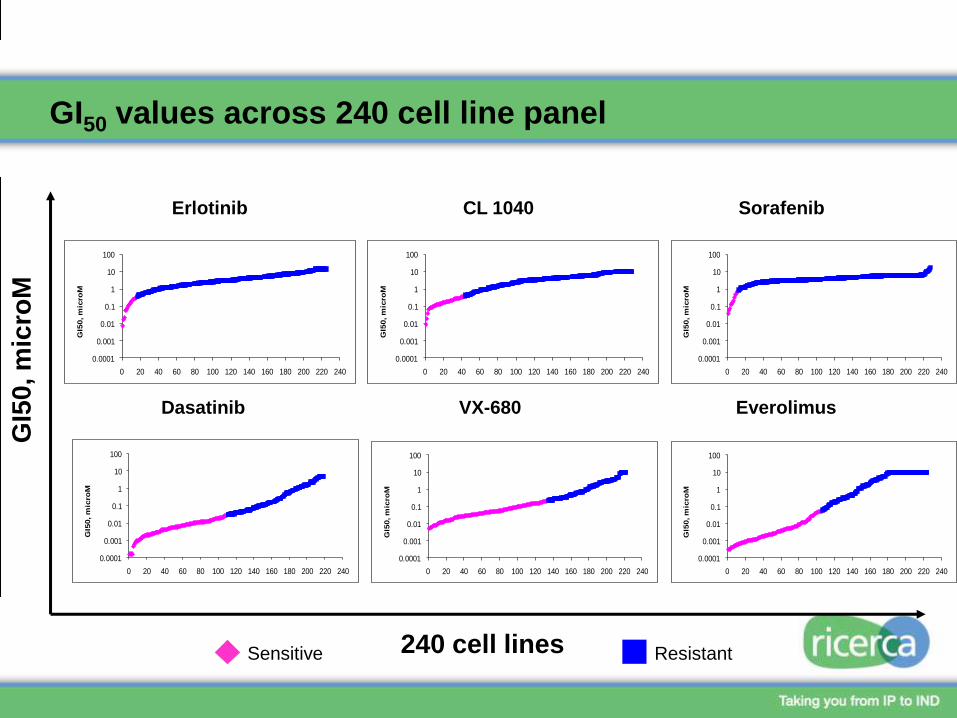
Erlotinib
Dasatinib
CL 1040
VX-680
Sorafenib
Everolimus
ResistantSensitive 240 cell lines
GI5
0, m
icro
M
0.0001
0.001
0.01
0.1
1
10
100
0 20 40 60 80 100 120 140 160 180 200 220 240
GI5
0, m
icro
M
0.0001
0.001
0.01
0.1
1
10
100
0 20 40 60 80 100 120 140 160 180 200 220 240
GI5
0, m
icro
M
0.0001
0.001
0.01
0.1
1
10
100
0 20 40 60 80 100 120 140 160 180 200 220 240
GI5
0, m
icro
M
0.0001
0.001
0.01
0.1
1
10
100
0 20 40 60 80 100 120 140 160 180 200 220 240
GI5
0, m
icro
M
0.0001
0.001
0.01
0.1
1
10
100
0 20 40 60 80 100 120 140 160 180 200 220 240
GI5
0, m
icro
M
0.0001
0.001
0.01
0.1
1
10
100
0 20 40 60 80 100 120 140 160 180 200 220 240
GI5
0, m
icro
M
GI50 values across 240 cell line panel
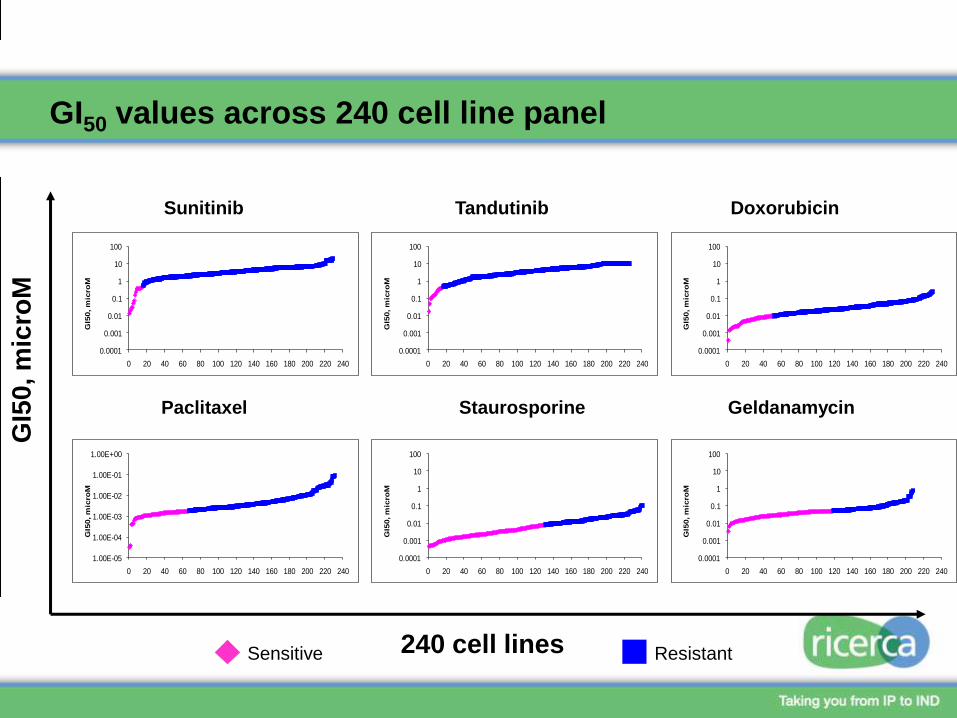
ResistantSensitive 240 cell lines
GI5
0, m
icro
M
Sunitinib
Paclitaxel
Tandutinib
Staurosporine
Doxorubicin
Geldanamycin
0.0001
0.001
0.01
0.1
1
10
100
0 20 40 60 80 100 120 140 160 180 200 220 240
GI5
0, m
icro
M
0.0001
0.001
0.01
0.1
1
10
100
0 20 40 60 80 100 120 140 160 180 200 220 240
GI5
0, m
icro
M
0.0001
0.001
0.01
0.1
1
10
100
0 20 40 60 80 100 120 140 160 180 200 220 240
GI5
0, m
icro
M
1.00E-05
1.00E-04
1.00E-03
1.00E-02
1.00E-01
1.00E+00
0 20 40 60 80 100 120 140 160 180 200 220 240
GI5
0, m
icro
M
0.0001
0.001
0.01
0.1
1
10
100
0 20 40 60 80 100 120 140 160 180 200 220 240
GI5
0, m
icro
M
0.0001
0.001
0.01
0.1
1
10
100
0 20 40 60 80 100 120 140 160 180 200 220 240
GI5
0, m
icro
M
GI50 values across 240 cell line panel
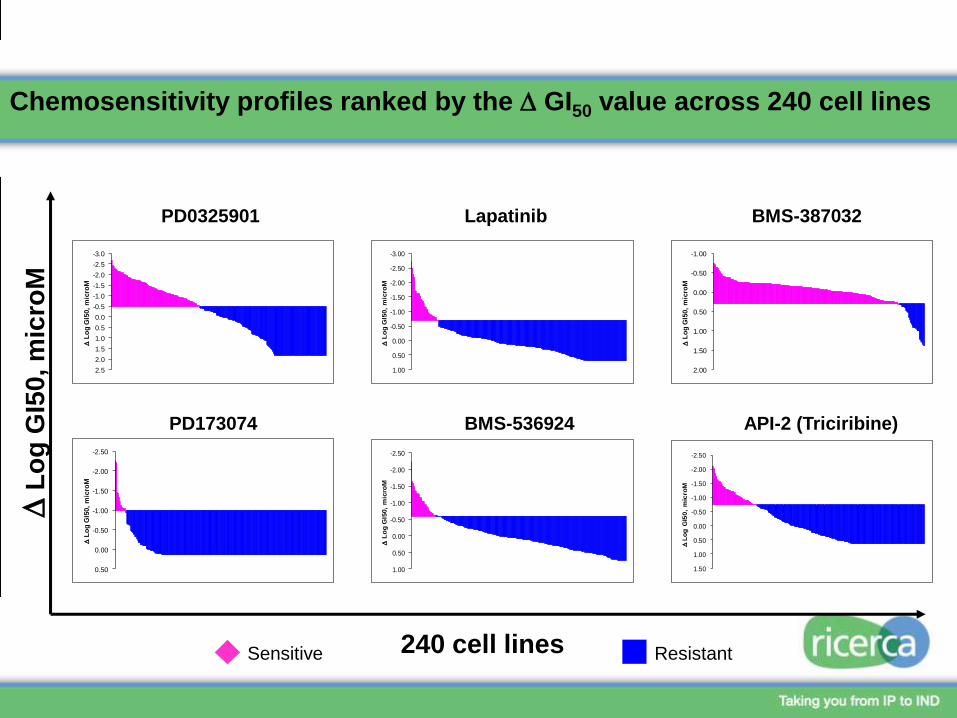
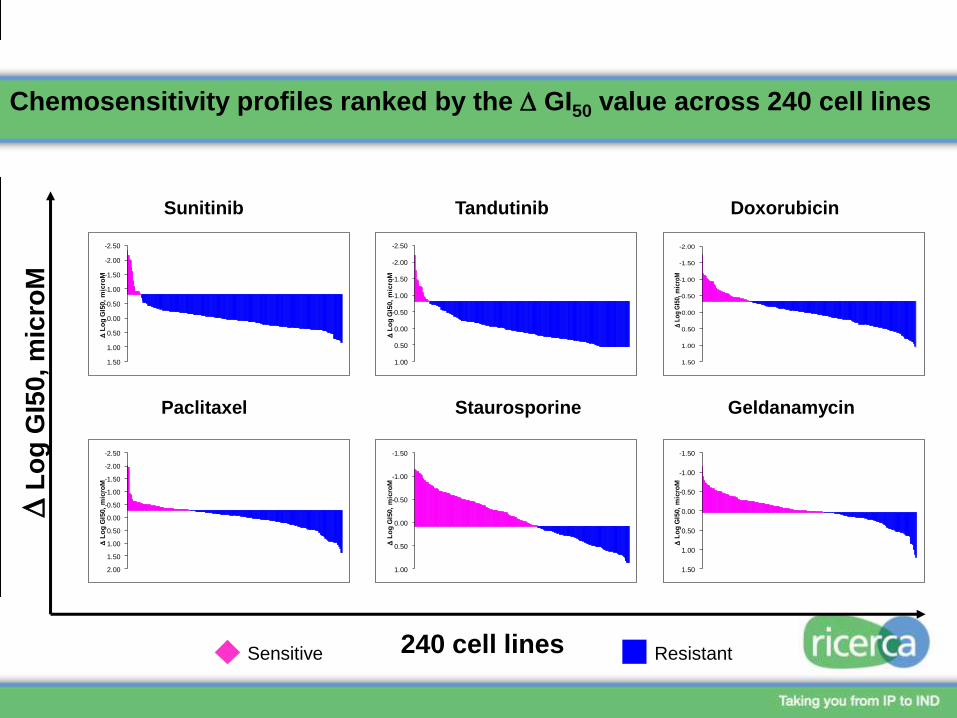
Chemosensitivity profiles ranked by the D GI50 value across 240 cell lines
ResistantSensitive 240 cell lines
DL
og
GI5
0, m
icro
M
PD0325901
PD173074
Lapatinib
BMS-536924
BMS-387032
API-2 (Triciribine)
-3.0
-2.5
-2.0
-1.5
-1.0
-0.5
0.0
0.5
1.0
1.5
2.0
2.5
DL
og
GI5
0,
mic
roM
-2.50
-2.00
-1.50
-1.00
-0.50
0.00
0.50
DL
og
GI5
0,
mic
roM
-3.00
-2.50
-2.00
-1.50
-1.00
-0.50
0.00
0.50
1.00
DL
og
GI5
0,
mic
roM
-2.50
-2.00
-1.50
-1.00
-0.50
0.00
0.50
1.00
DL
og
GI5
0,
mic
roM
-1.00
-0.50
0.00
0.50
1.00
1.50
2.00
DL
og
GI5
0,
mic
roM
-2.50
-2.00
-1.50
-1.00
-0.50
0.00
0.50
1.00
1.50
DL
og
GI5
0,
mic
roM
ResistantSensitive 240 cell lines
DL
og
GI5
0, m
icro
M
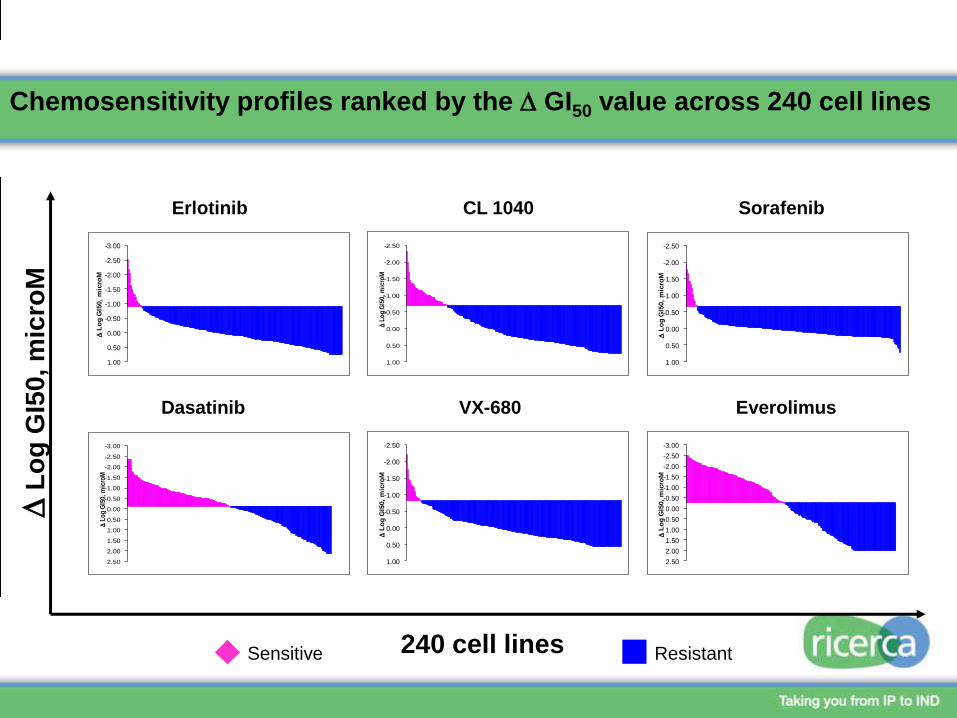
Erlotinib
Dasatinib
CL 1040
VX-680
Sorafenib
Everolimus
-2.50
-2.00
-1.50
-1.00
-0.50
0.00
0.50
1.00
DL
og
GI5
0, m
icro
M
-2.50
-2.00
-1.50
-1.00
-0.50
0.00
0.50
1.00
DL
og
GI5
0,
mic
roM
-3.00
-2.50
-2.00
-1.50
-1.00
-0.50
0.00
0.50
1.00
1.50
2.00
2.50
DL
og
GI5
0, m
icro
M
-2.50
-2.00
-1.50
-1.00
-0.50
0.00
0.50
1.00
DL
og
GI5
0,
mic
roM
-3.00
-2.50
-2.00
-1.50
-1.00
-0.50
0.00
0.50
1.00
1.50
2.00
2.50
DL
og
GI5
0,
mic
roM
-3.00
-2.50
-2.00
-1.50
-1.00
-0.50
0.00
0.50
1.00
DL
og
GI5
0,
mic
roM
Chemosensitivity profiles ranked by the D GI50 value across 240 cell lines
ResistantSensitive 240 cell lines
DL
og
GI5
0, m
icro
M
Sunitinib
Paclitaxel
Tandutinib
Staurosporine
Doxorubicin
Geldanamycin
-2.50
-2.00
-1.50
-1.00
-0.50
0.00
0.50
1.00
1.50
DL
og
GI5
0,
mic
roM
-2.50
-2.00
-1.50
-1.00
-0.50
0.00
0.50
1.00
DL
og
GI5
0,
mic
roM
-2.00
-1.50
-1.00
-0.50
0.00
0.50
1.00
1.50
DL
og
GI5
0, m
icro
M
-2.50
-2.00
-1.50
-1.00
-0.50
0.00
0.50
1.00
1.50
2.00
DL
og
GI5
0,
mic
roM
-1.50
-1.00
-0.50
0.00
0.50
1.00
DL
og
GI5
0,
mic
roM
-1.50
-1.00
-0.50
0.00
0.50
1.00
1.50
DL
og
GI5
0,
mic
roM
Chemosensitivity profiles ranked by the D GI50 value across 240 cell lines
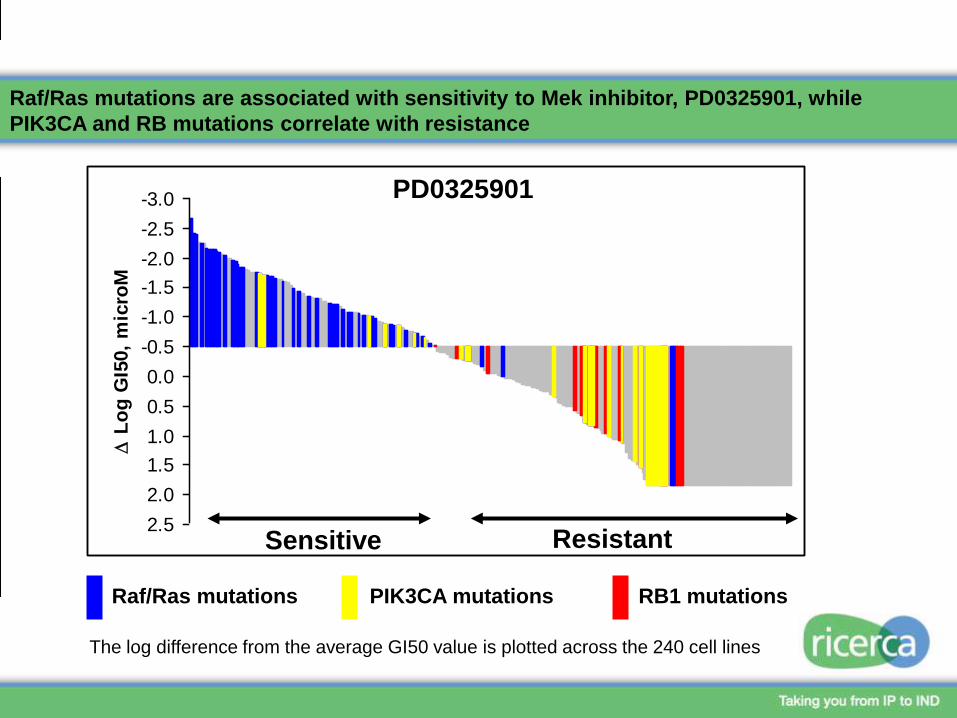
Raf/Ras mutations are associated with sensitivity to Mek inhibitor, PD0325901, while
PIK3CA and RB mutations correlate with resistance
-3.0
-2.5
-2.0
-1.5
-1.0
-0.5
0.0
0.5
1.0
1.5
2.0
2.5
D L
og
GI5
0,
mic
roM
PD0325901
The log difference from the average GI50 value is plotted across the 240 cell lines
Sensitive Resistant
RB1 mutationsPIK3CA mutationsRaf/Ras mutations
-2.50
-2.00
-1.50
-1.00
-0.50
0.00
0.50
1.00
DL
og
GI5
0,
mic
roM
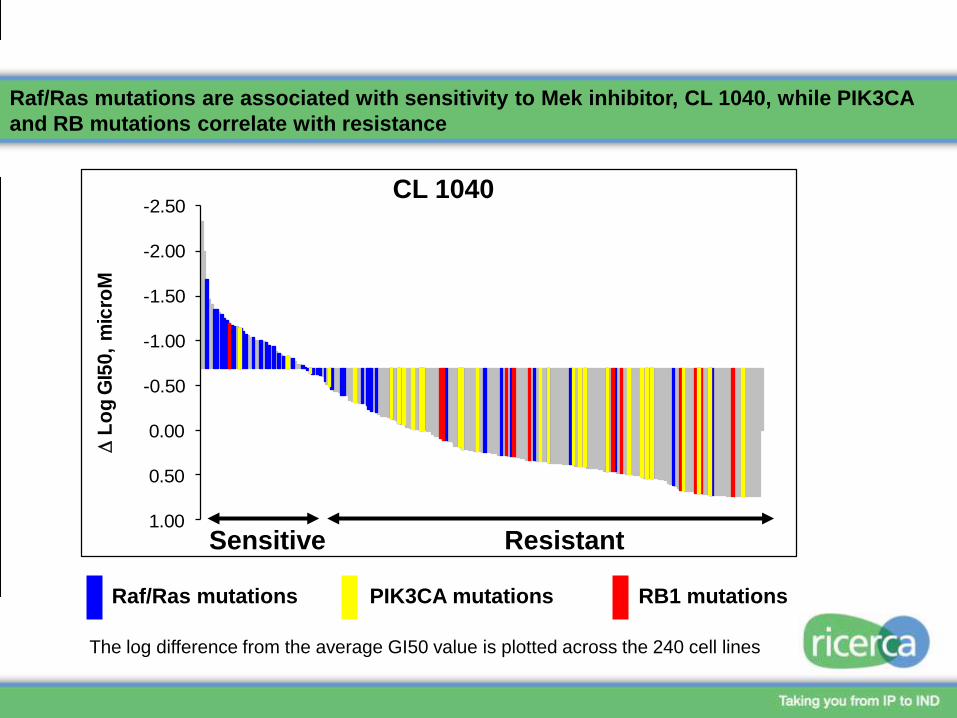
Raf/Ras mutations are associated with sensitivity to Mek inhibitor, CL 1040, while PIK3CA
and RB mutations correlate with resistance
CL 1040
The log difference from the average GI50 value is plotted across the 240 cell lines
PIK3CA mutationsRaf/Ras mutations RB1 mutations
Sensitive Resistant
-4.00
-3.00
-2.00
-1.00
0.00
1.00
2.00
3.00
DL
og
GI5
0,
mic
roM
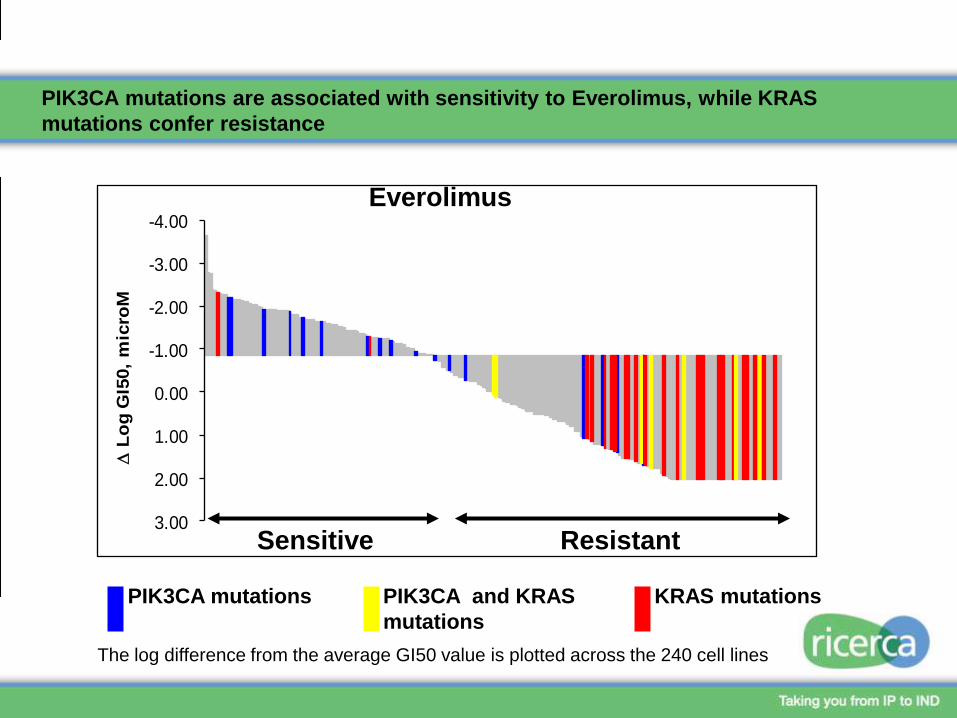
PIK3CA mutations are associated with sensitivity to Everolimus, while KRAS
mutations confer resistance
Sensitive
KRAS mutationsPIK3CA and KRAS
mutations
PIK3CA mutations
The log difference from the average GI50 value is plotted across the 240 cell lines
Resistant
Everolimus
-3.00
-2.50
-2.00
-1.50
-1.00
-0.50
0.00
0.50
1.00
1.50
2.00
2.50
DL
og
GI5
0,
mic
roM
Sensitive Resistant
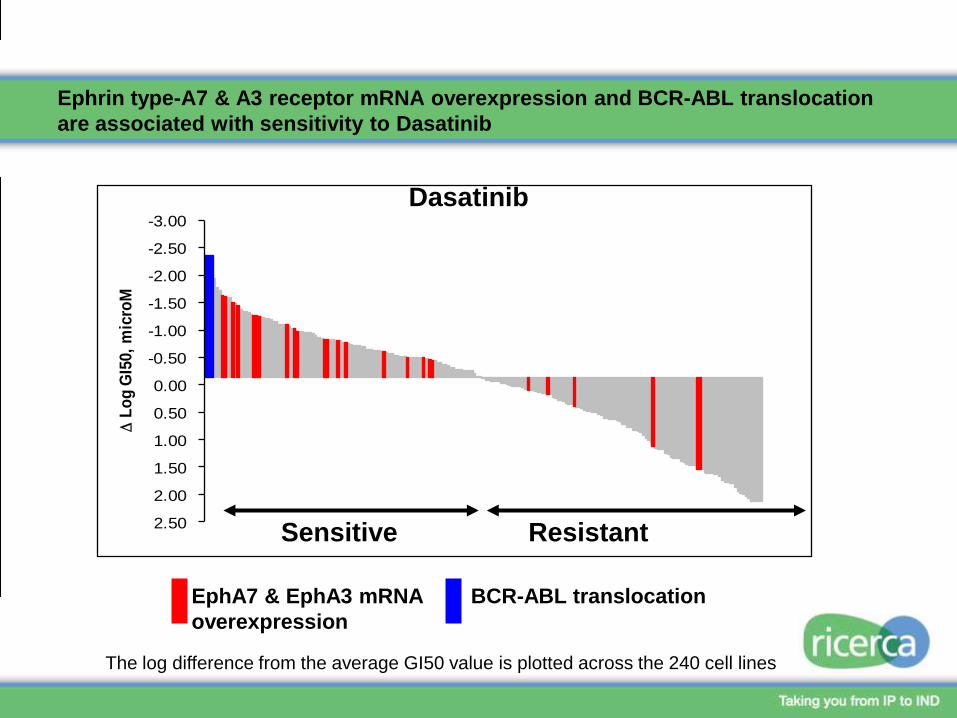
EphA7 & EphA3 mRNA
overexpression
The log difference from the average GI50 value is plotted across the 240 cell lines
BCR-ABL translocation
Dasatinib
Ephrin type-A7 & A3 receptor mRNA overexpression and BCR-ABL translocation
are associated with sensitivity to Dasatinib
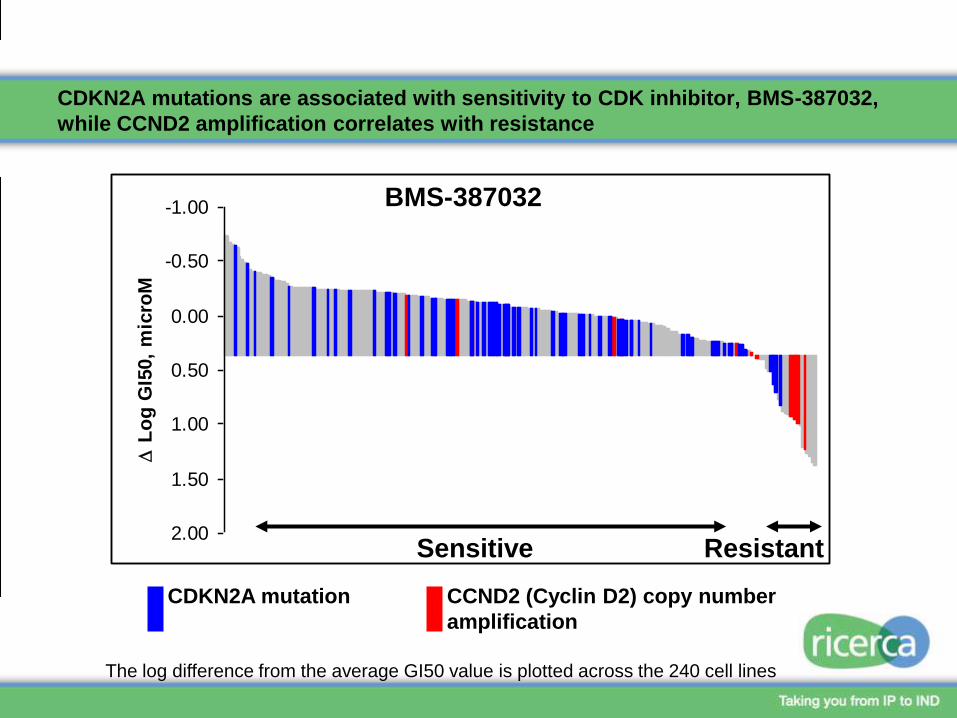
CDKN2A mutations are associated with sensitivity to CDK inhibitor, BMS-387032,
while CCND2 amplification correlates with resistance
-1.00
-0.50
0.00
0.50
1.00
1.50
2.00
D L
og
GI5
0,
mic
roM
Sensitive Resistant
CDKN2A mutation
The log difference from the average GI50 value is plotted across the 240 cell lines
CCND2 (Cyclin D2) copy number
amplification
BMS-387032
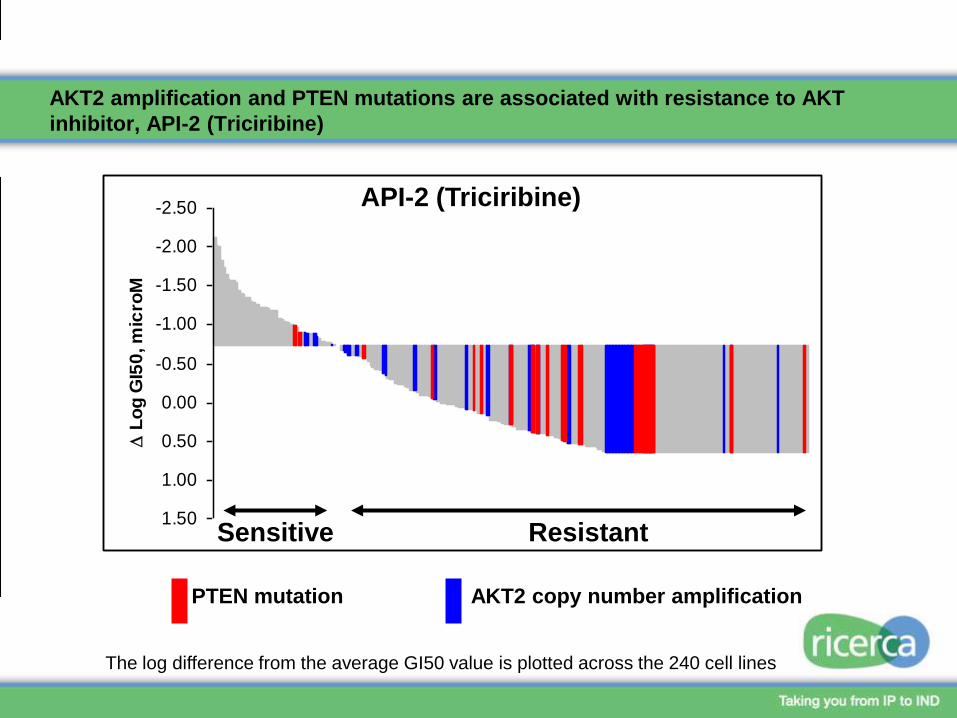
AKT2 amplification and PTEN mutations are associated with resistance to AKT
inhibitor, API-2 (Triciribine)
-2.50
-2.00
-1.50
-1.00
-0.50
0.00
0.50
1.00
1.50
D L
og
GI5
0, m
icro
M
Sensitive Resistant
PTEN mutation
The log difference from the average GI50 value is plotted across the 240 cell lines
AKT2 copy number amplification
API-2 (Triciribine)
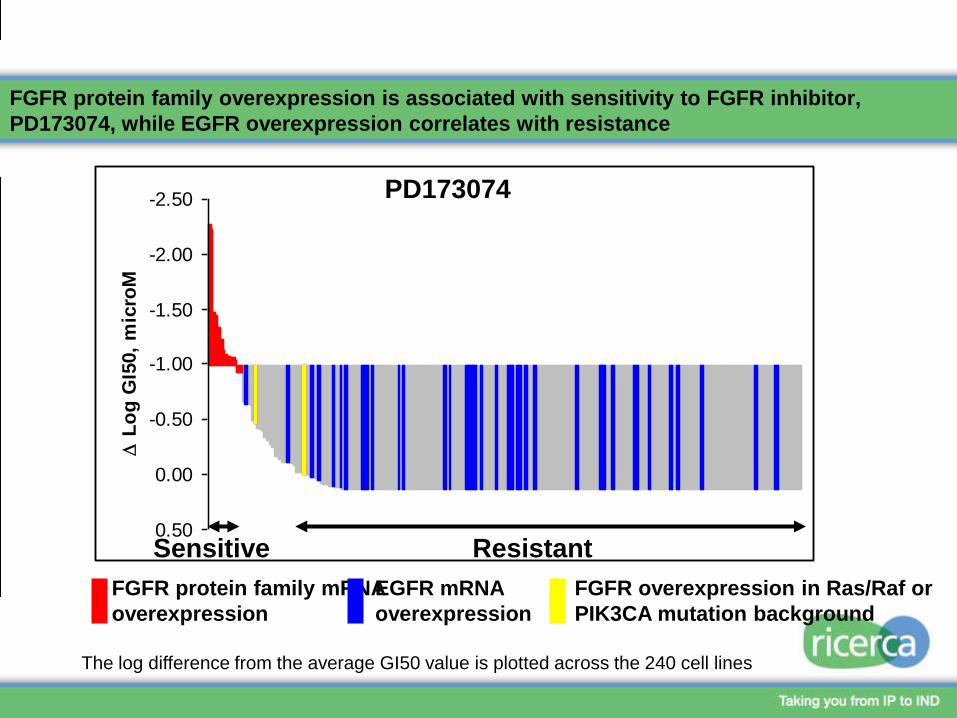
FGFR protein family overexpression is associated with sensitivity to FGFR inhibitor,
PD173074, while EGFR overexpression correlates with resistance
-2.50
-2.00
-1.50
-1.00
-0.50
0.00
0.50
D L
og
GI5
0,
mic
roM
FGFR overexpression in Ras/Raf or
PIK3CA mutation background
EGFR mRNA
overexpression
FGFR protein family mRNA
overexpression
The log difference from the average GI50 value is plotted across the 240 cell lines
Sensitive Resistant
PD173074
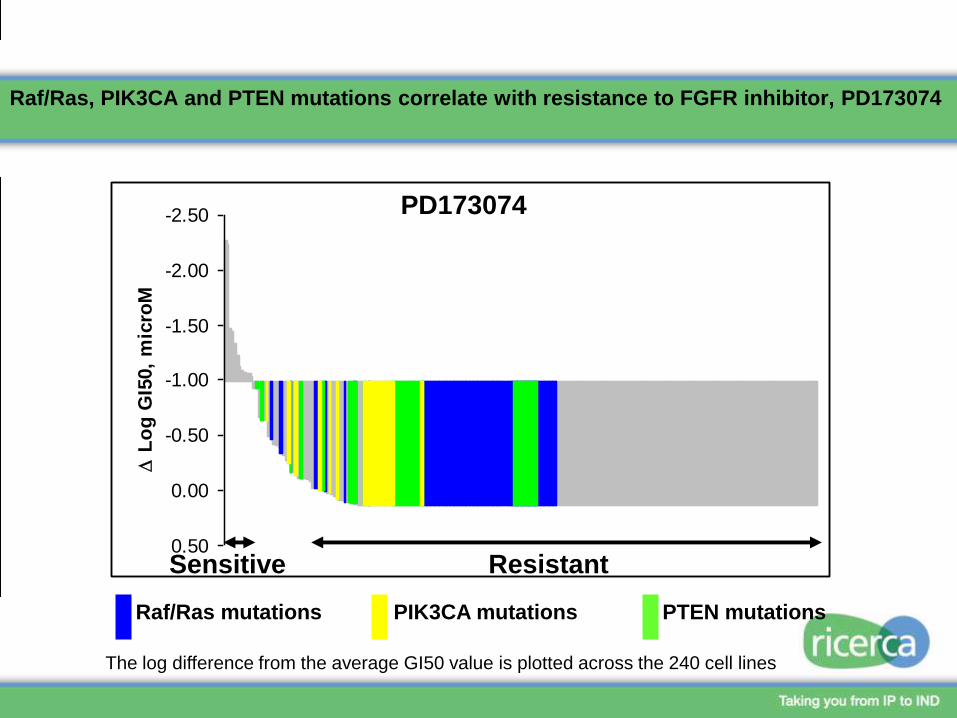
Raf/Ras, PIK3CA and PTEN mutations correlate with resistance to FGFR inhibitor, PD173074
-2.50
-2.00
-1.50
-1.00
-0.50
0.00
0.50
D L
og
GI5
0,
mic
roM
PD173074
PTEN mutationsPIK3CA mutationsRaf/Ras mutations
The log difference from the average GI50 value is plotted across the 240 cell lines
Sensitive Resistant
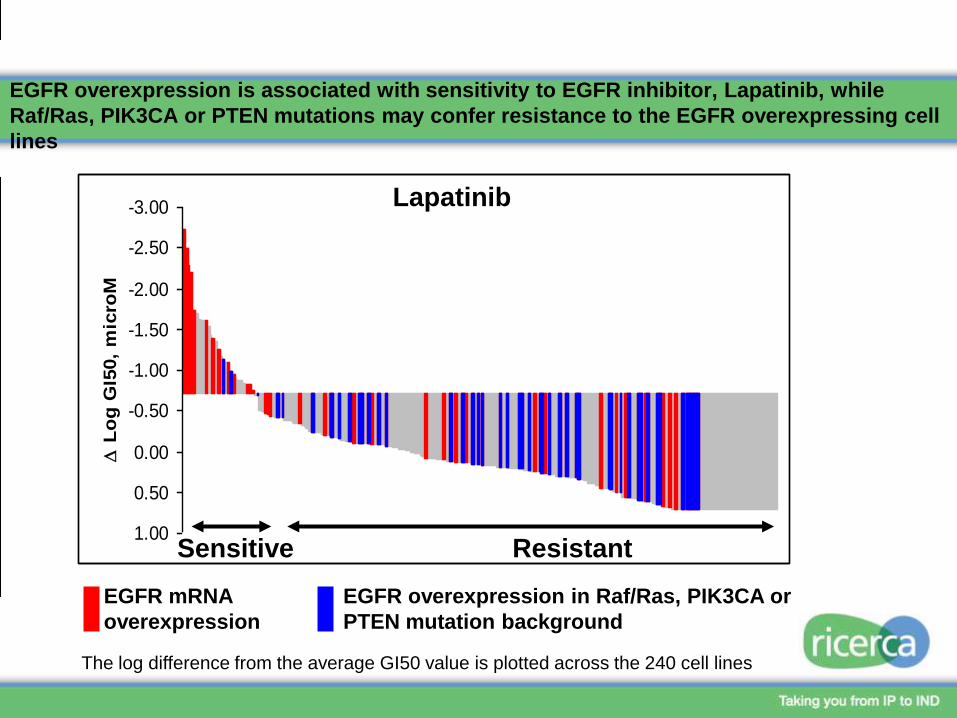
EGFR overexpression is associated with sensitivity to EGFR inhibitor, Lapatinib, while
Raf/Ras, PIK3CA or PTEN mutations may confer resistance to the EGFR overexpressing cell
lines
-3.00
-2.50
-2.00
-1.50
-1.00
-0.50
0.00
0.50
1.00
D L
og
GI5
0,
mic
roM
Lapatinib
Sensitive Resistant
EGFR overexpression in Raf/Ras, PIK3CA or
PTEN mutation background
EGFR mRNA
overexpression
The log difference from the average GI50 value is plotted across the 240 cell lines
-3.00
-2.50
-2.00
-1.50
-1.00
-0.50
0.00
0.50
1.00
D L
og
GI5
0,
mic
roM
Sensitive
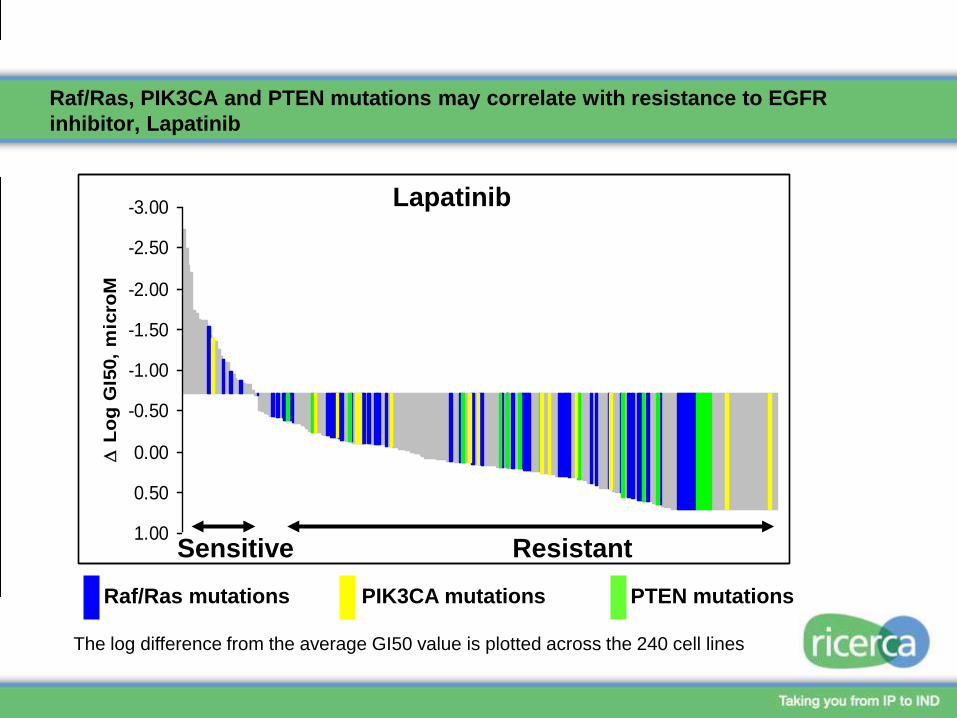
Raf/Ras, PIK3CA and PTEN mutations may correlate with resistance to EGFR
inhibitor, Lapatinib
PTEN mutationsPIK3CA mutationsRaf/Ras mutations
The log difference from the average GI50 value is plotted across the 240 cell lines
Resistant
Lapatinib
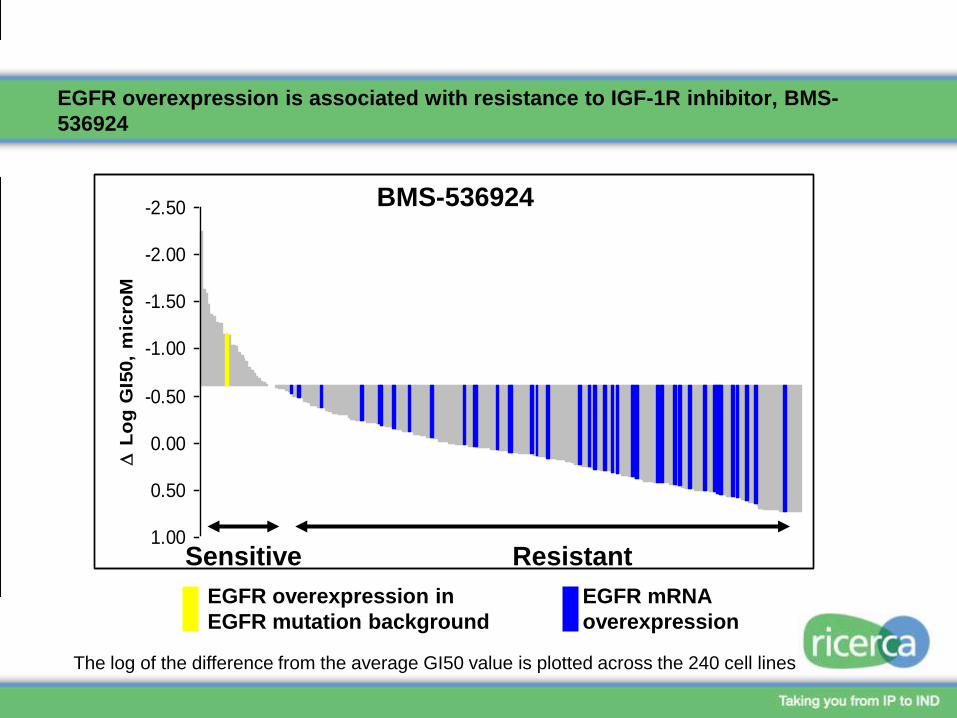
EGFR overexpression is associated with resistance to IGF-1R inhibitor, BMS-
536924
-2.50
-2.00
-1.50
-1.00
-0.50
0.00
0.50
1.00
D L
og
GI5
0,
mic
roM
BMS-536924
Sensitive Resistant
EGFR overexpression in
EGFR mutation background
EGFR mRNA
overexpression
The log of the difference from the average GI50 value is plotted across the 240 cell lines
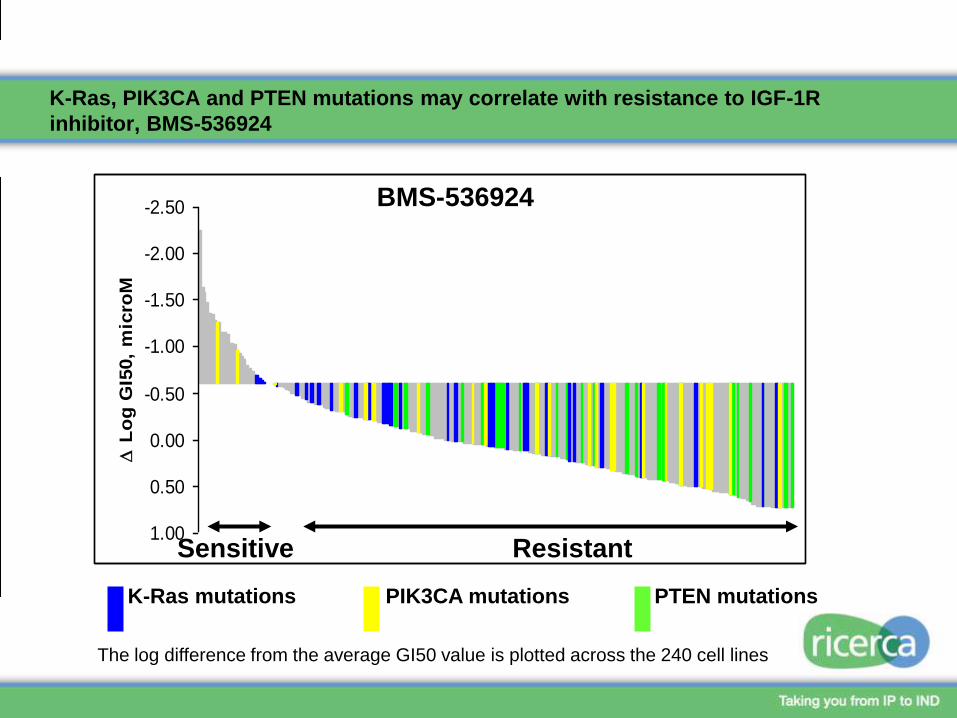
K-Ras, PIK3CA and PTEN mutations may correlate with resistance to IGF-1R
inhibitor, BMS-536924
-2.50
-2.00
-1.50
-1.00
-0.50
0.00
0.50
1.00
D L
og
GI5
0,
mic
roM
Sensitive
PTEN mutationsPIK3CA mutationsK-Ras mutations
The log difference from the average GI50 value is plotted across the 240 cell lines
Resistant
BMS-536924
Conclusions
We generated chemosensitivity profiles over 240 cell lines to reveal drug
sensitivity and resistance patterns and identified markers associated with a
specific response. It was found that Raf/Ras mutations confer sensitivity to MEK
inhibitors, PD0325901 and Cl 1040, while PIK3CA and RB mutations were
associated with resistance. Resistance to IGF-1R, FGFR, and EGFR inhibitors
correlated with PI3K/PTEN/Akt or Raf/Ras pathway activation. EGFR mRNA
overexpression was associated with resistance to FGFR and IGF-1R inhibitors.
Resistance to AKT inhibitor, API-2 (Triciribine), was associated with PTEN
mutations and amplification of AKT. PIK3CA mutations were associated with
sensitivity to Everolimus, while KRAS mutations confer resistance. Dasatinib
sensitivity was associated with BCR-ABL translocation and Ephrin type-A7 and
A3 receptor mRNA overexpression.