Embed Size (px)
Citation preview

Provisional GCSE and equivalent results in England, 2017 to 2018
Contact: Email: [email protected] Press office: 020 7783 8300 Public enquiries: 0370 000 2288
Provisional GCSE and equivalent results in England, 2017 to 2018 Quality and methodology information 16 October 2018

Provisional GCSE and equivalent results in England, 2017 to 2018
Contact: Email: [email protected] Press office: 020 7783 8300 Public enquiries: 0370 000 2288
Contents
Introduction 3
Changes from the 2016-17 release 3 Methodology 4
About the output 5
Data sources 5 Relevance 5 Key users 6 Timeliness and punctuality 7 How the output is created 8 Data added from other sources 8
Accuracy 9
Data coverage 9 Measurement error 10 Validation and quality assurance of source data 10 Data Processing 11 Statistical release production 11
Reliability 11
Accessibility 13
Disclosure Control 14
Coherence and comparability 14
Change in performance by school type over time in academies 14
Got a query? Like to give feedback? 15
Annex A: Timeline of changes in key stage 4 attainment 16 Annex B: Derived variables 18 Annex C: Further detail on school characteristics 20 Annex D: Floor standard and coasting schools 23 School types and particular circumstances (coasting) 23 Annex E: Glossary 24

3
Introduction
This quality and methodology document provides an overview of the key stage 4 attainment data used in
the production of the key stage 4 provisional statistical release (SRs) and the secondary school
performance tables. It provides information on the methodology used to calculate pupil attainment, as well
as information on the data sources, their coverage and quality, and how the data is validated and
processed.
This document is based on the Office for National Statistics’ guidelines for measuring statistical quality.
Changes from the 2016-17 release
GCSE reform
In 2018, reformed GCSEs in over 20 subjects (graded on the 9 to 1 scale) are included in performance
measures. Reformed GCSEs in English language, English literature and maths are included for the
second year since their introduction. A full list of the reformed subjects is included in Annex F of the
secondary accountability guidance.
Further subjects will have new GCSEs introduced over the next two years according to the timetable set
out by Ofqual.
Performance tables point scores
As set out previously in the secondary accountability guidance, from 2017 performance tables point
scores have been allocated to the new GCSEs on a 9 to 1 point scale corresponding to the new 9 to 1
grades. During the transition period (2017 to 2019) when a combination of reformed and unreformed
GCSEs can count towards performance measures, point scores from unreformed GCSEs will be
mapped onto the 9 to 1 scale with 8.5 being the maximum that can be achieved from an unreformed
GCSE.
EBacc Average Point Score
From 2018, the headline EBacc attainment measure is the new EBacc Average Point Score measure
(APS) (rather than the previous threshold measure based on achievement of passes in each of the
Ebacc pillars). The Ebacc APS is calculated by allocating points to a pupil’s best grades in EBacc
subjects, as follows:
the better grade of either English language or English literature (both subjects must be taken);
the grade for maths;
the best two grades from exams taken in science - grades will be taken from the following:
- if the single sciences option is chosen, three out of four single sciences must be chosen.
The best two grades will be taken from these subjects.
- grades for GCSE combined science.
the better grade of either geography or history; and
the best grade in a language.
These points are totalled for each pupil, with a zero for any missing EBacc subject areas (pillars), and
then divided by six to create an average point score per pupil. These scores are added together for all

4
pupils in a school’s end of key stage 4 cohort, and divided by the number in the cohort, to calculate the
school’s EBacc Average Point Score.
Further detail about EBacc Average Point Score and worked examples, can be found in the secondary
accountability guidance.
A range of additional performance measures and contextual information is published in performance
tables. Further details about what will be published in the performance tables are set out in the
Statements of Intent: https://www.gov.uk/government/publications/school-and-college-performance-tables-
statements-of-intent
Pupils with extremely negative progress scores – change from 2018 and onwards
The department has listened to feedback and has refined the methodology for Progress 8 in 2018.
This is in order to reduce the disproportionate impact that a small number of extremely negative
progress scores can have on a school’s average. We now limit how negative1 a pupil’s progress score
can be when calculating the school average. These pupils still have large negative scores (to reflect
that the pupils have made much less progress than other pupils in the same prior attainment group as
them), but the disproportionate effect they have on a school’s score has been reduced.
Further information on the calculation, the number of standard deviation(s) and minimum thresholds
per prior attainment group is available in Annex C of the secondary accountability guidance.
School performance tables published in October 2018 and January 2019 will display the progress figures calculated using this adjusted Progress 8 score. However, we will also publish the figures that do not place limits on pupil progress scores for transparency and to help inspectors and others identify how particular schools have been affected. This will be available in the school performance tables data download.
Methodology
The measures covered in the key stage 4 SRs include qualifications which count towards the secondary
performance tables. Following reforms to the performance tables in 2014, only a pupil’s first attempt at a
qualification is counted.
In 2018, reformed GCSEs in over 20 subjects (graded on the 9 to 1 scale) will be included in
performance measures. Once new reformed GCSEs (9-1) are introduced in a subject, unreformed GCSEs
(A*to G), International GCSEs or level 1/level 2 certificates in the same subject will no longer count in
performance tables. This includes early entries prior to 2017 and 2018 in unreformed qualifications.
A list of qualifications that count in the performance tables each year up to 2018 can be found here. Further
information on methodology used in the performance tables can be found on the performance tables
guidance page. A timeline of changes in key stage 4 attainment measures can be found in Annex A.
For more information on coherence and comparability, see page 14 of this document.
1 We are not setting a maximum limit on how positive a pupil’s progress score can be as there are much smaller numbers of extremely positive progress scores that have a disproportionate impact than extremely negative ones.
5
Publication of provisional data at school level in the performance tables
The publication of provisional data in advance of the 31 October deadline for secondary school admission
applications will continue to support parents who may wish to use the information when applying for a
secondary school place for their child. As in previous years, any amendments made after August 2018 will
be reflected in the full performance tables release in January 2018. School level figures will not be
published in the key stage 4 SR. The department first published provisional school level results in October
2015.
The decision to publish the provisional results at school level, for state-funded schools only, was based on
analysis of previous years’ data, which showed that provisional data is an accurate reflection of revised
data for the vast majority of state-funded secondary schools. This is explained in more detail in the
following section of this document: reliability. Provisional results are not published for independent schools
because the level of change between provisional and revised data is higher, given that independent
schools are unable to check their data until September, see timeline.
About the output
National and local authority (LA) information on pupil attainment at the end of key stage 4 in 2017/18 for
secondary school pupils in England will be published in the following releases:
Provisional GCSE and equivalent results in England 2017 to 2018 (October 2018)
Revised GCSE and equivalent results in England 2017 to 2018 (January 2019)
GCSE and equivalent results for previous years can be found on the Statistics: GCSEs (key stage 4)
section of gov.uk
School level information for the end of key stage 4 is published in the secondary school performance
tables.
Data sources
The key stage 4 datasets are compiled using information matched together from three data sources:
i. prior attainment records (key stage 2 results)
ii. school census records
iii. qualification entries and results collected from awarding bodies
Attainment data for all pupils at the end of key stage 4 is collected from the awarding bodies by the
department’s contractor.
Relevance
This section describes the degree to which the statistics meet current and potential needs of the users.
The key strength of the data is that it is derived from an administrative data collection. This means that it
can supply accurate data down to small geographical areas (school level). In addition, the data is merged
with other administrative data held by the department (the school census) to provide detailed information on
sub-groups of the school population. Pupil level data from different key stages can also be merged together
so that we can produce precise measures of pupil progress between one key stage and another.

6
Key users
Department for
Education Used to monitor national standards of key stage 4 attainment in
secondary schools in England. The national figures are used to
determine whether standards are improving or declining.
Data for sub-groups of the population are also analysed to inform
departmental policies aimed at closing gaps in attainment.
School level figures are used to identify schools where intervention
may be needed to bring standards up to an acceptable level.
Ofsted Used as part of the background information to inform school
inspections. For example, it enables inspectors to identify areas of
the curriculum or groups of pupils where a school appears to be
doing less well. This would then form part of the focus during the
inspection.
Ofqual Used as part of the evidence it reviews on the setting and
maintenance of standards in key stage 4 examinations.
Local authorities National data and that for other local authorities is used to set the
attainment of their area into context.
School level information is used to hold maintained schools to
account.
Schools Used to evaluate their own performance against national standards
and other local schools.
Used to identify high performing schools with similar circumstances
to their own that they can work with to improve their own standards.
School governors Used to hold schools to account, to identify strengths and
weaknesses and to support school improvement.
Teachers and head
teachers Used for analysis and self-evaluation, and to aid planning of school
improvement strategies.
Used to inform decisions about whether to apply for vacancies in
particular schools and also as background information when
preparing for interviews.
Parents Used to compare their own children’s performance to others in their
school, local authority and nationally.
Used to hold their children’s schools to account and identify areas
where they feel the school needs to improve.
Used to inform choice of a secondary school for their child.
Performance of schools in the local area is also a key consideration
for parents and prospective parents when moving house.
Others Used by researchers from this country and abroad. Used by others
to identify schools with particular levels of attainment that they may
wish to market their services to.

7
Timeliness and punctuality
Timeliness refers to the lapse of time between the period to which the data refer and the publication of the
estimates.
The timeline of the key stage 4 data cycle is as follows:
May and June
Main GCSE examinations taken
Secondary schools performance tables June checking exercise takes place – this allows state-funded schools to check the pupils we have recorded as being on their roll
August
The Joint Council for Qualifications (JCQ) collects results data from the awarding bodies
JCQ publish GCSE results in the third week in August
The department’s contractor receives results from the awarding bodies (data is collected throughout the year but the majority is collected in the summer)
September
The department receives provisional data from the contractor
Secondary schools performance tables checking exercise takes place
October
Provisional SR containing headline figures published alongside the provisional performance tables (published on 16 October in 2018 – around four weeks after the department receives the unamended data from the contractor)
Scrutiny of amendment requests following checking exercise
November and December
The department receives three sets of revised data, which includes further late results and later re-marks received from awarding organisations
January
Revised SR published alongside the secondary school performance tables. Figures are also broken down by pupil characteristics. The performance tables include full breakdowns of school level data.
Errata period commences for schools to request additional amendments to their data
February
Scrutiny of amendment requests made during the errata period
March
The department receives final data from the contractor and updates the performance tables and downloadable data file. The revised SR is not updated; however the final data will be used to update any time series in the following year’s SR

8
Punctuality refers to the time lag between the actual and planned dates of publication.
The proposed month of publication is announced on gov.uk at least twelve months in advance and precise
dates are announced in the same place at least four weeks prior to publication. In the unlikely event of a
change to the pre-announced release schedule, the change and the reasons for it would be announced.
How the output is created
Data on pupils’ attainment is collected from awarding bodies via the department’s contractor. This
information is linked with information on pupil characteristics taken from the school census and information
on pupils’ prior attainment. This data is used to produce the provisional SR and provisional school
performance tables.
The data is checked with schools during the performance tables checking exercise. The revised pupil
attainment data is then linked again with information on pupil characteristics and prior attainment to
produce the revised/final datasets and all derived variables recalculated. This data is published in the
revised SR and the school performance tables. Following publication of the revised performance tables,
there is a short errata process where schools can inform us of any additional changes that should be made
to the data. Following this process, the school performance tables data is finalised and the school
performance tables website updated. The final data is used to update the time series in the following year’s
SR.
A large number of variables are derived for publication in the key stage 4 SR and in the secondary school
performance tables. Annex B contains a summary of the key variables used in the publications.
Data added from other sources
Pupil characteristics
Information on pupil characteristics is taken from the school census. Details will be provided when 2018
breakdowns by characteristics are published in January 2019.
School characteristics
Information on school characteristics is taken from the Get information about schools service, which
replaced Edubase in September 2017. Annex C contains further information on the school characteristics
used in the publication.
9
Accuracy
Accuracy describes the closeness between an estimated result and the (unknown) true value.
Data coverage
The target population for the key stage 4 data collection is all pupils who are at the end of key stage 4,
typically those pupils starting the academic year aged 15.
We produce a provisional SR in October based on the provisional data covering headline national and local
authority information, alongside the provisional school performance tables. Amendments to numbers on roll
made during the June checking exercise (for state-funded schools only) are reflected in the provisional SR
and provisional school performance tables. The provisional SR does not contain any characteristics
breakdowns (other than gender) as these are more subject to change, particularly at local authority level.
We update this SR with revised data early the following calendar year when the full breakdown of school
level information is published in the performance tables. During the September checking exercise,
Independent schools, FE colleges with 14 to 16 provision and local authorities with closed schools need to
apply for any amendments to their numbers on roll. During the September checking exercise, schools and
colleges can also notify us of any other errors in their key stage 4 attainment data such as errors in
matching prior attainment results and missing results. Any changes requested are validated to ensure that
they comply with the rules before being accepted. Schools are also able to apply for pupils to be removed
from their figures, if they provide evidence and justifiable reasons in accordance with the checking
instructions guidance.
Following this checking exercise, the revised data is produced. This includes changes requested by
schools during the checking exercise, changes resulting from any successful marking reviews and any late
results. The data is then published in the revised key stage 4 SR and in the secondary school performance
tables.
Characteristic breakdowns such as ethnicity, special educational needs and first language will be published
alongside the revised national and local authority figures in the same SR.
There are a small number of further changes to the data following publication of the performance tables.
These changes are validated in the same way as those which are received during the checking exercise.
The performance tables (national, local authority and school level figures) are updated with these changes
but the SFR is not updated because the extent of the changes does not usually affect the national or local
authority figures. However, the final data will be used to update any time series in the following year’s
statistical first release.
A minor error affecting the calculation of some school’s Progress 8 scores has been found prior to release.
The key stage 2 threshold table – which is used to calculate pupils’ key stage 2 fine grades – used in the
calculation of Progress 8, contained some minor errors.
The department has calculated the impact, on the provisional Progress 8 data for each school; for the
majority of schools there is no impact. However, for 58 schools their provisional Progress 8 data would
change by between 0.01 and 0.04 (see Annex A). The correction would have no impact on these schools’
provisional Progress 8 bandings2. As such, the department has judged the impact of this error to be within
the levels of natural variation in school level Progress 8 data that we would normally expect between the
provisional and revised publication.
2 The labels on performance tables that show where a schools Progress 8 score is e.g. above or below average etc

10
Rather than correct the calculation, which would have necessitated a notable delay to the provisional
publication, the department has proceeded to publish (without correcting the error in the provisional
release) and has produced this transparency notice as supporting explanation. For more information please
see this transparency notice.
Measurement error
Measurement error is the difference between the actual value of a quantity and the value obtained by a
measurement. Repeating the measurement will reduce the random error caused by the accuracy of the
measuring instrument but not any systemic error caused by incorrect calibration of the measuring
instrument.
This section describes the administration and marking of key stage 4 examinations, the re-marking process
and the regulation of qualifications, all of which can affect the accuracy of key stage 4 attainment
measures.
Clear guidance is provided to schools regarding the administration of the GCSE papers, including
instructions for keeping the exam materials secure prior to the exams and storage of completed papers
until they are collected for marking.
The exam papers are externally marked by the awarding bodies to ensure that marking is consistent
between schools.
After marking, results are returned to schools. If schools have concerns over the marking of an exam
paper, they may request for it to be re-marked. Outcomes of appeals are not reflected in the provisional
data but are included in the revised data when received in adequate time by the department’s contractors
to process and check the data.
Further information on the general regulations for schools and how exams are conducted/marked can be
found on the JCQ website: Joint Council for Qualifications (JCQ) website.
Ofqual sets the standards and rules that awarding bodies need to meet when they design, deliver and
award regulated qualifications. They monitor awarding bodies and qualifications to make sure that
standards are maintained. They are a risk-based regulator and concentrate their resources to where they
are most needed. For example, they may discover that an awarding body’s processes need updating or
that there are risks connected to a qualification taken by thousands of students every year. Further
guidance on the role of Ofqual can be found at: How Ofqual regulate.
Further checks are undertaken during the checking exercise and these are outlined in the data coverage
section above.
Validation and quality assurance of source data
Once schools have completed their key stage 4 exams they are required to send their exam materials and
attendance registers to the awarding bodies for external marking and data capture.
Key stage 4 results are made available to schools on results day: in 2018 this was 23 August. This data is
then passed from the awarding bodies to the department’s contractor who carries out checks on the data
(for example checking the validity of Qualification Numbers). Depending on the volume and nature of
discrepancies, the contractor reports these back to awarding organisations for review. Once these checks
are completed the data is uploaded onto the contractor’s main database and further checks are carried out.

11
After the contractor has finished processing the data, it is then passed onto the department for use in the
SRs and performance tables.
Data Processing
Key stage 4 data received from awarding bodies are combined with pupil characteristics from the school
census and prior attainment by the department’s contractor. Records are matched, using identifiers such as
surname, forename, date of birth, UPN, gender and postcode. This successfully matches around 98 per
cent of results.
At every stage in the data cycle, the department checks all calculations used in the production of the
figures. The department carries out checks on the data to ensure that the files produced by the contractor
comply with the specified format and contain the correct information. All indicators at school level, local
authority level and national level are re-derived to ensure the contractor’s systems are programmed
correctly.
The entire process is subject to a ‘dry run’ during the summer. This involves producing a dummy dataset,
from the previous year’s dataset, which conforms to how the current year’s data will be supplied (for
example if new qualifications have been introduced, then dummy data would be added to last year’s data to
simulate these). This dummy dataset is used to test the contractor’s systems and the department’s
checking processes. This allows potential problems to be resolved prior to the receipt of the live data.
Statistical release production
All data in the SR tables are produced by one person and quality assured by another. Any discrepancies in
the data produced are discussed and resolved prior to publication. Examples of quality assurance are
provided in the box below.
Examples of further quality assurance
Comparisons with previous year’s figures to identify any large unexpected changes
Comparisons with provisional data to identify any large changes (revised/final data only)
Check totals are consistent across tables
Check patterns in the data (for example expected differences between subjects, high/low performing
local authorities)
Check figures against those produced for the performance tables
Reliability
The extent to which a figure changes over different versions of the same data.
The key stage 4 data can change between provisional and revised data as the revised data contains:
outcomes of the appeals process where schools ask for reviews for one or more of their pupils in the
belief that a clerical error has been made or the mark scheme has not been correctly applied
late results and re-marks – where results were received after the data was provided in August to the
contractor by awarding organisations
12
changes resulting from requests from schools to remove pupils who have recently arrived from
overseas, have been admitted following a permanent exclusion from another school, if the pupil is not
at the end of key stage 4, if the pupil has permanently left England, the pupil has left the school before
exams or the pupil is deceased
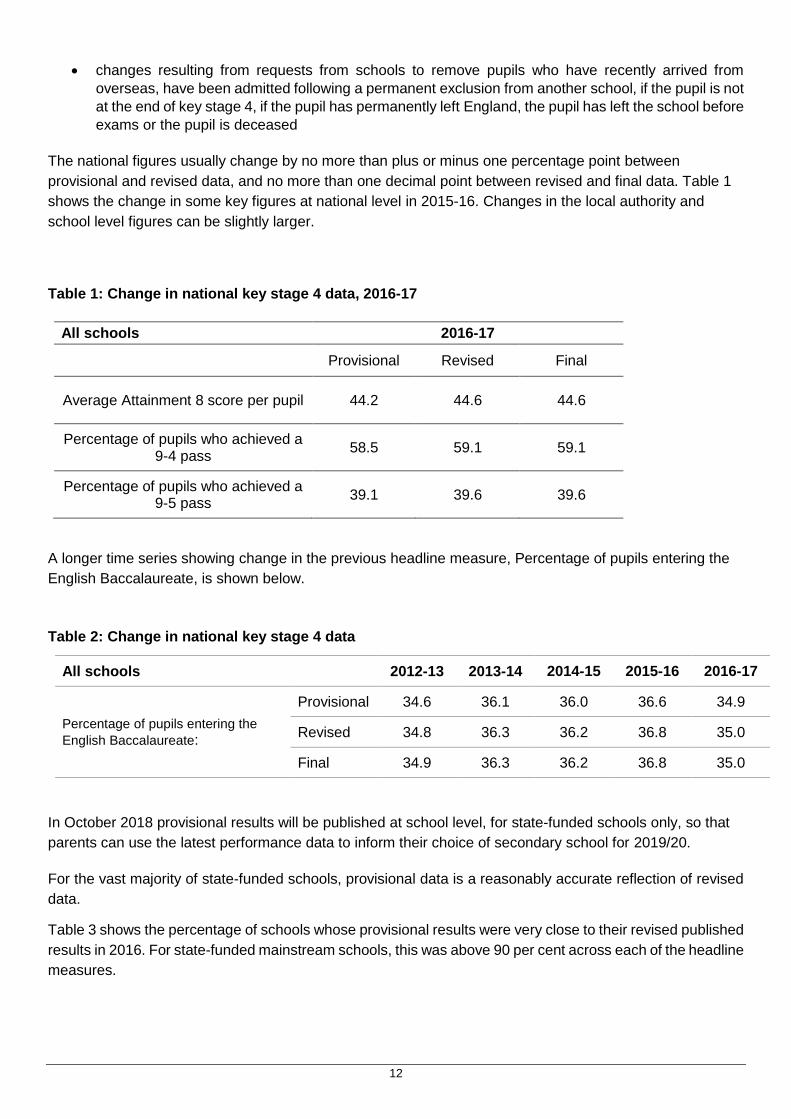
The national figures usually change by no more than plus or minus one percentage point between
provisional and revised data, and no more than one decimal point between revised and final data. Table 1
shows the change in some key figures at national level in 2015-16. Changes in the local authority and
school level figures can be slightly larger.
Table 1: Change in national key stage 4 data, 2016-17
All schools 2016-17
Provisional Revised Final
Average Attainment 8 score per pupil 44.2 44.6 44.6
Percentage of pupils who achieved a 9-4 pass
58.5 59.1 59.1
Percentage of pupils who achieved a 9-5 pass
39.1 39.6 39.6
A longer time series showing change in the previous headline measure, Percentage of pupils entering the
English Baccalaureate, is shown below.
Table 2: Change in national key stage 4 data
All schools 2012-13 2013-14 2014-15 2015-16 2016-17
Percentage of pupils entering the
English Baccalaureate:
Provisional 34.6 36.1 36.0 36.6 34.9
Revised 34.8 36.3 36.2 36.8 35.0
Final 34.9 36.3 36.2 36.8 35.0
In October 2018 provisional results will be published at school level, for state-funded schools only, so that
parents can use the latest performance data to inform their choice of secondary school for 2019/20.
For the vast majority of state-funded schools, provisional data is a reasonably accurate reflection of revised
data.
Table 3 shows the percentage of schools whose provisional results were very close to their revised published
results in 2016. For state-funded mainstream schools, this was above 90 per cent across each of the headline
measures.

13
Table 3: Difference between provisional and revised data in 2016
Measure Difference between
provisional and revised data in 2016
Percentage of state-funded schools1
Percentage of independent
schools
Average Progress 8 score1 within 0.05 decimal
points 97% N/A
Average Attainment 8 score per pupil
within 1 point 98% 68%
Percentage of pupils entering the English Baccalaureate
within 1 percentage point
99% 86%
1. Average Progress 8 score is provided for state-funded mainstream schools only.
Provisional results have not been released for independent schools because the level of change is higher
(as shown in table 3). This is mainly because independent schools are not included in the June checking
exercise and are therefore more reliant on the September checking exercise for making changes to their
pupil cohort, which is too late for amendments to be considered.
Accessibility
Accessibility is the ease with which users are able to access the data. It also relates to the format(s) in which the data are available and the availability of supporting information. The SR text is published in pdf format so that it is accessible to all users irrespective of their choice of
software. Care is also taken to ensure that the document meets accessibility guidelines. Key figures are
highlighted in the SR text which draws out the key messages such as changes over time and differences
between groups of pupils. Small tables or charts illustrating key figures are also included in the text.
Each SR is accompanied by formatted Excel tables with clear titles which allow general users to find more
detail than can be provided in the SR text. Any important limitations or inconsistencies in the data are
mentioned in footnotes so that users do not have to refer to the text or this document. Where there are
large numbers of tables, these are split into manageable sections (e.g. national tables in one file, local
authority tables in a separate file) so that users do not need to download larger files than necessary for
their needs.
The performance tables website provides a number of ways of searching for schools of interest (for
example by name of school, by town, within x miles of a postcode or all schools within a local authority) and
presents the data in a series of web pages showing different aspects of the data. The selected schools are
shown in alphabetical order by default but can be sorted by any measure if the user requires ranked data.
Key stage 4 information also forms part of the national pupil database (NPD) which is an education dataset
holding a wide range of information about pupils and students and has provided invaluable evidence on
educational performance to inform independent research, as well as studies commissioned by the

14
department. Any user wishing to conduct more detailed research or analysis may request an anonymised
pupil level extract of the national pupil database (NPD).
Disclosure Control
The Code of Practice for Official Statistics requires us to take reasonable steps to ensure that our published
or disseminated statistics protect confidentiality.
In the statistical first releases, an ‘x’ indicates that a figure has been suppressed due to small numbers.
Values of 1 or 2 or a percentage based on 1 or 2 pupils who achieved a particular level are suppressed.
Percentages based on 1 or 2 pupils who did not achieve a particular level are suppressed in circumstances
where non-suppression would lead to disclosure of pupils. Some additional figures have been suppressed
to prevent the possibility of a suppressed figure being revealed. This suppression is consistent with the
departmental statistical policy on confidentiality.
In the school level data, any figures relating to a cohort of 5 pupils or fewer will be suppressed. This applies
to sub-groups of pupils as well as the whole cohort; for example, if there were 5 boys and 3 girls in a
school, we would not publish attainment for boys or girls separately but would publish attainment for all
pupils (as this is based on 8 pupils).
Coherence and comparability
Coherence is the degree to which the statistical processes, by which two or more outputs are generated,
use the same concepts and harmonised methods. Comparability is the degree to which data can be
compared over time, region or other domain. We use the same methodology to produce the data within our SRs and the performance tables. We also
use a dataset produced at the same time for the performance tables and the provisional and revised SFRs.
As a result, the national and local authority figures included in both the provisional and revised SFRs and
the performance tables will match when comparing measures with the same definition.
There have been a number of changes to key stage 4 data, which can make comparisons over time
difficult. These changes are listed in annex A. Where time series are shown in the tables, any
discontinuities will be indicated in the tables by the use of a dotted line and footnotes will be included to
explain the reason for the discontinuity. Where possible (for example, when methodology rather than test
structures change), figures for previous years will be recalculated using the current methodology following
major changes in methodology.
Care should be taken when comparing results between years. This is because changes to methodologies
means that different rules have been applied meaning that direct comparisons are not always possible.
Change in performance by school type over time in academies
There is public interest in the performance of academies and performance data can be used to
calculate time series to show how results have changed since opening.
A variety of factors mean that care should be taken when comparing results between years:
• Changes to school accountability may lead schools to prioritise performance in different
measures. For example focusing more attention on pupil progress as a result of the
introduction of Progress 8.

15
• The group of schools included in each category changes from one year to the next – for
example local authority maintained schools changing to converter academies or new
provision schools having results published for the first time. This is demonstrated in Table 4,
which shows the number of schools included in attainment measures in each year. This
means that comparing the headline figures for any of these groups captures not only the
change in performance and the effect of reforms, but also the change in school composition.
For example, if the additional schools to a group all had attainment that was below the
average for the group, the effect would be to lower the average for the group even if each
individual school saw no change in its own results
Table 4: Attainment by school type
England, state-funded mainstream schools, 2018
Number of schools
with results in
2017
Number of
schools
with
results in
2018
Local authority maintained mainstream schools 1,038 930
Sponsored academies 593 642
Converter academies 1,375 1,431
Total number of academies and LA maintained schools 3,006 3,003
Source: Key stage 4 provisional attainment data
• Measuring improvement over time can show whether underperforming schools or groups of
schools are catching up with higher performing schools. However, when interpreting such
measures it should be noted that the extent to which a school improves is related to a range
of factors, which makes it difficult to fully reflect the effect of any individual factor. Schools
with the lowest previous outcomes tend to see the largest improvements but simply
controlling for starting points does nothing to account for the very different circumstances
which may exist in two schools. For example, in two schools with the same outcomes, pupils
might be far exceeding expectations given prior attainment in one while, in the other, pupils
might be making less progress than expected. This will affect the relative ability to
demonstrate improvement. For further discussion and analysis of these issues, see
Academies annual report and the methodology document for Multi-academy trust
performance measures: 2016 to 2017.
Got a query? Like to give feedback?
If from the media Press Office News Desk, Department for Education, Sanctuary
Buildings, Great Smith Street, London SW1P 3BT.
020 7783 8300
If non-media Glenn Goodman , Operations Division, School Performance Tables
Unit, , Department for Education, Sanctuary Buildings, Great Smith
Street, London SW1P 3BT

16
Annex A: Timeline of changes in key stage 4 attainment
2009-10 Publish per cent attaining the new English Baccalaureate.
Publish per cent attaining the “Basics” (A*-C English and maths).
Count accredited International GCSEs (and their precursors) for first time1
2010-11 GCSE only measures introduced to performance tables.
AS levels counted in English Baccalaureate
2011-12 First cohort to know of English Baccalaureate measure when making course
choices
2012-13 New biology, chemistry, physics and additional science GCSEs.
Marks awarded for spelling, punctuation and grammar in English literature,
history, geography and religious studies exams
2013-14 Wolf Review recommendations come into force in performance tables:
• only Wolf-approved qualifications counted
• each equivalent of one GCSE only
• no more than two non-GCSE qualifications
• new discounting rules
Only the first attempt at a qualification counts in the performance tables and SFR
in English Baccalaureate subjects.
GCSEs no longer unitised (modular) but linear.
New GCSE geography exam.
Unregulated International GCSEs no longer counted1
Further information on the Wolf Review can be found in the Review of vocational
education: the Wolf report
Further guidance on discounting and early entry rules can be found in the key
stage 4 discounting and early entry guidance.
2014-15 Early entry policy expanded to include all subjects.
Schools had the option to adopt a new accountability system a year early in 2015.
It included two new headline measures: Attainment 8 and Progress 8. 327
schools chose to adopt the new accountability system early and for these schools
Attainment 8 scores were published in the 2015 performance tables.
AS level computer science now contributes towards the EBacc science pillar.
Provisional performance tables published for the first time.
Key stage 2 attainment data was affected by the 2010 boycott and Single Level
Tests pilot - see the 2015 quality and methodology document for further details.
2015-16 New headline measures from 2016 onwards include:
• Progress 8
• Attainment 8
• percentage of pupils achieving the threshold in English and maths
• percentage of pupils achieving the English Baccalaureate
• percentage of pupils entering the English Baccalaureate

17
The English requirement for the threshold measure on percentage of pupils
achieving English and mathematics, and the English requirement for the English
Baccalaureate changed.
The point score scale for performance table measures changed from the 16-58
scale used in 2015 and earlier to a 1-8 scale
Expected standards for schools have changed (see annex D for further details)
2016-17 Results for new GCSEs in English language, English literature and mathematics
were published which use a 9 to 1 grading system, with 9 being the top grade. A
similar proportion of students achieving a grade 4 or above would have previously
achieved a grade C or above.
The headline attainment measures changed to use grade 5 or above in the
reformed English and mathematics GCSEs.
2017-18 Results for an additional 20 reformed GCSEs published using the 9-1 grading
system. Further subjects will have new GCSEs introduced over the next two years
according to the timetable set out by Ofqual.
In 2018 the headline measures for all state-funded secondary schools and those colleges that offer key stage 4 provision will be: • Progress 8 (adjusted); • Attainment 8; • EBacc Average Point Score (APS); • the percentage of pupils entering the EBacc; • the percentage of pupils achieving a pass in English and maths;
First publication of combined science as the alternative science pathway to
separate sciences. This replaces the previous core and additional science option.
1. In 2010, new regulated versions of International GCSEs were approved. This allowed them to be taken in state-
funded schools and included in the performance measures for the first time. At the same time, any results achieved by
pupils in the legacy unregulated IGCSEs in these subjects were also valid for inclusion in performance indicators.
The period for inclusion of the unregulated legacy International GCSEs in measures was set for two years, commencing from the point at which the replacement regulated certificates became available for teaching, with the expectation being that pupils should be moved to the regulated certificates after this period. In independent schools, pupils have continued to be entered for unregulated International GCSEs that do not count in performance measures and they have not been moved across to the regulated certificate versions.

18
Annex B: Derived variables
A large number of variables are derived for publication in the key stage 4 SRs and in the secondary school
performance tables. The performance measures contained within the SR are based on the same rules
used to produce the measures shown in the secondary school performance tables.
A full list of the derived variables that will be published in the provisional performance tables can be found
in the School and college performance tables 2018: statement of intent
The table below summarises key variables used in the publications:
Total pupils Number of pupils at the end of key stage 4
Eligible pupils Used to identify the pupils to be included in school, local authority
and national level calculations
Progress 8 Progress 8 aims to capture the progress a pupil makes from the
end of primary school to the end of secondary school. It is a type of
value added measure, which means that pupils’ results are
compared to the actual achievements of other pupils with the same
prior attainment.
School scores should be interpreted alongside their associated
confidence intervals. If the lower bound of the school’s confidence
interval is greater than zero, it can be interpreted as meaning that
the school has achieved greater than average progress compared
to pupils nationally, and vice versa if the upper bound is negative.
Further guidance can be found in the Progress 8 and Attainment 8
guidance
Attainment 8 Attainment 8 scores form the basis of Progress 8. It will measure
the achievement of a pupil across 8 subjects including maths
(double weighted) and English (double weighted), 3 further
qualifications that count in the English Baccalaureate (EBacc)
measure and 3 further qualifications that can be GCSE
qualifications (including EBacc subjects) or any other non-GCSE
qualifications on the DfE approved list.
To calculate a pupils’ Progress 8 score, their Attainment 8 score is
compared with the average Attainment 8 score of all pupils
nationally who had a similar starting point (or ‘prior attainment’)
5 or above in both
English and maths
Number/percentage of pupils achieving grades at 5 or above in
both English and mathematics GCSEs.
19
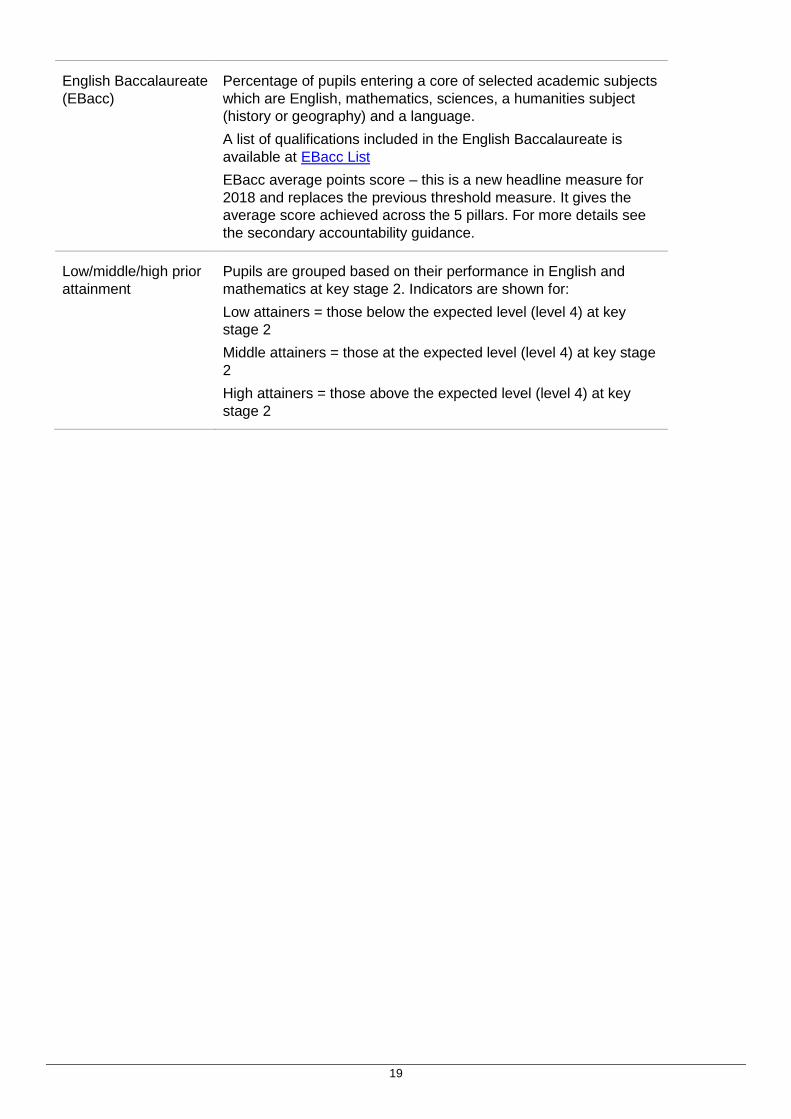
English Baccalaureate
(EBacc)
Percentage of pupils entering a core of selected academic subjects
which are English, mathematics, sciences, a humanities subject
(history or geography) and a language.
A list of qualifications included in the English Baccalaureate is
available at EBacc List
EBacc average points score – this is a new headline measure for
2018 and replaces the previous threshold measure. It gives the
average score achieved across the 5 pillars. For more details see
the secondary accountability guidance.
Low/middle/high prior
attainment
Pupils are grouped based on their performance in English and
mathematics at key stage 2. Indicators are shown for:
Low attainers = those below the expected level (level 4) at key
stage 2
Middle attainers = those at the expected level (level 4) at key stage
2
High attainers = those above the expected level (level 4) at key
stage 2

20
Annex C: Further detail on school characteristics
This annex provides further details of school characteristics taken from Get information about schools
School Admission Basis
The school admission basis is taken from Get information about schools and is self-declared by the school.
They are given as at 12 September at the start of the academic year and are defined as follows:
Selective schools Admits pupils wholly or mainly with reference to ability. These
schools were formally designated as grammar schools
Non-selective schools
in highly selective
areas
All schools in local authorities where 25% or more of secondary
places are in selective schools
All other non-
selective schools Includes schools in local authorities with some selection, as well
as those with no selection
School Type and groupings
The school types are taken from Get information about schools and are given as at 12 September at the
start of the academic year. They are defined as follows:
School types
Academy sponsor led Sponsored academies are all-ability, state-funded schools established
and managed by sponsors from a wide range of backgrounds, including
high performing schools and colleges, universities, individual
philanthropists, businesses, the voluntary sector, and faith communities
Academy converter Schools that have chosen through Governing Body Resolution and
application to the Secretary of State to become an academy under the
Academies Act 2010
Free school Free schools are all-ability state-funded schools set up in response to
what local people say they want and need in order to improve
education for children in their community. They have the same legal
requirements as academies and enjoy the same freedoms and
flexibilities
University technical
college (UTC) UTCs are all-ability and mixed sex state-funded schools, independent
of local authorities. They are not extensions of or conversions from
existing provision, but new 14 to 19 academies, typically with 500 to
800 pupils. UTCs specialise in subjects that need modern, technical,
industry-standard equipment, such as engineering and construction,
and teach these disciplines alongside business skills and a broad,
general education. Pupils integrate academic study with practical
learning, studying core GCSEs alongside technical qualifications

21
Studio school Studio schools are all-ability and mixed sex state-funded schools,
independent of local authorities. They are an innovative new model of
educational provision, delivering mainstream qualifications through
practical project-based learning. They are not extensions or
conversions from existing provision, but are new 14 to 19 academies,
typically with around 300 pupils
City technology
college (CTC) Independent all-ability, non-fee-paying schools offering pupils the
opportunity to study a curriculum geared, with the help of private sector
sponsors, towards the world of work. There are currently only three
CTCs as most converted to sponsor led academies a few years ago
Further education
college with provision
for 14 to 16 year olds
General further education colleges and sixth-form colleges with
provision for 14 to 16 year olds who wish to study high-quality
vocational qualifications alongside general qualifications including
English and maths within the key stage 4 curriculum. 2015 was the first
year in which colleges have pupils at the end of key stage 4
Pupil referral unit
(PRU) A PRU is established and maintained by a local authority which is
specially organised to provide education for children who are excluded,
sick or otherwise unable to attend mainstream school and is not a
special or other type of school
Alternative Provision
(AP) Alternative provision takes place when a local authority takes direct
responsibility for the education of a young person who is unable to
attend a mainstream school. Common reasons for a young person
receiving alternative provision include exclusion, medical needs or
school refusal
Non-maintained
special schools A school which has been approved as a special school and is not
maintained by a LA
Independent school Any school which provides full time education for 5 or more pupils of
compulsory school age, which is not state-funded or a non-state-funded
special school
Independent special
schools Approved by the Secretary of State for Education. They are run on a
not-for-profit basis by charitable trusts and normally cater for children
with severe and/or low incidence special educational needs. This group
includes non-maintained special schools
State-funded
mainstream schools Includes local authority maintained mainstream schools, academies,
free schools, city technology colleges (excluding all special schools,
pupil referral units, alternative provision and independent schools)
LA maintained school Schools fully or partially under local authority control that are state-
funded, mainly by the Dedicated Schools Grant. These include
community schools, foundation schools, voluntary aided school and
voluntary controlled schools and also local authority maintained special
schools

22
State-funded special
schools Includes local authority maintained special schools, academy sponsor
led special schools, academy special schools and special free schools
State-funded school Includes local authority maintained schools, academies, free schools,
city technology colleges and state-funded special schools (excluding
hospital schools, pupil referral units, alternative provision and
independent schools)
All independent Includes independent schools, independent special schools and non-
maintained special schools
Religious character Religious character is taken from Get information about schools and is the legal designation of each school.

23
Annex D: Floor standard and coasting schools
For 2018, the definitions for the floor and coasting standard remain unchanged from previous years, as set out below. Floor standard From 2016, a school is below the floor standard if its Progress 8 score is below -0.5, and the upper band of the 95% confidence interval is below zero.[1 If a school’s performance falls below this floor standard, then the school may come under scrutiny through inspection. Floor standards do not apply to special schools, independent schools, pupil referral units, alternative
provision, hospital schools, UTCs, FE colleges with 14-16 provision and studio schools.
Schools are excluded from a Progress 8 floor standard in a particular year where they have fewer than 6
pupils at the end of key stage 4, or where fewer than 50% of pupils have key stage 2 assessments that can
be used as prior attainment in the calculations of Progress 8.
Confidence intervals are explained in more detail on page 26 and in Annex D of the secondary
accountability guidance.
Coasting schools The coasting definition is based on three years of data, using the same performance measures that
underpin the floor standards. In line with regulations,[2] in 2018 a secondary school will fall within the
coasting definition if, based on revised data for all of 2016, 2017 and 2018:
in 2016, 2017 and 2018 the school’s Progress 8 score was below -0.25[3]
School types and particular circumstances (coasting)
A school has to be below the relevant coasting threshold in all three years to fall within the overall coasting
definition. Schools will be excluded from the coasting measure if:
they have fewer than 6 pupils at the end of key stage 4
or fewer than 50% of pupils have key stage 2 assessments that can be used as prior attainment in
the calculations of Progress 8 or
or the school closes within the academic year (except if it reopened as a converter academy[4]
Any school that is excluded from the coasting measure in a particular year cannot be defined as coasting
until it has three consecutive years of data that meets the coasting definition. No school will be identified as
coasting until after the revised secondary performance tables are published in January.
The coasting definition applies to all state-funded mainstream maintained schools and academies with the
relevant key stage 4 data. It does not apply to special schools, independent schools, pupil referral units,
alternative provision, hospital schools, UTCs, FE colleges with 14-16 provision and studio schools.
[1] Some schools chose to opt into Progress 8 in 2015. This was the floor standard in 2015 for those schools that chose to opt in. [2] The Coasting Schools (England) Regulations 2017 [3] In addition, the upper band of the confidence interval is below zero. [4] Schools that have become a converter academy during any point within the three-year coasting period will not be subject to the coasting standard until the school has of three years of consecutive data as a converter academy.

24
Annex E: Glossary
Attainment 8 score The achievement of pupils across 8 subjects including maths (double weighted)
and English (double weighted), 3 further qualifications that count in the English
Baccalaureate (EBacc) measure and 3 further qualifications that can be GCSE
qualifications (including EBacc subjects) or any other non-GCSE qualifications
on the DfE approved list.
Checking exercise In September each year, schools are asked to check the provisional KS4 data
that we hold for their school during the performance tables checking exercise.
The data is uploaded to a secure website and schools can inform us via this
website of any pupils that are included in their school in error, or of any missing
pupils. They can also notify us of any other errors in the data such as errors in
matching prior attainment results and apply for pupils to be discounted from their
figures, if they have recently arrived from overseas and their first language is not
English. Any changes requested are validated to ensure that they comply with
the rules before being accepted.
Designated religious
character
An Order made by the Secretary of State for Education under section 69(3) of
the School Standards and Framework Act 1998(a), as applied in relation to
independent schools by section 124B(1)(b) of that Act.
English Baccalaureate (EBacc) A school performance measure. It allows people to see how many
pupils get a grade 5 or above in the core academic subjects at key stage 4.
Floor Standard The floor standard is the minimum standard for pupil attainment and/or progress
that the Government expects schools to meet.
From 2016 a school will be below the floor standard if its Progress 8 score is
below -0.5, and the upper band of the 95% confidence interval is below zero. If a
school’s performance falls below this floor standard, then the school may come
under scrutiny through inspection. Confidence intervals are explained in more
detail in the Progress 8 and Attainment 8 guidance.
Get information about
schools
Get information about schools is a register of educational establishments in
England and Wales, maintained by the department. It provides information on
establishments providing compulsory, higher and further education.
The information included is provided from the establishments themselves and
also from LAs and teams within the department.
JCQ Joint Council for Qualifications. A membership organisation comprising the
seven largest providers of qualifications in the UK.
KS2 Key stage 2. This covers years 3 to 6 in primary schools. Pupils are normally 10
or 11 years old at the end of key stage 2.
KS4 Key stage 4. This covers years 10 and 11 in secondary schools. Pupils are
normally aged 15 years old at the end of key stage 4.
LA Local authority
25
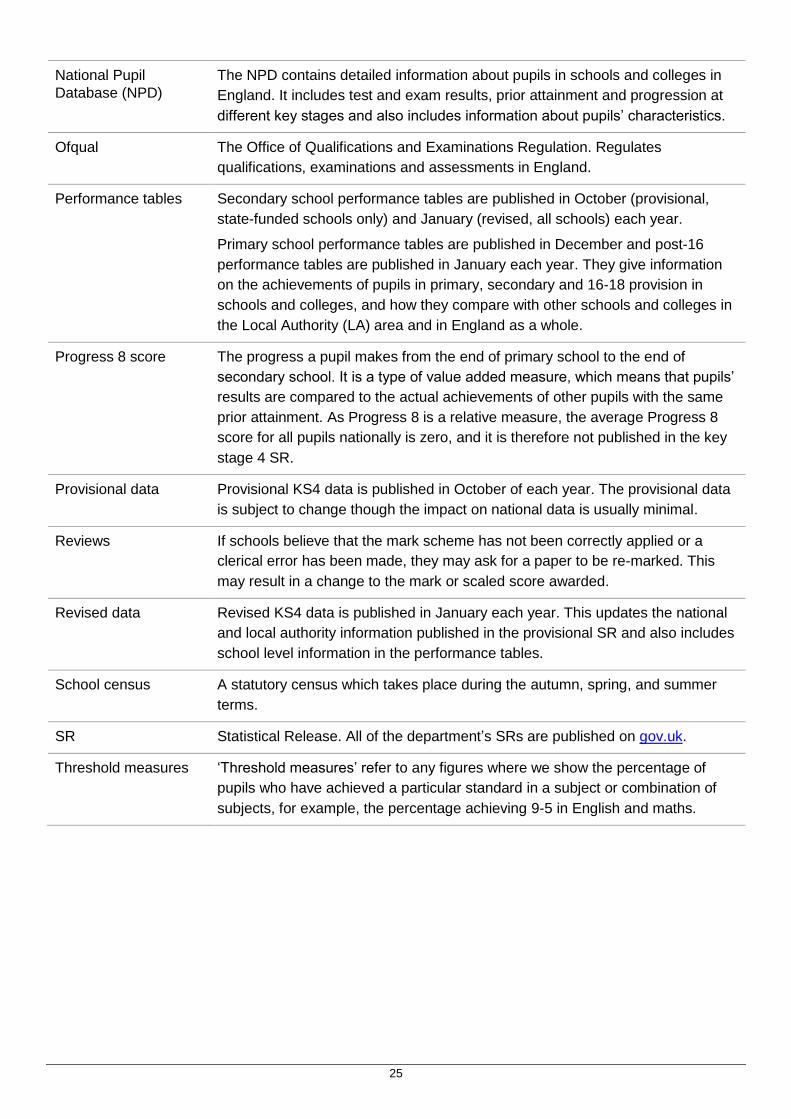
National Pupil
Database (NPD)
The NPD contains detailed information about pupils in schools and colleges in
England. It includes test and exam results, prior attainment and progression at
different key stages and also includes information about pupils’ characteristics.
Ofqual The Office of Qualifications and Examinations Regulation. Regulates
qualifications, examinations and assessments in England.
Performance tables Secondary school performance tables are published in October (provisional,
state-funded schools only) and January (revised, all schools) each year.
Primary school performance tables are published in December and post-16
performance tables are published in January each year. They give information
on the achievements of pupils in primary, secondary and 16-18 provision in
schools and colleges, and how they compare with other schools and colleges in
the Local Authority (LA) area and in England as a whole.
Progress 8 score The progress a pupil makes from the end of primary school to the end of
secondary school. It is a type of value added measure, which means that pupils’
results are compared to the actual achievements of other pupils with the same
prior attainment. As Progress 8 is a relative measure, the average Progress 8
score for all pupils nationally is zero, and it is therefore not published in the key
stage 4 SR.
Provisional data Provisional KS4 data is published in October of each year. The provisional data
is subject to change though the impact on national data is usually minimal.
Reviews If schools believe that the mark scheme has not been correctly applied or a
clerical error has been made, they may ask for a paper to be re-marked. This
may result in a change to the mark or scaled score awarded.
Revised data Revised KS4 data is published in January each year. This updates the national
and local authority information published in the provisional SR and also includes
school level information in the performance tables.
School census A statutory census which takes place during the autumn, spring, and summer
terms.
SR Statistical Release. All of the department’s SRs are published on gov.uk.
Threshold measures ‘Threshold measures’ refer to any figures where we show the percentage of
pupils who have achieved a particular standard in a subject or combination of
subjects, for example, the percentage achieving 9-5 in English and maths.

26
© Crown copyright 2018 You may re-use this information (excluding logos) free of charge in any format or medium, under the terms
of the Open Government Licence. To view this licence, visit Open Government Licence or e-mail:
Where we have identified any third party copyright information you will need to obtain permission from the
copyright holders concerned.
Glenn Goodman, Operations Directorate, School Performance Table Unit, Department for Education,
Sanctuary Buildings, Great Smith Street, London, SW1P 3BT
Email: [email protected]
This document is also available from our website:
https://www.gov.uk/government/collections/statistics-gcses-key-stage-4.