Embed Size (px)
Citation preview

W202–W209 Nucleic Acids Research, 2008, Vol. 36, Web Server issue Published online 15 May 2008doi:10.1093/nar/gkn255
PROTEUS2: a web server for comprehensive proteinstructure prediction and structure-based annotationScott Montgomerie1, Joseph A. Cruz1, Savita Shrivastava1, David Arndt1,
Mark Berjanskii1 and David S. Wishart1,2,*
1Department of Computing Science and Department of Biological Sciences, University of Alberta and 2NationalResearch Council, National Institute for Nanotechnology (NINT), Edmonton, AB, Canada T6G 2E8
Received February 1, 2008; Revised April 12, 2008; Accepted April 20, 2008
ABSTRACT
PROTEUS2 is a web server designed to supportcomprehensive protein structure prediction andstructure-based annotation. PROTEUS2 acceptseither single sequences (for directed studies) ormultiple sequences (for whole proteome annotation)and predicts the secondary and, if possible, tertiarystructure of the query protein(s). Unlike most othertools or servers, PROTEUS2 bundles signal peptideidentification, transmembrane helix prediction,transmembrane b-strand prediction, secondarystructure prediction (for soluble proteins) and homol-ogy modeling (i.e. 3D structure generation) into asingle prediction pipeline. Using a combination ofprogressive multi-sequence alignment, structure-based mapping, hidden Markov models, multi-component neural nets and up-to-date databasesof known secondary structure assignments,PROTEUS is able to achieve among the highestreported levels of predictive accuracy for signalpeptides (Q2 = 94%), membrane spanning helices(Q2 = 87%) and secondary structure (Q3 score of81.3%). PROTEUS2’s homology modeling servicesalso provide high quality 3D models that comparefavorably with those generated by SWISS-MODELand 3D JigSaw (within 0.2 A RMSD). The averagePROTEUS2 prediction takes »3 min per querysequence. The PROTEUS2 server along with sourcecode for many of its modules is accessible a http://wishart.biology.ualberta.ca/proteus2.
INTRODUCTION
Ten years ago, the sequencing of whole genomes was aformidable, multi-year challenge. Now, thanks to advancesin DNA sequencing technology, it is possible to sequence
an entire bacterial genome in as little as a week (1).It is clear that our capacity to sequence organisms faroutpaces our capacity to manually annotate their genomes(2). As a result, there is a growing interest in develop-ing software to facilitate automated or semi-automatedgenome annotation (3). At the same time, there is anincreasing desire to develop automated methods that cangenerate comprehensive annotations—annotations thatprovide detailed information about each protein’s func-tion, location, interacting partners, substrates, pathwaysand structure. Our laboratory has a long-standing interestin developing comprehensive, automated genome/pro-teome annotation tools (3–5). We also believe that high-quality structure prediction and modeling can play animportant role in facilitating genome annotation. We arenot alone in this view. Indeed, structure prediction andstructure modeling (i.e. homology modeling) are quicklybecoming a routine part of many protein analyses andproteome annotation efforts (6). Annotation systems suchas BASYS (4), BACMAP (5), PEDANT (7) and othersall depend on large-scale secondary structure predictionsto assist in identifying possible functions, to determinesubcellular locations or to identify structural genomicstargets.
Beyond its application to routine annotation, structureprediction can also be used to assess organism-specifictrends in secondary structure content, to identify proteinfolds, to identify domains, and to estimate the proportionof ‘unfolded’ or unstructured proteins in a given genome(8–10). It is also common to use structure predictions orstructure modeling to decide where and how to subcloneprotein fragments for expression, where to join or insertgene fragments, or where to add affinity tags for proteinpurification. It is also possible to use secondary structureprediction to calibrate circular dichroism (CD) andFourier transform infrared spectroscopy (FTIR) measure-ments when monitoring the folding or unfolding proteinswith no known 3D structure (11).
Over the past decade, a number of excellent structureprediction and structure modeling servers have emerged.
*To whom correspondence should be addressed. Tel: +780 492 0383; Fax: +780 492 5305; Email: [email protected]
� 2008 The Author(s)
This is an Open Access article distributed under the terms of the Creative Commons Attribution Non-Commercial License (http://creativecommons.org/licenses/
by-nc/2.0/uk/) which permits unrestricted non-commercial use, distribution, and reproduction in any medium, provided the original work is properly cited.
at University O
f Alberta L
ibrary on Decem
ber 20, 2011http://nar.oxfordjournals.org/
Dow
nloaded from

These include Porter (12) and PsiPred (13) for secondarystructure prediction of soluble proteins, SWISS-MODEL(14) and 3D JigSaw (15) for homology modeling,TMHMM (16) for transmembrane helix prediction, Pred-TMBB for transmembrane b-barrel prediction (17) andSignalP (18) for signal peptide prediction. However, mostof these tools are highly specialized, single applicationservers that perform only one type of prediction, for justone sequence at a time. Consequently, if a newly sequencedprotein does not fit neatly into one of the standardprediction categories it is difficult to get a very completeor well-annotated result. For instance, if a protein (such asOmpA) happens to have a signal peptide, an N-terminalmembrane spanning domain, and a C-terminal solublecytoplasmic domain that is homologous to a known 3Dstructure, a user may have to visit at least four different webservers to get a complete structural analysis of the protein.Trying to merge these disparate results into a single,coherent prediction would require a significant amount ofmanual inspection, reformatting and alignment. If onewished to analyze hundreds of proteins of a similar nature,such a task would prove to be very challenging, especiallygiven the fact that very few structure prediction toolssupport local installations. Indeed, even fewer are dis-tributed as open source applications. As a result, theintegration, local installation or customization of thesetools is almost impossible.
Another limitation to essentially all secondary structureprediction systems is the fact that they do not fully exploitthe information that is already available in the proteinstructure databases (i.e. the PDB). We have recentlyshown that by finding sequence homologues in the PDBand by using a process called 3D-to-2D mapping, it ispossible to increase the accuracy of secondary structureprediction (of soluble proteins) by as much as 10% (19).A similar approach has recently been applied to Porter asa means of significantly improving its secondary structurepredictions (20). Applying this simple structure mappingprotocol to predicting the structure of transmembranehelix or transmembrane b-barrel, proteins could poten-tially improve their corresponding prediction accuraciesby a similar amount.
In an effort to address some of the current shortcomingsin structure prediction and structure-based annotation,we have developed the PROTEUS2 structure predictionserver. PROTEUS2 is unique among structure predictionservers in that it bundles signal peptide identification,transmembrane helix prediction, transmembrane b-strandprediction, (soluble) secondary structure prediction andhomology modeling (i.e. 3D structure generation) into aunified prediction pipeline that supports both singlesequence and large, multi-sequence submissions. Using acombination ofmachine learning and database comparisontechniques, PROTEUS2 is able to achieve very high levelsof predictive accuracy for signal peptide identification(Q2=95%),membrane spanning regions (Q2=87%) andsecondary structure (Q3=81%). It is also capable of pro-ducing high-quality 3D models (with downloadable coor-dinates) when appropriate database matches are found.The PROTEUS2 server is freely available, as is the sourcecode and binaries for a stand-alone (nonserver) version.
PROGRAM DESCRIPTION
PROTEUS2 is composed of two parts, a front-end web-interface (written in Perl and HTML) and a back-endconsisting of five different structure prediction programs(written in Java, Perl and C/C++) along with four localdatabases (about 310 Mbytes in size). The front-endaccepts both FASTA and raw sequence data. Thesequences may be either pasted or typed into thetext box or uploaded through a file browse button.The server accepts both single sequence and multiplesequence files. As part of the server interface, users mustselect the kingdom to which the source organism belongs(Gram+, Gram� and Eukaryote) to improve the qualityof the signal peptide predictions. For multi-sequencesubmissions users must provide an email address to whichthe results can be sent.The output for a typical PROTEUS2 prediction
consists of several pages of hyperlinked or scrollable textfiles (Figure 1) including sequence/structure alignments,predictions for signal peptide location and cleavage sites,membrane spanning regions (both helices and b-strands)and putative or known domains. Signal peptide segmentsare marked with an ‘S’, membrane spanning helices areidentified with a ‘T’, membrane b-strands are identifiedwith a ‘B’, regular helices are marked with an ‘H’, regularb-strands with an ‘E’, coil regions with a ‘C’ and signalpeptide cleavage sites with a lowercase ‘c’. PROTEUS2also generates confidence scores for each type ofsecondary structure (additional details about the con-fidence scores are available on PROTEUS2 documenta-tion pages). If a 3D structure is generated, the PDBcoordinates, information about the matching PDB struc-ture, the predicted alignment, the sequence identity, thenumber of modeled residues and a hyperlink to view theresulting structure through the WebMol viewer (21) areprovided. Users may override PROTEUS2 default choiceof structure templates by preselecting a PDB file underthe PROTEUS2 options menu. It is also possible to togglethe energy minimization option on or off to improve eitherthe quality or speed of structure generation.In order to perform its structure predictions most
accurately and efficiently, PROTEUS2 follows a stricthierarchy of analyses and database comparisons (see flowchart in Figure 2). When a query sequence is received,PROTEUS2 initially performs a signal peptide identifica-tion step using a profile-based hidden Markov modeling(HMM). This step is followed by BLASTing the queryprotein against a database of 2587 proteins with knownsignal peptides obtained from the PPT-DB (22). If asignificant (Expect <10�10) match is found, the resultingalignment is used to transfer the known signal peptide dataof the template molecule to the query protein using atechnique called 3D-to-2D mapping (19). If a signal pep-tide (and cleavage site) is identified, the sequence is trun-cated and sent to the next prediction step. If no signalpeptide is identified, the server keeps the query sequenceunchanged. In the next step, the query sequence is alignedagainst a specially constructed database of 275 solvedhelical membrane proteins. This membrane helix databasewas also obtained from the PPT-DB. If a significant
Nucleic Acids Research, 2008, Vol. 36,Web Server issue W203
at University O
f Alberta L
ibrary on Decem
ber 20, 2011http://nar.oxfordjournals.org/
Dow
nloaded from
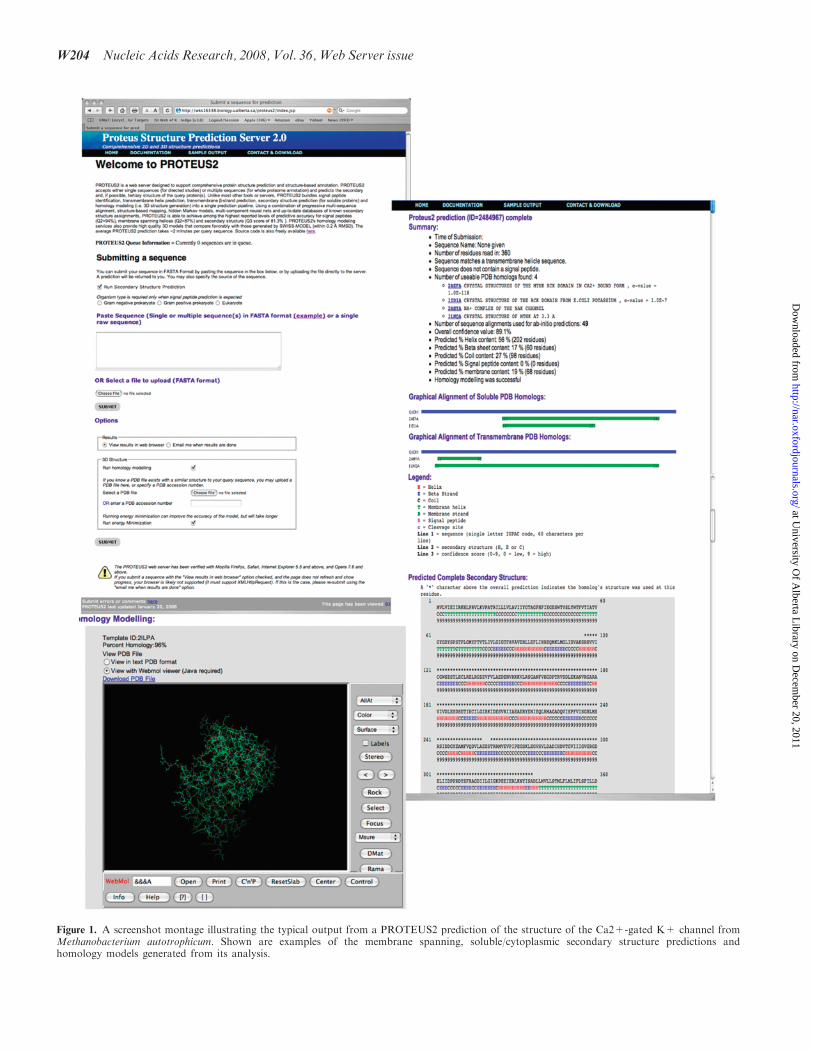
Figure 1. A screenshot montage illustrating the typical output from a PROTEUS2 prediction of the structure of the Ca2+-gated K+ channel fromMethanobacterium autotrophicum. Shown are examples of the membrane spanning, soluble/cytoplasmic secondary structure predictions andhomology models generated from its analysis.
W204 Nucleic Acids Research, 2008, Vol. 36,Web Server issue
at University O
f Alberta L
ibrary on Decem
ber 20, 2011http://nar.oxfordjournals.org/
Dow
nloaded from

(Expect <10�10) match is found, the resulting alignment isused to transfer the known secondary structure of thetemplate membranemolecule to the query protein using thepreviously mentioned 3D-to-2D mapping technique. If nomatch can be found, the program applies TMHMM 2.0(16) to predict the membrane spanning helical regions.To reduce the number of false positives identified byTMHMM, the query sequence is also BLASTed against thePPT-DB’s cytoplasmic protein database (16 618 nonredun-dant, nonmembrane proteins obtained from the PDB) andany significant matches (Expect <10�10) have theirpreviously identified membrane helices removed. If nomembrane helices can be found, a similar protocol is usedto determine whether the query protein has any transmem-brane b-barrel segments. In particular, PROTEUS2 firstuses TMB-HUNT (23) to identify whether the querysequence is a potential membrane b-barrel protein. Oncethe existence of a membrane b-barrel protein has beenconfirmed, the location of the b-strands is predicted usingan approach that combines a locally developed secondarystructure predictor (19) with a 3D-to-2D mapping ofthe b-strands from homologous membrane b-barrelproteins.
After the signal peptides and transmembrane segments(helices or b-strands) have been identified, PROTEUS2proceeds to the third structure prediction step. In this step,PROTEUS2 initially compares the query sequence to
PPT-DB’s collection of water-soluble proteins of knownstructure. The secondary structures for these proteins wereassigned using VADAR as reported previously (19,21). Ifa significant (Expect <10�10) match is found, the same3D-to-2D mapping procedure is used to assign or predictthe secondary structure. If no match can be found, thePROTEUS2 applies a locally developed ‘jury of experts’prediction method to predict the secondary structures asdescribed in our earlier publication (19).Once the signal peptide, membrane spanning regions
and secondary structures have been predicted, the querysequence is directed to a locally developed homologymodeling program called HOMODELLER (24). If oneor more PDB files with a BLAST expect score of <10�10
was previously found in either of the earlier 3D-to-2Dmapping steps, the highest scoring homolog covering thelargest region of the query sequence is used as a templatefor HOMODELLER to build a 3D structure. WhilePROTEUS2 always succeeds in generating linear (i.e.secondary structure) predictions for any query sequence,3D structures will only be generated if the query proteinpasses the HOMODELLER thresholds.
ALGORITHMS AND TESTING
In developing the HMMs for signal peptide predictionprogram (called PredictSP), more than 2000 signal peptidesand 1200 control peptides (covering the N-terminalsequence to the cleavage site) were obtained from theSignalP data set (24). These test sequences are partitionedinto groups belonging to Gram+ (453 peptides), Gram�
(1199 peptides) and Eukaryotic (1599 peptides) organisms.The predictor was trained to recognize not only the exis-tence of a signal peptide, but also its length and cleavagesite. PredictSP was subject to 10-fold cross-validationduring the testing and training phases. The performance ofPredictSP was further enhanced by employing previouslydeveloped 3D-to-2D mapping methods using the signalpeptide database (SPDB) obtained from the PPT-DB.PROTEUS2 transmembrane prediction program builds
from two previously developed and freely available pro-grams, TMHMM (16) and TMB-HUNT (23). TMHMMuses a HMM to identify transmembrane helices, whileTMB-HUNT uses amino acid composition statistics toidentify potential membrane b-barrel proteins. We coupledTMB-HUNT to a locally developed secondary structurepredictor (19) to obtain ‘de novo’ secondary structureassignments of the transmembrane b-strands. The perfor-mance of both transmembrane prediction methods wasenhanced by exploiting the 3D-to-2D mapping methodsthat we previously developed for predicting the secondarystructure of water-soluble proteins (19). Training andtesting of the algorithms was conducted using the relevanttransmembrane PPT-DB databases (22).In implementing the ‘jury of experts’ approach for pre-
dicting the secondary structure of water-soluble proteins,we used the same programs and methods we developedpreviously (19). In training and testing the program nearly2000 sequence-unique sequences were analyzed, requiringsome 100 hours of CPU time. The program was written
Figure 2. A flow chart showing the logic and sequential operationsperformed by PROTEUS2 on each query sequence.
Nucleic Acids Research, 2008, Vol. 36,Web Server issue W205
at University O
f Alberta L
ibrary on Decem
ber 20, 2011http://nar.oxfordjournals.org/
Dow
nloaded from

such that secondary structure predictions from theconsensus predictor could be overridden if a homologousprotein could be found in PROTEUS2 secondary structuredatabase.PROTEUS2 homology modeling module,
HOMODELLER, is quite conventional and employsstandard homology modeling techniques (14,15). It usesBLAST to search through an internal, nonredundantversion of the PDB database (which is updated monthly)to find and align the closest matching sequence homolog.Mismatched residues in the template sequence are changedto match the query sequence, but with the same �1-anglesof the template. Gaps in coil regions are handled using aloop library (consisting of >13 000 loops derived fromhigh-resolution structures in the PDB). The insertedregions are superimposed and then iteratively adjustedto fit the surrounding regions using a cyclic coordinatedescent algorithm (25). The resulting structure is energyminimized using a locally developed torsion angle mini-mizer, called GAfolder. GAfolder uses cyclic coordinatedecent in combination with a simple genetic algorithm toperform conformational sampling. The energy function,also developed locally, uses a knowledge-based potentialthat includes threading energies, hydrogen bond energies,van der Waals interactions and other components.Additional details about the potential function and thealgorithm used in GAfolder are provided in PROTEUS2documentation pages. The method has been extensivelytested and refined using hundreds of known structures and1000s of decoys. More recently, HOMODELLER wasused to model more than 100 000 protein structures for theBacMap project (5).
RESULTS AND EVALUATION
All of the algorithms and programs employed inPROTEUS2 have been extensively tested and used, bothinternally and externally (some for as long as 6 years). Aswith any structure prediction suite, a key measure of itsutility is its predictive accuracy. The accuracy of eachPROTEUS2 program employing machine-learning meth-ods was tested in several ways, including accuracy duringthe training/testing phases, accuracy using newly acquiredor ‘unseen’ data and accuracy as measured by independentevaluation tools such as EVA and TMH-Benchmark(26,27). The results of these evaluations along with com-parisons to other tools or servers are listed in Table 1.Additional details about the benchmarking protocols, theevaluation methods, the programs tested along with thetest data sets themselves are provided in PROTEUS2 web‘Documentation’ page, under the heading ‘HowPROTEUS2 Measures Up’ (Web Table 1a–g).For signal peptide, transmembrane helix and trans-
membrane b-barrel predictions we evaluated both theper-residue prediction accuracy (Q2) as well as the abilityof the predictors to correctly identify proteins with orwithout these structural features (sensitivity/specificity).Secondary structure predictions of soluble proteins wereevaluated using only the Q3 and segment overlap (SOV)scores. The results in Table 1 report the performance of
PROTEUS2 combined predictors. However, since each ofthe four 1D predictors used both de novo predictions andhomology-based methods we also assessed: (i) theperformance of the de novo predictors alone; (ii) theperformance of the homology-based structure predictorsalone and (iii) the performance of the combined pre-dictors. When measuring the performance of any 3D-to-2D mapping prediction the standard approach is toiteratively remove each sequence from the database andto perform the prediction with that sequence (19–21). Thisprevents one from simply predicting the structure of thequery protein using the query itself. It is also important toreport the per-residue accuracy as well as the coverage (thepercentage of query proteins that returned an answer).These results along with additional information aboutprediction sensitivity/specificity are shown in Tables 2–5of PROTEUS2 ‘Documentation’ webpage, under the‘How PROTEUS2 Measures Up’ heading.
To assess PROTEUS2 signal peptide prediction accu-racy, a data set of 2587 complete protein sequences withexperimentally confirmed signal peptides as well as a dataset of 16 618 cytoplasmic proteins (with no signal peptidesin their sequence) was extracted from the PPT-DB. Thesignal peptide set included proteins from each of the threemajor classes of organisms (Gram+, Gram� andEukaryote). PROTEUS2 was compared against SubLocand SignalP 3.0 (using their default values) measuringboth sensitivity/specificity and per-residue predictionaccuracy (Q2). As seen in Table 1, our predictor performsnearly as well as SignalP 3.0 and somewhat better thanSubLoc, with Q2 scores of 95% for Gram�, 94% forGram+ signal peptides. This compares favorably toSignalP 3.0 Q2 scores of 96% for Gram�, 97% forGram+ signal peptides.
To assess transmembrane helix prediction accuracy, twotests were employed. In one, the PROTEUS was assessedagainst the 2247 proteins (globular and transmembrane)used in TMH-Benchmark (27). In the other, a data setof 275 complete protein sequences with experimentallyconfirmed transmembrane helices was extracted from thePPT-DB. From the TMH-Benchmark results, PROTEUS2was able to achieve a Q2 score of 91% (for high-resolutionstructures), which is 11% better than any other method.It also had the best performance in distinguishing betweenglobular proteins and membrane proteins (0 false posi-tives). Because there is some uncertainty in the transmem-brane assignments for some of TMH Benchmarkshigh-resolution data set, we performed a second evaluationusing the experimentally confirmed data set derived fromPPT-DB. In this assessment, we compared the performanceof PROTEUS2 to TMHMM only. As seen in Table 1,PROTEUS2 does significantly better than TMHMM inboth Q2 scores (87% versus 81%) and in globular/membrane confusion scores (0 false negatives versus 8false negatives).
The assessment of transmembrane b-barrel detectionand b-sheet prediction was done using a set ofexperimentally determined 49 transmembrane b-barreland 16 618 water-soluble, globular proteins obtained fromPPT-DB. The program was compared against TMB-HUNT and Pred-TMBB (using their default parameters).
W206 Nucleic Acids Research, 2008, Vol. 36,Web Server issue
at University O
f Alberta L
ibrary on Decem
ber 20, 2011http://nar.oxfordjournals.org/
Dow
nloaded from

As can be seen from Table 1, the sensitivity/specificity indistinguishing globular proteins from transmembraneb-barrel proteins for PROTEUS2 is particular good(sp=sn=100%) versus sp=78%, sn=99% forTMB-HUNT. Likewise PROTEUS2 Q2 scores fortransmembrane b-sheet prediction, thanks to the use of3D-to-2D mapping methods, are also very high (86%versus 73%).
The assessment of PROTEUS2 performance on glob-ular proteins or nonmembrane secondary structure pre-diction was done using two approaches: (i) through a‘blind’ test and comparison on the latest EVA training set(1644 sequence-unique proteins) and (ii) through analysisof 125 randomly chosen proteins that were recently solvedby X-ray and NMR. The latter set was chosen to simulatea more realistic case of predicting the secondary structureof sequences found in a proteome (which tend not to besequence-unique). In both cases, the Q3 and SOV scores
were calculated for each protein in the test sets. Both setsare also available from PROTEUS2 Download page.Results were compared to Porter (12), PSIPred (13), PHD(6) and JNET (28). As seen in Table 1, the results areessentially identical to those reported previously, withPROTEUS2 performing somewhat better than otherglobular protein structure prediction servers (Q3 of81–88% versus Q3 of 72–77%).An assessment of PROTEUS2 performance for homol-
ogy modeling was also performed. In one case, 37 proteinswith sequence identities ranging from 21.2% to 99.2%(the PDB IDs are listed on the PROTEUS2 documenta-tion pages) were modeled using PROTEUS2 and 3DJigSaw (using default parameters). In the second case, 33proteins with similar sequence identity ranges weremodeled using PROTEUS2 and SWISS-MODEL (alsousing default parameters). In each case, identical templatestructures were used for the pairwise comparisons.
Table 1. Summary of PROTEUS2 structure prediction performance relative to other structure prediction tools
Signal peptide prediction performance (PPT-DB SPDB test set)
Program or Server Q2 (Gram-) (%) Q2 (Gram+) (%)PROTEUS2 95 94SubLoc 91 86SignalP(3.0) 96 97
Transmembrane helix prediction performance (TMH Benchmark test set)Program or Server Q2 (%) # False positivesPROTEUS2 91 0TMHMM 80 1HMMTOP 80 6DAS 72 16
Transmembrane helix prediction performance (PPT-DB-TMH test set)Program or Server Q2 (%) # False neg. (missed prots)PROTEUS2 87 0TMHMM 82 8
Transmembrane b-barrel detection performance (PPT-DB ‘All’ protein data set)Program or Server Q2 (%) Accuracy (TMB versus glob) (%)PROTEUS2 100 100TMB-Hunt 78 99
Transmembrane b-strand prediction performance (PPT-DB -TMB test set)Program or Server Q2 (%)PROTEUS2 86Pred-TMBB 73
Non-membrane secondary structure prediction performance (EVA test set)Program or Server Q3 SOVPROTEUS2 81 82Porter 77 76JNET 72 73PSIPred 77 78
Non-membrane secondary structure prediction performance (test set of 125)Program or Server Q3 SOVPROTEUS2 88 90Porter 76 81JNET 73 77PHD 76 78
Homology modeling performanceProgram or Server RMSD all (A) RMSD backbone (A)PROTEUS2 1.83 0.99Swiss-Model 1.62 0.863D JigSaw 1.94 0.97
Details of the test sets and test conditions are given in the text.
Nucleic Acids Research, 2008, Vol. 36,Web Server issue W207
at University O
f Alberta L
ibrary on Decem
ber 20, 2011http://nar.oxfordjournals.org/
Dow
nloaded from

The resulting structures were compared using a variety ofcriteria including backbone RMSD, all-atom RMSD,percentage of torsion angle violations and a variety ofenergy terms (average hydrogen bond energies, threadingenergies, bump scores). The results are summarized brieflyin Table 1 and in more detail in on the PROTEUS2website (Tables 6 and 7 of the web ‘Documentation’ page).The SWISS-MODEL structures had average backboneRMSDs of 0.86 A and all-atom RMSDs of 1.62 A relativeto the ‘correct’ or known structure. The 3D-JigSaw struc-tures had average backbone RMSDs of 0.97 A and all-atom RMSDs of 1.94 A relative to the ‘correct’ or knownstructure. The PROTEUS2 structures had average back-bone RMSDs of 0.99 A and all-atom RMSDs of 1.83 A(for the SWISS-MODEL set) and average backboneRMSDs of 1.04 A and all-atom RMSDs of 2.00 A (forthe 3D JigSaw set).These comparisons show that the HOMODELLER
structures are essentially comparable to those generatedby 3D-JigSaw and SWISS-MODEL. While there are agrowing number of homology modeling servers withincreasingly impressive capabilities (29,30) it is importantto point out that PROTEUS2 is not just a homologymodeling server and that it is designed to provideconsiderably more information about a protein or proteinsof interest, regardless of whether a homology model can begenerated or not. Furthermore, because PROTEUS2 isuniquely configured to handle multiple sequences webelieve it should fill a unique niche for the structuralgenomics or structural proteomics community.
CONCLUSION
PROTEUS2 is an integrated web server that makes use ofrobust machine learning techniques, in-house modelingprograms and an extensive collection of customizedstructural databases to provide both comprehensive andhighly accurate protein structure predictions. The targetaudience or target users for PROTEUS2 are structuralbiologists and scientists working in structural genomicsor structural proteomics projects where something ‘struc-tural’ has to be known about the proteins prior to beingselected, mutated, truncated, engineered, cloned orexpressed. Essentially, the role of the PROTEUS2 serveris to facilitate target selection, target structure determina-tion and structure-based protein/proteome annotation. It isimportant to emphasize that PROTEUS2 is not a ‘meta-server’, in that it does not depend on external servers toperform its predictions. Almost all of the software anddatabases used in PROTEUS2 were developed and testedlocally, meaning that the code (and databases) may beeasily ported to other sites or platforms. Overall, we believethe open source nature of the PROTEUS2 software, thehigh level of accuracy of PROTEUS2 linear predictorsalong with PROTEUS2 3D structure generation capabil-ities could make it a very useful addition to the currentarsenal of structure prediction tools available to bothprotein chemists and bioinformaticians.
ACKNOWLEDGEMENTS
Funding for this project was provided by the AlbertaPrion Research Institute, PrioNet, NSERC and GenomeAlberta. Funding to pay the Open Access publicationcharges for this article was provided by the Alberta PrionResearch Institute.
Conflict of interest statement. None declared.
REFERENCES
1. Hall,N. (2007) Advanced sequencing technologies and their widerimpact in microbiology. J. Exp. Biol., 210, 1518–1525.
2. Riley,M., Abe,T., Arnaud,M.B., Berlyn,M.K., Blattner,F.R.,Chaudhuri,R.R., Glasner,J.D., Horiuchi,T., Keseler,I.M.,Kosuge,T. et al. (2006) Escherichia coli K-12: a cooperativelydeveloped annotation snapshot—2005. Nucleic Acids Res., 34, 1–9.
3. Stothard,P. and Wishart,D.S. (2006) Automated bacterial genomeanalysis and annotation. Curr. Opin. Microbiol., 9, 505–510.
4. Van Domselaar,G.H., Stothard,P., Shrivastava,S., Cruz,J.A.,Guo,A., Dong,X., Lu,P., Szafron,D., Greiner,R. and Wishart,D.S.(2005) BASys: a web server for automated bacterial genomeannotation. Nucleic Acids Res., 33(Web Server issue), W455–W459.
5. Stothard,P., Van Domselaar,G., Shrivastava,S., Guo,A., O’Neill,B.,Cruz,J., Ellison,M. and Wishart,D.S. (2005) BacMap: an interactivepicture atlas of annotated bacterial genomes. Nucleic Acids Res.,33(Database issue), D317–D320.
6. Rost,B., Yachdav,G. and Liu,J. (2004) The PredictProtein server.Nucleic Acids Res., 32(Web Server issue), W321–W326.
7. Mewes,H.W., Frishman,D., Mayer,K.F., Munsterkotter,M.,Noubibou,O., Pagel,P., Rattei,T., Oesterheld,M., Ruepp,A. andStumpflen,V. (2006) MIPS: analysis and annotation of proteinsfrom whole genomes in 2005. Nucleic Acids Res., 34(Database issue),D169–D172.
8. Carter,P., Liu,J. and Rost,B. (2003) PEP: predictions for entireproteomes. Nucleic Acids Res., 31, 410–413.
9. Liu,J. and Rost,B. (2001) Comparing function and structurebetween entire proteomes. Protein Sci., 10, 1970–1979.
10. Oldfield,C.J., Cheng,Y., Cortese,M.S., Brown,C.J., Uversky,V.N.and Dunker,A.K. (2005) Comparing and combining predictors ofmostly disordered proteins. Biochemistry, 44, 1989–2000.
11. Ullman,C.G., Haris,P.I., Smith,K.F., Sim,R.B., Emery,V.C. andPerkins,S.J. (1995) Beta-sheet secondary structure of an LDLreceptor domain from complement factor I by consensus structurepredictions and spectroscopy. FEBS Lett., 371, 199–203.
12. Pollastri,G. and McLysaght,A. (2005) Porter: a new, accurate serverfor protein secondary structure prediction. Bioinformatics, 21,1719–1720.
13. Jones,D.T. (1999) Protein secondary structure prediction based onposition-specific scoring matrices. J. Mol. Biol., 292, 195–202.
14. Schwede,T., Kopp,J., Guex,N. and Peitsch,M.C. (2003) SWISS-MODEL: an automated protein homology-modeling server. NucleicAcids Res., 31, 3381–3385.
15. Bates,P.A., Kelley,L.A., MacCallum,R.M. and Sternberg,M.J.E.(2001) Enhancement of protein modelling by human intervention inapplying the automatic programs 3D-JIGSAW and 3D-PSSM.Proteins, (Suppl 5), 39–46.
16. Krogh,A., Larsson,B., von Heijne,G. and Sonnhammer,E.L. (2001)Predicting transmembrane protein topology with a hidden Markovmodel: application to complete genomes. J. Mol. Biol., 305,567–580.
17. Bagos,P.G., Liakopoulos,T.D., Spyropoulos,I.C. andHamodrakas,S.J. (2004) PRED-TMBB: a web server for predictingthe topology of beta-barrel outer membrane proteins. Nucleic AcidsRes., 32(Web Server issue), W400–W404.
18. Bendtsen,J.D., Nielsen,H., von Heijne,G. and Brunak,S. (2004)Improved prediction of signal peptides: SignalP 3.0. J. Mol. Biol.,340, 783–795.
19. Montgomerie,S., Sundararaj,S., Gallin,W.J. and Wishart,D.S.(2006) Improving the accuracy of protein secondary structureprediction using structural alignment. BMC Bioinform., 7, 301.
W208 Nucleic Acids Research, 2008, Vol. 36,Web Server issue
at University O
f Alberta L
ibrary on Decem
ber 20, 2011http://nar.oxfordjournals.org/
Dow
nloaded from

20. Pollastri,G., Martin,A.J., Mooney,C. and Vullo,A. (2007) Accurateprediction of protein secondary structure and solvent accessibilityby consensus combiners of sequence and structure information.BMC Bioinform., 8, 201.
21. Walther,D. (1997) WebMol—a Java-based PDB viewer. TrendsBiochem. Sci., 22, 274–275.
22. Wishart,D.S., Arndt,D., Berjanskii,M., Guo,A.C., Shi,Y.,Shrivastava,S., Zhou,J., Zhou,Y. and Lin,G. (2008) PPT-DB: theprotein property prediction and testing database. Nucleic AcidsRes., 36(Database issue), D222–D229.
23. Garrow,A.G., Agnew,A. and Westhead,D.R. (2005) TMB-Hunt:a web server to screen sequence sets for transmembrane beta-barrelproteins. Nucleic Acids Res., 33(Web Server issue), W188–W192.
24. Wishart,D.S. and Case,D.A. (2001) Use of chemical shifts in macro-molecular structure determination. Methods Enzymol., 338, 3–34.
25. Canutescu,A.A. and Dunbrack,R.L.Jr. (2003) Cyclic coordinatedescent: a robotics algorithm for protein loop closure. Protein Sci.,12, 963–972.
26. Eyrich,V.A., Marti-Renom,M.A., Przybylski,D.,Madhusudhan,M.S., Fiser,A., Pazos,F., Valencia,A., Sali,A. andRost,B. (2001) EVA: continuous automatic evaluation ofprotein structure prediction servers. Bioinformatics, 17, 1242–1243.
27. Kernytsky,A. and Rost,B. (2003) Static benchmarking of membranehelix predictions. Nucleic Acids Res., 31, 3642–3654.
28. Cuff,J.A. and Barton,G.J. (2000) Application of multiplesequence alignment profiles to improve protein secondary structureprediction. Proteins, 40, 502–511.
29. Wallner,B. and Elofsson,A. (2005) All are not equal: a benchmarkof different homology modeling programs. Protein Sci., 14,1315–1327.
30. Nayeem,A., Sitkoff,D. and Krystek,S.Jr. (2006) A comparativestudy of available software for high-accuracy homology modeling:from sequence alignments to structural models. Protein Sci., 15,808–824.
Nucleic Acids Research, 2008, Vol. 36,Web Server issue W209
at University O
f Alberta L
ibrary on Decem
ber 20, 2011http://nar.oxfordjournals.org/
Dow
nloaded from