Embed Size (px)
Citation preview
Molecular Microbiology (2003)
47
(2) 383ndash396
copy 2003 Blackwell Publishing Ltd
Blackwell Science LtdOxford UKMMIMolecular Microbiology0950-382X Blackwell Science 200347Original Article
Proteins expressed in E coliM M Champion et al
Accepted 3 October 2002 For correspondence E-mailjimhutamuedu Tel (
+
1) 979 862 4054 Fax (
+
1) 979 845 4946
dagger
Present address Department of Biochemistry University ofCalifornia San Francisco San Francisco CA 94143
Proteome analysis of
Escherichia coli
K-12 by two-dimensional native-state chromatography and MALDI-MS
Matthew M Champion
12
Christopher S Campbell
12dagger
Deborah A Siegele
3
David H Russell
24
and James C Hu
12
1
Department of Biochemistry and Biophysics
2
Center for Advanced Biomolecular Research and Departments of
3
Biology and
4
Chemistry Texas A amp M University College Station TX 77843ndash2128 USA
Summary
To identify proteins expressed in
Escherichia coli
K-12 MG1655 during exponential growth in definedmedium we separated soluble proteins of
E coli
overtwo dimensions of native-state high-performance liq-uid chromatography and examined the componentsof the protein mixtures in each of 380 fractions bypeptide mass fingerprinting To date we have identi-fied the products of 310 genes covering a wide rangeof cellular functions Validation of protein assign-ments was made by comparing the assignmentsof proteins to specific first-dimension fractions toproteins visualized by two-dimensional gel electro-phoresis Co-fractionation of proteins suggests thepossible identities of components of multiproteincomplexes This approach yields high-throughput gel-independent identification of proteins It can also beused to assign identities to spots visualized by two-dimensional gels and should be useful to evaluatedifferences in expressed proteome content and pro-tein complexes among strains or between differentphysiological states
Introduction
Proteomics involves the identification of the complementof proteins expressed in a cell (Washburn and Yates2000) As the best studied organism
Escherichia coli
hasbeen used for proteomic studies since long before theterm proteomics was coined (Wilkins
et al
1996) Com-parative proteomic analysis under different growth orstress conditions have been used to establish the mem-
bers of a variety of regulons (VanBogelen
et al
1999ab)This information has in many cases suggested mecha-nisms for how
E coli
responds to a variety of physiologicalchanges
Traditionally global studies of protein content haverelied on two-dimensional gel electrophoresis which canresolve thousands of spots corresponding to individualproteins (OrsquoFarrell 1975) Identification of the genesencoding the proteins in each spot has always been moredifficult Recent advances in microsequencing and massspectrometry combined with the availability of the com-plete genome sequence of
E coli
(Blattner
et al
1997)allow the identification of proteins from either thesequences of single peptides or even the masses of anumber of peptides (Pappin
et al
1993) Neverthelesswhether or not a particular spot can be identified is stilldifficult to predict Thus although thousands of spots canbe resolved on two-dimensional gels of
E coli
proteinsspot identification has only been successful for hundredsof gene products (Hoogland
et al
2000 Tonella
et al
2001)
The technical challenges of high-throughput proteinidentification by two-dimensional gels has driven thedevelopment of alternative approaches (Gygi
et al
2000Washburn and Yates 2000 Wolters
et al
2001)Recently gel-independent proteomics methods havebeen applied to microorganisms Washburn
et al
(2001)identified 1484 gene products from
Saccharomycescerevisiae
including membrane and low-abundance pro-teins by analysis of tryptic peptides produced from whole-cell digests Peptides were separated by multidimensionalcapillary high-performance liquid chromatography (HPLC)and identified with high-throughput tandem mass spec-trometry Pre-fractionating the cells before running two-dimensional electrophoresis has also been performedwith some success (Butt
et al
2001)The two-dimensional gel approach and the peptide
identification approach have many complementarystrengths and weaknesses Rabilloud (2002) comparedthe effectiveness of two-dimensional electrophoresis ver-sus two-dimensional gel-free approaches such as SDS-PAGE MS or the variety of MSMS approaches for theirsuitability to answer various questions in proteomics Atpresent quantification of protein levels synthesis andstability are all done more reliably on two-dimensional
384
M M Champion
et al
copy 2003 Blackwell Publishing Ltd
Molecular Microbiology
47
383ndash396
gels Identification of proteins from peptide fingerprintingandor peptide sequencing allows identification of moregene products although validation of identified proteinsmay be problematic in some cases (Rabilloud 2002)
Both of these approaches share one important weak-ness the denaturation of the proteins at the first stepleads to the loss of all native-state information In partic-ular information about proteinndashprotein interactions isdestroyed including the subunit identities of stable multi-subunit proteins and protein complexes In traditional pro-tein biochemistry this information is derived fromdetermining what polypeptides cofractionate with a pro-tein during purification
Here we describe the application of a different com-plementary gel-independent proteomics method to studythe expressed proteome of
E coli
Our approach can bedescribed as combining traditional protein biochemistrywith mass spectrometry-based analytical methods toidentify proteins Proteins are fractionated under non-denaturing conditions and identification of proteins in theresultant mixtures was carried out only after the separa-tion Using this approach we identified similar numbersof gene products as have been found from two-dimensional gels and in combination with published iden-tities from two-dimensional gels we describe the largestset of protein identifications from
E coli
to date In addi-tion patterns of cofractionation suggest identities for alarge number of possible proteinndashprotein interactions
Results
Two-dimensional native-state chromatographic separation of soluble proteins
Our general approach is shown in Fig 1A Whole-celllysates are fractionated over two dimensions of native-state HPLC a strong anion exchange column (AIX)followed by a second separation on a hydrophobicinteraction resin (HIC) Proteins in each fraction arethen digested with trypsin and identified from the massesof tryptic fragments which are determined by matrix-assisted laser desorption ionization time-of-flight(MALDI-TOF) mass spectrometry
Figure 1B and C shows the separation of the clarifiedcrude lysate of
E coli
For the first dimension anionexchange we utilized a shallow segmented salt gradientto distribute the proteins roughly equally over 19 protein-containing fractions plus flow-through (Fig 1B) About20 of the total protein by weight is in the flow-throughwhich was processed separately (see below) The largepeak of UV-absorbing material in fractions 22ndash25 containsprimarily nucleic acids (data not shown) Figure 1C showsthe elution profile for a typical second dimension separa-tion of one of the 19 anion-exchange fractions after HICThe two dimensions of chromatography separate the
soluble proteins into 380 fractions Many of these individ-ual fractions contain 5ndash20 proteins visible by silver stain-ing of one-dimensional SDS gels (data not shown) Theseparation was performed four times using lysates fromindependent cultures Two different pH conditions(pH 750 and pH 875) were used for the anion-exchangestep and two lysates were processed at each pH
Proteins from the ion-exchange flow-through
Approximately 20 of the protein by mass flowed throughthe ion-exchange column As this is the only fraction that
Fig 1
Proteomics by native-state LCLCA Flowchart Clarified crude lysates of
Escherichia coli
MG1655 first separated over an anion exchange (AIX) column collected into 20 fractions either run on a two-dimensional polyacrylamide electro-phoresis (PAGE) or separated over a hydrophobic interaction resin (HIC) These fractions are digested and identified using matrix-assisted laser desorption ionization-delayed extraction reflectron-time-of-flight mass spectrometry (MALDI-DE-R-TOF MS) and peptide mass fingerprintingB Chromatogram of first dimension separations Typical chromato-gram trace for cell lysates separated on SOURCE 15Q anion-exchange column (pH 750) Traces show UV 280 nm absorbing material gradient (NaCl) and the bars quantify the protein in each fraction by Bradford assayC Typical chromatogram for second dimension fractionation in this case of AIX fraction 16
Proteins expressed in
E coli 385
copy 2003 Blackwell Publishing Ltd
Molecular Microbiology
47
383ndash396
contains such a high amount of protein we suspected that30S and 50S ribosomal subunits were in the ion-exchangeflow through Consistent with this possibility fractiona-tion of the flow-though via a Superose 12 size-exclusioncolumn revealed RNA and abundant proteins in the voidvolume consistent with the presence of a ribonucleopro-tein complex gt300 000 MW (data not shown) MALDI-MSand peptide mass fingerprinting identified several riboso-mal proteins in the ion-exchange flow-through refraction-ated by cation-exchange chromatography or SDS-PAGE(data not shown) Tandem mass spectrometry performedon trypsinized ion-exchange flow-through using a ThermoFinnigan LCQ Deca identified an additional 18 ribosomalproteins from peptide sequences (data not shown) and noattempts were made to identify the remaining proteins inthe ion-exchange flow-through in this study
Protein identification
The masses of tryptic peptides from digestion of eachfraction were determined by matrix-assisted laser desorp-tion ionization-delayed extraction reflectron-time-of-flightmass spectrometry (MALDI-DE-R-TOF) as described in
Experimental procedures
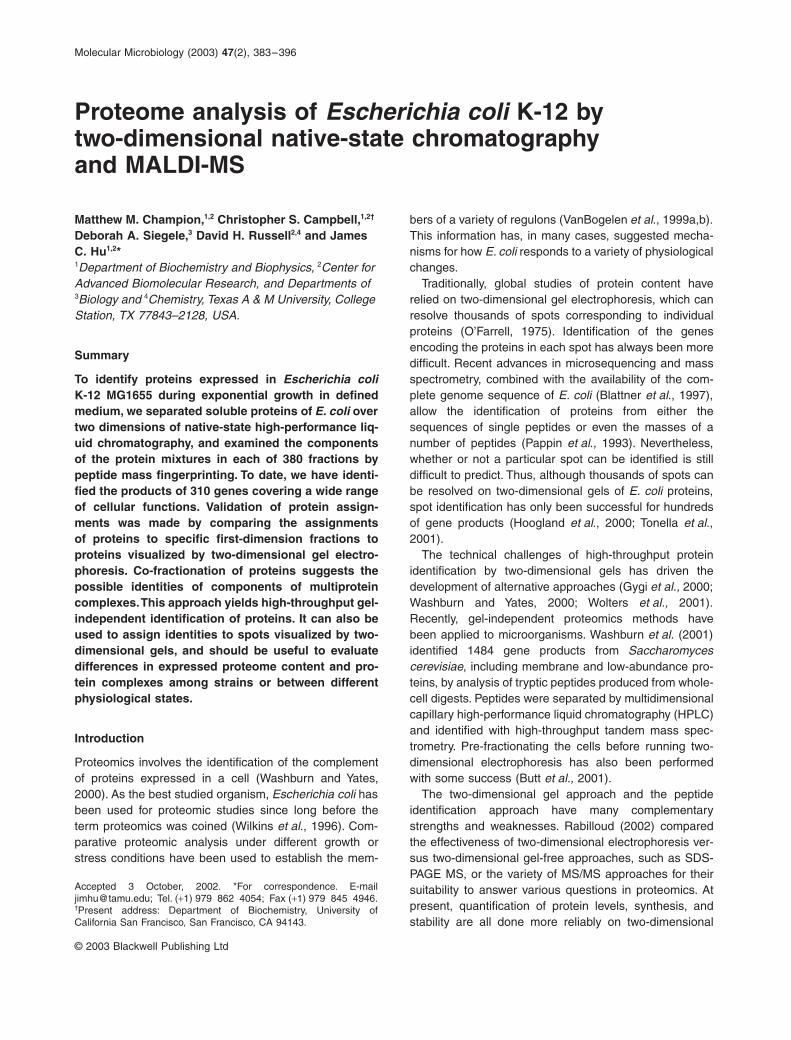
Figure 2 shows a MALDI-DE-R-TOF spectrum from one of the HIC fractions In totalnearly 2000 spectra were collected and annotated for theirpeptide masses The average mass error (mz) for eachfraction was 20 ppm with a standard deviation of20 ppm
Proteins in each fraction were identified by recursivematching of observed peptide masses from tryptic digeststo peptides predicted in the
E coli
genome as describedin
Experimental procedures
Table 1 summarizes the
number of proteins found in each lysate and the overlapbetween experiments Overall 2012 proteins were identi-fied corresponding to a non-redundant set of 310 geneproducts A full list of the protein identities and the frac-tions where they are found is available as supplementarymaterial (see
Supplementary material
)
Comparison with proteins observed by two-dimensional polyacrylamide gel electrophoresis (PAGE)
To test the validity of our protein assignments we com-pared the proteins identified in each AIX fraction to theproteins observed by two-dimensional PAGE Figure 3shows two-dimensional gels for the 19 fractions from thefirst dimension of chromatography To generate a list ofproteins we expect to see on each gel we merged assign-ments made from MS data of second dimension (HIC)fractions for each of the AIX fractions We then examinedthe appropriate two-dimensional gel for a spot migratingat the expected MW and pI As many proteins seen ontwo-dimensional gels migrate at positions that differ sig-nificantly from their predicted positions (Link
et al
1997)
Fig 2
Typical MALDI-DE-R-TOF spectrum for a protein digest from a second dimension column fraction MALDI-MS was performed on column fractions peak annotation was performed using
GRAMS
32 software and data were exported for peptide mass fingerprinting with
MS
-
FIT
The inset shows the well resolved mono-isotopic distribution of an individual tryptic fragment in this spectrum
Table 1
Protein identification totals from
Escherichia coli
lysates
AIX pH 750A 750B 875A 875B Total
Proteins IDrsquod 596 440 517 459 2012Unique IDs 138 167 143 156 310
Each pH was performed twice and totals are listed above The totalnumber of proteins identified includes the same proteins found inmultiple fractions unique IDrsquos are non-redundant totals for eachexperiment The total of 310 identifications is the total of all uniqueIDrsquos from all four proteomes with redundant entries removed
386
M M Champion
et al
copy 2003 Blackwell Publishing Ltd
Molecular Microbiology
47
383ndash396
we used published and indexed two-dimensional gel mapsof
E coli
(Hoogland
et al
2000 Tonella
et al
2001 seehttpexpasyorgch2d) to identify spots wherever possi-ble By combining predicted spot positions with knownspot migrations we can examine the correlation betweenour protein assignments and spots that can be identifiedon the two-dimensional gels
Figure 4 shows one example of an annotated two-dimensional gel In this case we can correlate 16 out ofthe 17 proteins we identify with spots on the two-
dimensional gel For this gel only one protein identifiedfrom the MS data GreA did not match a correspondingspot Figure 4 indicates the predicted and actual migrationof GreA as lsquoQrsquo and lsquoRrsquo respectively As a control werandomly selected bins of 30 proteins from our completelist of 310 identified proteins and attempted to matchthem to the positions of the observed spots for severalgels (data not shown) Only two of these randomlyselected proteins matched a spot at the appropriate MWand pI one of them was in the list of expected proteins
Fig 3
Two-dimensional gels of anion exchange (AIX) (SOURCE 15Q) fractions Approximately 300
m
g of protein from each AIX fraction was subjected to two-dimensional PAGE analysis and stained with Coomassie blue Isoelectric focusing was done using IPG strips with a non-linear pH 3ndash11 gradient Gels are numbered by the AIX fractions that were run
Proteins expressed in
E coli 387
copy 2003 Blackwell Publishing Ltd
Molecular Microbiology
47
383ndash396
identified in the corresponding fraction Thus the correla-tion between the proteins identified by MS and thoseobserved on the gel is much better than would beexpected by chance
In addition to the spots identified with MS correlationall of the gels resolved spots with identities that could notbe assigned from MS data for that fraction Some of theseare clearly multiple spots produced from the same proteinindeed some of these are annotated in databases of
Ecoli
proteins identified by two-dimensional gels In other
cases we can make assignments when the same spot isseen in gels from a series of contiguous fractions reflect-ing the changing abundance of each protein as it elutesfrom the ion exchange column Although the protein mightnot be identified by MS in one fraction it could be identi-fied in one or more of the contiguous fractions For exam-ple we can see the spot marked 1 in Fig 4 on gels fromAIX fractions 9ndash13 In AIX fraction 17 this spot is uniden-tified but in AIX fractions 18 20 21 and 22 it is identifiedas DnaK the major Hsp70 homologue in
E coli
We alsoobserve several spots such as spot 2 which could not beidentified unambiguously by either MALDI-MS or compar-ison with published gel annotations Out of the 219 uniqueproteins we identify at pH 750 we can assign spots onthe two-dimensional gels for 109 of them (57) Out ofthese 41 (38) were not previously annotated in theSWISS-2D database
Classification of proteins identified by function pIMW and abundance
To determine whether our method is biased toward oragainst particular kinds of proteins we compared thekinds of proteins found in
E coli
fractions to the differentgene classes defined by Blattner
et al and
the Riley lab-oratory web page (Fig 5) We find proteins predicted tobe in all of the functional classes but fewer proteins anno-tated as membrane proteins (transport cell structure) areseen than would be expected in a random sampling Thisis probably a consequence of how we prepared our sam-ples which requires that proteins remain soluble Werecover a greater fraction of proteins involved in metabo-
Fig 4
Comparison of proteins identified by LCLC MS and by two-dimensional gelsA Annotated two-dimensional gel of AIX (SOURCE15Q) fraction 17B Identities and predicted pI and MW for proteins expected to be in this fraction based on peptide mass fingerprinting of HIC fractions from AIX fraction 17 Spot ID Q highlighted in grey shows the predicted migration of GreA which is not visible in this gel Spots labelled 1 2 and R are discussed in the text
Fig 5
Classification of identified proteins by function Functional classification categories are from Blattner
et al
(1997) and Riley
et al
(httppcltamuedu) Open and filled bars show the percentage of the genome and the proteins identified in this study respectively assigned to each functional class Although MG1655 does not contain any plasmids extrachromosomal genes include prophage genes The Cryptic category includes 43 genes annotated as not expressed Our single lsquohitrsquo of a translated cryptic gene was
hofB
which is a putative transport protein
388
M M Champion
et al
copy 2003 Blackwell Publishing Ltd
Molecular Microbiology
47
383ndash396
lism which probably reflects abundance more than genefunction
We also examined the predicted pI and molecularweights of the proteins we identified and compared themto the distribution of pI and molecular weights of all of theannotated open reading frames (ORFs) in the
E coli
genome (Fig 6) For comparison we examined the distri-bution of proteins seen in the SWISS-2DPAGE databaseSWISS-2DPAGE identified very few proteins for pI rangesabove 70 The proteins we observe cover the whole pIrange observed for the genome with a slight bias toward
proteins with pIs between 4 and 6 This may reflect thepIs of proteins in the optimal separation range for theanion exchange step andor it could be a consequenceof a bias against very basic proteins which would tend tobe in the flow-through of the anion exchange column Only183 of the proteins we identified have a predicted pIabove 70 whereas the expected frequency for thegenome is 355 Two-dimensional gel data has anexpected bias toward proteins that resolve well by isoelec-tric focusing Only 77 of the SWISS-2D identificationshave a predicted pI above 70 Both methods mirror the
Fig 6
pI and molecular weight distributions for expressed proteomesA Distribution of the predicted pIsB Distribution of the predicted molecular weights Each panel shows indicated properties of the identified proteins for annotated ORFs from the genome sequence of MG1655 (inset) the proteins identified in this study (black) and the annotated SWISS-2D database for
E coli
(grey)
Each bar shows the number of proteins identified as a fraction of the number of annotated proteins from the complete genome in that pI or MW range
Proteins expressed in
E coli 389
copy 2003 Blackwell Publishing Ltd
Molecular Microbiology
47
383ndash396
genomic distribution in molecular weight and recover veryfew small peptidesproteins This partially reflects the factthat smaller proteins on average have fewer diagnostictryptic peptides than larger proteins As expected from thegel-independence of our methods we identify more low-molecular-weight proteins that do not resolve well on con-ventional SDS-PAGE
All proteome methods to identify expressed proteinsare biased toward those that are abundant As directmeasurements of abundance are not available for most
E coli
proteins we used two criteria to evaluate the cor-relation between our protein identifications and theactual abundance of the proteins First we examinedthe overlap between our identifications and the proteinsfor which synthetic rates have been measured by pulse-labelling and two-dimensional electrophoresis In
E coli
strain W3110 grown in minimal MOPS
+
glucose undersimilar growth phase conditions 51 proteins wereindexed by Neidhardt
et al
(VanBogelen
et al
1996)All 51 of these were identified in our study Assumingthat the quantification made from pulse-labelled cellsapproximates the steady-state levels of proteins fromtheir data we detect proteins with the lowest statedabundance of
ge
02 of total protein or about 500 cop-ies per cell This agrees well with reconstruction experi-ments we performed using known amounts of beta-galactosidase spiked into column fractions where weestimate sensitivity of about 250 copies per cell (datanot shown) However our absolute detection sensitivityis more limited by ion-suppression of more abundantpeptides and low-abundance proteins diluted over multi-
ple fractions than lack of ability to recover low-abundance proteins
We also examined the expression levels of each proteinpredicted from sequence analysis Karlin and Mraacutezek(2000) described an algorithm to predict abundancebased on comparing codon usage of a gene of interest tothat of several abundant protein classes including riboso-mal proteins chaperonins and translation factors Thepredicted expression level is expressed as an E(g) ratiowhere values greater than 1 are considered to be lsquopre-dicted highly expressedrsquo or (PHX) Figure 7 compares thedistribution of E(g) values for the proteins we identified tothe values for all of the annotated genes from
E coli
K-12 39 of our identifications fall within the PHX classwhereas only 8 of the proteins in the genome are pre-dicted to have an E(g) value gt 10 Proteins identified inthe SWISS-2DPAGE gel database have a similar distribu-tion as the proteins we identify by our method 45 of theSWISS-2D identifications have E(g) values greater than10 We seem to find more proteins from the lower expres-sion classes
Correlation with gene expression assayed by DNA microarrays
We examined the correlation between the 310 proteins weidentified and gene expression by performing microarrayexperiments to identify expressed mRNAs In total RNAprepared from three independent cultures grown underidentical conditions to those used for protein samples weobserved 3860 genes expressed at gt4 SD above the
Fig 7
Predicted expression levels for identified proteins E(g) value distributions were determined for the proteins identified in this study (black) and the entire annotated SWISS-2DPAGE for
E coli
(grey) and the MG1655 genome (inset) Vertical black lines indicate the cut-off for genes that are in the PHX class (predicted highly expressed)
390
M M Champion
et al
copy 2003 Blackwell Publishing Ltd
Molecular Microbiology
47
383ndash396
background in all three cultures In published array exper-iments expression of similar numbers of genes isobserved in exponential phase cultures of the same
Ecoli
strain also growing in minimal glucose medium (Tao
et al
1999 Courcelle
et al
2001 Wei
et al
2001)Hybridization was observed for 94 (290 out of 310) ofthe genes encoding the proteins we observed
Co-fractionation of native complexes
Because multiprotein complexes should remain intactthrough both chromatographic dimensions it may be pos-sible to identify protein complexes by analysing chromato-graphic cofractionation of subunits The general idea is toapply a lsquoguilt by associationrsquo analysis to our entire pro-teome snapshot In 10 cases gene names suggest thattwo or more cofractionating proteins share a commonfunction However simply examining the cofractionationover two columns is likely to generate a very high back-ground of false positives Proteins in the same fractioncould cofractionate because they are physically associ-ated or because they just happen to fractionate similarlyIn traditional purification protocols coincidental cofraction-ation is reduced by either increasing the specificity ofpurification steps (eg affinity chromatography) or addingmore steps to the purification (additional chromatographicsteps)
Instead of adding additional purification steps to theseparation we performed parallel separations in whichthe pH of the buffers used in the anion exchange step waschanged lsquopH scoutingrsquo is often used to optimize ionexchange separations and is based on how titration ofionizable surface groups on the protein alters their elutionpositions At either pH stable complexes will coelute fromthe anion exchange column whereas proteins in the samefraction by coincidence are free to migrate elsewheredepending on their individual chromatographic properties
This is illustrated by PheS and PheT the
a
and b sub-units respectively of an a2b2 heterotetrameric tRNAcharging enzyme PheS and PheT cofractionate at bothpH 750 and pH 875 At pH 750 eight other proteins arefound in the same fractions as PheS and PheT AccAAceE AsnS GltB GroES RfbB RpsA and Tig At pH of875 RplJ and Tig are found cofractionating with PheSand PheT As Tig is an abundant chaperonin it is likelythat its interaction with PheS and PheT is non-specific orcoincidental
By applying this analysis to all of the proteins we iden-tified 125 pairs of proteins that cofractionated at bothpH 750 and pH 875 (Table 2) These potential interac-tions include several like PheS and PheT that have beenpreviously described or that seem plausible from func-tional annotations This is clearly an underestimate of thestable complexes known complexes such as RNA core
polymerase a2bbcent and the ClpX ClpP E coli proteosomewere identified as cofractionating in only one sample oronly at one pH
Discussion
Identities of expressed proteins
Understanding the physiology of a cell involves knowingwhat proteins are expressed under a given set of circum-stances Although powerful methods for genome-wideexpression profiling based on examining mRNA arewidely available the correlation between mRNA and pro-tein levels is imperfect and direct examination of cellularprotein content is needed Although two-dimensionalgels have been applied to catalogue the expressed pro-teins in E coli for many years a variety of technicalissues prevent efficient identification of the genes thatencode the proteins seen as thousands of spots on two-dimensional gels For example protein recovery fromgels is often low samples are sometimes difficult todigest in situ and the loading capacity of gels limits theamount of material that can be recovered from spotsNevertheless combining multiple two-dimensional gelswith microsequencing or mass spectrometry has allowedthe identification of 273 proteins from E coli in mid-exponential phase growth in minimal glucose medium(Tonella et al 2001)
Above we describe a complementary gel-independentapproach based on multidimensional liquid chromatogra-phy Although the resolution of chromatography is muchlower than gel electrophoresis the samples obtained aremuch more efficiently processed for protein identificationusing the power of mass spectrometry to deconvolutecomplex mixtures of proteins found in chromatographicfractions Using this method we identified 310 proteinsexpressed in exponential-phase E coli growing in M9glucose media supplemented with amino acids (caseinhydrolysate)
Figure 8 compares our results with the SWISS-2DPAGE proteome from E coli (Hoogland et al 2000)Taken together our studies and the SWISS-2D PAGEidentify 467 proteins Out of these 116 were identified byboth studies whereas the native-state LCLC MSapproach described here identified 194 proteins that werenot previously annotated in the SWISS-2DPAGE data-base The SWISS-2DPAGE database identified 157 pro-teins that were not seen in our experiments Clearly thetwo methods complement each other to provide a morecomplete understanding of the protein content of E colithan either would alone
Although our primary reason for performing a parallelanalysis of column fractions by both peptide mass finger-printing and two-dimensional gels was to validate theidentifications made by the former the concordance
Proteins expressed in E coli 391
copy 2003 Blackwell Publishing Ltd Molecular Microbiology 47 383ndash396
between a predicted pIMW for a protein identified bymass fingerprinting and a spot on a gel also can be usedto assign an identity to the spot without having to recoverprotein or peptides from the gels In this way we assignedidentities to 41 spots that were previously unidentified inthe SWISS-2D database
Neither our method nor the combination of our methodwith two-dimensional gels is detecting all of the proteinswe expect to be present in the cell Although determiningthe number of expressed proteins from two-dimensionalgels requires making assumptions about the number ofspots per protein estimates of about 1000ndash3000 expre-ssed proteins are in reasonable agreement with the num-
ber of expressed E coli genes seen by microarrayexperiments (see above and A Khodursky personal com-munication) Why arenrsquot we identifying 70ndash90 of theproteins we expect to see Although some are likely to bein the fractions we were not able to process for examplemembrane proteins in the insoluble pellet and proteins inthe flow-through from the ion-exchange column these areunlikely to account for the bulk of the proteins we aremissing
Because MALDI-TOF is capable of exquisite sensitivitywith pure peptides the amount of material in our samplesis not limiting However peptides in mixtures compete forionization leading to suppression of the weaker signals
Table 2 Proteins that cofractionate at both pH 75 and pH 875
ACEA PNP DAPD PURT GREA GUAA PROA GLNS SUCC CYSKACKA FABI DAPD SSPA GREA PPA PROS FABI TALB PYRHACKA TSF DNAK LYSS GROS TIG PROS PURH THRC ASPCADK GAPA DNAK TYPA GUAA DAPA PROS TSF TIG ASNSAHPC GLNS DUT GND GUAA GREA PROS TUFA TIG GROSAHPC TRPC ENO GND GUAA PPA PURA GLTA TIG GUABALAS YADF ENO SERC GUAA YCHF PURA KBL TIG PHESARGD FUSA FABI ACKA GUAB TIG PURA TKTA TIG PHETARGG ISCS FABI PROS HISC YADF PURF ARGG TIG RFBBARGG PURF FABI PURH ILES ASPC PURF ISCS TIG RPLJARGH CLPP FABI TSF INFB LYSS PURF PNP TIG RPSAARGH FUSA FABI YADF ISCS ARGG PURF TYPA TKTA GLTAARGI GCVT FDX LPDA ISCS CLPP PURH FABI TKTA PURAAROA DAPD FUSA ARGD ISCS PNP PURH PROS TKTA TSFAROK CYSK FUSA ARGH ISCS PURF PURH TSF TKTA TUFAAROK PGI FUSA ASNS ISCS SLYD PURH TUFA TPIA GLYAASNS DAPA FUSA RPSA KBL ASPS PURH YADF TRPC AHPCASNS FUSA FUSA SPEE KBL GND PURN SSPA TRPC GLNSASNS GLTA FUSA VALS KBL PURA PURT DAPD TSF ACKAASNS KDGK GAPA ADK KDGK ASNS PYKF CYSK TSF FABIASNS RFBB GAPA GLYA KDGK DAPA PYKF GCVT TSF GLTAASNS RPLJ GAPA GPMA LPDA FDX PYKF NDK TSF PPIBASNS RPSA GCVT ARGI LYSS DNAK PYRH TALB TSF PROSASNS SERS GCVT ASPS LYSS INFB RFBB ASNS TSF PURHASNS TIG GCVT CYSK NDK DAPD RFBB RPSA TSF RPLIASNS TUFA GCVT NDK NDK GCVT RFBB TIG TSF TKTAASNS VALS GCVT PYKF NDK PYKF RPLI TSF TSF TUFAASPC DAPD GLNS AHPC NUSA PNP RPLJ ASNS TUFA ASNSASPC ILES GLNS PROA NUSA SLYD RPLJ TIG TUFA GLTAASPC THRC GLNS TRPC NUSA SPEB RPSA ASNS TUFA PROSASPS GCVT GLTA ASNS NUSA YICC RPSA FUSA TUFA PURHASPS GND GLTA PURA PGI AROK RPSA RFBB TUFA TKTAASPS KBL GLTA TKTA PGI CYSK RPSA SERS TUFA TSFBGLA YFBU GLTA TSF PHES PHET RPSA TIG TYPA DNAKCLPP ARGH GLTA TUFA PHES TIG RPSA VALS TYPA PNPCLPP ISCS GLTX GND PHET PHES RSUA VALS TYPA PURFCYSK AROK GLTX PPA PHET TIG SERC ENO VALS ASNSCYSK DAPD GLYA GAPA PNP ACEA SERC GLYA VALS FUSACYSK GCVT GLYA SERC PNP ISCS SERS ASNS VALS RPSACYSK PGI GLYA TPIA PNP NUSA SERS RPSA VALS RSUACYSK PYKF GLYA YIFE PNP PURF SLYD ISCS YADF ALASCYSK SUCC GND ASPS PNP SLYD SLYD NUSA YADF FABIDAPA ASNS GND DUT PNP TYPA SLYD PNP YADF HISCDAPA GUAA GND ENO PNP YICC SLYD SPEB YADF PURHDAPA KDGK GND GLTX PPA DAPA SLYD YICC YCHF GUAADAPA PPA GND GOR PPA GLTX SPEB NUSA YFBU BGLADAPD AROA GND KBL PPA GND SPEB SLYD YICC NUSADAPD ASPC GND PPA PPA GREA SPEE FUSA YICC PNPDAPD CYSK GOR GND PPA GUAA SSPA DAPD YICC SLYDDAPD NDK GPMA GAPA PPIB TSF SSPA PURN YIFE GLYA
The 125 pairs are shown as 250 entries each pair is listed with each partner first to aid finding proteins of interest
392 M M Champion et al
copy 2003 Blackwell Publishing Ltd Molecular Microbiology 47 383ndash396
The two chromatographic separations used here help toalleviate that problem relative to unfractionated extractswhere extremely abundant ribosomal proteins dominatethe spectra However the complexity of our mixtures evenafter chromatography limits the numbers of proteins wecan identify possibly due to incomplete digestion and theability to identify enough tryptic peptides from eachpolypeptide for an unambiguous assignment for someproteins
Recently high resolution separation of tryptic peptidesby multidimensional HPLC and mass spectrometric anal-ysis of peptides and peptide fragments produced by col-lision-induced dissociation have been used to provide alarge-scale analysis of the yeast proteome (Washburnet al 2001) Based on the published work on yeast thisapproach would be expected to identify many more pro-teins in either our column fractions or in tryptic digests ofthe unfractionated E coli lysates Although tandem MSapproaches yield greater numbers of identifications thelarge amounts of instrument time and computationalpower required to search the data make it impractical forrapid identification of proteins and interrogating multiplephysiologic states Performing our type of analysis on all380 fractions generated by the two chromatographicdimensions used here would involve prohibitive amountsof instrument time (weeks) with current technology
Protein complexes
Identification of expressed polypeptides as the productsof specific genes provides information about gene expres-sion but it is important to remember Benzerrsquos modificationof the lsquoone gene-one enzymersquo hypothesis of Beadle andTatum (Beadle 1945) to lsquoone cistron-one polypeptidersquoIndividual polypeptides are not equivalent to proteinsbecause proteins have quaternary structure and are often
composed of multiple subunits Indeed it is becomingclear that many intracellular processes are carried out bylarger multisubunit complexes than had been imaginedpreviously (Alberts 1998)
For these reasons major efforts are ongoing to map thelsquointeractomesrsquo in several organisms by a variety of tech-niques including large-scale two-hybrid studies (Uetzet al 2000 Ito et al 2001) protein chips (Nelson et al2000 Zhu et al 2001 Rabilloud 2002) and identificationof proteins that coimmunoprecipitate or co-purify with spe-cific baits for which there are antibodies (Tong et al 2002)or expressed versions with affinity tags (Gavin et al 2002Ho et al 2002) Although each of these methods is ableto identify a subset of the interactions known to occur ina proteome all of them identify only subsets of the previ-ously known interactions and presumably only subsetsof the unknown interactions they seek to find In additionto high fractions of false negatives each approach has itsown kinds of false positives
In our approach cofractionation through partial purifi-cation provides suggestive evidence for interactions Co-purification is the classical method of biochemical identi-fication of the subunits in a multisubunit protein whateverremains at a reasonable stoichiometry after an activity ispurified to homogeneity or near homogeneity is consid-ered to be a subunit Purification to homogeneity isimpractical on a genome-wide scale for two reasons firstbecause of the exponential increase in the scale of theexperiment with the addition of each fractionation andsecond because there is no universal assay by which tofollow the activities of all possible complexes
Instead we examined the concordance of cofractionat-ing proteins through parallel partial purifications In eachindividual preparation any given protein complex is con-taminated by many other proteins that co-purify coinciden-tally If we can use conditions that differentially change theelution of proteins then we should find a different subsetof the proteome contaminating the same complex Sub-units of stable complexes should stay together through allof our purification steps
As with other proteomics methods our method willinclude both false positives and false negatives Falsepositives will occur simply because some proteins willco-purify coincidentally over both of our fractionationschemes Here we used two different pHs in the ionexchange dimension as our different schemes Thechanges in elution position that we need to alter the spec-trum of contaminants seem to be larger for the weaklycharged proteins that elute from the column first than forthe more strongly anionic proteins that elute later at highersalt concentrations This is as expected these proteinsare probably enriched for acidic residues that do not titratesignificantly over the pH range we used In addition thetitration of ionizable groups in these proteins will have a
Fig 8 Venn diagram of overlap between E coli proteome projectsdata sets This diagram illustrates the distribution of the non-redundant protein assignments from each proteome and the overlap between the two The data sets together identify 467 non-redundant proteins from E coli
Proteins expressed in E coli 393
copy 2003 Blackwell Publishing Ltd Molecular Microbiology 47 383ndash396
smaller effect as a fraction of the total charge comparedwith the more weakly anionic proteins Despite these lim-itations the use of two pHs has already significantlyreduced the background of coincidental co-purificationOther fractionation schemes that are based on larger dif-ferences in the physical basis for separation may reducethe false positives further
False negatives have two major sources First we knowfrom the long history of protein biochemistry that somecomplexes will not survive the purification steps Cell lysisand fractionation involve significant dilution from intracel-lular conditions and the changes in salt and pH thataccompany each fractionation step as well as binding tothe chromatographic matrices per se will disrupt somecomplexes Second the low density of protein identifica-tions in each experiment will lead to missed identificationsof proteins that are successfully co-purified This is clearlyhappening in our experiments for some known complexesincluding RNA polymerase core Although we identify thea subunit of RNA polymerase in each of the fourexpressed proteomes and b and bcent are seen on gels inthe expected fractions diagnostic peptides for b and bcentwere only found in one out of four experiments
Despite these caveats 125 pairs of putative interactionsare detected in our experiments Several are either knownor plausible from the operon structure of the genesinvolved Further study will be needed to determine whichof the interactions represent real complexes
Future applications for E coli and other bacteria
The prospect of efficiently assigning gene identities toexpressed proteins provides renewed impetus to the anal-ysis of the expressed proteome as a function of bacterialphysiology It is important to note that the approachdescribed here is more accessible to small laboratoriesthan most other large-scale proteomics methodsalthough the process is clearly amenable to automationat many steps this study was carried out entirely withoutthe benefit of robotics Moreover unlike approachesbased on pre-digesting samples before separation theability to correlate identities made by native-state LCLCMS with quantification from two-dimensional gels whichare even more accessible to small-scale projects makesthe use of both methods much more powerful than thesum of the two
Similarly most large-scale interactome projects requireeither the construction of large numbers of strainsexpressing affinity-tagged proteins or the generation oflarge numbers of high-quality antibodies (note that poly-clonal antibodies often cross-react with many bacterialproteins) In contrast cofractionation can be done withany wild-type or mutant strain without further strainconstruction
The native-state LCLC MS approach should bebroadly applicable beyond E coli Proteomics based onpeptide mass fingerprinting is strongly dependent on theavailability of complete genome sequences proteins canonly be identified if they are in the database With therapid advances in the availability of complete genomesequences this is no longer a problem for many microor-ganisms The small size of bacterial genomes is a signif-icant factor in the success of the approach describedhere which used peptide mass fingerprinting alone toidentify several components in complex mixturesEriksson et al (2000) calculated the theoretical informa-tion content intrinsic to a peptide mass as a function ofthe genome size of the subject organism This study val-idates their theoretical calculations and shows that for agenome of the size and complexity of E coli peptidemass fingerprinting is able to successfully deconvolutemixtures of proteins generated by two dimensions ofchromatography
Experimental procedures
Escherichia coli lysates
Escherichia coli K-12 strain MG1655 (Blattner et al 1997)was grown overnight in M9 minimal medium (Miller 1972)containing glucose (04) uridine (50 mg ml-1) CaCl2(100 mm) MgSO4 (2 mM) Then 1 l cultures of the samemedium plus (01 wv) casamino acids (Difco) were inocu-lated with 10 ml of the overnight and grown to OD600 = 05Cells were harvested by centrifugation at 4000 g for 20 minin a JA-10 rotor (Beckman) and washed by resuspension in20 mM Tris HCl 20 mM NaCl 1 mM EDTA pH 875 andcentrifuged again The pellet was resuspended in 6 ml of thesame buffer and lysed by three passes through a chilled smallFrench-pressure cell at 20 000 PSI The lysate was centri-fuged at 15 000 g for 25cent in a JA-20 rotor The supernatantwas filtered through a non-binding 045 mm syringe filterbefore chromatography
Two-dimensional electrophoresis
First 300 mg of material from each anion exchange fractionwas diverted for analysis by two-dimensional polyacrylamidegel electrophoresis (PAGE) Two-dimensional PAGE wasperformed at the Protein Chemistry Laboratory at TexasA amp M University (httpwwwcalabresocompclusershtml)Briefly acetone-precipitated anion-exchange samples werere-swelled into Igphor immobilized gradient gels (14 cmpH 3ndash10 NL) (Pharmacia) and focused for 60ndash80 000 Volthours After reduction and exchange in SDS and DTT 12SDS gels (13 yen 16cm) were run in the second dimensionand stained with Gel Code Blue (Pierce) pIrsquos were deter-mined by fitting a non-linear standard curve from Pharmaciaas a function of gel length and adjusted to proteins withknown migration (eg DnaK GroEL) Apparent molecularweight was determined by a standard ladder applied to the
394 M M Champion et al
copy 2003 Blackwell Publishing Ltd Molecular Microbiology 47 383ndash396
leftmost portion of the gel after loading of the iso-electric gelstrip
Chromatography
For the liquid separation of clarified lysates the followingprocedure was used Approximately half of the cell-lysatewas applied to a 1 ml SOURCE 15Q (Pharmacia) resinpacked into a Waters AP-1 glass column pre-equilibrated in20 mM NaCl 30 mM Bis-Tris 15 mM Tris-HCl at a pH of 750or 875 A segmented gradient from 20 mM to 1 M NaCl wasrun over approximately 150 column volumes at a flow rate of3 ml min-1 on an AumlKTA Explorer HPLC Then 5 ml fractionswere collected from the anion-exchange separation For thesecond dimension each anion exchange fraction wasbrought up to 15 M (NH4)2SO4 100 mM KPO4 buffer atpH 70 This was applied to a 1 ml SOURCE 15Phe (Phar-macia) resin packed into a Waters AP-1 glass column pre-equilibrated in the same buffer A segmented gradient of15 M to 0 M (NH4)2SO4 was used over approximately 15column volumes Then 05 ml fractions were collecteddirectly into microdialysis cassettes (Pierce) and arrayed intofoam racks and exhaustively dialysed against 25 mM ammo-nium bicarbonate Denaturation digestion and MALDI wereperformed essentially as described elsewhere (Park andRussell 2000) Spectra were acquired on a Perseptive Bio-systems Voyager Elite XL TOF with a pulsed nitrogen laserat 337 nm The dried samples were resuspended in 100ndash270 ml of water mixed with MALDI matrix (35 mM a-cyano-4-hydroxy-cinnaminic acidMeOH) to a final matrix concentra-tion of ordf 10 mM and lt05 ml was spotted in duplicate onto35 mM overlayers of matrix in MeOH (Edmondson andRussell 1996) The samples were analysed in reflectronmode with 25 kV accelerating voltage a grid voltage of175 kV and a delayed extraction time of 150 ns Signals from100 laser shots were averaged per spectrum Two-point cal-ibration was performed using angiotensin I and neurotensin([M + H]+ = 12966853 [M + H]+ = 16729175) and a low-mass gate of 500 Da was used
Matrix-assisted laser desorption ionization-delayed extrac-tion reflectron-time-of-flight mass spectrometry (MALDI DE-R-TOF) spectra were taken from digests of each of the HICfractions from the HPLC separations Four separate lysatesprepared on different days were used to generate the pro-teome separations Two different pHs were utilized in theanion-exchange separation each performed twice Peakpicking was done by the operator using GRAMS32 softwareand peptide-mass fingerprinting was performed as describedbelow In total nearly 2000 spectra were annotated and anal-ysed for protein content by peptide mass fingerprinting
Peptide mass fingerprinting
Proteins were identified from the resulting peptides using MS-FIT AND PROTEIN PROSPECTOR The algorithm that generatesthe MOWSE score and the ranking for MS-FIT outputsis detailed in Pappin et al (1993) and (httpprospectorucsfedu) The utility of peptide-mass fingerprinting of singleproteins and more recently protein mixtures has beenshown and applied to multiple experimental systems (Mannet al 1993 Yates et al 1993 Shevchenko et al 1996
Jensen et al 1997) Peptide masses were searched againstthe most current SWISS-PROT database with no constraintson pI or MW No post-translational modifications wereallowed and species was limited to E coli A mass error of300 ppm was applied and one missed cleavage wasallowed For our case the following database matching cri-teria in MS-FIT were applied (i) The identified protein mustcome from the correct strain of E coli As multiple strains ofE coli have been sequenced false-positive protein matchesoften occur with different strains For example a commonfalse positive protein from bacterial searches of E coli is TraIa gene located on the Fcent plasmid and not present in the Ecoli strain we used K-12 MG1655 (ii) The sequence cover-age of the putative protein identified must be greater than25 (iii) The assigned peptides for any given identificationmust have mass accuracy error consistent in magnitude andtrend with other peptides assigned to the same protein Ouraverage mass error was 20 ppm with a standard deviationof 20 ppm and our error rarely exceeded 50 ppm TheMOWSE algorithm is insensitive to error regardless which iswhy a high (300 ppm) tolerance was allowed Multiple pro-teins could be identified in the same fraction by removingthe peptides assigned to the first protein and resubmitting theremaining peaks in a recursive process Identification of thesame protein in adjacent fractions in both separation dimen-sions allowed many orphan peptides to be assigned whenthey fell below threshold criteria
DNA microarrays
Total RNA was isolated from three independent culturesgrown under identical conditions as those used for proteinsamples RNA isolation synthesis of 33P-labelled cDNAprobes using E coli gene-specific primers (Sigma-Genosys)and hybridization to Panorama E coli gene arrays (Sigma-Genosys) was performed as described previously (Arnoldet al 2001) with the following modifications Before cultureswere harvested by centrifugation one-eighth volume of ice-cold ethanolphenol stop solution (5 water-saturated phenol(pH lt 70) in ethanol) was added to stop RNA degradation(Lin-Chao and Cohen 1991 Lee et al 2002) Before cDNAsynthesis RNA samples were treated with RQ1 RNAase-free DNAase (Promega) followed by two extractions withphenol and phenolCHCl3 ethanol precipitation and resus-pension in DEPC-treated deionized water For quantificationfilters were exposed to a phosphorimager screen which wasscanned at 100 micron resolution using a Fujix BAS2000phosphorimager
The Fujix BAS image files were analysed using VISAGE HDG
ANALYZER software (RM Lupton) running on a Sun Micro-systems ULTRA10 workstation The integrated intensity (II)of each spot is the sum of the value of each pixel within theboundaries of the spot minus the local background The IIvalues which are expressed in arbitrary units were exportedto MICROSOFT EXCEL for further analysis The 294 blank spotson the arrays were used to define a background expressionlevel (045 plusmn 034 arbitrary units) Based on the visual exam-ination of individual spots we concluded that II values gt18(background plus four SD) represented real signals This cut-off was used in identifying transcripts for the genes encodingthe proteins we observed
Proteins expressed in E coli 395
copy 2003 Blackwell Publishing Ltd Molecular Microbiology 47 383ndash396
Database generation
Output proteins from MS-FIT were indexed by SWISS-PROTID as the unique key and treated as text tables All manipu-lation of identified proteins was done using scripts written inPERL or MICROSOFT EXCEL Functional annotation was per-formed with the indexed list from the Riley laboratory (Serreset al 2001) Molecular weight and pI predictions were basedon the lsquopI Toolrsquo located on the Expasy web site (httpexpasyorgtoolspi_toolhtml) at the Swiss Institute of Bioin-formatics Lists of the proteins identified their frequency andexpression data E(g) and all other data manipulations andSWISS-2DPAGE comparisons are available as supplemen-tary material on-line (see Supplementary material)
Acknowledgements
The authors thank Drs Bill Russell and Zee-Yong Park fortheir advice and assistance with the mass spectrometry andLeonardo Marintildeo for assistance in constructing the databaseWe also thank Dr Larry Dangott and JoAnne Lewis at theTexas A amp M University Protein Chemistry Laboratory forperforming the two-dimensional electrophoresis and HayleeYowell for assistance with the DNA microarrays This workbenefited from useful discussions with many people includingTom Baldwin Dick Burgess Brian Chait David EisenbergSydney Kustu Matthias Mann and John Yates This work wassupported by NIH grants GM55154 to DAS and GM63652to JH
Supplementary material
The following material is available from httpwwwblackwellpublishingcomjournalssuppmatmolemole3294mmi3294smhtm
Lists of the proteins identified their frequency and expres-sion data E(g) and all other data manipulations and SWISS-2DPAGE comparisons
References
Alberts B (1998) The cell as a collection of proteinmachines preparing the next generation of molecular biol-ogists Cell 92 291ndash294
Arnold CN McElhanon J Lee A Leonhart R andSiegele DA (2001) Global analysis of Escherichia coligene expression during the acetate- induced acid toler-ance response J Bacteriol 183 2178ndash2186
Beadle GW (1945) Biochemical Genetics Chem Rev 3715ndash96
Blattner FR Plunkett III G Bloch CA Perna NTBurland V Riley M et al (1997) The complete genomesequence of Escherichia coli K-12 Science 277 1453ndash1462
Butt A Davison MD Smith GJ Young JA GaskellSJ Oliver SG and Beynon RJ (2001) Chromato-graphic separations as a prelude to two-dimensional elec-trophoresis in proteomics analysis Proteomics 1 42ndash53
Courcelle J Khodursky A Peter B Brown PO andHanawalt PC (2001) Comparative gene expression pro-
files following UV exposure in wild-type and SOS-deficientEscherichia coli Genetics 158 41ndash64
Edmondson RD and Russell DH (1996) Evaluation ofmatrix-assisted laser desorption ionization-time-of-flightmass measurement accuracy by using delayed extractionJ Am Soc Mass Spectrometry 7 995ndash1001
Eriksson J Chait BT and Fenyo D (2000) A statisticalbasis for testing the significance of mass spectrometricprotein identification results Anal Chem 72 999ndash1005
Gavin AC Bosche M Krause R Grandi P MarziochM Bauer A et al (2002) Functional organization of theyeast proteome by systematic analysis of protein com-plexes Nature 415 141ndash147
Gygi SP Corthals GL Zhang Y Rochon Y andAebersold R (2000) Evaluation of two-dimensional gelelectrophoresis-based proteome analysis technologyProc Natl Acad Sci USA 97 9390ndash9395
Ho Y Gruhler A Heilbut A Bader GD Moore LAdams SL et al (2002) Systematic identification of pro-tein complexes in Saccharomyces cerevisiae by massspectrometry Nature 415 180ndash183
Hoogland C Sanchez JC Tonella L Binz PA BairochA Hochstrasser DF and Appel RD (2000) The 1999SWISS-2DPAGE database update Nucleic Acids Res 28286ndash288
Ito T Chiba T Ozawa R Yoshida M Hattori M andSakaki Y (2001) A comprehensive two-hybrid analysis toexplore the yeast protein interactome Proc Natl Acad SciUSA 98 4569ndash4574
Jensen ON Podtelejnikov AV and Mann M (1997) Iden-tification of the components of simple protein mixtures byhigh-accuracy peptide mass mapping and databasesearching Anal Chem 69 4741ndash4750
Karlin S and Mrazek J (2000) Predicted highly expressedgenes of diverse prokaryotic genomes J Bacteriol 1825238ndash5250
Lee K Bernstein JA and Cohen SN (2002) RNase Gcomplementation of rne null mutation identifies functionalinterrelationships with RNase E in Escherichia coli MolMicrobiol 43 1445ndash1456
Lin-Chao S and Cohen SN (1991) The rate of processingand degradation of antisense RNAI regulates the replica-tion of ColE1-type plasmids in vivo Cell 65 1233ndash1242
Link AJ Robison K and Church GM (1997) Comparingthe predicted and observed properties of proteins encodedin the genome of Escherichia coli K-12 Electrophoresis18 1259ndash1313
Mann M Hojrup P and Roepstorff P (1993) Use of massspectrometric molecular weight information to identify pro-teins in sequence databases Biol Mass Spectrom 22338ndash345
Miller J (1972) Experiments in Molecular Genetics NewYork Cold Spring Harbor Laboratory Press
Nelson RW Nedelkov D and Tubbs KA (2000)Biosensor chip mass spectrometry a chip-based proteom-ics approach Electrophoresis 21 1155ndash1163
OrsquoFarrell PH (1975) High resolution two-dimensional elec-trophoresis of proteins J Biol Chem 250 4007ndash4021
Pappin DJC Hojrup P and Bleasby AJ (1993) Rapididentification of proteins by peptide-mass fingerprintingCurrent Biol 3 327ndash332
396 M M Champion et al
copy 2003 Blackwell Publishing Ltd Molecular Microbiology 47 383ndash396
Park ZY and Russell DH (2000) Thermal denaturationa useful technique in peptide mass mapping Anal Chem72 2667ndash2670
Rabilloud T (2002) Two-dimensional gel electrophoresis inproteomics old old fashioned but it still climbs up themountains Proteomics 2 3ndash10
Serres MH Gopal S Nahum LA Liang PGaasterland T and Riley M (2001) A functional updateof the Escherichia coli K-12 genome Genome Biol 2research00351ndash00357
Shevchenko A Wilm M Vorm O Jensen ONPodtelejnikov AV Neubauer G et al (1996) A strategyfor identifying gel-separated proteins in sequence data-bases by MS alone Biochem Soc Trans 24 893ndash896
Tao H Bausch C Richmond C Blattner FR and Con-way T (1999) Functional genomics expression analysisof Escherichia coli growing on minimal and rich media JBacteriol 181 6425ndash6440
Tonella L Hoogland C Binz PA Appel RDHochstrasser DF and Sanchez JC (2001) New per-spectives in the Escherichia coli proteome investigationProteomics 1 409ndash423
Tong AH Drees B Nardelli G Bader GD BrannettiB Castagnoli L et al (2002) A combined experimentaland computational strategy to define protein interactionnetworks for peptide recognition modules Science 295321ndash324
Uetz P Giot L Cagney G Mansfield TA Judson RSKnight JR et al (2000) A comprehensive analysis ofproteinndashprotein interactions in Saccharomyces cerevisiaeNature 403 623ndash627
VanBogelen RA Abshire KZ Pertsemlidis A ClarkRL and Neidhardt FC (1996) Gene-Protein Databaseof Escherichia coli K-12 Edition 6 In Escherichia Coli andSalmonella Typhimurium Cellular and Molecular BiologyVol 2 Neidhardt FC Curtiss RCI Ingraham JL
Lin ECC Low KB Magasanik B Reznikoff WSRiley M Schaechter M and Umbarger HE (eds)Washington DC American Society for Microbiology Presspp 2067ndash2117
VanBogelen RA Greis KD Blumenthal RM Tani THand Matthews RG (1999a) Mapping regulatory networksin microbial cells Trends Microbiol 7 320ndash328
VanBogelen RA Schiller EE Thomas JD andNeidhardt FC (1999b) Diagnosis of cellular states ofmicrobial organisms using proteomics Electrophoresis 202149ndash2159
Washburn MP and Yates III JR (2000) Analysis of themicrobial proteome Curr Opin Microbiol 3 292ndash297
Washburn MP Wolters D and Yates III JR (2001)Large-scale analysis of the yeast proteome by multidimen-sional protein identification technology Nat Biotechnol 19242ndash247
Wei Y Lee JM Richmond C Blattner FR RafalskiJA and LaRossa RA (2001) High-density microarray-mediated gene expression profiling of Escherichia coliJ Bacteriol 183 545ndash556
Wilkins MR Pasquali C Appel RD Ou K Golaz OSanchez JC et al (1996) From proteins to proteomeslarge scale protein identification by two-dimensional elec-trophoresis and amino acid analysis Biotechnology (NY)14 61ndash65
Wolters DA Washburn MP and Yates III JR(2001) Anautomated multidimensional protein identification tech-nology for shotgun proteomics Anal Chem 73 5683ndash5690
Yates JR III Speicher S Griffin PR and Hunkapiller T(1993) Peptide mass maps a highly informative approachto protein identification Anal Biochem 214 397ndash408
Zhu H Bilgin M Bangham R Hall D Casamayor ABertone P et al (2001) Global analysis of protein activitiesusing proteome chips Science 293 2101ndash2105

384
M M Champion
et al
copy 2003 Blackwell Publishing Ltd
Molecular Microbiology
47
383ndash396
gels Identification of proteins from peptide fingerprintingandor peptide sequencing allows identification of moregene products although validation of identified proteinsmay be problematic in some cases (Rabilloud 2002)
Both of these approaches share one important weak-ness the denaturation of the proteins at the first stepleads to the loss of all native-state information In partic-ular information about proteinndashprotein interactions isdestroyed including the subunit identities of stable multi-subunit proteins and protein complexes In traditional pro-tein biochemistry this information is derived fromdetermining what polypeptides cofractionate with a pro-tein during purification
Here we describe the application of a different com-plementary gel-independent proteomics method to studythe expressed proteome of
E coli
Our approach can bedescribed as combining traditional protein biochemistrywith mass spectrometry-based analytical methods toidentify proteins Proteins are fractionated under non-denaturing conditions and identification of proteins in theresultant mixtures was carried out only after the separa-tion Using this approach we identified similar numbersof gene products as have been found from two-dimensional gels and in combination with published iden-tities from two-dimensional gels we describe the largestset of protein identifications from
E coli
to date In addi-tion patterns of cofractionation suggest identities for alarge number of possible proteinndashprotein interactions
Results
Two-dimensional native-state chromatographic separation of soluble proteins
Our general approach is shown in Fig 1A Whole-celllysates are fractionated over two dimensions of native-state HPLC a strong anion exchange column (AIX)followed by a second separation on a hydrophobicinteraction resin (HIC) Proteins in each fraction arethen digested with trypsin and identified from the massesof tryptic fragments which are determined by matrix-assisted laser desorption ionization time-of-flight(MALDI-TOF) mass spectrometry
Figure 1B and C shows the separation of the clarifiedcrude lysate of
E coli
For the first dimension anionexchange we utilized a shallow segmented salt gradientto distribute the proteins roughly equally over 19 protein-containing fractions plus flow-through (Fig 1B) About20 of the total protein by weight is in the flow-throughwhich was processed separately (see below) The largepeak of UV-absorbing material in fractions 22ndash25 containsprimarily nucleic acids (data not shown) Figure 1C showsthe elution profile for a typical second dimension separa-tion of one of the 19 anion-exchange fractions after HICThe two dimensions of chromatography separate the
soluble proteins into 380 fractions Many of these individ-ual fractions contain 5ndash20 proteins visible by silver stain-ing of one-dimensional SDS gels (data not shown) Theseparation was performed four times using lysates fromindependent cultures Two different pH conditions(pH 750 and pH 875) were used for the anion-exchangestep and two lysates were processed at each pH
Proteins from the ion-exchange flow-through
Approximately 20 of the protein by mass flowed throughthe ion-exchange column As this is the only fraction that
Fig 1
Proteomics by native-state LCLCA Flowchart Clarified crude lysates of
Escherichia coli
MG1655 first separated over an anion exchange (AIX) column collected into 20 fractions either run on a two-dimensional polyacrylamide electro-phoresis (PAGE) or separated over a hydrophobic interaction resin (HIC) These fractions are digested and identified using matrix-assisted laser desorption ionization-delayed extraction reflectron-time-of-flight mass spectrometry (MALDI-DE-R-TOF MS) and peptide mass fingerprintingB Chromatogram of first dimension separations Typical chromato-gram trace for cell lysates separated on SOURCE 15Q anion-exchange column (pH 750) Traces show UV 280 nm absorbing material gradient (NaCl) and the bars quantify the protein in each fraction by Bradford assayC Typical chromatogram for second dimension fractionation in this case of AIX fraction 16
Proteins expressed in
E coli 385
copy 2003 Blackwell Publishing Ltd
Molecular Microbiology
47
383ndash396
contains such a high amount of protein we suspected that30S and 50S ribosomal subunits were in the ion-exchangeflow through Consistent with this possibility fractiona-tion of the flow-though via a Superose 12 size-exclusioncolumn revealed RNA and abundant proteins in the voidvolume consistent with the presence of a ribonucleopro-tein complex gt300 000 MW (data not shown) MALDI-MSand peptide mass fingerprinting identified several riboso-mal proteins in the ion-exchange flow-through refraction-ated by cation-exchange chromatography or SDS-PAGE(data not shown) Tandem mass spectrometry performedon trypsinized ion-exchange flow-through using a ThermoFinnigan LCQ Deca identified an additional 18 ribosomalproteins from peptide sequences (data not shown) and noattempts were made to identify the remaining proteins inthe ion-exchange flow-through in this study
Protein identification
The masses of tryptic peptides from digestion of eachfraction were determined by matrix-assisted laser desorp-tion ionization-delayed extraction reflectron-time-of-flightmass spectrometry (MALDI-DE-R-TOF) as described in
Experimental procedures
Figure 2 shows a MALDI-DE-R-TOF spectrum from one of the HIC fractions In totalnearly 2000 spectra were collected and annotated for theirpeptide masses The average mass error (mz) for eachfraction was 20 ppm with a standard deviation of20 ppm
Proteins in each fraction were identified by recursivematching of observed peptide masses from tryptic digeststo peptides predicted in the
E coli
genome as describedin
Experimental procedures
Table 1 summarizes the
number of proteins found in each lysate and the overlapbetween experiments Overall 2012 proteins were identi-fied corresponding to a non-redundant set of 310 geneproducts A full list of the protein identities and the frac-tions where they are found is available as supplementarymaterial (see
Supplementary material
)
Comparison with proteins observed by two-dimensional polyacrylamide gel electrophoresis (PAGE)
To test the validity of our protein assignments we com-pared the proteins identified in each AIX fraction to theproteins observed by two-dimensional PAGE Figure 3shows two-dimensional gels for the 19 fractions from thefirst dimension of chromatography To generate a list ofproteins we expect to see on each gel we merged assign-ments made from MS data of second dimension (HIC)fractions for each of the AIX fractions We then examinedthe appropriate two-dimensional gel for a spot migratingat the expected MW and pI As many proteins seen ontwo-dimensional gels migrate at positions that differ sig-nificantly from their predicted positions (Link
et al
1997)
Fig 2
Typical MALDI-DE-R-TOF spectrum for a protein digest from a second dimension column fraction MALDI-MS was performed on column fractions peak annotation was performed using
GRAMS
32 software and data were exported for peptide mass fingerprinting with
MS
-
FIT
The inset shows the well resolved mono-isotopic distribution of an individual tryptic fragment in this spectrum
Table 1
Protein identification totals from
Escherichia coli
lysates
AIX pH 750A 750B 875A 875B Total
Proteins IDrsquod 596 440 517 459 2012Unique IDs 138 167 143 156 310
Each pH was performed twice and totals are listed above The totalnumber of proteins identified includes the same proteins found inmultiple fractions unique IDrsquos are non-redundant totals for eachexperiment The total of 310 identifications is the total of all uniqueIDrsquos from all four proteomes with redundant entries removed
386
M M Champion
et al
copy 2003 Blackwell Publishing Ltd
Molecular Microbiology
47
383ndash396
we used published and indexed two-dimensional gel mapsof
E coli
(Hoogland
et al
2000 Tonella
et al
2001 seehttpexpasyorgch2d) to identify spots wherever possi-ble By combining predicted spot positions with knownspot migrations we can examine the correlation betweenour protein assignments and spots that can be identifiedon the two-dimensional gels
Figure 4 shows one example of an annotated two-dimensional gel In this case we can correlate 16 out ofthe 17 proteins we identify with spots on the two-
dimensional gel For this gel only one protein identifiedfrom the MS data GreA did not match a correspondingspot Figure 4 indicates the predicted and actual migrationof GreA as lsquoQrsquo and lsquoRrsquo respectively As a control werandomly selected bins of 30 proteins from our completelist of 310 identified proteins and attempted to matchthem to the positions of the observed spots for severalgels (data not shown) Only two of these randomlyselected proteins matched a spot at the appropriate MWand pI one of them was in the list of expected proteins
Fig 3
Two-dimensional gels of anion exchange (AIX) (SOURCE 15Q) fractions Approximately 300
m
g of protein from each AIX fraction was subjected to two-dimensional PAGE analysis and stained with Coomassie blue Isoelectric focusing was done using IPG strips with a non-linear pH 3ndash11 gradient Gels are numbered by the AIX fractions that were run
Proteins expressed in
E coli 387
copy 2003 Blackwell Publishing Ltd
Molecular Microbiology
47
383ndash396
identified in the corresponding fraction Thus the correla-tion between the proteins identified by MS and thoseobserved on the gel is much better than would beexpected by chance
In addition to the spots identified with MS correlationall of the gels resolved spots with identities that could notbe assigned from MS data for that fraction Some of theseare clearly multiple spots produced from the same proteinindeed some of these are annotated in databases of
Ecoli
proteins identified by two-dimensional gels In other
cases we can make assignments when the same spot isseen in gels from a series of contiguous fractions reflect-ing the changing abundance of each protein as it elutesfrom the ion exchange column Although the protein mightnot be identified by MS in one fraction it could be identi-fied in one or more of the contiguous fractions For exam-ple we can see the spot marked 1 in Fig 4 on gels fromAIX fractions 9ndash13 In AIX fraction 17 this spot is uniden-tified but in AIX fractions 18 20 21 and 22 it is identifiedas DnaK the major Hsp70 homologue in
E coli
We alsoobserve several spots such as spot 2 which could not beidentified unambiguously by either MALDI-MS or compar-ison with published gel annotations Out of the 219 uniqueproteins we identify at pH 750 we can assign spots onthe two-dimensional gels for 109 of them (57) Out ofthese 41 (38) were not previously annotated in theSWISS-2D database
Classification of proteins identified by function pIMW and abundance
To determine whether our method is biased toward oragainst particular kinds of proteins we compared thekinds of proteins found in
E coli
fractions to the differentgene classes defined by Blattner
et al and
the Riley lab-oratory web page (Fig 5) We find proteins predicted tobe in all of the functional classes but fewer proteins anno-tated as membrane proteins (transport cell structure) areseen than would be expected in a random sampling Thisis probably a consequence of how we prepared our sam-ples which requires that proteins remain soluble Werecover a greater fraction of proteins involved in metabo-
Fig 4
Comparison of proteins identified by LCLC MS and by two-dimensional gelsA Annotated two-dimensional gel of AIX (SOURCE15Q) fraction 17B Identities and predicted pI and MW for proteins expected to be in this fraction based on peptide mass fingerprinting of HIC fractions from AIX fraction 17 Spot ID Q highlighted in grey shows the predicted migration of GreA which is not visible in this gel Spots labelled 1 2 and R are discussed in the text
Fig 5
Classification of identified proteins by function Functional classification categories are from Blattner
et al
(1997) and Riley
et al
(httppcltamuedu) Open and filled bars show the percentage of the genome and the proteins identified in this study respectively assigned to each functional class Although MG1655 does not contain any plasmids extrachromosomal genes include prophage genes The Cryptic category includes 43 genes annotated as not expressed Our single lsquohitrsquo of a translated cryptic gene was
hofB
which is a putative transport protein
388
M M Champion
et al
copy 2003 Blackwell Publishing Ltd
Molecular Microbiology
47
383ndash396
lism which probably reflects abundance more than genefunction
We also examined the predicted pI and molecularweights of the proteins we identified and compared themto the distribution of pI and molecular weights of all of theannotated open reading frames (ORFs) in the
E coli
genome (Fig 6) For comparison we examined the distri-bution of proteins seen in the SWISS-2DPAGE databaseSWISS-2DPAGE identified very few proteins for pI rangesabove 70 The proteins we observe cover the whole pIrange observed for the genome with a slight bias toward
proteins with pIs between 4 and 6 This may reflect thepIs of proteins in the optimal separation range for theanion exchange step andor it could be a consequenceof a bias against very basic proteins which would tend tobe in the flow-through of the anion exchange column Only183 of the proteins we identified have a predicted pIabove 70 whereas the expected frequency for thegenome is 355 Two-dimensional gel data has anexpected bias toward proteins that resolve well by isoelec-tric focusing Only 77 of the SWISS-2D identificationshave a predicted pI above 70 Both methods mirror the
Fig 6
pI and molecular weight distributions for expressed proteomesA Distribution of the predicted pIsB Distribution of the predicted molecular weights Each panel shows indicated properties of the identified proteins for annotated ORFs from the genome sequence of MG1655 (inset) the proteins identified in this study (black) and the annotated SWISS-2D database for
E coli
(grey)
Each bar shows the number of proteins identified as a fraction of the number of annotated proteins from the complete genome in that pI or MW range
Proteins expressed in
E coli 389
copy 2003 Blackwell Publishing Ltd
Molecular Microbiology
47
383ndash396
genomic distribution in molecular weight and recover veryfew small peptidesproteins This partially reflects the factthat smaller proteins on average have fewer diagnostictryptic peptides than larger proteins As expected from thegel-independence of our methods we identify more low-molecular-weight proteins that do not resolve well on con-ventional SDS-PAGE
All proteome methods to identify expressed proteinsare biased toward those that are abundant As directmeasurements of abundance are not available for most
E coli
proteins we used two criteria to evaluate the cor-relation between our protein identifications and theactual abundance of the proteins First we examinedthe overlap between our identifications and the proteinsfor which synthetic rates have been measured by pulse-labelling and two-dimensional electrophoresis In
E coli
strain W3110 grown in minimal MOPS
+
glucose undersimilar growth phase conditions 51 proteins wereindexed by Neidhardt
et al
(VanBogelen
et al
1996)All 51 of these were identified in our study Assumingthat the quantification made from pulse-labelled cellsapproximates the steady-state levels of proteins fromtheir data we detect proteins with the lowest statedabundance of
ge
02 of total protein or about 500 cop-ies per cell This agrees well with reconstruction experi-ments we performed using known amounts of beta-galactosidase spiked into column fractions where weestimate sensitivity of about 250 copies per cell (datanot shown) However our absolute detection sensitivityis more limited by ion-suppression of more abundantpeptides and low-abundance proteins diluted over multi-
ple fractions than lack of ability to recover low-abundance proteins
We also examined the expression levels of each proteinpredicted from sequence analysis Karlin and Mraacutezek(2000) described an algorithm to predict abundancebased on comparing codon usage of a gene of interest tothat of several abundant protein classes including riboso-mal proteins chaperonins and translation factors Thepredicted expression level is expressed as an E(g) ratiowhere values greater than 1 are considered to be lsquopre-dicted highly expressedrsquo or (PHX) Figure 7 compares thedistribution of E(g) values for the proteins we identified tothe values for all of the annotated genes from
E coli
K-12 39 of our identifications fall within the PHX classwhereas only 8 of the proteins in the genome are pre-dicted to have an E(g) value gt 10 Proteins identified inthe SWISS-2DPAGE gel database have a similar distribu-tion as the proteins we identify by our method 45 of theSWISS-2D identifications have E(g) values greater than10 We seem to find more proteins from the lower expres-sion classes
Correlation with gene expression assayed by DNA microarrays
We examined the correlation between the 310 proteins weidentified and gene expression by performing microarrayexperiments to identify expressed mRNAs In total RNAprepared from three independent cultures grown underidentical conditions to those used for protein samples weobserved 3860 genes expressed at gt4 SD above the
Fig 7
Predicted expression levels for identified proteins E(g) value distributions were determined for the proteins identified in this study (black) and the entire annotated SWISS-2DPAGE for
E coli
(grey) and the MG1655 genome (inset) Vertical black lines indicate the cut-off for genes that are in the PHX class (predicted highly expressed)
390
M M Champion
et al
copy 2003 Blackwell Publishing Ltd
Molecular Microbiology
47
383ndash396
background in all three cultures In published array exper-iments expression of similar numbers of genes isobserved in exponential phase cultures of the same
Ecoli
strain also growing in minimal glucose medium (Tao
et al
1999 Courcelle
et al
2001 Wei
et al
2001)Hybridization was observed for 94 (290 out of 310) ofthe genes encoding the proteins we observed
Co-fractionation of native complexes
Because multiprotein complexes should remain intactthrough both chromatographic dimensions it may be pos-sible to identify protein complexes by analysing chromato-graphic cofractionation of subunits The general idea is toapply a lsquoguilt by associationrsquo analysis to our entire pro-teome snapshot In 10 cases gene names suggest thattwo or more cofractionating proteins share a commonfunction However simply examining the cofractionationover two columns is likely to generate a very high back-ground of false positives Proteins in the same fractioncould cofractionate because they are physically associ-ated or because they just happen to fractionate similarlyIn traditional purification protocols coincidental cofraction-ation is reduced by either increasing the specificity ofpurification steps (eg affinity chromatography) or addingmore steps to the purification (additional chromatographicsteps)
Instead of adding additional purification steps to theseparation we performed parallel separations in whichthe pH of the buffers used in the anion exchange step waschanged lsquopH scoutingrsquo is often used to optimize ionexchange separations and is based on how titration ofionizable surface groups on the protein alters their elutionpositions At either pH stable complexes will coelute fromthe anion exchange column whereas proteins in the samefraction by coincidence are free to migrate elsewheredepending on their individual chromatographic properties
This is illustrated by PheS and PheT the
a
and b sub-units respectively of an a2b2 heterotetrameric tRNAcharging enzyme PheS and PheT cofractionate at bothpH 750 and pH 875 At pH 750 eight other proteins arefound in the same fractions as PheS and PheT AccAAceE AsnS GltB GroES RfbB RpsA and Tig At pH of875 RplJ and Tig are found cofractionating with PheSand PheT As Tig is an abundant chaperonin it is likelythat its interaction with PheS and PheT is non-specific orcoincidental
By applying this analysis to all of the proteins we iden-tified 125 pairs of proteins that cofractionated at bothpH 750 and pH 875 (Table 2) These potential interac-tions include several like PheS and PheT that have beenpreviously described or that seem plausible from func-tional annotations This is clearly an underestimate of thestable complexes known complexes such as RNA core
polymerase a2bbcent and the ClpX ClpP E coli proteosomewere identified as cofractionating in only one sample oronly at one pH
Discussion
Identities of expressed proteins
Understanding the physiology of a cell involves knowingwhat proteins are expressed under a given set of circum-stances Although powerful methods for genome-wideexpression profiling based on examining mRNA arewidely available the correlation between mRNA and pro-tein levels is imperfect and direct examination of cellularprotein content is needed Although two-dimensionalgels have been applied to catalogue the expressed pro-teins in E coli for many years a variety of technicalissues prevent efficient identification of the genes thatencode the proteins seen as thousands of spots on two-dimensional gels For example protein recovery fromgels is often low samples are sometimes difficult todigest in situ and the loading capacity of gels limits theamount of material that can be recovered from spotsNevertheless combining multiple two-dimensional gelswith microsequencing or mass spectrometry has allowedthe identification of 273 proteins from E coli in mid-exponential phase growth in minimal glucose medium(Tonella et al 2001)
Above we describe a complementary gel-independentapproach based on multidimensional liquid chromatogra-phy Although the resolution of chromatography is muchlower than gel electrophoresis the samples obtained aremuch more efficiently processed for protein identificationusing the power of mass spectrometry to deconvolutecomplex mixtures of proteins found in chromatographicfractions Using this method we identified 310 proteinsexpressed in exponential-phase E coli growing in M9glucose media supplemented with amino acids (caseinhydrolysate)
Figure 8 compares our results with the SWISS-2DPAGE proteome from E coli (Hoogland et al 2000)Taken together our studies and the SWISS-2D PAGEidentify 467 proteins Out of these 116 were identified byboth studies whereas the native-state LCLC MSapproach described here identified 194 proteins that werenot previously annotated in the SWISS-2DPAGE data-base The SWISS-2DPAGE database identified 157 pro-teins that were not seen in our experiments Clearly thetwo methods complement each other to provide a morecomplete understanding of the protein content of E colithan either would alone
Although our primary reason for performing a parallelanalysis of column fractions by both peptide mass finger-printing and two-dimensional gels was to validate theidentifications made by the former the concordance
Proteins expressed in E coli 391
copy 2003 Blackwell Publishing Ltd Molecular Microbiology 47 383ndash396
between a predicted pIMW for a protein identified bymass fingerprinting and a spot on a gel also can be usedto assign an identity to the spot without having to recoverprotein or peptides from the gels In this way we assignedidentities to 41 spots that were previously unidentified inthe SWISS-2D database
Neither our method nor the combination of our methodwith two-dimensional gels is detecting all of the proteinswe expect to be present in the cell Although determiningthe number of expressed proteins from two-dimensionalgels requires making assumptions about the number ofspots per protein estimates of about 1000ndash3000 expre-ssed proteins are in reasonable agreement with the num-
ber of expressed E coli genes seen by microarrayexperiments (see above and A Khodursky personal com-munication) Why arenrsquot we identifying 70ndash90 of theproteins we expect to see Although some are likely to bein the fractions we were not able to process for examplemembrane proteins in the insoluble pellet and proteins inthe flow-through from the ion-exchange column these areunlikely to account for the bulk of the proteins we aremissing
Because MALDI-TOF is capable of exquisite sensitivitywith pure peptides the amount of material in our samplesis not limiting However peptides in mixtures compete forionization leading to suppression of the weaker signals
Table 2 Proteins that cofractionate at both pH 75 and pH 875
ACEA PNP DAPD PURT GREA GUAA PROA GLNS SUCC CYSKACKA FABI DAPD SSPA GREA PPA PROS FABI TALB PYRHACKA TSF DNAK LYSS GROS TIG PROS PURH THRC ASPCADK GAPA DNAK TYPA GUAA DAPA PROS TSF TIG ASNSAHPC GLNS DUT GND GUAA GREA PROS TUFA TIG GROSAHPC TRPC ENO GND GUAA PPA PURA GLTA TIG GUABALAS YADF ENO SERC GUAA YCHF PURA KBL TIG PHESARGD FUSA FABI ACKA GUAB TIG PURA TKTA TIG PHETARGG ISCS FABI PROS HISC YADF PURF ARGG TIG RFBBARGG PURF FABI PURH ILES ASPC PURF ISCS TIG RPLJARGH CLPP FABI TSF INFB LYSS PURF PNP TIG RPSAARGH FUSA FABI YADF ISCS ARGG PURF TYPA TKTA GLTAARGI GCVT FDX LPDA ISCS CLPP PURH FABI TKTA PURAAROA DAPD FUSA ARGD ISCS PNP PURH PROS TKTA TSFAROK CYSK FUSA ARGH ISCS PURF PURH TSF TKTA TUFAAROK PGI FUSA ASNS ISCS SLYD PURH TUFA TPIA GLYAASNS DAPA FUSA RPSA KBL ASPS PURH YADF TRPC AHPCASNS FUSA FUSA SPEE KBL GND PURN SSPA TRPC GLNSASNS GLTA FUSA VALS KBL PURA PURT DAPD TSF ACKAASNS KDGK GAPA ADK KDGK ASNS PYKF CYSK TSF FABIASNS RFBB GAPA GLYA KDGK DAPA PYKF GCVT TSF GLTAASNS RPLJ GAPA GPMA LPDA FDX PYKF NDK TSF PPIBASNS RPSA GCVT ARGI LYSS DNAK PYRH TALB TSF PROSASNS SERS GCVT ASPS LYSS INFB RFBB ASNS TSF PURHASNS TIG GCVT CYSK NDK DAPD RFBB RPSA TSF RPLIASNS TUFA GCVT NDK NDK GCVT RFBB TIG TSF TKTAASNS VALS GCVT PYKF NDK PYKF RPLI TSF TSF TUFAASPC DAPD GLNS AHPC NUSA PNP RPLJ ASNS TUFA ASNSASPC ILES GLNS PROA NUSA SLYD RPLJ TIG TUFA GLTAASPC THRC GLNS TRPC NUSA SPEB RPSA ASNS TUFA PROSASPS GCVT GLTA ASNS NUSA YICC RPSA FUSA TUFA PURHASPS GND GLTA PURA PGI AROK RPSA RFBB TUFA TKTAASPS KBL GLTA TKTA PGI CYSK RPSA SERS TUFA TSFBGLA YFBU GLTA TSF PHES PHET RPSA TIG TYPA DNAKCLPP ARGH GLTA TUFA PHES TIG RPSA VALS TYPA PNPCLPP ISCS GLTX GND PHET PHES RSUA VALS TYPA PURFCYSK AROK GLTX PPA PHET TIG SERC ENO VALS ASNSCYSK DAPD GLYA GAPA PNP ACEA SERC GLYA VALS FUSACYSK GCVT GLYA SERC PNP ISCS SERS ASNS VALS RPSACYSK PGI GLYA TPIA PNP NUSA SERS RPSA VALS RSUACYSK PYKF GLYA YIFE PNP PURF SLYD ISCS YADF ALASCYSK SUCC GND ASPS PNP SLYD SLYD NUSA YADF FABIDAPA ASNS GND DUT PNP TYPA SLYD PNP YADF HISCDAPA GUAA GND ENO PNP YICC SLYD SPEB YADF PURHDAPA KDGK GND GLTX PPA DAPA SLYD YICC YCHF GUAADAPA PPA GND GOR PPA GLTX SPEB NUSA YFBU BGLADAPD AROA GND KBL PPA GND SPEB SLYD YICC NUSADAPD ASPC GND PPA PPA GREA SPEE FUSA YICC PNPDAPD CYSK GOR GND PPA GUAA SSPA DAPD YICC SLYDDAPD NDK GPMA GAPA PPIB TSF SSPA PURN YIFE GLYA
The 125 pairs are shown as 250 entries each pair is listed with each partner first to aid finding proteins of interest
392 M M Champion et al
copy 2003 Blackwell Publishing Ltd Molecular Microbiology 47 383ndash396
The two chromatographic separations used here help toalleviate that problem relative to unfractionated extractswhere extremely abundant ribosomal proteins dominatethe spectra However the complexity of our mixtures evenafter chromatography limits the numbers of proteins wecan identify possibly due to incomplete digestion and theability to identify enough tryptic peptides from eachpolypeptide for an unambiguous assignment for someproteins
Recently high resolution separation of tryptic peptidesby multidimensional HPLC and mass spectrometric anal-ysis of peptides and peptide fragments produced by col-lision-induced dissociation have been used to provide alarge-scale analysis of the yeast proteome (Washburnet al 2001) Based on the published work on yeast thisapproach would be expected to identify many more pro-teins in either our column fractions or in tryptic digests ofthe unfractionated E coli lysates Although tandem MSapproaches yield greater numbers of identifications thelarge amounts of instrument time and computationalpower required to search the data make it impractical forrapid identification of proteins and interrogating multiplephysiologic states Performing our type of analysis on all380 fractions generated by the two chromatographicdimensions used here would involve prohibitive amountsof instrument time (weeks) with current technology
Protein complexes
Identification of expressed polypeptides as the productsof specific genes provides information about gene expres-sion but it is important to remember Benzerrsquos modificationof the lsquoone gene-one enzymersquo hypothesis of Beadle andTatum (Beadle 1945) to lsquoone cistron-one polypeptidersquoIndividual polypeptides are not equivalent to proteinsbecause proteins have quaternary structure and are often
composed of multiple subunits Indeed it is becomingclear that many intracellular processes are carried out bylarger multisubunit complexes than had been imaginedpreviously (Alberts 1998)
For these reasons major efforts are ongoing to map thelsquointeractomesrsquo in several organisms by a variety of tech-niques including large-scale two-hybrid studies (Uetzet al 2000 Ito et al 2001) protein chips (Nelson et al2000 Zhu et al 2001 Rabilloud 2002) and identificationof proteins that coimmunoprecipitate or co-purify with spe-cific baits for which there are antibodies (Tong et al 2002)or expressed versions with affinity tags (Gavin et al 2002Ho et al 2002) Although each of these methods is ableto identify a subset of the interactions known to occur ina proteome all of them identify only subsets of the previ-ously known interactions and presumably only subsetsof the unknown interactions they seek to find In additionto high fractions of false negatives each approach has itsown kinds of false positives
In our approach cofractionation through partial purifi-cation provides suggestive evidence for interactions Co-purification is the classical method of biochemical identi-fication of the subunits in a multisubunit protein whateverremains at a reasonable stoichiometry after an activity ispurified to homogeneity or near homogeneity is consid-ered to be a subunit Purification to homogeneity isimpractical on a genome-wide scale for two reasons firstbecause of the exponential increase in the scale of theexperiment with the addition of each fractionation andsecond because there is no universal assay by which tofollow the activities of all possible complexes
Instead we examined the concordance of cofractionat-ing proteins through parallel partial purifications In eachindividual preparation any given protein complex is con-taminated by many other proteins that co-purify coinciden-tally If we can use conditions that differentially change theelution of proteins then we should find a different subsetof the proteome contaminating the same complex Sub-units of stable complexes should stay together through allof our purification steps
As with other proteomics methods our method willinclude both false positives and false negatives Falsepositives will occur simply because some proteins willco-purify coincidentally over both of our fractionationschemes Here we used two different pHs in the ionexchange dimension as our different schemes Thechanges in elution position that we need to alter the spec-trum of contaminants seem to be larger for the weaklycharged proteins that elute from the column first than forthe more strongly anionic proteins that elute later at highersalt concentrations This is as expected these proteinsare probably enriched for acidic residues that do not titratesignificantly over the pH range we used In addition thetitration of ionizable groups in these proteins will have a
Fig 8 Venn diagram of overlap between E coli proteome projectsdata sets This diagram illustrates the distribution of the non-redundant protein assignments from each proteome and the overlap between the two The data sets together identify 467 non-redundant proteins from E coli
Proteins expressed in E coli 393
copy 2003 Blackwell Publishing Ltd Molecular Microbiology 47 383ndash396
smaller effect as a fraction of the total charge comparedwith the more weakly anionic proteins Despite these lim-itations the use of two pHs has already significantlyreduced the background of coincidental co-purificationOther fractionation schemes that are based on larger dif-ferences in the physical basis for separation may reducethe false positives further
False negatives have two major sources First we knowfrom the long history of protein biochemistry that somecomplexes will not survive the purification steps Cell lysisand fractionation involve significant dilution from intracel-lular conditions and the changes in salt and pH thataccompany each fractionation step as well as binding tothe chromatographic matrices per se will disrupt somecomplexes Second the low density of protein identifica-tions in each experiment will lead to missed identificationsof proteins that are successfully co-purified This is clearlyhappening in our experiments for some known complexesincluding RNA polymerase core Although we identify thea subunit of RNA polymerase in each of the fourexpressed proteomes and b and bcent are seen on gels inthe expected fractions diagnostic peptides for b and bcentwere only found in one out of four experiments
Despite these caveats 125 pairs of putative interactionsare detected in our experiments Several are either knownor plausible from the operon structure of the genesinvolved Further study will be needed to determine whichof the interactions represent real complexes
Future applications for E coli and other bacteria
The prospect of efficiently assigning gene identities toexpressed proteins provides renewed impetus to the anal-ysis of the expressed proteome as a function of bacterialphysiology It is important to note that the approachdescribed here is more accessible to small laboratoriesthan most other large-scale proteomics methodsalthough the process is clearly amenable to automationat many steps this study was carried out entirely withoutthe benefit of robotics Moreover unlike approachesbased on pre-digesting samples before separation theability to correlate identities made by native-state LCLCMS with quantification from two-dimensional gels whichare even more accessible to small-scale projects makesthe use of both methods much more powerful than thesum of the two
Similarly most large-scale interactome projects requireeither the construction of large numbers of strainsexpressing affinity-tagged proteins or the generation oflarge numbers of high-quality antibodies (note that poly-clonal antibodies often cross-react with many bacterialproteins) In contrast cofractionation can be done withany wild-type or mutant strain without further strainconstruction
The native-state LCLC MS approach should bebroadly applicable beyond E coli Proteomics based onpeptide mass fingerprinting is strongly dependent on theavailability of complete genome sequences proteins canonly be identified if they are in the database With therapid advances in the availability of complete genomesequences this is no longer a problem for many microor-ganisms The small size of bacterial genomes is a signif-icant factor in the success of the approach describedhere which used peptide mass fingerprinting alone toidentify several components in complex mixturesEriksson et al (2000) calculated the theoretical informa-tion content intrinsic to a peptide mass as a function ofthe genome size of the subject organism This study val-idates their theoretical calculations and shows that for agenome of the size and complexity of E coli peptidemass fingerprinting is able to successfully deconvolutemixtures of proteins generated by two dimensions ofchromatography
Experimental procedures
Escherichia coli lysates
Escherichia coli K-12 strain MG1655 (Blattner et al 1997)was grown overnight in M9 minimal medium (Miller 1972)containing glucose (04) uridine (50 mg ml-1) CaCl2(100 mm) MgSO4 (2 mM) Then 1 l cultures of the samemedium plus (01 wv) casamino acids (Difco) were inocu-lated with 10 ml of the overnight and grown to OD600 = 05Cells were harvested by centrifugation at 4000 g for 20 minin a JA-10 rotor (Beckman) and washed by resuspension in20 mM Tris HCl 20 mM NaCl 1 mM EDTA pH 875 andcentrifuged again The pellet was resuspended in 6 ml of thesame buffer and lysed by three passes through a chilled smallFrench-pressure cell at 20 000 PSI The lysate was centri-fuged at 15 000 g for 25cent in a JA-20 rotor The supernatantwas filtered through a non-binding 045 mm syringe filterbefore chromatography
Two-dimensional electrophoresis
First 300 mg of material from each anion exchange fractionwas diverted for analysis by two-dimensional polyacrylamidegel electrophoresis (PAGE) Two-dimensional PAGE wasperformed at the Protein Chemistry Laboratory at TexasA amp M University (httpwwwcalabresocompclusershtml)Briefly acetone-precipitated anion-exchange samples werere-swelled into Igphor immobilized gradient gels (14 cmpH 3ndash10 NL) (Pharmacia) and focused for 60ndash80 000 Volthours After reduction and exchange in SDS and DTT 12SDS gels (13 yen 16cm) were run in the second dimensionand stained with Gel Code Blue (Pierce) pIrsquos were deter-mined by fitting a non-linear standard curve from Pharmaciaas a function of gel length and adjusted to proteins withknown migration (eg DnaK GroEL) Apparent molecularweight was determined by a standard ladder applied to the
394 M M Champion et al
copy 2003 Blackwell Publishing Ltd Molecular Microbiology 47 383ndash396
leftmost portion of the gel after loading of the iso-electric gelstrip
Chromatography
For the liquid separation of clarified lysates the followingprocedure was used Approximately half of the cell-lysatewas applied to a 1 ml SOURCE 15Q (Pharmacia) resinpacked into a Waters AP-1 glass column pre-equilibrated in20 mM NaCl 30 mM Bis-Tris 15 mM Tris-HCl at a pH of 750or 875 A segmented gradient from 20 mM to 1 M NaCl wasrun over approximately 150 column volumes at a flow rate of3 ml min-1 on an AumlKTA Explorer HPLC Then 5 ml fractionswere collected from the anion-exchange separation For thesecond dimension each anion exchange fraction wasbrought up to 15 M (NH4)2SO4 100 mM KPO4 buffer atpH 70 This was applied to a 1 ml SOURCE 15Phe (Phar-macia) resin packed into a Waters AP-1 glass column pre-equilibrated in the same buffer A segmented gradient of15 M to 0 M (NH4)2SO4 was used over approximately 15column volumes Then 05 ml fractions were collecteddirectly into microdialysis cassettes (Pierce) and arrayed intofoam racks and exhaustively dialysed against 25 mM ammo-nium bicarbonate Denaturation digestion and MALDI wereperformed essentially as described elsewhere (Park andRussell 2000) Spectra were acquired on a Perseptive Bio-systems Voyager Elite XL TOF with a pulsed nitrogen laserat 337 nm The dried samples were resuspended in 100ndash270 ml of water mixed with MALDI matrix (35 mM a-cyano-4-hydroxy-cinnaminic acidMeOH) to a final matrix concentra-tion of ordf 10 mM and lt05 ml was spotted in duplicate onto35 mM overlayers of matrix in MeOH (Edmondson andRussell 1996) The samples were analysed in reflectronmode with 25 kV accelerating voltage a grid voltage of175 kV and a delayed extraction time of 150 ns Signals from100 laser shots were averaged per spectrum Two-point cal-ibration was performed using angiotensin I and neurotensin([M + H]+ = 12966853 [M + H]+ = 16729175) and a low-mass gate of 500 Da was used
Matrix-assisted laser desorption ionization-delayed extrac-tion reflectron-time-of-flight mass spectrometry (MALDI DE-R-TOF) spectra were taken from digests of each of the HICfractions from the HPLC separations Four separate lysatesprepared on different days were used to generate the pro-teome separations Two different pHs were utilized in theanion-exchange separation each performed twice Peakpicking was done by the operator using GRAMS32 softwareand peptide-mass fingerprinting was performed as describedbelow In total nearly 2000 spectra were annotated and anal-ysed for protein content by peptide mass fingerprinting
Peptide mass fingerprinting
Proteins were identified from the resulting peptides using MS-FIT AND PROTEIN PROSPECTOR The algorithm that generatesthe MOWSE score and the ranking for MS-FIT outputsis detailed in Pappin et al (1993) and (httpprospectorucsfedu) The utility of peptide-mass fingerprinting of singleproteins and more recently protein mixtures has beenshown and applied to multiple experimental systems (Mannet al 1993 Yates et al 1993 Shevchenko et al 1996
Jensen et al 1997) Peptide masses were searched againstthe most current SWISS-PROT database with no constraintson pI or MW No post-translational modifications wereallowed and species was limited to E coli A mass error of300 ppm was applied and one missed cleavage wasallowed For our case the following database matching cri-teria in MS-FIT were applied (i) The identified protein mustcome from the correct strain of E coli As multiple strains ofE coli have been sequenced false-positive protein matchesoften occur with different strains For example a commonfalse positive protein from bacterial searches of E coli is TraIa gene located on the Fcent plasmid and not present in the Ecoli strain we used K-12 MG1655 (ii) The sequence cover-age of the putative protein identified must be greater than25 (iii) The assigned peptides for any given identificationmust have mass accuracy error consistent in magnitude andtrend with other peptides assigned to the same protein Ouraverage mass error was 20 ppm with a standard deviationof 20 ppm and our error rarely exceeded 50 ppm TheMOWSE algorithm is insensitive to error regardless which iswhy a high (300 ppm) tolerance was allowed Multiple pro-teins could be identified in the same fraction by removingthe peptides assigned to the first protein and resubmitting theremaining peaks in a recursive process Identification of thesame protein in adjacent fractions in both separation dimen-sions allowed many orphan peptides to be assigned whenthey fell below threshold criteria
DNA microarrays
Total RNA was isolated from three independent culturesgrown under identical conditions as those used for proteinsamples RNA isolation synthesis of 33P-labelled cDNAprobes using E coli gene-specific primers (Sigma-Genosys)and hybridization to Panorama E coli gene arrays (Sigma-Genosys) was performed as described previously (Arnoldet al 2001) with the following modifications Before cultureswere harvested by centrifugation one-eighth volume of ice-cold ethanolphenol stop solution (5 water-saturated phenol(pH lt 70) in ethanol) was added to stop RNA degradation(Lin-Chao and Cohen 1991 Lee et al 2002) Before cDNAsynthesis RNA samples were treated with RQ1 RNAase-free DNAase (Promega) followed by two extractions withphenol and phenolCHCl3 ethanol precipitation and resus-pension in DEPC-treated deionized water For quantificationfilters were exposed to a phosphorimager screen which wasscanned at 100 micron resolution using a Fujix BAS2000phosphorimager
The Fujix BAS image files were analysed using VISAGE HDG
ANALYZER software (RM Lupton) running on a Sun Micro-systems ULTRA10 workstation The integrated intensity (II)of each spot is the sum of the value of each pixel within theboundaries of the spot minus the local background The IIvalues which are expressed in arbitrary units were exportedto MICROSOFT EXCEL for further analysis The 294 blank spotson the arrays were used to define a background expressionlevel (045 plusmn 034 arbitrary units) Based on the visual exam-ination of individual spots we concluded that II values gt18(background plus four SD) represented real signals This cut-off was used in identifying transcripts for the genes encodingthe proteins we observed
Proteins expressed in E coli 395
copy 2003 Blackwell Publishing Ltd Molecular Microbiology 47 383ndash396
Database generation
Output proteins from MS-FIT were indexed by SWISS-PROTID as the unique key and treated as text tables All manipu-lation of identified proteins was done using scripts written inPERL or MICROSOFT EXCEL Functional annotation was per-formed with the indexed list from the Riley laboratory (Serreset al 2001) Molecular weight and pI predictions were basedon the lsquopI Toolrsquo located on the Expasy web site (httpexpasyorgtoolspi_toolhtml) at the Swiss Institute of Bioin-formatics Lists of the proteins identified their frequency andexpression data E(g) and all other data manipulations andSWISS-2DPAGE comparisons are available as supplemen-tary material on-line (see Supplementary material)
Acknowledgements
The authors thank Drs Bill Russell and Zee-Yong Park fortheir advice and assistance with the mass spectrometry andLeonardo Marintildeo for assistance in constructing the databaseWe also thank Dr Larry Dangott and JoAnne Lewis at theTexas A amp M University Protein Chemistry Laboratory forperforming the two-dimensional electrophoresis and HayleeYowell for assistance with the DNA microarrays This workbenefited from useful discussions with many people includingTom Baldwin Dick Burgess Brian Chait David EisenbergSydney Kustu Matthias Mann and John Yates This work wassupported by NIH grants GM55154 to DAS and GM63652to JH
Supplementary material
The following material is available from httpwwwblackwellpublishingcomjournalssuppmatmolemole3294mmi3294smhtm
Lists of the proteins identified their frequency and expres-sion data E(g) and all other data manipulations and SWISS-2DPAGE comparisons
References
Alberts B (1998) The cell as a collection of proteinmachines preparing the next generation of molecular biol-ogists Cell 92 291ndash294
Arnold CN McElhanon J Lee A Leonhart R andSiegele DA (2001) Global analysis of Escherichia coligene expression during the acetate- induced acid toler-ance response J Bacteriol 183 2178ndash2186
Beadle GW (1945) Biochemical Genetics Chem Rev 3715ndash96
Blattner FR Plunkett III G Bloch CA Perna NTBurland V Riley M et al (1997) The complete genomesequence of Escherichia coli K-12 Science 277 1453ndash1462
Butt A Davison MD Smith GJ Young JA GaskellSJ Oliver SG and Beynon RJ (2001) Chromato-graphic separations as a prelude to two-dimensional elec-trophoresis in proteomics analysis Proteomics 1 42ndash53
Courcelle J Khodursky A Peter B Brown PO andHanawalt PC (2001) Comparative gene expression pro-
files following UV exposure in wild-type and SOS-deficientEscherichia coli Genetics 158 41ndash64
Edmondson RD and Russell DH (1996) Evaluation ofmatrix-assisted laser desorption ionization-time-of-flightmass measurement accuracy by using delayed extractionJ Am Soc Mass Spectrometry 7 995ndash1001
Eriksson J Chait BT and Fenyo D (2000) A statisticalbasis for testing the significance of mass spectrometricprotein identification results Anal Chem 72 999ndash1005
Gavin AC Bosche M Krause R Grandi P MarziochM Bauer A et al (2002) Functional organization of theyeast proteome by systematic analysis of protein com-plexes Nature 415 141ndash147
Gygi SP Corthals GL Zhang Y Rochon Y andAebersold R (2000) Evaluation of two-dimensional gelelectrophoresis-based proteome analysis technologyProc Natl Acad Sci USA 97 9390ndash9395
Ho Y Gruhler A Heilbut A Bader GD Moore LAdams SL et al (2002) Systematic identification of pro-tein complexes in Saccharomyces cerevisiae by massspectrometry Nature 415 180ndash183
Hoogland C Sanchez JC Tonella L Binz PA BairochA Hochstrasser DF and Appel RD (2000) The 1999SWISS-2DPAGE database update Nucleic Acids Res 28286ndash288
Ito T Chiba T Ozawa R Yoshida M Hattori M andSakaki Y (2001) A comprehensive two-hybrid analysis toexplore the yeast protein interactome Proc Natl Acad SciUSA 98 4569ndash4574
Jensen ON Podtelejnikov AV and Mann M (1997) Iden-tification of the components of simple protein mixtures byhigh-accuracy peptide mass mapping and databasesearching Anal Chem 69 4741ndash4750
Karlin S and Mrazek J (2000) Predicted highly expressedgenes of diverse prokaryotic genomes J Bacteriol 1825238ndash5250
Lee K Bernstein JA and Cohen SN (2002) RNase Gcomplementation of rne null mutation identifies functionalinterrelationships with RNase E in Escherichia coli MolMicrobiol 43 1445ndash1456
Lin-Chao S and Cohen SN (1991) The rate of processingand degradation of antisense RNAI regulates the replica-tion of ColE1-type plasmids in vivo Cell 65 1233ndash1242
Link AJ Robison K and Church GM (1997) Comparingthe predicted and observed properties of proteins encodedin the genome of Escherichia coli K-12 Electrophoresis18 1259ndash1313
Mann M Hojrup P and Roepstorff P (1993) Use of massspectrometric molecular weight information to identify pro-teins in sequence databases Biol Mass Spectrom 22338ndash345
Miller J (1972) Experiments in Molecular Genetics NewYork Cold Spring Harbor Laboratory Press
Nelson RW Nedelkov D and Tubbs KA (2000)Biosensor chip mass spectrometry a chip-based proteom-ics approach Electrophoresis 21 1155ndash1163
OrsquoFarrell PH (1975) High resolution two-dimensional elec-trophoresis of proteins J Biol Chem 250 4007ndash4021
Pappin DJC Hojrup P and Bleasby AJ (1993) Rapididentification of proteins by peptide-mass fingerprintingCurrent Biol 3 327ndash332
396 M M Champion et al
copy 2003 Blackwell Publishing Ltd Molecular Microbiology 47 383ndash396
Park ZY and Russell DH (2000) Thermal denaturationa useful technique in peptide mass mapping Anal Chem72 2667ndash2670
Rabilloud T (2002) Two-dimensional gel electrophoresis inproteomics old old fashioned but it still climbs up themountains Proteomics 2 3ndash10
Serres MH Gopal S Nahum LA Liang PGaasterland T and Riley M (2001) A functional updateof the Escherichia coli K-12 genome Genome Biol 2research00351ndash00357
Shevchenko A Wilm M Vorm O Jensen ONPodtelejnikov AV Neubauer G et al (1996) A strategyfor identifying gel-separated proteins in sequence data-bases by MS alone Biochem Soc Trans 24 893ndash896
Tao H Bausch C Richmond C Blattner FR and Con-way T (1999) Functional genomics expression analysisof Escherichia coli growing on minimal and rich media JBacteriol 181 6425ndash6440
Tonella L Hoogland C Binz PA Appel RDHochstrasser DF and Sanchez JC (2001) New per-spectives in the Escherichia coli proteome investigationProteomics 1 409ndash423
Tong AH Drees B Nardelli G Bader GD BrannettiB Castagnoli L et al (2002) A combined experimentaland computational strategy to define protein interactionnetworks for peptide recognition modules Science 295321ndash324
Uetz P Giot L Cagney G Mansfield TA Judson RSKnight JR et al (2000) A comprehensive analysis ofproteinndashprotein interactions in Saccharomyces cerevisiaeNature 403 623ndash627
VanBogelen RA Abshire KZ Pertsemlidis A ClarkRL and Neidhardt FC (1996) Gene-Protein Databaseof Escherichia coli K-12 Edition 6 In Escherichia Coli andSalmonella Typhimurium Cellular and Molecular BiologyVol 2 Neidhardt FC Curtiss RCI Ingraham JL
Lin ECC Low KB Magasanik B Reznikoff WSRiley M Schaechter M and Umbarger HE (eds)Washington DC American Society for Microbiology Presspp 2067ndash2117
VanBogelen RA Greis KD Blumenthal RM Tani THand Matthews RG (1999a) Mapping regulatory networksin microbial cells Trends Microbiol 7 320ndash328
VanBogelen RA Schiller EE Thomas JD andNeidhardt FC (1999b) Diagnosis of cellular states ofmicrobial organisms using proteomics Electrophoresis 202149ndash2159
Washburn MP and Yates III JR (2000) Analysis of themicrobial proteome Curr Opin Microbiol 3 292ndash297
Washburn MP Wolters D and Yates III JR (2001)Large-scale analysis of the yeast proteome by multidimen-sional protein identification technology Nat Biotechnol 19242ndash247
Wei Y Lee JM Richmond C Blattner FR RafalskiJA and LaRossa RA (2001) High-density microarray-mediated gene expression profiling of Escherichia coliJ Bacteriol 183 545ndash556
Wilkins MR Pasquali C Appel RD Ou K Golaz OSanchez JC et al (1996) From proteins to proteomeslarge scale protein identification by two-dimensional elec-trophoresis and amino acid analysis Biotechnology (NY)14 61ndash65
Wolters DA Washburn MP and Yates III JR(2001) Anautomated multidimensional protein identification tech-nology for shotgun proteomics Anal Chem 73 5683ndash5690
Yates JR III Speicher S Griffin PR and Hunkapiller T(1993) Peptide mass maps a highly informative approachto protein identification Anal Biochem 214 397ndash408
Zhu H Bilgin M Bangham R Hall D Casamayor ABertone P et al (2001) Global analysis of protein activitiesusing proteome chips Science 293 2101ndash2105

Proteins expressed in
E coli 385
copy 2003 Blackwell Publishing Ltd
Molecular Microbiology
47
383ndash396
contains such a high amount of protein we suspected that30S and 50S ribosomal subunits were in the ion-exchangeflow through Consistent with this possibility fractiona-tion of the flow-though via a Superose 12 size-exclusioncolumn revealed RNA and abundant proteins in the voidvolume consistent with the presence of a ribonucleopro-tein complex gt300 000 MW (data not shown) MALDI-MSand peptide mass fingerprinting identified several riboso-mal proteins in the ion-exchange flow-through refraction-ated by cation-exchange chromatography or SDS-PAGE(data not shown) Tandem mass spectrometry performedon trypsinized ion-exchange flow-through using a ThermoFinnigan LCQ Deca identified an additional 18 ribosomalproteins from peptide sequences (data not shown) and noattempts were made to identify the remaining proteins inthe ion-exchange flow-through in this study
Protein identification
The masses of tryptic peptides from digestion of eachfraction were determined by matrix-assisted laser desorp-tion ionization-delayed extraction reflectron-time-of-flightmass spectrometry (MALDI-DE-R-TOF) as described in
Experimental procedures
Figure 2 shows a MALDI-DE-R-TOF spectrum from one of the HIC fractions In totalnearly 2000 spectra were collected and annotated for theirpeptide masses The average mass error (mz) for eachfraction was 20 ppm with a standard deviation of20 ppm
Proteins in each fraction were identified by recursivematching of observed peptide masses from tryptic digeststo peptides predicted in the
E coli
genome as describedin
Experimental procedures
Table 1 summarizes the
number of proteins found in each lysate and the overlapbetween experiments Overall 2012 proteins were identi-fied corresponding to a non-redundant set of 310 geneproducts A full list of the protein identities and the frac-tions where they are found is available as supplementarymaterial (see
Supplementary material
)
Comparison with proteins observed by two-dimensional polyacrylamide gel electrophoresis (PAGE)
To test the validity of our protein assignments we com-pared the proteins identified in each AIX fraction to theproteins observed by two-dimensional PAGE Figure 3shows two-dimensional gels for the 19 fractions from thefirst dimension of chromatography To generate a list ofproteins we expect to see on each gel we merged assign-ments made from MS data of second dimension (HIC)fractions for each of the AIX fractions We then examinedthe appropriate two-dimensional gel for a spot migratingat the expected MW and pI As many proteins seen ontwo-dimensional gels migrate at positions that differ sig-nificantly from their predicted positions (Link
et al
1997)
Fig 2
Typical MALDI-DE-R-TOF spectrum for a protein digest from a second dimension column fraction MALDI-MS was performed on column fractions peak annotation was performed using
GRAMS
32 software and data were exported for peptide mass fingerprinting with
MS
-
FIT
The inset shows the well resolved mono-isotopic distribution of an individual tryptic fragment in this spectrum
Table 1
Protein identification totals from
Escherichia coli
lysates
AIX pH 750A 750B 875A 875B Total
Proteins IDrsquod 596 440 517 459 2012Unique IDs 138 167 143 156 310
Each pH was performed twice and totals are listed above The totalnumber of proteins identified includes the same proteins found inmultiple fractions unique IDrsquos are non-redundant totals for eachexperiment The total of 310 identifications is the total of all uniqueIDrsquos from all four proteomes with redundant entries removed
386
M M Champion
et al
copy 2003 Blackwell Publishing Ltd
Molecular Microbiology
47
383ndash396
we used published and indexed two-dimensional gel mapsof
E coli
(Hoogland
et al
2000 Tonella
et al
2001 seehttpexpasyorgch2d) to identify spots wherever possi-ble By combining predicted spot positions with knownspot migrations we can examine the correlation betweenour protein assignments and spots that can be identifiedon the two-dimensional gels
Figure 4 shows one example of an annotated two-dimensional gel In this case we can correlate 16 out ofthe 17 proteins we identify with spots on the two-
dimensional gel For this gel only one protein identifiedfrom the MS data GreA did not match a correspondingspot Figure 4 indicates the predicted and actual migrationof GreA as lsquoQrsquo and lsquoRrsquo respectively As a control werandomly selected bins of 30 proteins from our completelist of 310 identified proteins and attempted to matchthem to the positions of the observed spots for severalgels (data not shown) Only two of these randomlyselected proteins matched a spot at the appropriate MWand pI one of them was in the list of expected proteins
Fig 3
Two-dimensional gels of anion exchange (AIX) (SOURCE 15Q) fractions Approximately 300
m
g of protein from each AIX fraction was subjected to two-dimensional PAGE analysis and stained with Coomassie blue Isoelectric focusing was done using IPG strips with a non-linear pH 3ndash11 gradient Gels are numbered by the AIX fractions that were run
Proteins expressed in
E coli 387
copy 2003 Blackwell Publishing Ltd
Molecular Microbiology
47
383ndash396
identified in the corresponding fraction Thus the correla-tion between the proteins identified by MS and thoseobserved on the gel is much better than would beexpected by chance
In addition to the spots identified with MS correlationall of the gels resolved spots with identities that could notbe assigned from MS data for that fraction Some of theseare clearly multiple spots produced from the same proteinindeed some of these are annotated in databases of
Ecoli
proteins identified by two-dimensional gels In other
cases we can make assignments when the same spot isseen in gels from a series of contiguous fractions reflect-ing the changing abundance of each protein as it elutesfrom the ion exchange column Although the protein mightnot be identified by MS in one fraction it could be identi-fied in one or more of the contiguous fractions For exam-ple we can see the spot marked 1 in Fig 4 on gels fromAIX fractions 9ndash13 In AIX fraction 17 this spot is uniden-tified but in AIX fractions 18 20 21 and 22 it is identifiedas DnaK the major Hsp70 homologue in
E coli
We alsoobserve several spots such as spot 2 which could not beidentified unambiguously by either MALDI-MS or compar-ison with published gel annotations Out of the 219 uniqueproteins we identify at pH 750 we can assign spots onthe two-dimensional gels for 109 of them (57) Out ofthese 41 (38) were not previously annotated in theSWISS-2D database
Classification of proteins identified by function pIMW and abundance
To determine whether our method is biased toward oragainst particular kinds of proteins we compared thekinds of proteins found in
E coli
fractions to the differentgene classes defined by Blattner
et al and
the Riley lab-oratory web page (Fig 5) We find proteins predicted tobe in all of the functional classes but fewer proteins anno-tated as membrane proteins (transport cell structure) areseen than would be expected in a random sampling Thisis probably a consequence of how we prepared our sam-ples which requires that proteins remain soluble Werecover a greater fraction of proteins involved in metabo-
Fig 4
Comparison of proteins identified by LCLC MS and by two-dimensional gelsA Annotated two-dimensional gel of AIX (SOURCE15Q) fraction 17B Identities and predicted pI and MW for proteins expected to be in this fraction based on peptide mass fingerprinting of HIC fractions from AIX fraction 17 Spot ID Q highlighted in grey shows the predicted migration of GreA which is not visible in this gel Spots labelled 1 2 and R are discussed in the text
Fig 5
Classification of identified proteins by function Functional classification categories are from Blattner
et al
(1997) and Riley
et al
(httppcltamuedu) Open and filled bars show the percentage of the genome and the proteins identified in this study respectively assigned to each functional class Although MG1655 does not contain any plasmids extrachromosomal genes include prophage genes The Cryptic category includes 43 genes annotated as not expressed Our single lsquohitrsquo of a translated cryptic gene was
hofB
which is a putative transport protein
388
M M Champion
et al
copy 2003 Blackwell Publishing Ltd
Molecular Microbiology
47
383ndash396
lism which probably reflects abundance more than genefunction
We also examined the predicted pI and molecularweights of the proteins we identified and compared themto the distribution of pI and molecular weights of all of theannotated open reading frames (ORFs) in the
E coli
genome (Fig 6) For comparison we examined the distri-bution of proteins seen in the SWISS-2DPAGE databaseSWISS-2DPAGE identified very few proteins for pI rangesabove 70 The proteins we observe cover the whole pIrange observed for the genome with a slight bias toward
proteins with pIs between 4 and 6 This may reflect thepIs of proteins in the optimal separation range for theanion exchange step andor it could be a consequenceof a bias against very basic proteins which would tend tobe in the flow-through of the anion exchange column Only183 of the proteins we identified have a predicted pIabove 70 whereas the expected frequency for thegenome is 355 Two-dimensional gel data has anexpected bias toward proteins that resolve well by isoelec-tric focusing Only 77 of the SWISS-2D identificationshave a predicted pI above 70 Both methods mirror the
Fig 6
pI and molecular weight distributions for expressed proteomesA Distribution of the predicted pIsB Distribution of the predicted molecular weights Each panel shows indicated properties of the identified proteins for annotated ORFs from the genome sequence of MG1655 (inset) the proteins identified in this study (black) and the annotated SWISS-2D database for
E coli
(grey)
Each bar shows the number of proteins identified as a fraction of the number of annotated proteins from the complete genome in that pI or MW range
Proteins expressed in
E coli 389
copy 2003 Blackwell Publishing Ltd
Molecular Microbiology
47
383ndash396
genomic distribution in molecular weight and recover veryfew small peptidesproteins This partially reflects the factthat smaller proteins on average have fewer diagnostictryptic peptides than larger proteins As expected from thegel-independence of our methods we identify more low-molecular-weight proteins that do not resolve well on con-ventional SDS-PAGE
All proteome methods to identify expressed proteinsare biased toward those that are abundant As directmeasurements of abundance are not available for most
E coli
proteins we used two criteria to evaluate the cor-relation between our protein identifications and theactual abundance of the proteins First we examinedthe overlap between our identifications and the proteinsfor which synthetic rates have been measured by pulse-labelling and two-dimensional electrophoresis In
E coli
strain W3110 grown in minimal MOPS
+
glucose undersimilar growth phase conditions 51 proteins wereindexed by Neidhardt
et al
(VanBogelen
et al
1996)All 51 of these were identified in our study Assumingthat the quantification made from pulse-labelled cellsapproximates the steady-state levels of proteins fromtheir data we detect proteins with the lowest statedabundance of
ge
02 of total protein or about 500 cop-ies per cell This agrees well with reconstruction experi-ments we performed using known amounts of beta-galactosidase spiked into column fractions where weestimate sensitivity of about 250 copies per cell (datanot shown) However our absolute detection sensitivityis more limited by ion-suppression of more abundantpeptides and low-abundance proteins diluted over multi-
ple fractions than lack of ability to recover low-abundance proteins
We also examined the expression levels of each proteinpredicted from sequence analysis Karlin and Mraacutezek(2000) described an algorithm to predict abundancebased on comparing codon usage of a gene of interest tothat of several abundant protein classes including riboso-mal proteins chaperonins and translation factors Thepredicted expression level is expressed as an E(g) ratiowhere values greater than 1 are considered to be lsquopre-dicted highly expressedrsquo or (PHX) Figure 7 compares thedistribution of E(g) values for the proteins we identified tothe values for all of the annotated genes from
E coli
K-12 39 of our identifications fall within the PHX classwhereas only 8 of the proteins in the genome are pre-dicted to have an E(g) value gt 10 Proteins identified inthe SWISS-2DPAGE gel database have a similar distribu-tion as the proteins we identify by our method 45 of theSWISS-2D identifications have E(g) values greater than10 We seem to find more proteins from the lower expres-sion classes
Correlation with gene expression assayed by DNA microarrays
We examined the correlation between the 310 proteins weidentified and gene expression by performing microarrayexperiments to identify expressed mRNAs In total RNAprepared from three independent cultures grown underidentical conditions to those used for protein samples weobserved 3860 genes expressed at gt4 SD above the
Fig 7
Predicted expression levels for identified proteins E(g) value distributions were determined for the proteins identified in this study (black) and the entire annotated SWISS-2DPAGE for
E coli
(grey) and the MG1655 genome (inset) Vertical black lines indicate the cut-off for genes that are in the PHX class (predicted highly expressed)
390
M M Champion
et al
copy 2003 Blackwell Publishing Ltd
Molecular Microbiology
47
383ndash396
background in all three cultures In published array exper-iments expression of similar numbers of genes isobserved in exponential phase cultures of the same
Ecoli
strain also growing in minimal glucose medium (Tao
et al
1999 Courcelle
et al
2001 Wei
et al
2001)Hybridization was observed for 94 (290 out of 310) ofthe genes encoding the proteins we observed
Co-fractionation of native complexes
Because multiprotein complexes should remain intactthrough both chromatographic dimensions it may be pos-sible to identify protein complexes by analysing chromato-graphic cofractionation of subunits The general idea is toapply a lsquoguilt by associationrsquo analysis to our entire pro-teome snapshot In 10 cases gene names suggest thattwo or more cofractionating proteins share a commonfunction However simply examining the cofractionationover two columns is likely to generate a very high back-ground of false positives Proteins in the same fractioncould cofractionate because they are physically associ-ated or because they just happen to fractionate similarlyIn traditional purification protocols coincidental cofraction-ation is reduced by either increasing the specificity ofpurification steps (eg affinity chromatography) or addingmore steps to the purification (additional chromatographicsteps)
Instead of adding additional purification steps to theseparation we performed parallel separations in whichthe pH of the buffers used in the anion exchange step waschanged lsquopH scoutingrsquo is often used to optimize ionexchange separations and is based on how titration ofionizable surface groups on the protein alters their elutionpositions At either pH stable complexes will coelute fromthe anion exchange column whereas proteins in the samefraction by coincidence are free to migrate elsewheredepending on their individual chromatographic properties
This is illustrated by PheS and PheT the
a
and b sub-units respectively of an a2b2 heterotetrameric tRNAcharging enzyme PheS and PheT cofractionate at bothpH 750 and pH 875 At pH 750 eight other proteins arefound in the same fractions as PheS and PheT AccAAceE AsnS GltB GroES RfbB RpsA and Tig At pH of875 RplJ and Tig are found cofractionating with PheSand PheT As Tig is an abundant chaperonin it is likelythat its interaction with PheS and PheT is non-specific orcoincidental
By applying this analysis to all of the proteins we iden-tified 125 pairs of proteins that cofractionated at bothpH 750 and pH 875 (Table 2) These potential interac-tions include several like PheS and PheT that have beenpreviously described or that seem plausible from func-tional annotations This is clearly an underestimate of thestable complexes known complexes such as RNA core
polymerase a2bbcent and the ClpX ClpP E coli proteosomewere identified as cofractionating in only one sample oronly at one pH
Discussion
Identities of expressed proteins
Understanding the physiology of a cell involves knowingwhat proteins are expressed under a given set of circum-stances Although powerful methods for genome-wideexpression profiling based on examining mRNA arewidely available the correlation between mRNA and pro-tein levels is imperfect and direct examination of cellularprotein content is needed Although two-dimensionalgels have been applied to catalogue the expressed pro-teins in E coli for many years a variety of technicalissues prevent efficient identification of the genes thatencode the proteins seen as thousands of spots on two-dimensional gels For example protein recovery fromgels is often low samples are sometimes difficult todigest in situ and the loading capacity of gels limits theamount of material that can be recovered from spotsNevertheless combining multiple two-dimensional gelswith microsequencing or mass spectrometry has allowedthe identification of 273 proteins from E coli in mid-exponential phase growth in minimal glucose medium(Tonella et al 2001)
Above we describe a complementary gel-independentapproach based on multidimensional liquid chromatogra-phy Although the resolution of chromatography is muchlower than gel electrophoresis the samples obtained aremuch more efficiently processed for protein identificationusing the power of mass spectrometry to deconvolutecomplex mixtures of proteins found in chromatographicfractions Using this method we identified 310 proteinsexpressed in exponential-phase E coli growing in M9glucose media supplemented with amino acids (caseinhydrolysate)
Figure 8 compares our results with the SWISS-2DPAGE proteome from E coli (Hoogland et al 2000)Taken together our studies and the SWISS-2D PAGEidentify 467 proteins Out of these 116 were identified byboth studies whereas the native-state LCLC MSapproach described here identified 194 proteins that werenot previously annotated in the SWISS-2DPAGE data-base The SWISS-2DPAGE database identified 157 pro-teins that were not seen in our experiments Clearly thetwo methods complement each other to provide a morecomplete understanding of the protein content of E colithan either would alone
Although our primary reason for performing a parallelanalysis of column fractions by both peptide mass finger-printing and two-dimensional gels was to validate theidentifications made by the former the concordance
Proteins expressed in E coli 391
copy 2003 Blackwell Publishing Ltd Molecular Microbiology 47 383ndash396
between a predicted pIMW for a protein identified bymass fingerprinting and a spot on a gel also can be usedto assign an identity to the spot without having to recoverprotein or peptides from the gels In this way we assignedidentities to 41 spots that were previously unidentified inthe SWISS-2D database
Neither our method nor the combination of our methodwith two-dimensional gels is detecting all of the proteinswe expect to be present in the cell Although determiningthe number of expressed proteins from two-dimensionalgels requires making assumptions about the number ofspots per protein estimates of about 1000ndash3000 expre-ssed proteins are in reasonable agreement with the num-
ber of expressed E coli genes seen by microarrayexperiments (see above and A Khodursky personal com-munication) Why arenrsquot we identifying 70ndash90 of theproteins we expect to see Although some are likely to bein the fractions we were not able to process for examplemembrane proteins in the insoluble pellet and proteins inthe flow-through from the ion-exchange column these areunlikely to account for the bulk of the proteins we aremissing
Because MALDI-TOF is capable of exquisite sensitivitywith pure peptides the amount of material in our samplesis not limiting However peptides in mixtures compete forionization leading to suppression of the weaker signals
Table 2 Proteins that cofractionate at both pH 75 and pH 875
ACEA PNP DAPD PURT GREA GUAA PROA GLNS SUCC CYSKACKA FABI DAPD SSPA GREA PPA PROS FABI TALB PYRHACKA TSF DNAK LYSS GROS TIG PROS PURH THRC ASPCADK GAPA DNAK TYPA GUAA DAPA PROS TSF TIG ASNSAHPC GLNS DUT GND GUAA GREA PROS TUFA TIG GROSAHPC TRPC ENO GND GUAA PPA PURA GLTA TIG GUABALAS YADF ENO SERC GUAA YCHF PURA KBL TIG PHESARGD FUSA FABI ACKA GUAB TIG PURA TKTA TIG PHETARGG ISCS FABI PROS HISC YADF PURF ARGG TIG RFBBARGG PURF FABI PURH ILES ASPC PURF ISCS TIG RPLJARGH CLPP FABI TSF INFB LYSS PURF PNP TIG RPSAARGH FUSA FABI YADF ISCS ARGG PURF TYPA TKTA GLTAARGI GCVT FDX LPDA ISCS CLPP PURH FABI TKTA PURAAROA DAPD FUSA ARGD ISCS PNP PURH PROS TKTA TSFAROK CYSK FUSA ARGH ISCS PURF PURH TSF TKTA TUFAAROK PGI FUSA ASNS ISCS SLYD PURH TUFA TPIA GLYAASNS DAPA FUSA RPSA KBL ASPS PURH YADF TRPC AHPCASNS FUSA FUSA SPEE KBL GND PURN SSPA TRPC GLNSASNS GLTA FUSA VALS KBL PURA PURT DAPD TSF ACKAASNS KDGK GAPA ADK KDGK ASNS PYKF CYSK TSF FABIASNS RFBB GAPA GLYA KDGK DAPA PYKF GCVT TSF GLTAASNS RPLJ GAPA GPMA LPDA FDX PYKF NDK TSF PPIBASNS RPSA GCVT ARGI LYSS DNAK PYRH TALB TSF PROSASNS SERS GCVT ASPS LYSS INFB RFBB ASNS TSF PURHASNS TIG GCVT CYSK NDK DAPD RFBB RPSA TSF RPLIASNS TUFA GCVT NDK NDK GCVT RFBB TIG TSF TKTAASNS VALS GCVT PYKF NDK PYKF RPLI TSF TSF TUFAASPC DAPD GLNS AHPC NUSA PNP RPLJ ASNS TUFA ASNSASPC ILES GLNS PROA NUSA SLYD RPLJ TIG TUFA GLTAASPC THRC GLNS TRPC NUSA SPEB RPSA ASNS TUFA PROSASPS GCVT GLTA ASNS NUSA YICC RPSA FUSA TUFA PURHASPS GND GLTA PURA PGI AROK RPSA RFBB TUFA TKTAASPS KBL GLTA TKTA PGI CYSK RPSA SERS TUFA TSFBGLA YFBU GLTA TSF PHES PHET RPSA TIG TYPA DNAKCLPP ARGH GLTA TUFA PHES TIG RPSA VALS TYPA PNPCLPP ISCS GLTX GND PHET PHES RSUA VALS TYPA PURFCYSK AROK GLTX PPA PHET TIG SERC ENO VALS ASNSCYSK DAPD GLYA GAPA PNP ACEA SERC GLYA VALS FUSACYSK GCVT GLYA SERC PNP ISCS SERS ASNS VALS RPSACYSK PGI GLYA TPIA PNP NUSA SERS RPSA VALS RSUACYSK PYKF GLYA YIFE PNP PURF SLYD ISCS YADF ALASCYSK SUCC GND ASPS PNP SLYD SLYD NUSA YADF FABIDAPA ASNS GND DUT PNP TYPA SLYD PNP YADF HISCDAPA GUAA GND ENO PNP YICC SLYD SPEB YADF PURHDAPA KDGK GND GLTX PPA DAPA SLYD YICC YCHF GUAADAPA PPA GND GOR PPA GLTX SPEB NUSA YFBU BGLADAPD AROA GND KBL PPA GND SPEB SLYD YICC NUSADAPD ASPC GND PPA PPA GREA SPEE FUSA YICC PNPDAPD CYSK GOR GND PPA GUAA SSPA DAPD YICC SLYDDAPD NDK GPMA GAPA PPIB TSF SSPA PURN YIFE GLYA
The 125 pairs are shown as 250 entries each pair is listed with each partner first to aid finding proteins of interest
392 M M Champion et al
copy 2003 Blackwell Publishing Ltd Molecular Microbiology 47 383ndash396
The two chromatographic separations used here help toalleviate that problem relative to unfractionated extractswhere extremely abundant ribosomal proteins dominatethe spectra However the complexity of our mixtures evenafter chromatography limits the numbers of proteins wecan identify possibly due to incomplete digestion and theability to identify enough tryptic peptides from eachpolypeptide for an unambiguous assignment for someproteins
Recently high resolution separation of tryptic peptidesby multidimensional HPLC and mass spectrometric anal-ysis of peptides and peptide fragments produced by col-lision-induced dissociation have been used to provide alarge-scale analysis of the yeast proteome (Washburnet al 2001) Based on the published work on yeast thisapproach would be expected to identify many more pro-teins in either our column fractions or in tryptic digests ofthe unfractionated E coli lysates Although tandem MSapproaches yield greater numbers of identifications thelarge amounts of instrument time and computationalpower required to search the data make it impractical forrapid identification of proteins and interrogating multiplephysiologic states Performing our type of analysis on all380 fractions generated by the two chromatographicdimensions used here would involve prohibitive amountsof instrument time (weeks) with current technology
Protein complexes
Identification of expressed polypeptides as the productsof specific genes provides information about gene expres-sion but it is important to remember Benzerrsquos modificationof the lsquoone gene-one enzymersquo hypothesis of Beadle andTatum (Beadle 1945) to lsquoone cistron-one polypeptidersquoIndividual polypeptides are not equivalent to proteinsbecause proteins have quaternary structure and are often
composed of multiple subunits Indeed it is becomingclear that many intracellular processes are carried out bylarger multisubunit complexes than had been imaginedpreviously (Alberts 1998)
For these reasons major efforts are ongoing to map thelsquointeractomesrsquo in several organisms by a variety of tech-niques including large-scale two-hybrid studies (Uetzet al 2000 Ito et al 2001) protein chips (Nelson et al2000 Zhu et al 2001 Rabilloud 2002) and identificationof proteins that coimmunoprecipitate or co-purify with spe-cific baits for which there are antibodies (Tong et al 2002)or expressed versions with affinity tags (Gavin et al 2002Ho et al 2002) Although each of these methods is ableto identify a subset of the interactions known to occur ina proteome all of them identify only subsets of the previ-ously known interactions and presumably only subsetsof the unknown interactions they seek to find In additionto high fractions of false negatives each approach has itsown kinds of false positives
In our approach cofractionation through partial purifi-cation provides suggestive evidence for interactions Co-purification is the classical method of biochemical identi-fication of the subunits in a multisubunit protein whateverremains at a reasonable stoichiometry after an activity ispurified to homogeneity or near homogeneity is consid-ered to be a subunit Purification to homogeneity isimpractical on a genome-wide scale for two reasons firstbecause of the exponential increase in the scale of theexperiment with the addition of each fractionation andsecond because there is no universal assay by which tofollow the activities of all possible complexes
Instead we examined the concordance of cofractionat-ing proteins through parallel partial purifications In eachindividual preparation any given protein complex is con-taminated by many other proteins that co-purify coinciden-tally If we can use conditions that differentially change theelution of proteins then we should find a different subsetof the proteome contaminating the same complex Sub-units of stable complexes should stay together through allof our purification steps
As with other proteomics methods our method willinclude both false positives and false negatives Falsepositives will occur simply because some proteins willco-purify coincidentally over both of our fractionationschemes Here we used two different pHs in the ionexchange dimension as our different schemes Thechanges in elution position that we need to alter the spec-trum of contaminants seem to be larger for the weaklycharged proteins that elute from the column first than forthe more strongly anionic proteins that elute later at highersalt concentrations This is as expected these proteinsare probably enriched for acidic residues that do not titratesignificantly over the pH range we used In addition thetitration of ionizable groups in these proteins will have a
Fig 8 Venn diagram of overlap between E coli proteome projectsdata sets This diagram illustrates the distribution of the non-redundant protein assignments from each proteome and the overlap between the two The data sets together identify 467 non-redundant proteins from E coli
Proteins expressed in E coli 393
copy 2003 Blackwell Publishing Ltd Molecular Microbiology 47 383ndash396
smaller effect as a fraction of the total charge comparedwith the more weakly anionic proteins Despite these lim-itations the use of two pHs has already significantlyreduced the background of coincidental co-purificationOther fractionation schemes that are based on larger dif-ferences in the physical basis for separation may reducethe false positives further
False negatives have two major sources First we knowfrom the long history of protein biochemistry that somecomplexes will not survive the purification steps Cell lysisand fractionation involve significant dilution from intracel-lular conditions and the changes in salt and pH thataccompany each fractionation step as well as binding tothe chromatographic matrices per se will disrupt somecomplexes Second the low density of protein identifica-tions in each experiment will lead to missed identificationsof proteins that are successfully co-purified This is clearlyhappening in our experiments for some known complexesincluding RNA polymerase core Although we identify thea subunit of RNA polymerase in each of the fourexpressed proteomes and b and bcent are seen on gels inthe expected fractions diagnostic peptides for b and bcentwere only found in one out of four experiments
Despite these caveats 125 pairs of putative interactionsare detected in our experiments Several are either knownor plausible from the operon structure of the genesinvolved Further study will be needed to determine whichof the interactions represent real complexes
Future applications for E coli and other bacteria
The prospect of efficiently assigning gene identities toexpressed proteins provides renewed impetus to the anal-ysis of the expressed proteome as a function of bacterialphysiology It is important to note that the approachdescribed here is more accessible to small laboratoriesthan most other large-scale proteomics methodsalthough the process is clearly amenable to automationat many steps this study was carried out entirely withoutthe benefit of robotics Moreover unlike approachesbased on pre-digesting samples before separation theability to correlate identities made by native-state LCLCMS with quantification from two-dimensional gels whichare even more accessible to small-scale projects makesthe use of both methods much more powerful than thesum of the two
Similarly most large-scale interactome projects requireeither the construction of large numbers of strainsexpressing affinity-tagged proteins or the generation oflarge numbers of high-quality antibodies (note that poly-clonal antibodies often cross-react with many bacterialproteins) In contrast cofractionation can be done withany wild-type or mutant strain without further strainconstruction
The native-state LCLC MS approach should bebroadly applicable beyond E coli Proteomics based onpeptide mass fingerprinting is strongly dependent on theavailability of complete genome sequences proteins canonly be identified if they are in the database With therapid advances in the availability of complete genomesequences this is no longer a problem for many microor-ganisms The small size of bacterial genomes is a signif-icant factor in the success of the approach describedhere which used peptide mass fingerprinting alone toidentify several components in complex mixturesEriksson et al (2000) calculated the theoretical informa-tion content intrinsic to a peptide mass as a function ofthe genome size of the subject organism This study val-idates their theoretical calculations and shows that for agenome of the size and complexity of E coli peptidemass fingerprinting is able to successfully deconvolutemixtures of proteins generated by two dimensions ofchromatography
Experimental procedures
Escherichia coli lysates
Escherichia coli K-12 strain MG1655 (Blattner et al 1997)was grown overnight in M9 minimal medium (Miller 1972)containing glucose (04) uridine (50 mg ml-1) CaCl2(100 mm) MgSO4 (2 mM) Then 1 l cultures of the samemedium plus (01 wv) casamino acids (Difco) were inocu-lated with 10 ml of the overnight and grown to OD600 = 05Cells were harvested by centrifugation at 4000 g for 20 minin a JA-10 rotor (Beckman) and washed by resuspension in20 mM Tris HCl 20 mM NaCl 1 mM EDTA pH 875 andcentrifuged again The pellet was resuspended in 6 ml of thesame buffer and lysed by three passes through a chilled smallFrench-pressure cell at 20 000 PSI The lysate was centri-fuged at 15 000 g for 25cent in a JA-20 rotor The supernatantwas filtered through a non-binding 045 mm syringe filterbefore chromatography
Two-dimensional electrophoresis
First 300 mg of material from each anion exchange fractionwas diverted for analysis by two-dimensional polyacrylamidegel electrophoresis (PAGE) Two-dimensional PAGE wasperformed at the Protein Chemistry Laboratory at TexasA amp M University (httpwwwcalabresocompclusershtml)Briefly acetone-precipitated anion-exchange samples werere-swelled into Igphor immobilized gradient gels (14 cmpH 3ndash10 NL) (Pharmacia) and focused for 60ndash80 000 Volthours After reduction and exchange in SDS and DTT 12SDS gels (13 yen 16cm) were run in the second dimensionand stained with Gel Code Blue (Pierce) pIrsquos were deter-mined by fitting a non-linear standard curve from Pharmaciaas a function of gel length and adjusted to proteins withknown migration (eg DnaK GroEL) Apparent molecularweight was determined by a standard ladder applied to the
394 M M Champion et al
copy 2003 Blackwell Publishing Ltd Molecular Microbiology 47 383ndash396
leftmost portion of the gel after loading of the iso-electric gelstrip
Chromatography
For the liquid separation of clarified lysates the followingprocedure was used Approximately half of the cell-lysatewas applied to a 1 ml SOURCE 15Q (Pharmacia) resinpacked into a Waters AP-1 glass column pre-equilibrated in20 mM NaCl 30 mM Bis-Tris 15 mM Tris-HCl at a pH of 750or 875 A segmented gradient from 20 mM to 1 M NaCl wasrun over approximately 150 column volumes at a flow rate of3 ml min-1 on an AumlKTA Explorer HPLC Then 5 ml fractionswere collected from the anion-exchange separation For thesecond dimension each anion exchange fraction wasbrought up to 15 M (NH4)2SO4 100 mM KPO4 buffer atpH 70 This was applied to a 1 ml SOURCE 15Phe (Phar-macia) resin packed into a Waters AP-1 glass column pre-equilibrated in the same buffer A segmented gradient of15 M to 0 M (NH4)2SO4 was used over approximately 15column volumes Then 05 ml fractions were collecteddirectly into microdialysis cassettes (Pierce) and arrayed intofoam racks and exhaustively dialysed against 25 mM ammo-nium bicarbonate Denaturation digestion and MALDI wereperformed essentially as described elsewhere (Park andRussell 2000) Spectra were acquired on a Perseptive Bio-systems Voyager Elite XL TOF with a pulsed nitrogen laserat 337 nm The dried samples were resuspended in 100ndash270 ml of water mixed with MALDI matrix (35 mM a-cyano-4-hydroxy-cinnaminic acidMeOH) to a final matrix concentra-tion of ordf 10 mM and lt05 ml was spotted in duplicate onto35 mM overlayers of matrix in MeOH (Edmondson andRussell 1996) The samples were analysed in reflectronmode with 25 kV accelerating voltage a grid voltage of175 kV and a delayed extraction time of 150 ns Signals from100 laser shots were averaged per spectrum Two-point cal-ibration was performed using angiotensin I and neurotensin([M + H]+ = 12966853 [M + H]+ = 16729175) and a low-mass gate of 500 Da was used
Matrix-assisted laser desorption ionization-delayed extrac-tion reflectron-time-of-flight mass spectrometry (MALDI DE-R-TOF) spectra were taken from digests of each of the HICfractions from the HPLC separations Four separate lysatesprepared on different days were used to generate the pro-teome separations Two different pHs were utilized in theanion-exchange separation each performed twice Peakpicking was done by the operator using GRAMS32 softwareand peptide-mass fingerprinting was performed as describedbelow In total nearly 2000 spectra were annotated and anal-ysed for protein content by peptide mass fingerprinting
Peptide mass fingerprinting
Proteins were identified from the resulting peptides using MS-FIT AND PROTEIN PROSPECTOR The algorithm that generatesthe MOWSE score and the ranking for MS-FIT outputsis detailed in Pappin et al (1993) and (httpprospectorucsfedu) The utility of peptide-mass fingerprinting of singleproteins and more recently protein mixtures has beenshown and applied to multiple experimental systems (Mannet al 1993 Yates et al 1993 Shevchenko et al 1996
Jensen et al 1997) Peptide masses were searched againstthe most current SWISS-PROT database with no constraintson pI or MW No post-translational modifications wereallowed and species was limited to E coli A mass error of300 ppm was applied and one missed cleavage wasallowed For our case the following database matching cri-teria in MS-FIT were applied (i) The identified protein mustcome from the correct strain of E coli As multiple strains ofE coli have been sequenced false-positive protein matchesoften occur with different strains For example a commonfalse positive protein from bacterial searches of E coli is TraIa gene located on the Fcent plasmid and not present in the Ecoli strain we used K-12 MG1655 (ii) The sequence cover-age of the putative protein identified must be greater than25 (iii) The assigned peptides for any given identificationmust have mass accuracy error consistent in magnitude andtrend with other peptides assigned to the same protein Ouraverage mass error was 20 ppm with a standard deviationof 20 ppm and our error rarely exceeded 50 ppm TheMOWSE algorithm is insensitive to error regardless which iswhy a high (300 ppm) tolerance was allowed Multiple pro-teins could be identified in the same fraction by removingthe peptides assigned to the first protein and resubmitting theremaining peaks in a recursive process Identification of thesame protein in adjacent fractions in both separation dimen-sions allowed many orphan peptides to be assigned whenthey fell below threshold criteria
DNA microarrays
Total RNA was isolated from three independent culturesgrown under identical conditions as those used for proteinsamples RNA isolation synthesis of 33P-labelled cDNAprobes using E coli gene-specific primers (Sigma-Genosys)and hybridization to Panorama E coli gene arrays (Sigma-Genosys) was performed as described previously (Arnoldet al 2001) with the following modifications Before cultureswere harvested by centrifugation one-eighth volume of ice-cold ethanolphenol stop solution (5 water-saturated phenol(pH lt 70) in ethanol) was added to stop RNA degradation(Lin-Chao and Cohen 1991 Lee et al 2002) Before cDNAsynthesis RNA samples were treated with RQ1 RNAase-free DNAase (Promega) followed by two extractions withphenol and phenolCHCl3 ethanol precipitation and resus-pension in DEPC-treated deionized water For quantificationfilters were exposed to a phosphorimager screen which wasscanned at 100 micron resolution using a Fujix BAS2000phosphorimager
The Fujix BAS image files were analysed using VISAGE HDG
ANALYZER software (RM Lupton) running on a Sun Micro-systems ULTRA10 workstation The integrated intensity (II)of each spot is the sum of the value of each pixel within theboundaries of the spot minus the local background The IIvalues which are expressed in arbitrary units were exportedto MICROSOFT EXCEL for further analysis The 294 blank spotson the arrays were used to define a background expressionlevel (045 plusmn 034 arbitrary units) Based on the visual exam-ination of individual spots we concluded that II values gt18(background plus four SD) represented real signals This cut-off was used in identifying transcripts for the genes encodingthe proteins we observed
Proteins expressed in E coli 395
copy 2003 Blackwell Publishing Ltd Molecular Microbiology 47 383ndash396
Database generation
Output proteins from MS-FIT were indexed by SWISS-PROTID as the unique key and treated as text tables All manipu-lation of identified proteins was done using scripts written inPERL or MICROSOFT EXCEL Functional annotation was per-formed with the indexed list from the Riley laboratory (Serreset al 2001) Molecular weight and pI predictions were basedon the lsquopI Toolrsquo located on the Expasy web site (httpexpasyorgtoolspi_toolhtml) at the Swiss Institute of Bioin-formatics Lists of the proteins identified their frequency andexpression data E(g) and all other data manipulations andSWISS-2DPAGE comparisons are available as supplemen-tary material on-line (see Supplementary material)
Acknowledgements
The authors thank Drs Bill Russell and Zee-Yong Park fortheir advice and assistance with the mass spectrometry andLeonardo Marintildeo for assistance in constructing the databaseWe also thank Dr Larry Dangott and JoAnne Lewis at theTexas A amp M University Protein Chemistry Laboratory forperforming the two-dimensional electrophoresis and HayleeYowell for assistance with the DNA microarrays This workbenefited from useful discussions with many people includingTom Baldwin Dick Burgess Brian Chait David EisenbergSydney Kustu Matthias Mann and John Yates This work wassupported by NIH grants GM55154 to DAS and GM63652to JH
Supplementary material
The following material is available from httpwwwblackwellpublishingcomjournalssuppmatmolemole3294mmi3294smhtm
Lists of the proteins identified their frequency and expres-sion data E(g) and all other data manipulations and SWISS-2DPAGE comparisons
References
Alberts B (1998) The cell as a collection of proteinmachines preparing the next generation of molecular biol-ogists Cell 92 291ndash294
Arnold CN McElhanon J Lee A Leonhart R andSiegele DA (2001) Global analysis of Escherichia coligene expression during the acetate- induced acid toler-ance response J Bacteriol 183 2178ndash2186
Beadle GW (1945) Biochemical Genetics Chem Rev 3715ndash96
Blattner FR Plunkett III G Bloch CA Perna NTBurland V Riley M et al (1997) The complete genomesequence of Escherichia coli K-12 Science 277 1453ndash1462
Butt A Davison MD Smith GJ Young JA GaskellSJ Oliver SG and Beynon RJ (2001) Chromato-graphic separations as a prelude to two-dimensional elec-trophoresis in proteomics analysis Proteomics 1 42ndash53
Courcelle J Khodursky A Peter B Brown PO andHanawalt PC (2001) Comparative gene expression pro-
files following UV exposure in wild-type and SOS-deficientEscherichia coli Genetics 158 41ndash64
Edmondson RD and Russell DH (1996) Evaluation ofmatrix-assisted laser desorption ionization-time-of-flightmass measurement accuracy by using delayed extractionJ Am Soc Mass Spectrometry 7 995ndash1001
Eriksson J Chait BT and Fenyo D (2000) A statisticalbasis for testing the significance of mass spectrometricprotein identification results Anal Chem 72 999ndash1005
Gavin AC Bosche M Krause R Grandi P MarziochM Bauer A et al (2002) Functional organization of theyeast proteome by systematic analysis of protein com-plexes Nature 415 141ndash147
Gygi SP Corthals GL Zhang Y Rochon Y andAebersold R (2000) Evaluation of two-dimensional gelelectrophoresis-based proteome analysis technologyProc Natl Acad Sci USA 97 9390ndash9395
Ho Y Gruhler A Heilbut A Bader GD Moore LAdams SL et al (2002) Systematic identification of pro-tein complexes in Saccharomyces cerevisiae by massspectrometry Nature 415 180ndash183
Hoogland C Sanchez JC Tonella L Binz PA BairochA Hochstrasser DF and Appel RD (2000) The 1999SWISS-2DPAGE database update Nucleic Acids Res 28286ndash288
Ito T Chiba T Ozawa R Yoshida M Hattori M andSakaki Y (2001) A comprehensive two-hybrid analysis toexplore the yeast protein interactome Proc Natl Acad SciUSA 98 4569ndash4574
Jensen ON Podtelejnikov AV and Mann M (1997) Iden-tification of the components of simple protein mixtures byhigh-accuracy peptide mass mapping and databasesearching Anal Chem 69 4741ndash4750
Karlin S and Mrazek J (2000) Predicted highly expressedgenes of diverse prokaryotic genomes J Bacteriol 1825238ndash5250
Lee K Bernstein JA and Cohen SN (2002) RNase Gcomplementation of rne null mutation identifies functionalinterrelationships with RNase E in Escherichia coli MolMicrobiol 43 1445ndash1456
Lin-Chao S and Cohen SN (1991) The rate of processingand degradation of antisense RNAI regulates the replica-tion of ColE1-type plasmids in vivo Cell 65 1233ndash1242
Link AJ Robison K and Church GM (1997) Comparingthe predicted and observed properties of proteins encodedin the genome of Escherichia coli K-12 Electrophoresis18 1259ndash1313
Mann M Hojrup P and Roepstorff P (1993) Use of massspectrometric molecular weight information to identify pro-teins in sequence databases Biol Mass Spectrom 22338ndash345
Miller J (1972) Experiments in Molecular Genetics NewYork Cold Spring Harbor Laboratory Press
Nelson RW Nedelkov D and Tubbs KA (2000)Biosensor chip mass spectrometry a chip-based proteom-ics approach Electrophoresis 21 1155ndash1163
OrsquoFarrell PH (1975) High resolution two-dimensional elec-trophoresis of proteins J Biol Chem 250 4007ndash4021
Pappin DJC Hojrup P and Bleasby AJ (1993) Rapididentification of proteins by peptide-mass fingerprintingCurrent Biol 3 327ndash332
396 M M Champion et al
copy 2003 Blackwell Publishing Ltd Molecular Microbiology 47 383ndash396
Park ZY and Russell DH (2000) Thermal denaturationa useful technique in peptide mass mapping Anal Chem72 2667ndash2670
Rabilloud T (2002) Two-dimensional gel electrophoresis inproteomics old old fashioned but it still climbs up themountains Proteomics 2 3ndash10
Serres MH Gopal S Nahum LA Liang PGaasterland T and Riley M (2001) A functional updateof the Escherichia coli K-12 genome Genome Biol 2research00351ndash00357
Shevchenko A Wilm M Vorm O Jensen ONPodtelejnikov AV Neubauer G et al (1996) A strategyfor identifying gel-separated proteins in sequence data-bases by MS alone Biochem Soc Trans 24 893ndash896
Tao H Bausch C Richmond C Blattner FR and Con-way T (1999) Functional genomics expression analysisof Escherichia coli growing on minimal and rich media JBacteriol 181 6425ndash6440
Tonella L Hoogland C Binz PA Appel RDHochstrasser DF and Sanchez JC (2001) New per-spectives in the Escherichia coli proteome investigationProteomics 1 409ndash423
Tong AH Drees B Nardelli G Bader GD BrannettiB Castagnoli L et al (2002) A combined experimentaland computational strategy to define protein interactionnetworks for peptide recognition modules Science 295321ndash324
Uetz P Giot L Cagney G Mansfield TA Judson RSKnight JR et al (2000) A comprehensive analysis ofproteinndashprotein interactions in Saccharomyces cerevisiaeNature 403 623ndash627
VanBogelen RA Abshire KZ Pertsemlidis A ClarkRL and Neidhardt FC (1996) Gene-Protein Databaseof Escherichia coli K-12 Edition 6 In Escherichia Coli andSalmonella Typhimurium Cellular and Molecular BiologyVol 2 Neidhardt FC Curtiss RCI Ingraham JL
Lin ECC Low KB Magasanik B Reznikoff WSRiley M Schaechter M and Umbarger HE (eds)Washington DC American Society for Microbiology Presspp 2067ndash2117
VanBogelen RA Greis KD Blumenthal RM Tani THand Matthews RG (1999a) Mapping regulatory networksin microbial cells Trends Microbiol 7 320ndash328
VanBogelen RA Schiller EE Thomas JD andNeidhardt FC (1999b) Diagnosis of cellular states ofmicrobial organisms using proteomics Electrophoresis 202149ndash2159
Washburn MP and Yates III JR (2000) Analysis of themicrobial proteome Curr Opin Microbiol 3 292ndash297
Washburn MP Wolters D and Yates III JR (2001)Large-scale analysis of the yeast proteome by multidimen-sional protein identification technology Nat Biotechnol 19242ndash247
Wei Y Lee JM Richmond C Blattner FR RafalskiJA and LaRossa RA (2001) High-density microarray-mediated gene expression profiling of Escherichia coliJ Bacteriol 183 545ndash556
Wilkins MR Pasquali C Appel RD Ou K Golaz OSanchez JC et al (1996) From proteins to proteomeslarge scale protein identification by two-dimensional elec-trophoresis and amino acid analysis Biotechnology (NY)14 61ndash65
Wolters DA Washburn MP and Yates III JR(2001) Anautomated multidimensional protein identification tech-nology for shotgun proteomics Anal Chem 73 5683ndash5690
Yates JR III Speicher S Griffin PR and Hunkapiller T(1993) Peptide mass maps a highly informative approachto protein identification Anal Biochem 214 397ndash408
Zhu H Bilgin M Bangham R Hall D Casamayor ABertone P et al (2001) Global analysis of protein activitiesusing proteome chips Science 293 2101ndash2105

Proteins expressed in
E coli 387
copy 2003 Blackwell Publishing Ltd
Molecular Microbiology
47
383ndash396
identified in the corresponding fraction Thus the correla-tion between the proteins identified by MS and thoseobserved on the gel is much better than would beexpected by chance
In addition to the spots identified with MS correlationall of the gels resolved spots with identities that could notbe assigned from MS data for that fraction Some of theseare clearly multiple spots produced from the same proteinindeed some of these are annotated in databases of
Ecoli
proteins identified by two-dimensional gels In other
cases we can make assignments when the same spot isseen in gels from a series of contiguous fractions reflect-ing the changing abundance of each protein as it elutesfrom the ion exchange column Although the protein mightnot be identified by MS in one fraction it could be identi-fied in one or more of the contiguous fractions For exam-ple we can see the spot marked 1 in Fig 4 on gels fromAIX fractions 9ndash13 In AIX fraction 17 this spot is uniden-tified but in AIX fractions 18 20 21 and 22 it is identifiedas DnaK the major Hsp70 homologue in
E coli
We alsoobserve several spots such as spot 2 which could not beidentified unambiguously by either MALDI-MS or compar-ison with published gel annotations Out of the 219 uniqueproteins we identify at pH 750 we can assign spots onthe two-dimensional gels for 109 of them (57) Out ofthese 41 (38) were not previously annotated in theSWISS-2D database
Classification of proteins identified by function pIMW and abundance
To determine whether our method is biased toward oragainst particular kinds of proteins we compared thekinds of proteins found in
E coli
fractions to the differentgene classes defined by Blattner
et al and
the Riley lab-oratory web page (Fig 5) We find proteins predicted tobe in all of the functional classes but fewer proteins anno-tated as membrane proteins (transport cell structure) areseen than would be expected in a random sampling Thisis probably a consequence of how we prepared our sam-ples which requires that proteins remain soluble Werecover a greater fraction of proteins involved in metabo-
Fig 4
Comparison of proteins identified by LCLC MS and by two-dimensional gelsA Annotated two-dimensional gel of AIX (SOURCE15Q) fraction 17B Identities and predicted pI and MW for proteins expected to be in this fraction based on peptide mass fingerprinting of HIC fractions from AIX fraction 17 Spot ID Q highlighted in grey shows the predicted migration of GreA which is not visible in this gel Spots labelled 1 2 and R are discussed in the text
Fig 5
Classification of identified proteins by function Functional classification categories are from Blattner
et al
(1997) and Riley
et al
(httppcltamuedu) Open and filled bars show the percentage of the genome and the proteins identified in this study respectively assigned to each functional class Although MG1655 does not contain any plasmids extrachromosomal genes include prophage genes The Cryptic category includes 43 genes annotated as not expressed Our single lsquohitrsquo of a translated cryptic gene was
hofB
which is a putative transport protein
388
M M Champion
et al
copy 2003 Blackwell Publishing Ltd
Molecular Microbiology
47
383ndash396
lism which probably reflects abundance more than genefunction
We also examined the predicted pI and molecularweights of the proteins we identified and compared themto the distribution of pI and molecular weights of all of theannotated open reading frames (ORFs) in the
E coli
genome (Fig 6) For comparison we examined the distri-bution of proteins seen in the SWISS-2DPAGE databaseSWISS-2DPAGE identified very few proteins for pI rangesabove 70 The proteins we observe cover the whole pIrange observed for the genome with a slight bias toward
proteins with pIs between 4 and 6 This may reflect thepIs of proteins in the optimal separation range for theanion exchange step andor it could be a consequenceof a bias against very basic proteins which would tend tobe in the flow-through of the anion exchange column Only183 of the proteins we identified have a predicted pIabove 70 whereas the expected frequency for thegenome is 355 Two-dimensional gel data has anexpected bias toward proteins that resolve well by isoelec-tric focusing Only 77 of the SWISS-2D identificationshave a predicted pI above 70 Both methods mirror the
Fig 6
pI and molecular weight distributions for expressed proteomesA Distribution of the predicted pIsB Distribution of the predicted molecular weights Each panel shows indicated properties of the identified proteins for annotated ORFs from the genome sequence of MG1655 (inset) the proteins identified in this study (black) and the annotated SWISS-2D database for
E coli
(grey)
Each bar shows the number of proteins identified as a fraction of the number of annotated proteins from the complete genome in that pI or MW range
Proteins expressed in
E coli 389
copy 2003 Blackwell Publishing Ltd
Molecular Microbiology
47
383ndash396
genomic distribution in molecular weight and recover veryfew small peptidesproteins This partially reflects the factthat smaller proteins on average have fewer diagnostictryptic peptides than larger proteins As expected from thegel-independence of our methods we identify more low-molecular-weight proteins that do not resolve well on con-ventional SDS-PAGE
All proteome methods to identify expressed proteinsare biased toward those that are abundant As directmeasurements of abundance are not available for most
E coli
proteins we used two criteria to evaluate the cor-relation between our protein identifications and theactual abundance of the proteins First we examinedthe overlap between our identifications and the proteinsfor which synthetic rates have been measured by pulse-labelling and two-dimensional electrophoresis In
E coli
strain W3110 grown in minimal MOPS
+
glucose undersimilar growth phase conditions 51 proteins wereindexed by Neidhardt
et al
(VanBogelen
et al
1996)All 51 of these were identified in our study Assumingthat the quantification made from pulse-labelled cellsapproximates the steady-state levels of proteins fromtheir data we detect proteins with the lowest statedabundance of
ge
02 of total protein or about 500 cop-ies per cell This agrees well with reconstruction experi-ments we performed using known amounts of beta-galactosidase spiked into column fractions where weestimate sensitivity of about 250 copies per cell (datanot shown) However our absolute detection sensitivityis more limited by ion-suppression of more abundantpeptides and low-abundance proteins diluted over multi-
ple fractions than lack of ability to recover low-abundance proteins
We also examined the expression levels of each proteinpredicted from sequence analysis Karlin and Mraacutezek(2000) described an algorithm to predict abundancebased on comparing codon usage of a gene of interest tothat of several abundant protein classes including riboso-mal proteins chaperonins and translation factors Thepredicted expression level is expressed as an E(g) ratiowhere values greater than 1 are considered to be lsquopre-dicted highly expressedrsquo or (PHX) Figure 7 compares thedistribution of E(g) values for the proteins we identified tothe values for all of the annotated genes from
E coli
K-12 39 of our identifications fall within the PHX classwhereas only 8 of the proteins in the genome are pre-dicted to have an E(g) value gt 10 Proteins identified inthe SWISS-2DPAGE gel database have a similar distribu-tion as the proteins we identify by our method 45 of theSWISS-2D identifications have E(g) values greater than10 We seem to find more proteins from the lower expres-sion classes
Correlation with gene expression assayed by DNA microarrays
We examined the correlation between the 310 proteins weidentified and gene expression by performing microarrayexperiments to identify expressed mRNAs In total RNAprepared from three independent cultures grown underidentical conditions to those used for protein samples weobserved 3860 genes expressed at gt4 SD above the
Fig 7
Predicted expression levels for identified proteins E(g) value distributions were determined for the proteins identified in this study (black) and the entire annotated SWISS-2DPAGE for
E coli
(grey) and the MG1655 genome (inset) Vertical black lines indicate the cut-off for genes that are in the PHX class (predicted highly expressed)
390
M M Champion
et al
copy 2003 Blackwell Publishing Ltd
Molecular Microbiology
47
383ndash396
background in all three cultures In published array exper-iments expression of similar numbers of genes isobserved in exponential phase cultures of the same
Ecoli
strain also growing in minimal glucose medium (Tao
et al
1999 Courcelle
et al
2001 Wei
et al
2001)Hybridization was observed for 94 (290 out of 310) ofthe genes encoding the proteins we observed
Co-fractionation of native complexes
Because multiprotein complexes should remain intactthrough both chromatographic dimensions it may be pos-sible to identify protein complexes by analysing chromato-graphic cofractionation of subunits The general idea is toapply a lsquoguilt by associationrsquo analysis to our entire pro-teome snapshot In 10 cases gene names suggest thattwo or more cofractionating proteins share a commonfunction However simply examining the cofractionationover two columns is likely to generate a very high back-ground of false positives Proteins in the same fractioncould cofractionate because they are physically associ-ated or because they just happen to fractionate similarlyIn traditional purification protocols coincidental cofraction-ation is reduced by either increasing the specificity ofpurification steps (eg affinity chromatography) or addingmore steps to the purification (additional chromatographicsteps)
Instead of adding additional purification steps to theseparation we performed parallel separations in whichthe pH of the buffers used in the anion exchange step waschanged lsquopH scoutingrsquo is often used to optimize ionexchange separations and is based on how titration ofionizable surface groups on the protein alters their elutionpositions At either pH stable complexes will coelute fromthe anion exchange column whereas proteins in the samefraction by coincidence are free to migrate elsewheredepending on their individual chromatographic properties
This is illustrated by PheS and PheT the
a
and b sub-units respectively of an a2b2 heterotetrameric tRNAcharging enzyme PheS and PheT cofractionate at bothpH 750 and pH 875 At pH 750 eight other proteins arefound in the same fractions as PheS and PheT AccAAceE AsnS GltB GroES RfbB RpsA and Tig At pH of875 RplJ and Tig are found cofractionating with PheSand PheT As Tig is an abundant chaperonin it is likelythat its interaction with PheS and PheT is non-specific orcoincidental
By applying this analysis to all of the proteins we iden-tified 125 pairs of proteins that cofractionated at bothpH 750 and pH 875 (Table 2) These potential interac-tions include several like PheS and PheT that have beenpreviously described or that seem plausible from func-tional annotations This is clearly an underestimate of thestable complexes known complexes such as RNA core
polymerase a2bbcent and the ClpX ClpP E coli proteosomewere identified as cofractionating in only one sample oronly at one pH
Discussion
Identities of expressed proteins
Understanding the physiology of a cell involves knowingwhat proteins are expressed under a given set of circum-stances Although powerful methods for genome-wideexpression profiling based on examining mRNA arewidely available the correlation between mRNA and pro-tein levels is imperfect and direct examination of cellularprotein content is needed Although two-dimensionalgels have been applied to catalogue the expressed pro-teins in E coli for many years a variety of technicalissues prevent efficient identification of the genes thatencode the proteins seen as thousands of spots on two-dimensional gels For example protein recovery fromgels is often low samples are sometimes difficult todigest in situ and the loading capacity of gels limits theamount of material that can be recovered from spotsNevertheless combining multiple two-dimensional gelswith microsequencing or mass spectrometry has allowedthe identification of 273 proteins from E coli in mid-exponential phase growth in minimal glucose medium(Tonella et al 2001)
Above we describe a complementary gel-independentapproach based on multidimensional liquid chromatogra-phy Although the resolution of chromatography is muchlower than gel electrophoresis the samples obtained aremuch more efficiently processed for protein identificationusing the power of mass spectrometry to deconvolutecomplex mixtures of proteins found in chromatographicfractions Using this method we identified 310 proteinsexpressed in exponential-phase E coli growing in M9glucose media supplemented with amino acids (caseinhydrolysate)
Figure 8 compares our results with the SWISS-2DPAGE proteome from E coli (Hoogland et al 2000)Taken together our studies and the SWISS-2D PAGEidentify 467 proteins Out of these 116 were identified byboth studies whereas the native-state LCLC MSapproach described here identified 194 proteins that werenot previously annotated in the SWISS-2DPAGE data-base The SWISS-2DPAGE database identified 157 pro-teins that were not seen in our experiments Clearly thetwo methods complement each other to provide a morecomplete understanding of the protein content of E colithan either would alone
Although our primary reason for performing a parallelanalysis of column fractions by both peptide mass finger-printing and two-dimensional gels was to validate theidentifications made by the former the concordance
Proteins expressed in E coli 391
copy 2003 Blackwell Publishing Ltd Molecular Microbiology 47 383ndash396
between a predicted pIMW for a protein identified bymass fingerprinting and a spot on a gel also can be usedto assign an identity to the spot without having to recoverprotein or peptides from the gels In this way we assignedidentities to 41 spots that were previously unidentified inthe SWISS-2D database
Neither our method nor the combination of our methodwith two-dimensional gels is detecting all of the proteinswe expect to be present in the cell Although determiningthe number of expressed proteins from two-dimensionalgels requires making assumptions about the number ofspots per protein estimates of about 1000ndash3000 expre-ssed proteins are in reasonable agreement with the num-
ber of expressed E coli genes seen by microarrayexperiments (see above and A Khodursky personal com-munication) Why arenrsquot we identifying 70ndash90 of theproteins we expect to see Although some are likely to bein the fractions we were not able to process for examplemembrane proteins in the insoluble pellet and proteins inthe flow-through from the ion-exchange column these areunlikely to account for the bulk of the proteins we aremissing
Because MALDI-TOF is capable of exquisite sensitivitywith pure peptides the amount of material in our samplesis not limiting However peptides in mixtures compete forionization leading to suppression of the weaker signals
Table 2 Proteins that cofractionate at both pH 75 and pH 875
ACEA PNP DAPD PURT GREA GUAA PROA GLNS SUCC CYSKACKA FABI DAPD SSPA GREA PPA PROS FABI TALB PYRHACKA TSF DNAK LYSS GROS TIG PROS PURH THRC ASPCADK GAPA DNAK TYPA GUAA DAPA PROS TSF TIG ASNSAHPC GLNS DUT GND GUAA GREA PROS TUFA TIG GROSAHPC TRPC ENO GND GUAA PPA PURA GLTA TIG GUABALAS YADF ENO SERC GUAA YCHF PURA KBL TIG PHESARGD FUSA FABI ACKA GUAB TIG PURA TKTA TIG PHETARGG ISCS FABI PROS HISC YADF PURF ARGG TIG RFBBARGG PURF FABI PURH ILES ASPC PURF ISCS TIG RPLJARGH CLPP FABI TSF INFB LYSS PURF PNP TIG RPSAARGH FUSA FABI YADF ISCS ARGG PURF TYPA TKTA GLTAARGI GCVT FDX LPDA ISCS CLPP PURH FABI TKTA PURAAROA DAPD FUSA ARGD ISCS PNP PURH PROS TKTA TSFAROK CYSK FUSA ARGH ISCS PURF PURH TSF TKTA TUFAAROK PGI FUSA ASNS ISCS SLYD PURH TUFA TPIA GLYAASNS DAPA FUSA RPSA KBL ASPS PURH YADF TRPC AHPCASNS FUSA FUSA SPEE KBL GND PURN SSPA TRPC GLNSASNS GLTA FUSA VALS KBL PURA PURT DAPD TSF ACKAASNS KDGK GAPA ADK KDGK ASNS PYKF CYSK TSF FABIASNS RFBB GAPA GLYA KDGK DAPA PYKF GCVT TSF GLTAASNS RPLJ GAPA GPMA LPDA FDX PYKF NDK TSF PPIBASNS RPSA GCVT ARGI LYSS DNAK PYRH TALB TSF PROSASNS SERS GCVT ASPS LYSS INFB RFBB ASNS TSF PURHASNS TIG GCVT CYSK NDK DAPD RFBB RPSA TSF RPLIASNS TUFA GCVT NDK NDK GCVT RFBB TIG TSF TKTAASNS VALS GCVT PYKF NDK PYKF RPLI TSF TSF TUFAASPC DAPD GLNS AHPC NUSA PNP RPLJ ASNS TUFA ASNSASPC ILES GLNS PROA NUSA SLYD RPLJ TIG TUFA GLTAASPC THRC GLNS TRPC NUSA SPEB RPSA ASNS TUFA PROSASPS GCVT GLTA ASNS NUSA YICC RPSA FUSA TUFA PURHASPS GND GLTA PURA PGI AROK RPSA RFBB TUFA TKTAASPS KBL GLTA TKTA PGI CYSK RPSA SERS TUFA TSFBGLA YFBU GLTA TSF PHES PHET RPSA TIG TYPA DNAKCLPP ARGH GLTA TUFA PHES TIG RPSA VALS TYPA PNPCLPP ISCS GLTX GND PHET PHES RSUA VALS TYPA PURFCYSK AROK GLTX PPA PHET TIG SERC ENO VALS ASNSCYSK DAPD GLYA GAPA PNP ACEA SERC GLYA VALS FUSACYSK GCVT GLYA SERC PNP ISCS SERS ASNS VALS RPSACYSK PGI GLYA TPIA PNP NUSA SERS RPSA VALS RSUACYSK PYKF GLYA YIFE PNP PURF SLYD ISCS YADF ALASCYSK SUCC GND ASPS PNP SLYD SLYD NUSA YADF FABIDAPA ASNS GND DUT PNP TYPA SLYD PNP YADF HISCDAPA GUAA GND ENO PNP YICC SLYD SPEB YADF PURHDAPA KDGK GND GLTX PPA DAPA SLYD YICC YCHF GUAADAPA PPA GND GOR PPA GLTX SPEB NUSA YFBU BGLADAPD AROA GND KBL PPA GND SPEB SLYD YICC NUSADAPD ASPC GND PPA PPA GREA SPEE FUSA YICC PNPDAPD CYSK GOR GND PPA GUAA SSPA DAPD YICC SLYDDAPD NDK GPMA GAPA PPIB TSF SSPA PURN YIFE GLYA
The 125 pairs are shown as 250 entries each pair is listed with each partner first to aid finding proteins of interest
392 M M Champion et al
copy 2003 Blackwell Publishing Ltd Molecular Microbiology 47 383ndash396
The two chromatographic separations used here help toalleviate that problem relative to unfractionated extractswhere extremely abundant ribosomal proteins dominatethe spectra However the complexity of our mixtures evenafter chromatography limits the numbers of proteins wecan identify possibly due to incomplete digestion and theability to identify enough tryptic peptides from eachpolypeptide for an unambiguous assignment for someproteins
Recently high resolution separation of tryptic peptidesby multidimensional HPLC and mass spectrometric anal-ysis of peptides and peptide fragments produced by col-lision-induced dissociation have been used to provide alarge-scale analysis of the yeast proteome (Washburnet al 2001) Based on the published work on yeast thisapproach would be expected to identify many more pro-teins in either our column fractions or in tryptic digests ofthe unfractionated E coli lysates Although tandem MSapproaches yield greater numbers of identifications thelarge amounts of instrument time and computationalpower required to search the data make it impractical forrapid identification of proteins and interrogating multiplephysiologic states Performing our type of analysis on all380 fractions generated by the two chromatographicdimensions used here would involve prohibitive amountsof instrument time (weeks) with current technology
Protein complexes
Identification of expressed polypeptides as the productsof specific genes provides information about gene expres-sion but it is important to remember Benzerrsquos modificationof the lsquoone gene-one enzymersquo hypothesis of Beadle andTatum (Beadle 1945) to lsquoone cistron-one polypeptidersquoIndividual polypeptides are not equivalent to proteinsbecause proteins have quaternary structure and are often
composed of multiple subunits Indeed it is becomingclear that many intracellular processes are carried out bylarger multisubunit complexes than had been imaginedpreviously (Alberts 1998)
For these reasons major efforts are ongoing to map thelsquointeractomesrsquo in several organisms by a variety of tech-niques including large-scale two-hybrid studies (Uetzet al 2000 Ito et al 2001) protein chips (Nelson et al2000 Zhu et al 2001 Rabilloud 2002) and identificationof proteins that coimmunoprecipitate or co-purify with spe-cific baits for which there are antibodies (Tong et al 2002)or expressed versions with affinity tags (Gavin et al 2002Ho et al 2002) Although each of these methods is ableto identify a subset of the interactions known to occur ina proteome all of them identify only subsets of the previ-ously known interactions and presumably only subsetsof the unknown interactions they seek to find In additionto high fractions of false negatives each approach has itsown kinds of false positives
In our approach cofractionation through partial purifi-cation provides suggestive evidence for interactions Co-purification is the classical method of biochemical identi-fication of the subunits in a multisubunit protein whateverremains at a reasonable stoichiometry after an activity ispurified to homogeneity or near homogeneity is consid-ered to be a subunit Purification to homogeneity isimpractical on a genome-wide scale for two reasons firstbecause of the exponential increase in the scale of theexperiment with the addition of each fractionation andsecond because there is no universal assay by which tofollow the activities of all possible complexes
Instead we examined the concordance of cofractionat-ing proteins through parallel partial purifications In eachindividual preparation any given protein complex is con-taminated by many other proteins that co-purify coinciden-tally If we can use conditions that differentially change theelution of proteins then we should find a different subsetof the proteome contaminating the same complex Sub-units of stable complexes should stay together through allof our purification steps
As with other proteomics methods our method willinclude both false positives and false negatives Falsepositives will occur simply because some proteins willco-purify coincidentally over both of our fractionationschemes Here we used two different pHs in the ionexchange dimension as our different schemes Thechanges in elution position that we need to alter the spec-trum of contaminants seem to be larger for the weaklycharged proteins that elute from the column first than forthe more strongly anionic proteins that elute later at highersalt concentrations This is as expected these proteinsare probably enriched for acidic residues that do not titratesignificantly over the pH range we used In addition thetitration of ionizable groups in these proteins will have a
Fig 8 Venn diagram of overlap between E coli proteome projectsdata sets This diagram illustrates the distribution of the non-redundant protein assignments from each proteome and the overlap between the two The data sets together identify 467 non-redundant proteins from E coli
Proteins expressed in E coli 393
copy 2003 Blackwell Publishing Ltd Molecular Microbiology 47 383ndash396
smaller effect as a fraction of the total charge comparedwith the more weakly anionic proteins Despite these lim-itations the use of two pHs has already significantlyreduced the background of coincidental co-purificationOther fractionation schemes that are based on larger dif-ferences in the physical basis for separation may reducethe false positives further
False negatives have two major sources First we knowfrom the long history of protein biochemistry that somecomplexes will not survive the purification steps Cell lysisand fractionation involve significant dilution from intracel-lular conditions and the changes in salt and pH thataccompany each fractionation step as well as binding tothe chromatographic matrices per se will disrupt somecomplexes Second the low density of protein identifica-tions in each experiment will lead to missed identificationsof proteins that are successfully co-purified This is clearlyhappening in our experiments for some known complexesincluding RNA polymerase core Although we identify thea subunit of RNA polymerase in each of the fourexpressed proteomes and b and bcent are seen on gels inthe expected fractions diagnostic peptides for b and bcentwere only found in one out of four experiments
Despite these caveats 125 pairs of putative interactionsare detected in our experiments Several are either knownor plausible from the operon structure of the genesinvolved Further study will be needed to determine whichof the interactions represent real complexes
Future applications for E coli and other bacteria
The prospect of efficiently assigning gene identities toexpressed proteins provides renewed impetus to the anal-ysis of the expressed proteome as a function of bacterialphysiology It is important to note that the approachdescribed here is more accessible to small laboratoriesthan most other large-scale proteomics methodsalthough the process is clearly amenable to automationat many steps this study was carried out entirely withoutthe benefit of robotics Moreover unlike approachesbased on pre-digesting samples before separation theability to correlate identities made by native-state LCLCMS with quantification from two-dimensional gels whichare even more accessible to small-scale projects makesthe use of both methods much more powerful than thesum of the two
Similarly most large-scale interactome projects requireeither the construction of large numbers of strainsexpressing affinity-tagged proteins or the generation oflarge numbers of high-quality antibodies (note that poly-clonal antibodies often cross-react with many bacterialproteins) In contrast cofractionation can be done withany wild-type or mutant strain without further strainconstruction
The native-state LCLC MS approach should bebroadly applicable beyond E coli Proteomics based onpeptide mass fingerprinting is strongly dependent on theavailability of complete genome sequences proteins canonly be identified if they are in the database With therapid advances in the availability of complete genomesequences this is no longer a problem for many microor-ganisms The small size of bacterial genomes is a signif-icant factor in the success of the approach describedhere which used peptide mass fingerprinting alone toidentify several components in complex mixturesEriksson et al (2000) calculated the theoretical informa-tion content intrinsic to a peptide mass as a function ofthe genome size of the subject organism This study val-idates their theoretical calculations and shows that for agenome of the size and complexity of E coli peptidemass fingerprinting is able to successfully deconvolutemixtures of proteins generated by two dimensions ofchromatography
Experimental procedures
Escherichia coli lysates
Escherichia coli K-12 strain MG1655 (Blattner et al 1997)was grown overnight in M9 minimal medium (Miller 1972)containing glucose (04) uridine (50 mg ml-1) CaCl2(100 mm) MgSO4 (2 mM) Then 1 l cultures of the samemedium plus (01 wv) casamino acids (Difco) were inocu-lated with 10 ml of the overnight and grown to OD600 = 05Cells were harvested by centrifugation at 4000 g for 20 minin a JA-10 rotor (Beckman) and washed by resuspension in20 mM Tris HCl 20 mM NaCl 1 mM EDTA pH 875 andcentrifuged again The pellet was resuspended in 6 ml of thesame buffer and lysed by three passes through a chilled smallFrench-pressure cell at 20 000 PSI The lysate was centri-fuged at 15 000 g for 25cent in a JA-20 rotor The supernatantwas filtered through a non-binding 045 mm syringe filterbefore chromatography
Two-dimensional electrophoresis
First 300 mg of material from each anion exchange fractionwas diverted for analysis by two-dimensional polyacrylamidegel electrophoresis (PAGE) Two-dimensional PAGE wasperformed at the Protein Chemistry Laboratory at TexasA amp M University (httpwwwcalabresocompclusershtml)Briefly acetone-precipitated anion-exchange samples werere-swelled into Igphor immobilized gradient gels (14 cmpH 3ndash10 NL) (Pharmacia) and focused for 60ndash80 000 Volthours After reduction and exchange in SDS and DTT 12SDS gels (13 yen 16cm) were run in the second dimensionand stained with Gel Code Blue (Pierce) pIrsquos were deter-mined by fitting a non-linear standard curve from Pharmaciaas a function of gel length and adjusted to proteins withknown migration (eg DnaK GroEL) Apparent molecularweight was determined by a standard ladder applied to the
394 M M Champion et al
copy 2003 Blackwell Publishing Ltd Molecular Microbiology 47 383ndash396
leftmost portion of the gel after loading of the iso-electric gelstrip
Chromatography
For the liquid separation of clarified lysates the followingprocedure was used Approximately half of the cell-lysatewas applied to a 1 ml SOURCE 15Q (Pharmacia) resinpacked into a Waters AP-1 glass column pre-equilibrated in20 mM NaCl 30 mM Bis-Tris 15 mM Tris-HCl at a pH of 750or 875 A segmented gradient from 20 mM to 1 M NaCl wasrun over approximately 150 column volumes at a flow rate of3 ml min-1 on an AumlKTA Explorer HPLC Then 5 ml fractionswere collected from the anion-exchange separation For thesecond dimension each anion exchange fraction wasbrought up to 15 M (NH4)2SO4 100 mM KPO4 buffer atpH 70 This was applied to a 1 ml SOURCE 15Phe (Phar-macia) resin packed into a Waters AP-1 glass column pre-equilibrated in the same buffer A segmented gradient of15 M to 0 M (NH4)2SO4 was used over approximately 15column volumes Then 05 ml fractions were collecteddirectly into microdialysis cassettes (Pierce) and arrayed intofoam racks and exhaustively dialysed against 25 mM ammo-nium bicarbonate Denaturation digestion and MALDI wereperformed essentially as described elsewhere (Park andRussell 2000) Spectra were acquired on a Perseptive Bio-systems Voyager Elite XL TOF with a pulsed nitrogen laserat 337 nm The dried samples were resuspended in 100ndash270 ml of water mixed with MALDI matrix (35 mM a-cyano-4-hydroxy-cinnaminic acidMeOH) to a final matrix concentra-tion of ordf 10 mM and lt05 ml was spotted in duplicate onto35 mM overlayers of matrix in MeOH (Edmondson andRussell 1996) The samples were analysed in reflectronmode with 25 kV accelerating voltage a grid voltage of175 kV and a delayed extraction time of 150 ns Signals from100 laser shots were averaged per spectrum Two-point cal-ibration was performed using angiotensin I and neurotensin([M + H]+ = 12966853 [M + H]+ = 16729175) and a low-mass gate of 500 Da was used
Matrix-assisted laser desorption ionization-delayed extrac-tion reflectron-time-of-flight mass spectrometry (MALDI DE-R-TOF) spectra were taken from digests of each of the HICfractions from the HPLC separations Four separate lysatesprepared on different days were used to generate the pro-teome separations Two different pHs were utilized in theanion-exchange separation each performed twice Peakpicking was done by the operator using GRAMS32 softwareand peptide-mass fingerprinting was performed as describedbelow In total nearly 2000 spectra were annotated and anal-ysed for protein content by peptide mass fingerprinting
Peptide mass fingerprinting
Proteins were identified from the resulting peptides using MS-FIT AND PROTEIN PROSPECTOR The algorithm that generatesthe MOWSE score and the ranking for MS-FIT outputsis detailed in Pappin et al (1993) and (httpprospectorucsfedu) The utility of peptide-mass fingerprinting of singleproteins and more recently protein mixtures has beenshown and applied to multiple experimental systems (Mannet al 1993 Yates et al 1993 Shevchenko et al 1996
Jensen et al 1997) Peptide masses were searched againstthe most current SWISS-PROT database with no constraintson pI or MW No post-translational modifications wereallowed and species was limited to E coli A mass error of300 ppm was applied and one missed cleavage wasallowed For our case the following database matching cri-teria in MS-FIT were applied (i) The identified protein mustcome from the correct strain of E coli As multiple strains ofE coli have been sequenced false-positive protein matchesoften occur with different strains For example a commonfalse positive protein from bacterial searches of E coli is TraIa gene located on the Fcent plasmid and not present in the Ecoli strain we used K-12 MG1655 (ii) The sequence cover-age of the putative protein identified must be greater than25 (iii) The assigned peptides for any given identificationmust have mass accuracy error consistent in magnitude andtrend with other peptides assigned to the same protein Ouraverage mass error was 20 ppm with a standard deviationof 20 ppm and our error rarely exceeded 50 ppm TheMOWSE algorithm is insensitive to error regardless which iswhy a high (300 ppm) tolerance was allowed Multiple pro-teins could be identified in the same fraction by removingthe peptides assigned to the first protein and resubmitting theremaining peaks in a recursive process Identification of thesame protein in adjacent fractions in both separation dimen-sions allowed many orphan peptides to be assigned whenthey fell below threshold criteria
DNA microarrays
Total RNA was isolated from three independent culturesgrown under identical conditions as those used for proteinsamples RNA isolation synthesis of 33P-labelled cDNAprobes using E coli gene-specific primers (Sigma-Genosys)and hybridization to Panorama E coli gene arrays (Sigma-Genosys) was performed as described previously (Arnoldet al 2001) with the following modifications Before cultureswere harvested by centrifugation one-eighth volume of ice-cold ethanolphenol stop solution (5 water-saturated phenol(pH lt 70) in ethanol) was added to stop RNA degradation(Lin-Chao and Cohen 1991 Lee et al 2002) Before cDNAsynthesis RNA samples were treated with RQ1 RNAase-free DNAase (Promega) followed by two extractions withphenol and phenolCHCl3 ethanol precipitation and resus-pension in DEPC-treated deionized water For quantificationfilters were exposed to a phosphorimager screen which wasscanned at 100 micron resolution using a Fujix BAS2000phosphorimager
The Fujix BAS image files were analysed using VISAGE HDG
ANALYZER software (RM Lupton) running on a Sun Micro-systems ULTRA10 workstation The integrated intensity (II)of each spot is the sum of the value of each pixel within theboundaries of the spot minus the local background The IIvalues which are expressed in arbitrary units were exportedto MICROSOFT EXCEL for further analysis The 294 blank spotson the arrays were used to define a background expressionlevel (045 plusmn 034 arbitrary units) Based on the visual exam-ination of individual spots we concluded that II values gt18(background plus four SD) represented real signals This cut-off was used in identifying transcripts for the genes encodingthe proteins we observed
Proteins expressed in E coli 395
copy 2003 Blackwell Publishing Ltd Molecular Microbiology 47 383ndash396
Database generation
Output proteins from MS-FIT were indexed by SWISS-PROTID as the unique key and treated as text tables All manipu-lation of identified proteins was done using scripts written inPERL or MICROSOFT EXCEL Functional annotation was per-formed with the indexed list from the Riley laboratory (Serreset al 2001) Molecular weight and pI predictions were basedon the lsquopI Toolrsquo located on the Expasy web site (httpexpasyorgtoolspi_toolhtml) at the Swiss Institute of Bioin-formatics Lists of the proteins identified their frequency andexpression data E(g) and all other data manipulations andSWISS-2DPAGE comparisons are available as supplemen-tary material on-line (see Supplementary material)
Acknowledgements
The authors thank Drs Bill Russell and Zee-Yong Park fortheir advice and assistance with the mass spectrometry andLeonardo Marintildeo for assistance in constructing the databaseWe also thank Dr Larry Dangott and JoAnne Lewis at theTexas A amp M University Protein Chemistry Laboratory forperforming the two-dimensional electrophoresis and HayleeYowell for assistance with the DNA microarrays This workbenefited from useful discussions with many people includingTom Baldwin Dick Burgess Brian Chait David EisenbergSydney Kustu Matthias Mann and John Yates This work wassupported by NIH grants GM55154 to DAS and GM63652to JH
Supplementary material
The following material is available from httpwwwblackwellpublishingcomjournalssuppmatmolemole3294mmi3294smhtm
Lists of the proteins identified their frequency and expres-sion data E(g) and all other data manipulations and SWISS-2DPAGE comparisons
References
Alberts B (1998) The cell as a collection of proteinmachines preparing the next generation of molecular biol-ogists Cell 92 291ndash294
Arnold CN McElhanon J Lee A Leonhart R andSiegele DA (2001) Global analysis of Escherichia coligene expression during the acetate- induced acid toler-ance response J Bacteriol 183 2178ndash2186
Beadle GW (1945) Biochemical Genetics Chem Rev 3715ndash96
Blattner FR Plunkett III G Bloch CA Perna NTBurland V Riley M et al (1997) The complete genomesequence of Escherichia coli K-12 Science 277 1453ndash1462
Butt A Davison MD Smith GJ Young JA GaskellSJ Oliver SG and Beynon RJ (2001) Chromato-graphic separations as a prelude to two-dimensional elec-trophoresis in proteomics analysis Proteomics 1 42ndash53
Courcelle J Khodursky A Peter B Brown PO andHanawalt PC (2001) Comparative gene expression pro-
files following UV exposure in wild-type and SOS-deficientEscherichia coli Genetics 158 41ndash64
Edmondson RD and Russell DH (1996) Evaluation ofmatrix-assisted laser desorption ionization-time-of-flightmass measurement accuracy by using delayed extractionJ Am Soc Mass Spectrometry 7 995ndash1001
Eriksson J Chait BT and Fenyo D (2000) A statisticalbasis for testing the significance of mass spectrometricprotein identification results Anal Chem 72 999ndash1005
Gavin AC Bosche M Krause R Grandi P MarziochM Bauer A et al (2002) Functional organization of theyeast proteome by systematic analysis of protein com-plexes Nature 415 141ndash147
Gygi SP Corthals GL Zhang Y Rochon Y andAebersold R (2000) Evaluation of two-dimensional gelelectrophoresis-based proteome analysis technologyProc Natl Acad Sci USA 97 9390ndash9395
Ho Y Gruhler A Heilbut A Bader GD Moore LAdams SL et al (2002) Systematic identification of pro-tein complexes in Saccharomyces cerevisiae by massspectrometry Nature 415 180ndash183
Hoogland C Sanchez JC Tonella L Binz PA BairochA Hochstrasser DF and Appel RD (2000) The 1999SWISS-2DPAGE database update Nucleic Acids Res 28286ndash288
Ito T Chiba T Ozawa R Yoshida M Hattori M andSakaki Y (2001) A comprehensive two-hybrid analysis toexplore the yeast protein interactome Proc Natl Acad SciUSA 98 4569ndash4574
Jensen ON Podtelejnikov AV and Mann M (1997) Iden-tification of the components of simple protein mixtures byhigh-accuracy peptide mass mapping and databasesearching Anal Chem 69 4741ndash4750
Karlin S and Mrazek J (2000) Predicted highly expressedgenes of diverse prokaryotic genomes J Bacteriol 1825238ndash5250
Lee K Bernstein JA and Cohen SN (2002) RNase Gcomplementation of rne null mutation identifies functionalinterrelationships with RNase E in Escherichia coli MolMicrobiol 43 1445ndash1456
Lin-Chao S and Cohen SN (1991) The rate of processingand degradation of antisense RNAI regulates the replica-tion of ColE1-type plasmids in vivo Cell 65 1233ndash1242
Link AJ Robison K and Church GM (1997) Comparingthe predicted and observed properties of proteins encodedin the genome of Escherichia coli K-12 Electrophoresis18 1259ndash1313
Mann M Hojrup P and Roepstorff P (1993) Use of massspectrometric molecular weight information to identify pro-teins in sequence databases Biol Mass Spectrom 22338ndash345
Miller J (1972) Experiments in Molecular Genetics NewYork Cold Spring Harbor Laboratory Press
Nelson RW Nedelkov D and Tubbs KA (2000)Biosensor chip mass spectrometry a chip-based proteom-ics approach Electrophoresis 21 1155ndash1163
OrsquoFarrell PH (1975) High resolution two-dimensional elec-trophoresis of proteins J Biol Chem 250 4007ndash4021
Pappin DJC Hojrup P and Bleasby AJ (1993) Rapididentification of proteins by peptide-mass fingerprintingCurrent Biol 3 327ndash332
396 M M Champion et al
copy 2003 Blackwell Publishing Ltd Molecular Microbiology 47 383ndash396
Park ZY and Russell DH (2000) Thermal denaturationa useful technique in peptide mass mapping Anal Chem72 2667ndash2670
Rabilloud T (2002) Two-dimensional gel electrophoresis inproteomics old old fashioned but it still climbs up themountains Proteomics 2 3ndash10
Serres MH Gopal S Nahum LA Liang PGaasterland T and Riley M (2001) A functional updateof the Escherichia coli K-12 genome Genome Biol 2research00351ndash00357
Shevchenko A Wilm M Vorm O Jensen ONPodtelejnikov AV Neubauer G et al (1996) A strategyfor identifying gel-separated proteins in sequence data-bases by MS alone Biochem Soc Trans 24 893ndash896
Tao H Bausch C Richmond C Blattner FR and Con-way T (1999) Functional genomics expression analysisof Escherichia coli growing on minimal and rich media JBacteriol 181 6425ndash6440
Tonella L Hoogland C Binz PA Appel RDHochstrasser DF and Sanchez JC (2001) New per-spectives in the Escherichia coli proteome investigationProteomics 1 409ndash423
Tong AH Drees B Nardelli G Bader GD BrannettiB Castagnoli L et al (2002) A combined experimentaland computational strategy to define protein interactionnetworks for peptide recognition modules Science 295321ndash324
Uetz P Giot L Cagney G Mansfield TA Judson RSKnight JR et al (2000) A comprehensive analysis ofproteinndashprotein interactions in Saccharomyces cerevisiaeNature 403 623ndash627
VanBogelen RA Abshire KZ Pertsemlidis A ClarkRL and Neidhardt FC (1996) Gene-Protein Databaseof Escherichia coli K-12 Edition 6 In Escherichia Coli andSalmonella Typhimurium Cellular and Molecular BiologyVol 2 Neidhardt FC Curtiss RCI Ingraham JL
Lin ECC Low KB Magasanik B Reznikoff WSRiley M Schaechter M and Umbarger HE (eds)Washington DC American Society for Microbiology Presspp 2067ndash2117
VanBogelen RA Greis KD Blumenthal RM Tani THand Matthews RG (1999a) Mapping regulatory networksin microbial cells Trends Microbiol 7 320ndash328
VanBogelen RA Schiller EE Thomas JD andNeidhardt FC (1999b) Diagnosis of cellular states ofmicrobial organisms using proteomics Electrophoresis 202149ndash2159
Washburn MP and Yates III JR (2000) Analysis of themicrobial proteome Curr Opin Microbiol 3 292ndash297
Washburn MP Wolters D and Yates III JR (2001)Large-scale analysis of the yeast proteome by multidimen-sional protein identification technology Nat Biotechnol 19242ndash247
Wei Y Lee JM Richmond C Blattner FR RafalskiJA and LaRossa RA (2001) High-density microarray-mediated gene expression profiling of Escherichia coliJ Bacteriol 183 545ndash556
Wilkins MR Pasquali C Appel RD Ou K Golaz OSanchez JC et al (1996) From proteins to proteomeslarge scale protein identification by two-dimensional elec-trophoresis and amino acid analysis Biotechnology (NY)14 61ndash65
Wolters DA Washburn MP and Yates III JR(2001) Anautomated multidimensional protein identification tech-nology for shotgun proteomics Anal Chem 73 5683ndash5690
Yates JR III Speicher S Griffin PR and Hunkapiller T(1993) Peptide mass maps a highly informative approachto protein identification Anal Biochem 214 397ndash408
Zhu H Bilgin M Bangham R Hall D Casamayor ABertone P et al (2001) Global analysis of protein activitiesusing proteome chips Science 293 2101ndash2105