Embed Size (px)
Citation preview
CHAPTER 4
Quantitative Proteomics by MassSpectrometry
JACOB GALAN, ANTON ILIUK, and W. ANDY TAO
4.1 INTRODUCTION
Modern drug research and development depend heavily on the ability to target and
analyze compounds of interest on a large scale from a wide variety of complex
sources. The ability to identify the proteins and other molecules that change as a
consequence of the progression of an illness or a disorder is the vital first step in drug
development. This stage is often referred to as biomarker discovery. Biomarkers are
biologically relevant proteins, peptides, and other molecules that exhibit variation
from homeostasis during the onset or progression of a certain disease [1,2].
Commonly, their deviations from the steady state include differential expression of
the proteins and/or their post-translational modifications (PTMs), including phos-
phorylation and glycosylation (PTMs are discussed in Chapter 12 by Tsarbopolous
and Bazoti in this volume). Identification of such biomarkers not only can provide
molecules necessary for disease prognosis and diagnosis but also can offer potential
therapeutic targets.
Many approaches have been utilized to study the changes in protein expression
or its PTM levels. The usual techniques such as Western blot or 32P labeling are
regarded as efficient and robust methods that provide important protein information
with good reproducibility. They are mainly used, however, on a small scale provided
that we know or can speculate reasonably on the identity of the protein. Systems
biology emerges as a new direction for biomarker discovery, allowing identification
of multiple markers for a single disease and providing unequaled specificity for
diagnosis. Mass spectrometry (MS)-based proteomics is a choice for large-scale and
unbiased analyses. Presently, improvements in the accuracy, sensitivity, and
throughput capabilities have advanced mass spectrometry to be a major tool for
Protein and Peptide Mass Spectrometry in Drug Discovery, Edited by Michael L. Gross, Guodong Chen,and Birendra N. Pramanik.� 2012 John Wiley & Sons, Inc. Published 2012 by John Wiley & Sons, Inc.
101

complex sample analyses [3]. Although the identification of proteins from a mixture
has become routine, the mass spectrometer itself does not allow confident bio-
marker recognition because there are serious issue for quantitation. For this reason
quantitative proteomics has been identified as an important subject and activity and
efforts to develop it further are on the rise. A successful outcome will provide
reliable means to obtain relative or absolute quantitation of proteins in various
complex samples.
The implementation of quantitative proteomics usingMS originally utilized stable
isotope dilution, where an isotopically labeled isotopomer is used as an internal
standard for quantification. The isotope dilution method has been a “workhorse” in
modern pharmaceutical research [4–6]. To allow for accurate measurements of small
molecules by using MS, references or standards are required to be added to the
unknown sample. Such materials should have the same chemical properties as, but be
distinguishable from, the analytes. A reference or a standard is commonly prepared by
incorporating stable isotopes (e.g., 13C, 15N, and 2H), allowing for mass discrimina-
tion of target analytes from the standards. The reference molecules are spiked or
“diluted” with the sample before theMS analysis. QuantitativeMS-based proteomics
uses essentially the same concept to analyze two or more proteomic samples, but
unlike much target compound analysis, there is a need to measure a large number of
proteins in one experiment.
A number of attempts have been made to discover disease markers, motivating the
development of a variety of methods for quantitative proteomics [7–9]. Although the
overall strategy is promising and good progress has been made, major obstacles still
remain, particularly whenworking with a complex sample. A common difficulty with
working on the whole-cell level is the wide dynamic range of protein abundances
contained in the cell, spanning over 6 to 8 orders of magnitude [10]. This severely
reduces the efficiency of biomarker identification, primarily because the typical
candidates are present in relatively low concentrations and are, therefore, masked by
the highly abundant “housekeeping” proteins [2]. This dilemma is even more
noticeable for serum and plasma samples, which can exhibit close to 12 orders of
magnitude in protein abundances [11]. Some setbacks that are typically encountered
during quantitative proteomic analyses include incomplete quantitative label incor-
poration, variation between samples during preparation, and insufficient bioinfor-
matics tools. Several recently developed quantitation methods attempt to address
these issues.
This chapter is intended to provide a general description of the approaches for
quantitative proteomics and an in-depth catalog of the currently available methods.
Each method has its own unique advantages and shortcomings, depending on its
characteristics and application.We do not believe that there is a general method that is
best for quantitation, but that rather each analytical approach has advantages with
respect to the others depending on the sample specifications and desired results.
Therefore selection of the most effective quantitation technique for a specific set of
experiments requires care and may even be critical for success. Our goal is to provide
the necessary information on major quantitation approaches that should aid in this
selection process.
102 QUANTITATIVE PROTEOMICS BY MASS SPECTROMETRY
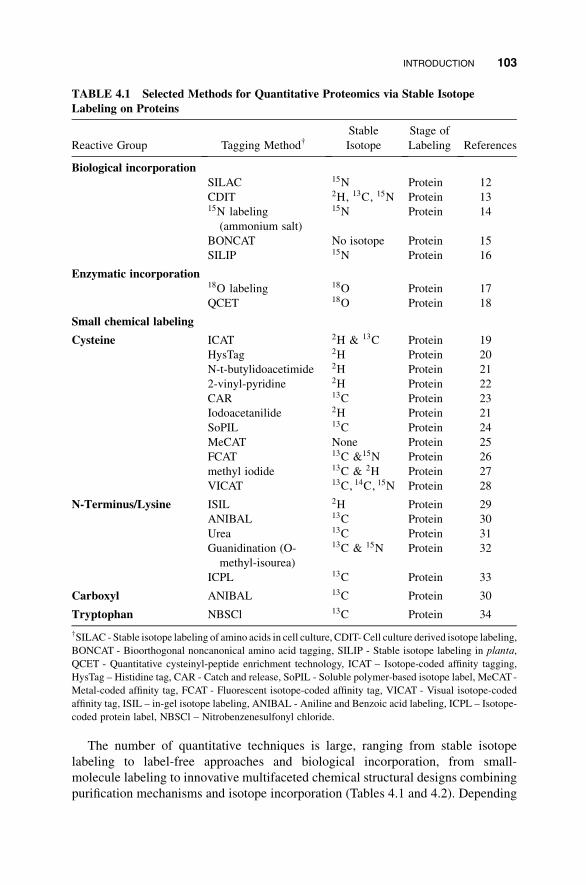
The number of quantitative techniques is large, ranging from stable isotope
labeling to label-free approaches and biological incorporation, from small-
molecule labeling to innovative multifaceted chemical structural designs combining
purification mechanisms and isotope incorporation (Tables 4.1 and 4.2). Depending
TABLE 4.1 Selected Methods for Quantitative Proteomics via Stable Isotope
Labeling on Proteins
Reactive Group Tagging Method†Stable
Isotope
Stage of
Labeling References
Biological incorporation
SILAC 15N Protein 12
CDIT 2H, 13C, 15N Protein 1315N labeling
(ammonium salt)
15N Protein 14
BONCAT No isotope Protein 15
SILIP 15N Protein 16
Enzymatic incorporation18O labeling 18O Protein 17
QCET 18O Protein 18
Small chemical labeling
Cysteine ICAT 2H & 13C Protein 19
HysTag 2H Protein 20
N-t-butylidoacetimide 2H Protein 21
2-vinyl-pyridine 2H Protein 22
CAR 13C Protein 23
Iodoacetanilide 2H Protein 21
SoPIL 13C Protein 24
MeCAT None Protein 25
FCAT 13C &15N Protein 26
methyl iodide 13C & 2H Protein 27
VICAT 13C, 14C, 15N Protein 28
N-Terminus/Lysine ISIL 2H Protein 29
ANIBAL 13C Protein 30
Urea 13C Protein 31
Guanidination (O-
methyl-isourea)
13C & 15N Protein 32
ICPL 13C Protein 33
Carboxyl ANIBAL 13C Protein 30
Tryptophan NBSCl 13C Protein 34
†SILAC - Stable isotope labeling of amino acids in cell culture, CDIT- Cell culture derived isotope labeling,
BONCAT - Bioorthogonal noncanonical amino acid tagging, SILIP - Stable isotope labeling in planta,
QCET - Quantitative cysteinyl-peptide enrichment technology, ICAT – Isotope-coded affinity tagging,
HysTag – Histidine tag, CAR - Catch and release, SoPIL - Soluble polymer-based isotope label, MeCAT-
Metal-coded affinity tag, FCAT - Fluorescent isotope-coded affinity tag, VICAT - Visual isotope-coded
affinity tag, ISIL – in-gel isotope labeling, ANIBAL - Aniline and Benzoic acid labeling, ICPL – Isotope-
coded protein label, NBSCl – Nitrobenzenesulfonyl chloride.
INTRODUCTION 103

TABLE 4.2 Selected Reagents for Stable Isotope-based Quantitative Proteomics on
Peptides
Reactive Group Tagging Method†Stable
Isotope
Stage of
Labeling References
Small chemical labeling:
Cysteine ICAT 2H & 13C Peptide 19
SoPIL 13C Peptide 24
FCAT 13C, 15N Peptide 26
ALICE 2H Peptide 35
Solid-phase tagging 13C Peptide 36
ICROC 2H Peptide 37
N-Terminus/Lysine TMT 13C Peptide 38
Succinic anhydride 2H Peptide 39
N-acetoxysuccinamide 2H Peptide 40
Acetic anhydride 2H Peptide 41
Propionic anhydride 2H Peptide 42
Nic-NHS 13C Peptide 43
iTRAQ 13C Peptide 44
MCAT No isotope Peptide 45
Guanidination
(O-methyl-isourea)
13C & 15N Peptide 32
Phenyl isocyanate 2H Peptide 46
QUEST No isotope Peptide 47
SPITC 13C Peptide 48
2-Methoxy 4,5-
1H-imidazole
2H Peptide 49
Formaldyde 2H Peptide 50
N-terminal stable-
isotope labeling of
tryptic peptides
(pentafluorophenyl-
4-anilino-4-
oxbutanoate)
2H or 13C Peptide 51
Tyrosine CILAT 13C Peptide 52
Carboxyl Methyl esterification 2H Peptide 53
Ethyl esterification 2H Peptide 54
Glycosyl QUIBL 13C Glycan 55
Methyl iodide 13C Glycan 56
†ICAT - Isotope coded affinity tagging, SoPIL - Soluble polymer-based isotope label, FCAT - Fluorescent
isotope-coded affinity tag, ALICE - Acid-labile isotope-coded extractant, ICROC – Isotope-coded
reduction off column, TMT- Tandem mass tag, Nic-NHS - Nicotinoyloxy-succinamide, iTRAQ - Isobaric
tag for relative and absolute quantitation, MCAT - Mass-coded abundance tagging, QUEST- Quantitation
using enhanced sequence tags, SPITC - Differential isotope-coded N-terminal protein sulphonation,
CILAT - Cleavable isobaric labeled affinity tag, QUIBL - Quantitation by isobaric labeling.
104 QUANTITATIVE PROTEOMICS BY MASS SPECTROMETRY

on the stage in which the stable isotope is introduced, we group them as follows:
(1) in-cell incorporation of isotope label, (2) introduction of label at the protein
level, (3) introduction of label at the peptide level, and (4) label-free quantitation
(Figure 4.1).
4.2 IN-CELL LABELING
In-cell labeling, usually referred to as metabolic labeling, is a quantitation approach
that relies on normal biological functions of a cell, specifically protein synthesis.
Isotopically coded molecules can be introduced during translation to achieve their
incorporation into nascent proteins. Perhaps the most well-known strategies of in-cell
labeling include 15N metabolic labeling and SILAC (stable isotope labeling by amino
acids in cell culture), and we discuss them in the following.
4.2.1 15N Metabolic Labeling
One of the first quantitative labeling methods developed for in-cell isotope incorpo-
ration was 15N labeling; 15N-enriched media can be used to introduce the “heavy”
isotopic form of nitrogen into the proteins. By this approach, two samples of interest
(a control and a test) can be grown separately in either 14N- or 15N-enriched media.
After nitrogen incorporation, the samples are pooled and treated together to minimize
the amount of variation introduced during further manipulations. Finally, the mixture
Label-free(e.g., SpS, XIC)
Sample source selection(cells, biofluids, tissue)
Peptide generation
MS analysis
Protein extraction
General flow of sample preparation
Labeling on thepeptide stage
(e.g., iTRAQ, SoPIL)Labeling on the
protein stage(e.g., ICPL, MeCAT)
In cell labeling(e.g., 15N, SILAC)
FIGURE 4.1 General workflow of quantitative proteomic approach. Samples can come
from various cell types, biofluids, or plant tissue. The proteins can be metabolically labeled
as they are synthesized using isotopically differentiated amino acids. Alternatively, samples
can be labeled on the protein stage using a variety of chemical reagents that can target
specific residues. Chemical labeling can also be incorporated on the peptide stage after
protein digestion with proteases. This usually requires protein or peptide samples to be
purified (IP, IMAC, density gradient fractionation (organelle)), or fractionated using HPLC,
simplifying and reducing the sample to subproteomic scale, followed by MS-based analysis.
After MS analysis, each MS spectrum can be integrated (relying on software), allowing for
relative quantitation.
IN-CELL LABELING 105

is analyzed byMS,which allows the relative quantitation to be carried out on the basis
of isotopically differentiated protein labels. Although nitrogen is a ubiquitous element
used by every organism, there are limitations as to which tissues and cell cultures can
efficiently incorporate its “heavy” form. Often 15N labeling can be used in intact
plants owing to good incorporation [57,58].
Although the approach has also been attempted in microorganisms [59],
C. elegans [60], fruit flies [61], and cell cultures [13,14], the amount of 15N labeling
in peptides may be lower than in the amount of 14N-incorporation in their counter-
parts. Needless to say, this incomplete incorporation can translate into challenges
during proper peak selection, peptide sequencing, and quantitation at the MS
stage [62]. An example problem that arises from inefficient labeling is the presence
of 14N-containing isotopologs corresponding to peaks that appear before the
monoisotopic peak of the 15N-containing peptide. These peaks can be mistakenly
judged as monoisotopic 15N-containing, thus resulting in missed or false identifi-
cation and quantitation.
To address these issues, improved labeling experiments and quantitation software
have been designed. Some of the enhanced approaches include the introduction of an
internal standard into both samples, thereby canceling out any errors between the
samples [63], or utilizing 15N enrichment in combination with precursor mass
correction to increase the level of identification and quantitation [62]. Another novel
approach designed to improve 15N incorporation is termed SILIP (stable isotope
labeling in plants) [16]. As the name suggests, the approach is designed for plant
research and is based on optimization of soil-based medium, thus promoting 98–99%
incorporation of “heavy” nitrogen.
Despite continuing efforts to improve metabolic labeling using 15N-enriched
media, a number of limitations prevent its broad usage. Primary reasons for its lack
of broad usage are the high cost (need an excess amount of isotopically labeled
nuclei), difficulty in interpretation of results, and incomplete isotope incorporation,
as discussed above. To overcome some of these drawbacks, a new metabolic
labeling approach, developed by Mann and coworkers, involves substitution of15N-rich media with isotopically differentiated amino acids [12,64]. The new
method, named SILAC, has shown great promise toward efficient protein labeling
in vivo.
4.2.2 Stable Isotope Labeling by Amino Acid (SILAC)
Quantitation using SILAC is based on the introduction of isotopically labeled amino
acids into a growing peptide chain during translation. During the experiment two or
more sets of cell cultures are grown using depletedmedia designed for SILAC that are
enriched with amino acids in their “light” or “heavy” forms (usually through 2H, 13C,
or 15N isotopes) [65]. After a number of cell divisions, nearly 100% of the proteins
will be newly synthesized, and thus would incorporate the labeled amino acids,
leading to a very efficient process. Full isotopic inclusion, however, would not be
possible unless the amino acids chosen for the reaction are essential, thus creating
only a single source of amino acids. For this reason leucine [12], lysine [66], and
106 QUANTITATIVE PROTEOMICS BY MASS SPECTROMETRY
methionine [67] are the best candidates. Recently arginine was added to the list of
amino acids that exhibit efficient incorporation [68]. Although arginine is not an
essential amino acid, it is for the most part obtained by many organisms through diet,
thus making it a viable labeling source [69]. The combination of arginine and lysine
has become perhaps the most often used labeling mixture because, after trypsin
digestion, each peptide theoretically will have a single label, enhancing protein
identification coverage and improving quantitation.
In-cell quantitative labeling offers many advantages compared to tagging of
samples during later stages. During SILAC labeling, as in 15N labeling, an isotopic
molecule is localized based on the protein sequence. Such sequence dependence aids
in protein identification because the differences in masses generated can also be used
as evidence for peptide sequence confirmation. This is particularly truewhen isotopic
incorporation is nearly 100%, which can be achieved with many cell lines [12].
Nevertheless, the major reason why many groups employ SILAC as their method of
choice is that it introduces early in the experiment the quantitative label into the
proteins. This benefit allows researchers to combine the samples before any prepara-
tive manipulations. Since its introduction, SILAC quantitation has been successfully
utilized by many research groups and applied to various cell types for both focused
studies [70–74] and large-scale biomarker discovery [8,75].
Although the advantages of SILAC are many, there are some drawbacks that
researchers need to understand before using this quantitation method. First, like 15N
labeling, it is expensive. Second, given that the labeled amino acids need to be
incorporated during cell culture growth, no complete quantitative labeling is possible
in plants, clinical samples, biofluids, or tissues, thus limiting the broad application of
the technique. An approach to address potentially this latter restriction may be to use
culture-derived isotope tags (CDITs) such that an in vivo isotope incorporated sample
can be employed as an internal standard in the quantitation of tissue proteins [13].
Previously this labeling limitation also held true for primary neurons because of their
inability to divide. This problem in neurons can also be addressed by growing primary
cortical and hippocampal neurons for a prolonged period of time in derivedmedia and
demonstrating efficient incorporation of SILAC amino acids [76]. A setback that can
occur during the SILAC labeling is the metabolic conversion of isotope-coded
arginine to proline. This conversion issue can be addressed by using L-proline [77]
or a mathematical correction [78]. Owing to these drawbacks, a large number of
alternativemethods are available and introduce quantitative tagging at a later stage of
sample preparation.
4.3 QUANTITATION VIA ISOTOPIC LABELING OF PROTEINS
Introduction of stable isotopes at the protein isolation stage is another useful option in
quantitative proteomics. The approach still allows relatively early incorporation of the
label while offering a wider variety of methods than metabolic labeling. Major
approaches of isotopic labeling on proteins include 2D PAGE-based quantitation,
proteolytic labeling by 18O and chemical isotope tagging.
QUANTITATION VIA ISOTOPIC LABELING OF PROTEINS 107
4.3.1 2D PAGE-Based Quantitation
Two-dimensional polyacrylamide gel electrophoresis (2D PAGE) has remained a
method of choice for protein separation and quantitation for many years. It allows
separation of complex mixtures based on the protein isoelectric point (pI) in the first
dimension andmolecularmass (Mr) in the second. 2DPAGE is considered perhaps the
earliest method for quantitative proteomics. The protocol is as follows: two samples
of interest are run side-by-side by using 2D PAGE, the proteins stained, and the band
sizes quantitatively compared to each other according to the exact positions on the
gels (a 2D PAGE-based quantitation flowchart is in Figure 4.2). Here the quantitation
is done at an early stage before any identification is accomplished. Recently with the
development of improved instrumentation and software, the quantitative differentia-
tion is much more accurate. Quantitation using 2D PAGE is particularly effective
when comparing proteins that have undergone post-translational modifications [79].
Usually phosphorylation, glycosylation, and some other modifications can be de-
tected on a gel as discrete band trains.
Despite the unique nature of quantitation using 2D PAGE in comparison to other
methods, it too has a number of drawbacks. First, separation and quantitation by 2D
electrophoresis discriminates against the proteins with molecular masses and pIs
outside the range, thus making complete proteome analyses difficult. Second, the
reproducibility of the method has room for improvement; the lack of precision is
due to gel heterogeneities introduced during polymerization and fluctuations during
the run. Furthermore, because it is virtually impossible to identify proteins from a
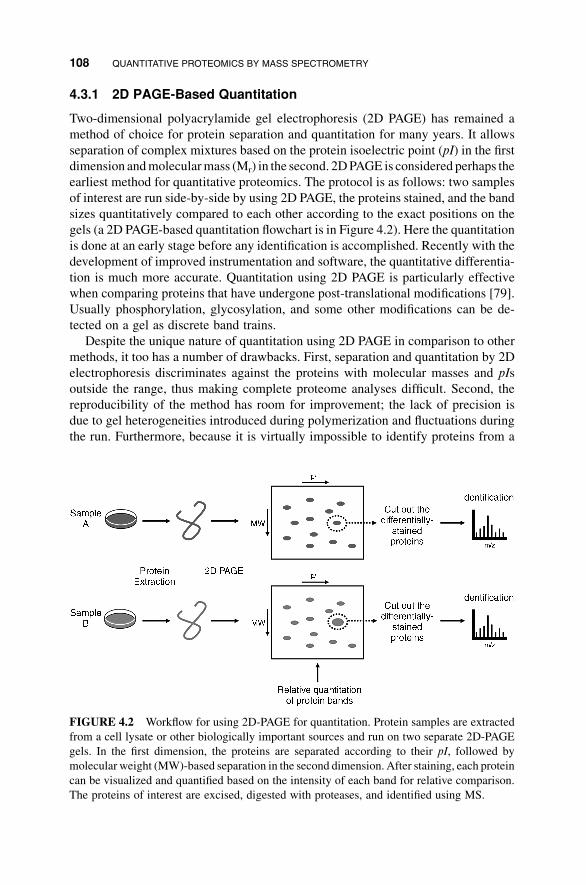
FIGURE 4.2 Workflow for using 2D-PAGE for quantitation. Protein samples are extracted
from a cell lysate or other biologically important sources and run on two separate 2D-PAGE
gels. In the first dimension, the proteins are separated according to their pI, followed by
molecular weight (MW)-based separation in the second dimension. After staining, each protein
can be visualized and quantified based on the intensity of each band for relative comparison.
The proteins of interest are excised, digested with proteases, and identified using MS.
108 QUANTITATIVE PROTEOMICS BY MASS SPECTROMETRY

complexmixture by electrophoresis, an additional identification step is required. This
step was traditionally Edman degradation, but recentlyMS has become themethod of
choice. Therefore many research groups now use MS-based quantitation to combine
the quantitation and identification steps. The most critical downside of 2D PAGE,
however, is its low sensitivity. Because the concentration range of proteins in a cell
range is between five and seven orders of magnitude, it is necessary to distinguish
proteins in low abundance (usually interesting signaling molecules) from the high
background of high-abundance proteins (usually “housekeeping” molecules).
Regrettably, most current gel staining techniques are not capable of achieving this.
In addition, 2D PAGE is biased toward membrane and other less soluble proteins.
Finally, the 2D PAGE approach is relatively labor-intensive and needs great care for
large-scale and frequent studies.
To address some of the drawbacks of the traditional 2D PAGE, one can turn to a
novel enhancedmethod called difference gel electrophoresis (DIGE) [80]. The unique
design of the approach uses fluorescent dyes, which can label proteins in complex
mixtures. Because fluorescent tags generally have good sensitivity, they add to
proteins detectability over a wide dynamic range. Besides sensitivity, reproducibility
(precision) has also been improved thanks to the ability to run both labeled samples on
a single gel, thus eliminating any gel-to-gel variations [81]. Nonetheless, protein
discrimination, its time-consuming nature, and the inability to identify the bands of
interest without further manipulations still remain as problems.
4.3.2 Proteolytic Labeling Using 18O Water
Proteolytic labeling in 18O water is a unique method of quantitation because the
tagging occurs not precisely at the protein stage but rather during the digestion step.
Here the two protein samples to be analyzed undergo proteolysis in either 16O or 18O
water, thus permitting one of the samples to incorporate an isotopic tag on the carboxy
termini of its peptides [82,83]. This results in a mass difference of 2 to 4 Da between
the two peptides that are identical in every other way. At this stage the peptides can
be combined, and the remainder of the protocol can be carried out as usual owing
to the excellent stability of the C–18O bond. Finally, quantitation is carried out at the
MS stage by determining the 16O/18O ratio.
The exact number of “heavy” atoms introduced during labeling depends on the
completeness of the proteolysis and the enzyme selected. Trypsin is usually the first
choice owing to its capacity to produce relatively uniform peptides of manageable
length that are easier to analyze by MS [84]. Along with a number of other proteases,
like Glu-C [82] and chymotrypsin, [85] trypsin incorporates two 18O atoms during
digestion. On the other hand, it is possible to introduce only a single 18O isotope
during proteolysis if metalloendopeptidase Lys-N is used [86].
Whether one or two oxygen atoms are added during proteolysis, the result of the
reaction is still a small mass difference (2 or 4 Da), making overlap between test and
control likely and quantitation difficult, particularly when low resolving power mass
spectrometers are utilized. Another disadvantage of a proteolytic labeling method is
the lack of automated software for efficient quantitation. Back-exchange of the 18O
QUANTITATION VIA ISOTOPIC LABELING OF PROTEINS 109
with solvent during proteolysis is also a substantial problem, resulting in poor
quantitation because the continuous activity of trypsin can sometimes substitute the
incorporated 18O atom with an 16O isotope when the two samples are pooled
together [87]. Usually it helps to inactivate the enzyme by lowering the pH and/or
the temperature of the digest solution [88]. These approaches only reduce the
problem, not eliminate it. Lastly, poor labeling efficiency and high cost of the
technique work against the method’s widespread adoption.
Regardless of the pitfalls and disadvantages, proteolysis in 18O water remains a
useful technique for quantitative labeling primarily owing to its simplicity. No extra
steps are necessary for incorporating the isotope tag, and the labeling can be done on
any biological sample. To address the low efficiency and high cost issues, a new
approach was introduced involving two sets of digestion—the first in “normal” water
and the second in “heavy”water—to incorporate the label at the peptide stage [85,89].
This possibility stems from the ability of trypsin to recognize peptides as pseudo-
substrates. This strategy optimizes the labeling efficiency and reduces the amount of18O water used, thus lowering the cost.
4.3.3 Quantitative Labeling by Chemical Tagging
Quantitation by chemical labeling has become one of the most prevalent approaches
in proteomic research. An extensive selection of various chemical tags is available,
and the ability to label different residues and PTMs within the samples provide an
opportunity for any research group to select the most effective and appropriate design
for individual experiments. Although themajority of chemical tags are designed to be
incorporated at the peptide stage, there are a few methods that introduce quantitative
capabilities by selectively labeling at the protein level (selected chemical tagging
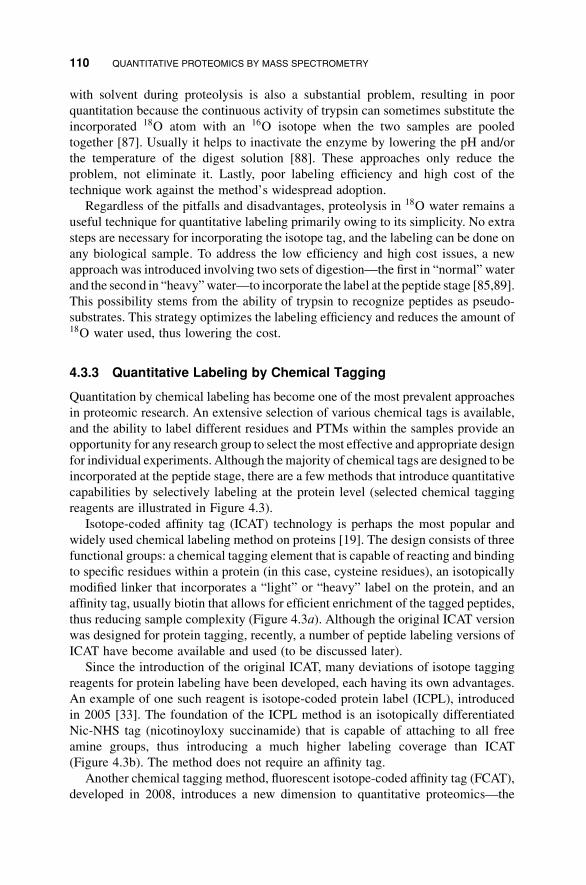
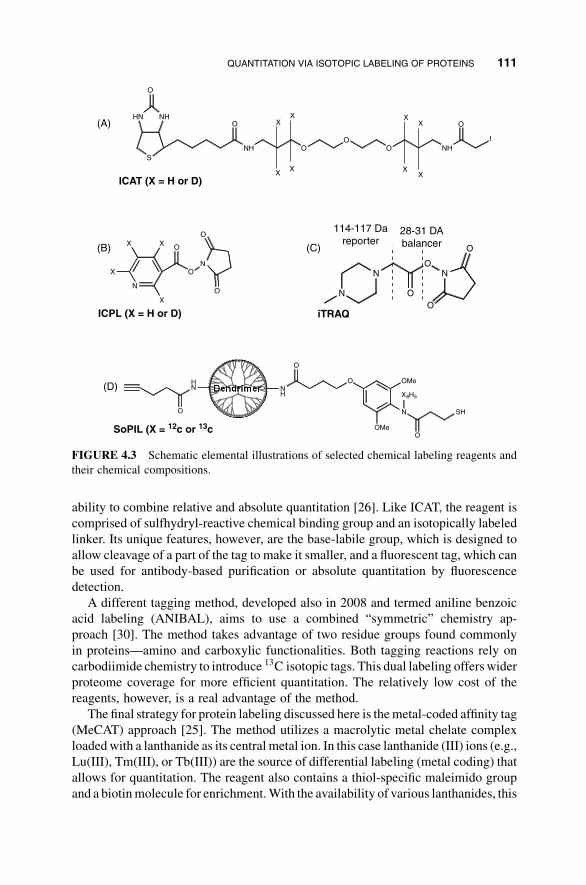
reagents are illustrated in Figure 4.3).
Isotope-coded affinity tag (ICAT) technology is perhaps the most popular and
widely used chemical labeling method on proteins [19]. The design consists of three
functional groups: a chemical tagging element that is capable of reacting and binding
to specific residues within a protein (in this case, cysteine residues), an isotopically
modified linker that incorporates a “light” or “heavy” label on the protein, and an
affinity tag, usually biotin that allows for efficient enrichment of the tagged peptides,
thus reducing sample complexity (Figure 4.3a). Although the original ICAT version
was designed for protein tagging, recently, a number of peptide labeling versions of
ICAT have become available and used (to be discussed later).
Since the introduction of the original ICAT, many deviations of isotope tagging
reagents for protein labeling have been developed, each having its own advantages.
An example of one such reagent is isotope-coded protein label (ICPL), introduced
in 2005 [33]. The foundation of the ICPL method is an isotopically differentiated
Nic-NHS tag (nicotinoyloxy succinamide) that is capable of attaching to all free
amine groups, thus introducing a much higher labeling coverage than ICAT
(Figure 4.3b). The method does not require an affinity tag.
Another chemical tagging method, fluorescent isotope-coded affinity tag (FCAT),
developed in 2008, introduces a new dimension to quantitative proteomics—the
110 QUANTITATIVE PROTEOMICS BY MASS SPECTROMETRY
ability to combine relative and absolute quantitation [26]. Like ICAT, the reagent is
comprised of sulfhydryl-reactive chemical binding group and an isotopically labeled
linker. Its unique features, however, are the base-labile group, which is designed to
allow cleavage of a part of the tag to make it smaller, and a fluorescent tag, which can
be used for antibody-based purification or absolute quantitation by fluorescence
detection.
A different tagging method, developed also in 2008 and termed aniline benzoic
acid labeling (ANIBAL), aims to use a combined “symmetric” chemistry ap-
proach [30]. The method takes advantage of two residue groups found commonly
in proteins—amino and carboxylic functionalities. Both tagging reactions rely on
carbodiimide chemistry to introduce 13C isotopic tags. This dual labeling offers wider
proteome coverage for more efficient quantitation. The relatively low cost of the
reagents, however, is a real advantage of the method.
The final strategy for protein labeling discussed here is themetal-coded affinity tag
(MeCAT) approach [25]. The method utilizes a macrolytic metal chelate complex
loadedwith a lanthanide as its central metal ion. In this case lanthanide (III) ions (e.g.,
Lu(III), Tm(III), or Tb(III)) are the source of differential labeling (metal coding) that
allows for quantitation. The reagent also contains a thiol-specific maleimido group
and a biotinmolecule for enrichment.With the availability of various lanthanides, this
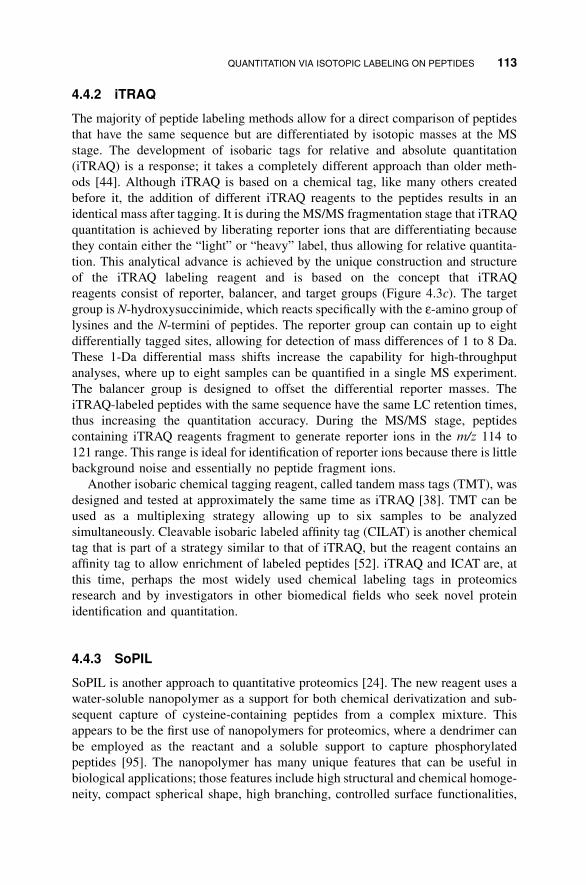
HN NH
SNH
O
O
X
X X
X
OO NH
XX
XX
I
O
O
N
ON
O
X
X X
XO
O
N
NO
N
O
O
O
HN
O
NH
O
O
OMe
N
X6H5
OMe
SH
OSoPIL (X = 12c or 13c
(D)
(C)
(A)
(B)
ICPL (X = H or D)
ICAT (X = H or D)
iTRAQ
114-117 Dareporter
28-31 DAbalancer
FIGURE 4.3 Schematic elemental illustrations of selected chemical labeling reagents and
their chemical compositions.
QUANTITATION VIA ISOTOPIC LABELING OF PROTEINS 111

method is capable of achieving simultaneous relative quantitation for more than
two samples.
Despite the different strategies that are available for protein labeling, there are a
number of drawbacks to tagging at this stage. Primarily it is sometimes difficult to
combine the tagging at this early stage with the subsequent manipulations need for
analysis; this is due to the poor compatibility of a tag with many subsequent steps in a
protocol. Often a chemical tag introduces variations in refolding, hydrophobicity, or
net chargewithin the labeled proteins,which could hinder ensuing chromatography or
fractionation steps. For example, the labeling of myoglobin with ICPL reduces the pI
and altered the migration toward the acidic side in 2D PAGE [33]. In addition, a
complete labeling of all of the resulting peptides is virtually impossible. For these
reasons peptide tagging has become a widely used approach in quantitative
proteomics.
4.4 QUANTITATION VIA ISOTOPIC LABELING ON PEPTIDES
In this sectionwe review the common labels that have routinely been used for labeling
peptides from complex mixtures. These chemical tags could be used for protein
labeling but, to date, have not been utilized or reported for that purpose.
4.4.1 ICAT
ICAT reagents were first applied at the protein stage and used to quantify changes in
glucose-mediated protein expression in yeast. Since then, newer versions of ICAT
have become available, primarily focusing on peptide-stage labeling. The biotin
affinity tag was a key limitation for the first generation ICAT, and modified ICAT
reagents have a photo- or acid-cleavable linker to help remove the biotin tag before
MS analysis [90]. The adaptation of a solid-phase format allowed stable isotopic
labeling along with isolation but with elimination of extra sample cleanup steps [55].
This tactic [35,91], termed reagent acid-labile isotope-coded extractant (ALICE),
also targets cysteine-containing peptides. ALICE, though similar to ICAT, in princi-
ple, was designedwith amaleimido reactive group instead of an iodoacetyl group, and
a linker that can incorporate up to 10 deuterium atoms for quantitation byMS. The use
of the inert nonbiological acid-labile linker (Sieber amide polymer matrix) is the first
significant contribution that greatly decreases nonspecific binding and eliminates
extra cleanup steps, thus reducing sample loss. A solid-phase reagent that is specific
toward higher amino groups [92] can also be used. Other improvements to ICAT
include the replacement of 2H with 13C for stable isotope labeling [93]. Using
deuterium for labeling of peptides may lead to a lack of co-elution of standard and
unknown (lack of resolved chromatographic isotopic peaks), and introduce errors in
quantitation [94]. This deuterium effect becomes more pronounced in peptides with
a higher number of deuterium atoms. In contrast, using heavy isotopes 13C or 15N
as replacements does not lead to observable changes in isotopic resolution with
contemporary LC chromatography.
112 QUANTITATIVE PROTEOMICS BY MASS SPECTROMETRY
4.4.2 iTRAQ
The majority of peptide labeling methods allow for a direct comparison of peptides
that have the same sequence but are differentiated by isotopic masses at the MS
stage. The development of isobaric tags for relative and absolute quantitation
(iTRAQ) is a response; it takes a completely different approach than older meth-
ods [44]. Although iTRAQ is based on a chemical tag, like many others created
before it, the addition of different iTRAQ reagents to the peptides results in an
identical mass after tagging. It is during the MS/MS fragmentation stage that iTRAQ
quantitation is achieved by liberating reporter ions that are differentiating because
they contain either the “light” or “heavy” label, thus allowing for relative quantita-
tion. This analytical advance is achieved by the unique construction and structure
of the iTRAQ labeling reagent and is based on the concept that iTRAQ
reagents consist of reporter, balancer, and target groups (Figure 4.3c). The target
group is N-hydroxysuccinimide, which reacts specifically with the e-amino group of
lysines and the N-termini of peptides. The reporter group can contain up to eight
differentially tagged sites, allowing for detection of mass differences of 1 to 8 Da.
These 1-Da differential mass shifts increase the capability for high-throughput
analyses, where up to eight samples can be quantified in a single MS experiment.
The balancer group is designed to offset the differential reporter masses. The
iTRAQ-labeled peptides with the same sequence have the same LC retention times,
thus increasing the quantitation accuracy. During the MS/MS stage, peptides
containing iTRAQ reagents fragment to generate reporter ions in the m/z 114 to
121 range. This range is ideal for identification of reporter ions because there is little
background noise and essentially no peptide fragment ions.
Another isobaric chemical tagging reagent, called tandem mass tags (TMT), was
designed and tested at approximately the same time as iTRAQ [38]. TMT can be
used as a multiplexing strategy allowing up to six samples to be analyzed
simultaneously. Cleavable isobaric labeled affinity tag (CILAT) is another chemical
tag that is part of a strategy similar to that of iTRAQ, but the reagent contains an
affinity tag to allow enrichment of labeled peptides [52]. iTRAQ and ICAT are, at
this time, perhaps the most widely used chemical labeling tags in proteomics
research and by investigators in other biomedical fields who seek novel protein
identification and quantitation.
4.4.3 SoPIL
SoPIL is another approach to quantitative proteomics [24]. The new reagent uses a
water-soluble nanopolymer as a support for both chemical derivatization and sub-
sequent capture of cysteine-containing peptides from a complex mixture. This
appears to be the first use of nanopolymers for proteomics, where a dendrimer can
be employed as the reactant and a soluble support to capture phosphorylated
peptides [95]. The nanopolymer has many unique features that can be useful in
biological applications; those features include high structural and chemical homoge-
neity, compact spherical shape, high branching, controlled surface functionalities,
QUANTITATION VIA ISOTOPIC LABELING ON PEPTIDES 113
and capacity to permeate cells [96]. The solubility of the dendrimer allows for a
complete and efficient capture due to the homogenous reaction conditions.
The foundation of the SoPIL reagent is a polyamino-amine (PAMAM) genera-
tion-4 dendrimer functionalized with a bromo-aceto reactive group for cysteine-
specific capture, 5-(2-formyl-3,5-dimethoxyphenoxy)pentanoic acid as the acid-
cleavable linker, and aniline 12C or 13C as the isotope tag (Figure 4.3d). Once the
cysteine peptides are tagged by SoPIL, the complexes (SoPIL/peptide) are captured
by azide, solid-phase beads. This is achieved by functionalizing the dendrimer with a
pentyl group that serves as a handle to allow the use of the click chemistry (copper-
catalyzed azide/alkyne cycloaddition) and give a fast and efficient reaction. The
labeled peptides can be liberated by elution with 90% trifluoric acetic acid (TFA).
The majority of methods based on small chemical labeling require additional
purification procedures (e.g., reagent removal or desalting steps) that can result in
severe sample loss. In contrast, most solid-phase methods result in nonlinear kinetics
caused by the heterogeneous (two-phase) reaction conditions. SoPIL combines
efficient labeling and isolation of target cysteine peptides in a homogeneous
environment with no need for extra desalting steps. The usefulness of SoPIL in
complex sample quantitation, is demonstrated in the expression-level quantification
of highly complex protein mixtures from the venoms of Crotalus scutulatus
scututlaus type A and B,Crotalus oreganus helleri, and Bothrops colombiensis [97].
The use of SoPIL permits the identification, in a single experiment, of Mojave toxin,
a known neurotoxin, and quantification of the increased expression levels of
hemorrhagic proteases, which are found exclusively in the venoms of C. s. scutlatus
type A and type B, respectively.
4.4.4 Absolute Quantitation
Absolute quantitation of proteins has become essential for biomarker discovery and is
now emerging as a promising opportunity for proteomics. The current methods are
based on the same principles as the stable isotope dilution method wherein internal
standards are used as reference markers for quantification by mass spectrometry. In
absolute quantitation, standard peptides are synthesized de novo, and stable isotopes
are incorporated to allow differential detection in MS. A standard curve is generated
by using known amounts of internal standards (represented peptide) (Figure 4.4).
Several strategies can be used to afford a standard procedure for absolute
quantitation (Table 4.3). In one approach, called AQUA for proteins and posttrans-
lational modifications [98], protein of interest and one of the resulting peptides to
represent it in the MS analyses are selected. The peptide is synthesized by using a
standard solid-phase based peptide synthesis; this peptide is a mimic of a peptide
digested from the sample protein. A leucine is used for stable isotope incorporation,
allowing a 7-Da shift (six 13C and one 15N). The AQUA standard is added to the cell
lysate before the digestion procedure, and the peptide/protein of interest is quanti-
fied according to the amount of the synthesized or internal-standard peptide
introduced. The method was validated by AQUA synthesis of myoglobin in a yeast
background.
114 QUANTITATIVE PROTEOMICS BY MASS SPECTROMETRY

Although the AQUA approach is robust and potentially universal to quantify any
protein, its ability to quantify multiple proteins in complex mixtures in high-
throughput analyses is limited owing to the need to synthesize all of the peptides
of interest de novo and analyze them independently. A multiplexed approach called
QCAT (concatenations of Q peptides (standard peptides)) circumvents this limita-
tion [99,100]. QCAT is a strategy that uses engineered artificial proteins that are
concatenations of Q peptides for the proteins of interest. The protein of interest is
recombinantly synthesized and metabolically labeled in selected media in E. coli,
then grown and isolated. The isotopically labeled proteins are mixed with the real
FIGURE 4.4 Example of a sampleworkflow for absolute quantitation. Proteins are extracted
from a biologically significant source (e.g., serum or plasma). Samples are pre-run or known
protein targets are selected. A reference peptide mimicking a peptide from the target protein is
synthesized de novo and used to generate a statistical linear relationship of concentration in
regard to ion intensity. The proteins are digested, and the reference peptide is “spiked” into the
sample for quantitation by MS.
TABLE 4.3 Selected Methods for Absolute Quantitation
Method† Stable Isotope References
Absolute Quantitation
AQUA 2H, 13C, 15N 98
QCAT 2H, 13C, 15N 99
QconCAT 2H, 13C, 15N 100
SISCAPA 2H, 13C, 15N 101
iTRAQ 13C 44
†AQUA - Absolute quantification, QCAT- Multiplexed absolute quantification, QCONCAT- Multiplexed
absolute quantification using concatenate signature, SISCAPA - Stable isotope standards and capture by
anti-peptide antibodies, iTRAQ - isobaric tag for relative and absolute quantification.
QUANTITATION VIA ISOTOPIC LABELING ON PEPTIDES 115
sample and quantified accordingly. As a proof of principle, twenty proteins in skeletal
muscle cells from the organism Gallus gallus were quantified.
Owing to the wide concentration range of proteins in cells and biofluids, an
enrichment step can be added to remove unwanted, high-abundance proteins. For this
purpose a novel absolute quantitation technique called SISCAPA (stable isotope
standard with capture by antipeptide antibodies) is now available [101]. This method
relies on four steps: (1) digestion of proteins, (2) addition of an internal standard that
is labeled with stable isotopes, (3) enrichment of low-abundant peptides using
immobilized antibodies, and (4) quantitation by MS.
Absolute quantitation has become a robust and useful approach for proteomic
quantitation by MS. The strategy relies heavily on the use of de novo generation of
peptide standards for quantitative comparisons. Therefore, not only must target
molecules be selected, but also the correct peptide representation needs to be used
for analyses. Protein digestion by trypsin or other proteolytic enzymes must generate
the correct N and C termini after digestion so that accurate quantitative comparison
with standard peptides can be achieved. This can be a limitation in real sample
analyses where the predicted digestion may depend on the nature of the protein and
sample conditions. One should consider a pre-run of the complex mixture proteins to
determine the peptides that should be synthesized de novo. This limits absolute
quantitation as an unbiased comprehensive global-scale proteomics approach. In
addition, unknown, or even known, post-translational modifications of target mole-
cules may disallow accurate quantitation. To address this issue, one can analyze
“proteotryptic” peptides according to their physiochemical properties (e.g., charge,
hydrophobicity, length, and amino-acid composition) to identify a number of para-
meters that help the selection of representative peptides for MS-based absolute
quantification [102].
4.5 LABEL-FREE QUANTITATION
Although quantitative proteomics research has produced novel and versatile chemi-
cal-tagging strategies for determination of protein expression changes in organisms,
the obvious shortcomings of isotope labeling based methods are the introduction of
extra steps during sample preparation and the small number of samples that can be
analyzed simultaneously. A number of quantitative and semiquantitative strategies
are now available; they are based on and include, but not limited to, statistical
treatment and chromatographic retention time, or peak area, to generate direct
determination of protein expression changes from multiple sample runs (Figure 4.5).
These methods, referred to as label-free quantitation, are alternative methods to
isotopic-labeling approaches for quantitative proteomics [103] (Table 4.4). The
current detection schemes are based onmeasuring ion signal intensity [104], counting
spectra, counting number of fragments for a particular peptide [105], and/or using
abundance indicators for normalization [106–109].
Ion intensity measurement, or extracted ion counting (XIC), is the systematic
counting of selected ions of a particular m/z plotted over elution time, resulting in a
116 QUANTITATIVE PROTEOMICS BY MASS SPECTROMETRY
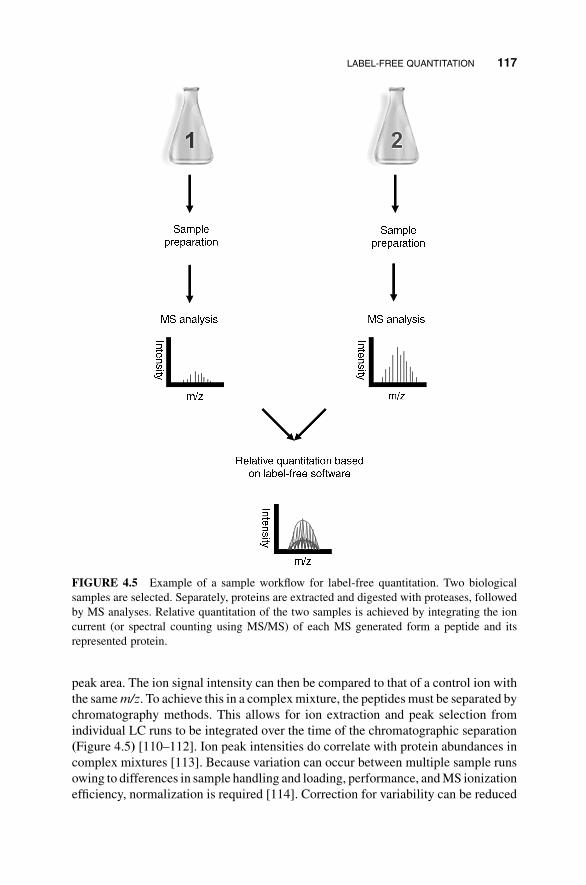
peak area. The ion signal intensity can then be compared to that of a control ion with
the samem/z. To achieve this in a complexmixture, the peptides must be separated by
chromatography methods. This allows for ion extraction and peak selection from
individual LC runs to be integrated over the time of the chromatographic separation
(Figure 4.5) [110–112]. Ion peak intensities do correlate with protein abundances in
complex mixtures [113]. Because variation can occur between multiple sample runs
owing to differences in sample handling and loading, performance, andMS ionization
efficiency, normalization is required [114]. Correction for variability can be reduced
FIGURE 4.5 Example of a sample workflow for label-free quantitation. Two biological
samples are selected. Separately, proteins are extracted and digested with proteases, followed
by MS analyses. Relative quantitation of the two samples is achieved by integrating the ion
current (or spectral counting using MS/MS) of each MS generated form a peptide and its
represented protein.
LABEL-FREE QUANTITATION 117
by normalizing each peak intensity by the sum or median of all peak intensities over
the chromatographic run [117]. Normalizing the peptide signal intensity by the sumof
the total ion signal intensities and correcting the signal intensity in various fractions
can reduce variability for the population mean, thus reducing the standard devia-
tion [114]. One disadvantage of signal intensity measurements is the balance of MS
acquisition that allows for identification and quantitation of ions during a run.
Therefore it is necessary for equal ion acquisition of survey (MS) and fragments
(MS/MS) to be optimized for maximum high-throughput usage. Ion trap based
instruments have a greater advantage compared to quadrupole instruments because
they are able to acquire a spectrum every 0.2 s or even less, whereas quad-TOF could
take up to 3 s/spectrum [108,118–121].
A new statistical method called spectrum sampling (SpS) (often referred to as
spectral counting) [105] relies on counting the identifying spectra for each protein.
Spectral counting analysis is of the number of product-ion (MS/MS) spectra obtained
for each peptide. It is based on the assumption that the higher number of product-ion
spectra produced by a peptide from a single run infers higher protein abundance. By
comparing the spectral numbers from two samples, it generates a semiquantitative
strategy for the analysis of protein-expression changes [121]. Spectral counting has
fair reproducibility and shows good correlation with protein changes [105]. In
addition an increase in spectral number could result in an increase in accuracy and
a decrease in false positives. An advantage of spectral counting is the correlation with
protein abundance is linear [114], and this is also observed for ion intensity peak area
or peak height. One additional benefit for spectral counting when compared to ion
intensity-based quantitation is the the MS/MS acquisition over a single chro-
matographic time allows for both identification and quantification. A comparison
study demonstrates that spectral counting correlates well with relative protein
abundances [114]. Spectral counting is also sufficiently sensitive to determine a
small, 2-fold change in protein expression levels. By using the spectral counting
approach, one can measure more drastic abundance changes throughout a wider
range of protein expression levels than by using any other quantitative approach
(2–100-fold). Ideally, spectral counting can provide a simple way for relative protein
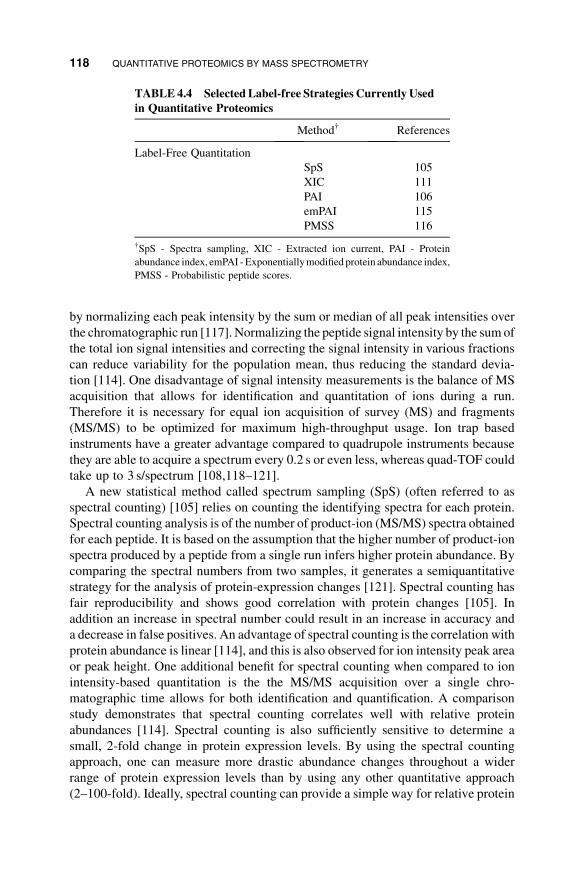
TABLE 4.4 Selected Label-free Strategies Currently Used
in Quantitative Proteomics
Method† References
Label-Free Quantitation
SpS 105
XIC 111
PAI 106
emPAI 115
PMSS 116
†SpS - Spectra sampling, XIC - Extracted ion current, PAI - Protein
abundance index, emPAI -Exponentiallymodified protein abundance index,
PMSS - Probabilistic peptide scores.
118 QUANTITATIVE PROTEOMICS BY MASS SPECTROMETRY

quantitation, but despite the advantages of the method, there are a number of
drawbacks that remain to be addressed. For instance, high-abundance proteins that
provide many spectra during the analyses can cause saturation effects and impair
quantification attempts. Another disadvantage is that high-abundance proteins can
mask low-abundance proteins, severely limiting the number of quantifiable proteins,
particularly when comparing, for example, signaling (low-abundance) versus
“housekeeping” proteins [105,114,122].
Steady efforts have beenmade to identify a more accurate label-free protein/peptide
quantitation strategy. For example, similar to SpS, the peptide-matching score sum-
mation (PMSS) is a label-free technique that assumes ideal scoring for proteins as the
summative of the identification scoresof their constituent peptides freedupondigestion.
A higher score represents a more abundant protein [116]. Another method, PAI or
Protein Abundance Indices, is semiquantitative but a more reliable indicator for
abundance than PMSS. The approach is also based on the assumption that an increasing
number of identified peptides indicate an increasing protein abundance [106]. This
method can be modified by developing emPAI (exponentially modified protein
abundance index), which uses a logarithmic relationship between the number of
signature peptides and the protein abundance represented by these peptides [115].
Probabilistic peptide identification scores can be used for differential proteomic
analyses by combining PMSS and SpS with a statistical validation method called
LPET(local pool error test) [109].Thismethod is able toquantify differences inpurified
proteins and serum samples with 2- to 5-fold changes with 90-95% confidence.
Currently label-free methods are still a controversial means for protein quantita-
tion using MS, especially if follow-up experiments are not performed to validate the
initial quantitative data. Chemical labeling approaches are generally more accurate
than label-free methods, but label-free quantitation provides a potentially simpler
approach to analyze a large number of samples in parallel [123]. With the continued
development of statistics and bioinformatics approaches, label-free quantitation is
expected to continue improving steadily.
4.6 CONCLUSIONS
Quantitative proteomics has evolved immensely, contingent on novel tagging strate-
gies, new high resolving power mass spectrometers, and advanced software [124].
Progress toward the goal of uncovering the vast genomes and proteomes of lower and
higher order organisms is on a rapid pace. MS-based proteomics started with high
promise, but it has not yet fulfilled it. A main limitation is the lack of quantitative
capability. Applying a successful quantitative proteomic strategy to make accurate
measurements for novel discoveries is challenging owing to varying circumstances,
including the species investigated (e.g., the swine genome has not been sequenced to
date), sample state (e.g., cell, tissue, or serum), reagents used (e.g., ICATor iTRAQ),
and mass spectrometers utilized. Each circumstance has some advantages and draw-
backs. In addition, due to the dynamic range of cell and serum samples and detection
limits of current mass spectrometers, enrichment, depletion, or multidimensional
CONCLUSIONS 119

chromatography must be implemented beforehand. To detect such low-abundance
proteins, the aforementioned fractionation strategies must be applied, often at the cost
of accurate quantitation. Multifractionation may distort the naturally existing ratios
between two samples, resulting in false or biased information. Integrated efforts on the
development of technologies, chemistries, methods, and software will continue to
advance theyoungfield of quantitative proteomics andallowproteomics to live up to its
promise.
ACKNOWLEDGMENT
This work has been funded in part by an NSF CAREER award, a 3M general fund
(WAT), and byNational Institutes ofHealthGrants, S10RF025044 andR21RR025802.
REFERENCES
1. Tao,W. A., Aebersold, R. (2003). Advances in quantitative proteomics via stable isotope
tagging and mass spectrometry. Curr Opin Biotechnol 14, 110–118.
2. Tao, W. A. (2007). Soluble polymer-based isotopic labeling (SoPIL): A new strategy to
discover protein biomarkers? Expert Rev Proteomics 4(5), 603–607.
3. Aebersold, R., Mann, M. (2003). Mass spectrometry-based proteomics. Nature 422,198–207.
4. Schoenheimer, R., Rittenberg, D. (1935). Deuterium as an indicator in the study of
intermediary metabolism. Science 82, 156–157.
5. Schoenheimer, R., Rittenberg, D., Foster, G. L., Keston, A. S., Ratner, S. (1938). The
application of the nitrogen isotope N15 for the study of protein metabolism. Science 88,599–600.
6. Arsene, C.G.,Ohlendorf, R., Burkitt,W., Pritchard, C., Henrion,A.,O’Connor,G., Bunk,
D.M., Guttler, B. (2008). Protein quantification by isotope dilution mass spectrometry of
proteolytic fragments: Cleavage rate and accuracy. Anal Chem 80, 4154–4160.
7. Chaerkady, R., Harsha, H. C., Nalli, A., Gucek, M., Vivekanandan, P., Akhtar, J., Cole,
R. N., Simmers, J., Schulick, R. D., Singh, S., Torbenson, M., Pandey, A., Thuluvath,
P. J. (2008). A quantitative proteomic approach for identification of potential biomarkers
in hepatocellular carcinoma. J Proteome Res 7, 4289–4298.
8. Gronborg,M., Kristiansen, T. Z., Iwahori, A., Chang, R., Reddy, R., Sato, N.,Molina, H.,
Jensen, O. N., Hruban, R. H., Goggins, M. G., Maitra, A., Pandey, A. (2006). Biomarker
discovery frompancreatic cancer secretome using a differential proteomic approach.Mol
Cell Proteomics 5, 157–171.
9. Okamura, N., Masuda, T., Gotoh, A., Shirakawa, T., Terao, S., Kaneko, N.,
Suganuma, K., Watanabe, M., Matsubara, T., Seto, R., Matsumoto, J., Kawakami,
M., Yamamori, M., Nakamura, T., Yagami, T., Sakaeda, T., Fujisawa, M., Nishi-
mura, O., Okumura, K. (2008). Quantitative proteomic analysis to discover potential
diagnostic markers and therapeutic targets in human renal cell carcinoma. Proteo-
mics 8, 3194–3203.
120 QUANTITATIVE PROTEOMICS BY MASS SPECTROMETRY
10. Gygi, S. P., Rochon, Y., Franza, B. R., Aebersold, R. (1999). Correlation between protein
and mRNA abundance in yeast. Mol Cell Biol 19, 1720–1730.
11. Anderson, L. (2005). Candidate-based proteomics in the search for biomarkers of
cardiovascular disease. J Physiol 563(Pt 1) 23–60.
12. Ong, S. E., Blagoev, B., Kratchmarova, I., Kristensen, D. B., Steen, H., Pandey, A.,Mann,
M. (2002). Stable isotope labeling by amino acids in cell culture, SILAC, as a simple and
accurate approach to expression proteomics. Mol Cell Proteomics 1, 376–386.
13. Ishihama, Y., Sato, T., Tabata, T., Miyamoto, N., Sagane, K., Nagasu, T., Oda, Y. (2005).
Quantitative mouse brain proteomics using culture-derived isotope tags as internal
standards. Nat Biotechnol 23, 617–621.
14. Oda, Y., Huang, K., Cross, F. R., Cowburn, D., Chait, B. T. (1999). Accurate quantitation
of protein expression and site-specific phosphorylation. Proc Natl Acad Sci USA 96,6591–6596.
15. Dieterich, D.C., A.J. Link, J. Graumann, D.A. Tirrell, and E.M. Schuman. (2006).
Selective identification of newly synthesized proteins inmammalian cells using bioortho-
gonal noncanonical amino acid tagging (BONCAT). Proc Natl Acad Sci U S A, 103,
9482–9487.
16. Schaff, J. E., Mbeunkui, F., Blackburn, K., Bird, D. M., Goshe, M. B. (2008). SILIP: A
novel stable isotope labelingmethod for in planta quantitative proteomic analysis.Plant J
56, 840–854.
17. Rose,K.,M.G. Simona,R.E.Offord,C.P. Prior, B.Otto, andD.R. Thatcher. (1983).A new
mass-spectrometric C-terminal sequencing technique finds a similarity between gamma-
interferon and alpha 2-interferon and identifies a proteolytically clipped gamma-inter-
feron that retains full antiviral activity. Biochem J, 215, 273–277.
18. Liu, T., W.J. Qian, E.F. Strittmatter, D.G. Camp, 2nd, G.A. Anderson, B.D. Thrall, and R.
D. Smith. (2004). High-throughput comparative proteome analysis using a quantitative
cysteinyl-peptide enrichment technology. Anal Chem, 76, 5345–5353.
19. Gygi, S. P., Rist, B., Gerber, S. A., Turecek, F., Gelb, M. H., Aebersold, R. (1999).
Quantitative analysis of complex protein mixtures using isotope-coded affinity tags. Nat
Biotechnol 17, 994–999.
20. Olsen, J.V., J.R. Andersen, P.A. Nielsen, M.L. Nielsen, D. Figeys, M. Mann, and J.R.
Wisniewski. (2004). HysTag–a novel proteomic quantification tool applied to differential
display analysis of membrane proteins from distinct areas of mouse brain. Mol Cell
Proteomics, 3, 82–92.
21. Pasquarello, C., J.C. Sanchez, D.F. Hochstrasser, and G.L. Corthals. (2004).
N-t-butyliodoacetamide and iodoacetanilide: two new cysteine alkylating reagents for
relative quantitation of proteins. Rapid Commun Mass Spectrom, 18, 117–127.
22. Sebastiano, R., A. Citterio, M. Lapadula, and P.G. Righetti. (2003). A new deuterated
alkylating agent for quantitative proteomics. Rapid Commun Mass Spectrom, 17,
2380–2386.
23. Gartner, C.A., J.E. Elias, C.E. Bakalarski, and S.P. Gygi. (2007). Catch-and-release
reagents for broadscale quantitative proteomics analyses. J Proteome Res, 6, 1482–1491.
24. Guo, M., Galan, J., Tao, W. A. (2007). A novel quantitative proteomics reagent based on
soluble nanopolymers. Chem Commun (Camb) (12) 1251–1253.
25. Ahrends, R., Pieper, S., Kuhn, A., Weisshoff, H., Hamester, M., Lindemann, T., Scheler,
C., Lehmann, K., Taubner, K., Linscheid, M. W. (2007). A metal-coded affinity tag
approach to quantitative proteomics. Mol Cell Proteomics 6, 1907–1916.
REFERENCES 121

26. Rivera-Monroy, Z., Bonn, G. K., Guttman, A. (2008). Fluorescent isotope-coded affinity
tag (FCAT). I: Design and synthesis. Bioorg Chem 36, 299–311.
27. Hoang, V.M., T.P. Conrads, T.D. Veenstra, J. Blonder, A. Terunuma, J.C. Vogel, and R.J.
Fisher. (2003). Quantitative proteomics employing primary amine affinity tags. J Biomol
Tech, 14, 216–223.
28. Lu, Y., P. Bottari, F. Turecek, R. Aebersold, and M.H. Gelb. (2004). Absolute quantifica-
tion of specific proteins in complex mixtures using visible isotope-coded affinity tags.
Anal Chem, 76, 4104–4111.
29. Asara, J.M., X. Zhang, B. Zheng,H.H. Christofk, N.Wu, andL.C. Cantley. (2006). In-Gel
Stable-Isotope Labeling (ISIL): a strategy for mass spectrometry-based relative quanti-
fication. J Proteome Res, 5, 155–163.
30. Panchaud, A., Hansson, J., Affolter, M., Bel Rhlid, R., Piu, S., Moreillon, P.,
Kussmann, M. (2008). ANIBAL, stable isotope-based quantitative proteomics by
aniline and benzoic acid labeling of amino and carboxylic groups. Mol Cell
Proteomics 7, 800–812.
31. Angel, P.M. and R. Orlando. (2007). Quantitative carbamylation as a stable isotopic
labeling method for comparative proteomics. Rapid Commun Mass Spectrom, 21,
1623–1634.
32. Brancia, F.L., M.E. Openshaw, and S. Kumashiro. (2002). Investigation of the electro-
spray response of lysine-, arginine-, and homoarginine-terminal peptide mixtures by
liquid chromatography/mass spectrometry. Rapid Commun Mass Spectrom, 16,
2255–2259.
33. Schmidt, A., Kellermann, J., Lottspeich, F. (2005). A novel strategy for quantitative
proteomics using isotope-coded protein labels. Proteomics 5, 4–15.
34. Kuyama, H., M. Watanabe, C. Toda, E. Ando, K. Tanaka, and O. Nishimura. (2003). An
approach to quantitative proteome analysis by labeling tryptophan residues. Rapid
Commun Mass Spectrom, 17, 1642–1650.
35. Qiu, Y., Sousa, E. A., Hewick, R. M., Wang, J. H. (2002). Acid-labile isotope-coded
extractants: a class of reagents for quantitative mass spectrometric analysis of complex
protein mixtures. Anal. Chem. 74, 4969–4979.
36. Shi, Y., R.Xiang, J.K.Crawford, C.M.Colangelo, C.Horvath, and J.A.Wilkins. (2004).A
simple solid phasemass tagging approach for quantitative proteomics. J Proteome Res, 3,
104–111.
37. Shen, M., L. Guo, A. Wallace, J. Fitzner, J. Eisenman, E. Jacobson, and R.S. Johnson.
(2003). Isolation and isotope labeling of cysteine- and methionine-containing tryptic
peptides: application to the study of cell surface proteolysis.Mol Cell Proteomics, 2, 315–
324.
38. Thompson, A., Schafer, J., Kuhn, K., Kienle, S., Schwarz, J., Schmidt, G., Neumann, T.,
Johnstone, R., Mohammed, A. K., Hamon, C. (2003). Tandem mass tags: A novel
quantification strategy for comparative analysis of complex protein mixtures byMS/MS.
Anal Chem 75, 1895–1904.
39. Wang, S. and F.E. Regnier. (2001). Proteomics based on selecting and quantifying
cysteine containing peptides by covalent chromatography. J Chromatogr A, 924,
345–357.
40. Ji, J., A. Chakraborty, M. Geng, X. Zhang, A. Amini, M. Bina, and F. Regnier. (2000).
Strategy for qualitative and quantitative analysis in proteomics based on signature
peptides. J Chromatogr B Biomed Sci Appl, 745, 197–210.
122 QUANTITATIVE PROTEOMICS BY MASS SPECTROMETRY
41. Che, F.Y. and L.D. Fricker. (2002). Quantitation of neuropeptides in Cpe(fat)/Cpe(fat)
mice using differential isotopic tags and mass spectrometry. Anal Chem, 74, 3190–3198.
42. Zhang, X., Q.K. Jin, S.A. Carr, and R.S. Annan. (2002). N-Terminal peptide labeling
strategy for incorporation of isotopic tags: a method for the determination of site-specific
absolute phosphorylation stoichiometry. Rapid CommunMass Spectrom, 16, 2325–2332.
43. Munchbach, M., M. Quadroni, G. Miotto, and P. James. (2000). Quantitation and
facilitated de novo sequencing of proteins by isotopic N-terminal labeling of peptides
with a fragmentation-directing moiety. Anal Chem, 72, 4047–4057.
44. Ross, P. L., Huang, Y. N., Marchese, J. N., Williamson, B., Parker, K., Hattan, S.,
Khainovski, N., Pillai, S., Dey, S., Daniels, S., Purkayastha, S., Juhasz, P., Martin, S.,
Bartlet-Jones, M., He, F., Jacobson, A., Pappin, D. J. (2004). Multiplexed protein
quantitation in saccharomyces cerevisiae using amine-reactive isobaric tagging reagents.
Mol Cell Proteomics 3, 1154–1169.
45. Cagney,G. andA.Emili. (2002).De novo peptide sequencing and quantitative profiling of
complex protein mixtures using mass-coded abundance tagging. Nat Biotechnol, 20,
163–170.
46. Mason, D.E. and D.C. Liebler. (2003). Quantitative analysis of modified proteins by LC-
MS/MS of peptides labeled with phenyl isocyanate. J Proteome Res, 2, 265–272.
47. Beardsley, R.L. and J.P. Reilly. (2003). Quantitation using enhanced signal tags: a
technique for comparative proteomics. J Proteome Res, 2, 15–21.
48. Lee, Y.H., H. Han, S.B. Chang, and S.W. Lee. (2004). Isotope-coded N-terminal
sulfonation of peptides allows quantitative proteomic analysis with increased de novo
peptide sequencing capability. Rapid Commun Mass Spectrom, 18, 3019–3027.
49. Peters, E.C., D.M. Horn, D.C. Tully, and A. Brock. (2001). A novel multifunctional
labeling reagent for enhanced protein characterization with mass spectrometry. Rapid
Commun Mass Spectrom, 15, 2387–2392.
50. Hsu, J.L., S.Y. Huang, N.H. Chow, and S.H. Chen. (2003). Stable-isotope dimethyl
labeling for quantitative proteomics. Anal Chem, 75, 6843–6852.
51. Fedjaev,M., S. Trudel, A.P.N. Tjon,A. Parmar, B.I. Posner, E. Levy, I. Nifant’ev, andA.V.
Pshezhetsky. (2007). Quantitative analysis of a proteome by N-terminal stable-isotope
labelling of tryptic peptides. Rapid Commun Mass Spectrom, 21, 2671–2679.
52. Li, S., Zeng, D. (2007). CILAT—A new reagent for quantitative proteomics. Chem
Commun (Camb) (21) 2181–2183.
53. Goodlett, D.R., A. Keller, J.D. Watts, R. Newitt, E.C. Yi, S. Purvine, J.K. Eng, P. von
Haller, R. Aebersold, and E. Kolker. (2001). Differential stable isotope labeling of
peptides for quantitation and de novo sequence derivation. Rapid Commun Mass
Spectrom, 15, 1214–1221.
54. Syka, J.E., J.A. Marto, D.L. Bai, S. Horning, M.W. Senko, J.C. Schwartz, B. Ueberheide,
B. Garcia, S. Busby, T. Muratore, J. Shabanowitz, and D.F. Hunt. (2004). Novel linear
quadrupole ion trap/FT mass spectrometer: performance characterization and use in the
comparative analysis of histone H3 post-translational modifications. J Proteome Res, 3,
621–626.
55. Atwood, J.A., 3rd, L. Cheng, G. Alvarez-Manilla, N.L. Warren, W.S. York, and R.
Orlando. (2008). Quantitation by isobaric labeling: applications to glycomics. J Prote-
ome Res, 7, 367–374.
REFERENCES 123
56. Alvarez-Manilla, G., N.L. Warren, T. Abney, J. Atwood, 3rd, P. Azadi, W.S. York, M.
Pierce, and R. Orlando. (2007). Tools for glycomics: relative quantitation of glycans by
isotopic permethylation using 13CH3I. Glycobiology, 17, 677–687.
57. Ippel, J. H., Pouvreau, L., Kroef, T., Gruppen, H., Versteeg, G., van den Putten, P., Struik,
P. C., van Mierlo, C. P. (2004). In vivo uniform (15)N-isotope labelling of plants: Using
the greenhouse for structural proteomics. Proteomics 4, 226–234.
58. Nelson, C. J., Huttlin, E. L., Hegeman, A. D., Harms, A. C., Sussman, M. R. (2007).
Implications of 15N-metabolic labeling for automated peptide identification in Arabi-
dopsis thaliana. Proteomics 7, 1279–1292.
59. Veenstra, T. D., Martinovic, S., Anderson, G. A., Pasa-Tolic, L., Smith, R. D. (2000).
Proteome analysis using selective incorporation of isotopically labeled amino acids. J Am
Soc Mass Spectrom 11, 78–82.
60. Dong, M. Q., Venable, J. D., Au, N., Xu, T., Park, S. K., Cociorva, D., Johnson, J. R.,
Dillin, A., Yates, J. R., 3rd (2007). Quantitative mass spectrometry identifies insulin
signaling targets in C. elegans. Science 317, 660–603.
61. Krijgsveld, J., Ketting, R. F., Mahmoudi, T., Johansen, J., Artal-Sanz, M., Verrijzer, C. P.,
Plasterk, R. H., Heck, A. J. (2003).Metabolic labeling ofC. elegans andD.melanogaster
for quantitative proteomics. Nat Biotechnol 21(8), 927–31.
62. Gouw, J. W., Tops, B. B., Mortensen, P., Heck, A. J., Krijgsveld, J. (2008). Optimizing
identification and quantitation of 15N-labeled proteins in comparative proteomics. Anal
Chem 80, 7796–7803.
63. Wu, C. C., MacCoss, M. J., Howell, K. E., Matthews, D. E., Yates, J. R., 3rd (2004).
Metabolic labeling of mammalian organisms with stable isotopes for quantitative
proteomic analysis. Anal Chem 76, 4951–4959.
64. Zhu, H., Pan, S., Gu, S., Bradbury, E.M., Chen, X. (2002). Amino acid residue specific
stable isotope labeling for quantitative proteomics. Rapid Commun Mass Spectrom 16,2115–2123.
65. Mann,M. (2006). Functional and quantitative proteomics using SILAC.Nat RevMol Cell
Biol 7, 952–958.
66. Gu, S., Pan, S., Bradbury, E. M., Chen, X. (2003). Precise peptide sequencing and protein
quantification in the human proteome through in vivo lysine-specific mass tagging. J Am
Soc Mass Spectrom 14, 1–7.
67. Ong, S. E., Mittler, G., Mann, M. (2004). Identifying and quantifying in vivo methylation
sites by heavy methyl SILAC. Nat Meth 1, 119–126.
68. Ong, S. E., Kratchmarova, I., Mann, M. (2003). Properties of 13C-substituted arginine
in stable isotope labeling by amino acids in cell culture (SILAC). J Proteome Res 2,173–181.
69. Scott, L., Lamb, J., Smith, S., Wheatley, D. N. (2000). Single amino acid (arginine)
deprivation: rapid and selective death of cultured transformed and malignant cells. Br J
Cancer 83, 800–810.
70. Wisniewski, J. R., Zougman, A., Kruger, S., Ziolkowski, P., Pudelko, M., Bebenek, M.,
Mann, M. (2008). Constitutive and dynamic phosphorylation and acetylation sites on
NUCKS, a hypermodified nuclear protein, studied by quantitative proteomics. Proteins
73, 710–718.
71. Dobreva, I., Fielding, A., Foster, L. J., Dedhar, S. (2008). Mapping the integrin-linked
kinase interactome using SILAC. J Proteome Res 7, 1740–1749.
124 QUANTITATIVE PROTEOMICS BY MASS SPECTROMETRY
72. Wang, Z., Pandey, A., Hart, G. W. (2007). Dynamic interplay between O-linked
N-acetylglucosaminylation and glycogen synthase kinase-3-dependent phosphorylation.
Mol Cell Proteomics 6, 1365–1379.
73. Bonenfant, D., Towbin, H., Coulot, M., Schindler, P., Mueller, D. R., van Oostrum,
J. (2007). Analysis of dynamic changes in post-translational modifications of human
histones during cell cycle by mass spectrometry. Mol Cell Proteomics 6, 1917–1932.
74. Meierhofer, D., Wang, X., Huang, L., Kaiser, P. (2008). Quantitative analysis of global
ubiquitination in HeLa cells by mass spectrometry. J Proteome Res 7(10), 4566–76.
75. Liang, X., Zhao, J., Hajivandi, M., Wu, R., Tao, J., Amshey, J. W., Pope, R. M. (2006).
Quantification of membrane and membrane-bound proteins in normal and malignant
breast cancer cells isolated from the same patient with primary breast carcinoma.
J Proteome Res 5, 2632–2641.
76. Spellman, D. S., Deinhardt, K., Darie, C. C., Chao, M. V., Neubert, T. A. (2008). Stable
isotopic labeling by amino acids in cultured primary neurons: Application to brain-
derived neurotrophic factor-dependent phosphotyrosine-associated signaling. Mol Cell
Proteomics 7, 1067–1076.
77. Bendall, S. C., Hughes, C., Stewart, M. H., Doble, B., Bhatia, M., Lajoie, G. A. (2008).
Prevention of amino acid conversion in SILAC experiments with embryonic stem cells.
Mol Cell Proteomics 9, 1587–1597.
78. VanHoof, D., Pinkse,M.W., Oostwaard, D.W.,Mummery, C. L., Heck, A. J., Krijgsveld,
J. (2007). An experimental correction for arginine-to-proline conversion artifacts in
SILAC-based quantitative proteomics. Nat Meth 4, 677–678.
79. Gorg, A., Weiss, W., Dunn, M. J. (2004). Current two-dimensional electrophoresis
technology for proteomics. Proteomics 4, 3665–3685.
80. Unlu,M.,Morgan,M.E.,Minden, J. S. (1997).Difference gel electrophoresis: a single gel
method for detecting changes in protein extracts. Electrophoresis 18, 2071–2077.
81. Timms, J. F., Cramer, R. (2008). Difference gel electrophoresis. Proteomics 23–24,
4886–4897.
82. Reynolds, K. J., Yao, X., Fenselau, C. (2002). Proteolytic 18O labeling for comparative
proteomics: evaluation of endoprotease Glu-C as the catalytic agent. J Proteome Res 1,27–33.
83. Schnolzer, M., Jedrzejewski, P., Lehmann, W. D. (1996). Protease-catalyzed incorpo-
ration of 18O into peptide fragments and its application for protein sequencing by
electrospray and matrix-assisted laser desorption/ionization mass spectrometry. Electro-
phoresis 17, 945–953.
84. Angel, P. M., Orlando, R. (2006). Trypsin is the primary mechanism by which the (18)O
isotopic label is lost in quantitative proteomic studies. Anal Biochem 359, 26–34.
85. Yao, X., Afonso, C., Fenselau, C. (2003). Dissection of proteolytic 18O labeling:
endoprotease-catalyzed 16O-to-18O exchange of truncated peptide substrates. J Prote-
ome Res 2, 147–152.
86. Rao, K. C., Carruth, R. T., Miyagi, M. (2005). Proteolytic 18O labeling by peptidyl-Lys
metalloendopeptidase for comparative proteomics. J Proteome Res 4, 507–514.
87. Liu, H., Zhang, Y., Meng, L., Qin, P., Wei, J., Jia, W., Li, X., Cai, Y., Qian, X. (2007).
Non–gel-based dual 18O labeling quantitative proteomics strategy. Anal Chem 79,7700–7707.
REFERENCES 125
88. Storms, H. F., van der Heijden, R., Tjaden, U. R., van der Greef, J. (2006). Considerations
for proteolytic labeling-optimization of 18O incorporation and prohibition of back-
exchange. Rapid Commun Mass Spectrom 20, 3491–3497.
89. Wang, Y. K., Ma, Z., Quinn, D. F., Fu, E. W. (2001). Inverse 18O labeling mass
spectrometry for the rapid identification of marker/target proteins. Anal Chem 73,3742–3750.
90. Li, J., Steen, H., Gygi, S. P. (2003). Protein profiling with cleavable isotope-coded affinity
tag (cICAT)reagents:Theyeast salinitystress response.MolCellProteomics2, 1198–1204.
91. Zhou,H., Ranish, J. A.,Watts, J. D.,Aebersold, R. (2002).Quantitative proteome analysis
by solid-phase isotope tagging and mass spectrometry. Nat Biotechnol 20, 512–515.
92. Zhang, L., Guo, Y. L., Liu, H. Q. (2004). A novel class of chemically modified iodo-
containing resins: design, synthesis and application to mass spectrometry-based prote-
ome analysis. J Mass Spectrom 39, 447–457.
93. Hansen, K. C., Schmitt-Ulms, G., Chalkley, R. J., Hirsch, J., Baldwin,M.A., Burlingame,
A. L. (2003). Mass spectrometric analysis of protein mixtures at low levels using
cleavable 13C-isotope-coded affinity tag and multidimensional chromatography. Mol
Cell Proteomics 2, 299–314.
94. Zhang, R., Regnier, F. E. (2002). Minimizing resolution of isotopically coded peptides in
comparative proteomics. J Proteome Res 1, 139–147.
95. Tao,W.A.,Wollscheid, B., O’Brien, R., Eng, J. K., Li, X. J., Bodenmiller, B.,Watts, J. D.,
Hood, L., Aebersold, R. (2005). Quantitative phosphoproteome analysis using a den-
drimer conjugation chemistry and tandem mass spectrometry. Nat Meth 2, 591–598.
96. Boas, U., Heegaard, P.M. (2004). Dendrimers in drug research.Chem Soc Rev 33, 43–63.
97. Galan, J. A., Guo, M., Sanchez, E. E., Cantu, E., Rodriguez-Acosta, A., Perez, J. C., Tao,
W.A. (2008). Quantitative analysis of snakevenoms using soluble polymer-based isotope
labeling. Mol Cell Proteomics 7, 785–799.
98. Gerber, S. A., Rush, J., Stemman, O., Kirschner, M. W., Gygi, S. P. (2003). Absolute
quantification of proteins and phosphoproteins from cell lysates by tandemMS. Proc Nat
Acad Sci USA 100, 6940–6945.
99. Beynon, R. J., Doherty, M. K., Pratt, J. M., Gaskell, S. J. (2005). Multiplexed absolute
quantification in proteomics using artificial QCAT proteins of concatenated signature
peptides. Nat Meth 2, 587–589.
100. Pratt, J. M., Simpson, D. M., Doherty, M. K., Rivers, J., Gaskell, S. J., Beynon, R. J.
(2006). Multiplexed absolute quantification for proteomics using concatenated signature
peptides encoded by QconCAT genes. Nat Protoc 1, 1029–1043.
101. Anderson, N. L., Anderson, N. G., Haines, L. R., Hardie, D. B., Olafson, R. W., Pearson,
T. W. (2004). Mass spectrometric quantitation of peptides and proteins using stable
isotope standards and capture by anti-peptide antibodies (SISCAPA). J Proteome Res 3,235–244.
102. Mallick, P., Schirle, M., Chen, S. S., Flory, M. R., Lee, H., Martin, D., Ranish, J., Raught,
B., Schmitt, R.,Werner, T., Kuster, B., Aebersold, R. (2007). Computational prediction of
proteotypic peptides for quantitative proteomics. Nat Biotechnol 25, 125–131.
103. Panchaud, A., Affolter, M., Moreillon, P., Kussmann, M. (2008). Experimental and
computational approaches to quantitative proteomics: Status quo and outlook. J Proteo-
mics 71, 19–33.
126 QUANTITATIVE PROTEOMICS BY MASS SPECTROMETRY

104. Chelius, D., Zhang, T., Wang, G., Shen, R. F. (2003). Global protein identification and
quantification technology using two-dimensional liquid chromatography nanospraymass
spectrometry. Anal Chem 75, 6658–6665.
105. Liu, H., Sadygov, R. G., Yates, J. R., 3rd (2004). A model for random sampling and
estimation of relative protein abundance in shotgun proteomics.AnalChem76, 4193–4201.
106. Rappsilber, J., Ryder, U., Lamond, A. I., Mann, M. (2002). Large-scale proteomic
analysis of the human spliceosome. Genome Res 12, 1231–1245.
107. Zybailov, B. L., Florens, L., Washburn, M. P. (2007). Quantitative shotgun proteomics
using a protease with broad specificity and normalized spectral abundance factors. Mol
Biosyst 3, 354–360.
108. Chen, C. H. (2008). Review of a current role of mass spectrometry for proteome research.
Anal Chim Acta 624, 16–36.
109. Colinge, J., Chiappe, D., Lagache, S., Moniatte, M., Bougueleret, L. (2005). Differential
proteomics via probabilistic peptide identification scores. Anal Chem 77, 596–606.
110. Andersen, J. S., Wilkinson, C. J., Mayor, T., Mortensen, P., Nigg, E. A., Mann,M. (2003).
Proteomic characterization of the human centrosome by protein correlation profiling.
Nature 426, 570–574.
111. Chelius, D., Bondarenko, P. V. (2002). Quantitative profiling of proteins in complex
mixtures using liquid chromatography andmass spectrometry. JProteomeRes 1, 317–323.
112. Lasonder, E., Ishihama, Y., Andersen, J. S., Vermunt, A. M., Pain, A., Sauerwein, R. W.,
Eling, W. M., Hall, N., Waters, A. P., Stunnenberg, H. G., Mann, M. (2002). Analysis of
the Plasmodium falciparum proteome by high-accuracy mass spectrometry. Nature 419,537–542.
113. Bondarenko, P. V., Chelius, D., Shaler, T. A. (2002). Identification and relative quantita-
tion of protein mixtures by enzymatic digestion followed by capillary reversed-phase
liquid chromatography-tandem mass spectrometry. Anal Chem 74, 4741–4749.
114. Old, W. M., Meyer-Arendt, K., Aveline-Wolf, L., Pierce, K. G., Mendoza, A., Sevinsky,
J. R., Resing, K. A., Ahn, N. G. (2005). Comparison of label-freemethods for quantifying
human proteins by shotgun proteomics. Mol Cell Proteomics 4, 1487–502.
115. Ishihama, Y., Oda, Y., Tabata, T., Sato, T., Nagasu, T., Rappsilber, J., Mann, M. (2005).
Exponentially modified protein abundance index (emPAI) for estimation of absolute
protein amount in proteomics by the number of sequenced peptides per protein.Mol Cell
Proteomics 4, 1265–1272.
116. Allet, N., Barrillat, N., Baussant, T., Boiteau, C., Botti, P., Bougueleret, L., Budin, N.,
Canet, D., Carraud, S., Chiappe, D., Christmann, N., Colinge, J., Cusin, I., Dafflon, N.,
Depresle, B., Fasso, I., Frauchiger, P., Gaertner, H., Gleizes, A., Gonzalez-Couto, E.,
Jeandenans, C., Karmime, A., Kowall, T., Lagache, S., Mahe, E., Masselot, A., Mattou,
H., Moniatte, M., Niknejad, A., Paolini, M., Perret, F., Pinaud, N., Ranno, F., Raimondi,
S., Reffas, S., Regamey, P. O., Rey, P. A., Rodriguez-Tome, P., Rose, K., Rossellat. G.,
Saudrais, C., Schmidt, C., Villain, M., Zwahlen. C. (2004). In vitro and in silico
processes to identify differentially expressed proteins. Proteomics 4, 2333–2351.
117. Anderle,M., Roy, S., Lin, H., Becker, C., Joho, K. (2004). Quantifying reproducibility for
differential proteomics: Noise analysis for protein liquid chromatography-mass spec-
trometry of human serum. Bioinformatics 20, 3575–3582.
118. Strittmatter, E. F., Rodriguez, N., Smith, R. D. (2003). High mass measurement accuracy
determination for proteomics using multivariate regression fitting: Application to elec-
trospray ionization time-of-flight mass spectrometry. Anal Chem 75, 460–468.
REFERENCES 127

119. Strittmatter, E. F., Ferguson, P. L., Tang, K., Smith, R. D. (2003). Proteome analyses using
accurate mass and elution time peptide tags with capillary LC time-of-flight mass
spectrometry. J Am Soc Mass Spectrom 14, 980–991.
120. Silva, J. C., Denny,R., Dorschel, C., Gorenstein,M.V., Li, G. Z., Richardson,K.,Wall,D.,
Geromanos, S. J. (2006). Simultaneous qualitative and quantitative analysis of the
Escherichia coli proteome: A sweet tale. Mol Cell Proteomics 5, 589–607.
121. Bantscheff, M., Schirle, M., Sweetman, G., Rick, J., Kuster, B. (2007). Quantitative mass
spectrometry in proteomics: A critical review. Anal Bioanal Chem 389, 1017–1031.
122. Wang, W., Zhou, H., Lin, H., Roy, S., Shaler, T. A., Hill, L. R., Norton, S., Kumar, P.,
Anderle, M., Becker, C. H. (2003). Quantification of proteins and metabolites by mass
spectrometry without isotopic labeling or spiked standards. Anal Chem 75, 4818–4826.
123. Wong, J. W., Sullivan, M. J., Cagney, G. (2008). Computational methods for the
comparative quantification of proteins in label-free LCn-MS experiments. Brief Bioin-
form 9, 156–165.
124. Iliuk, A., J. Galan, and W.A. Tao. (2008). Playing tag with quantitative proteomics. Anal
Bioanal Chem.
128 QUANTITATIVE PROTEOMICS BY MASS SPECTROMETRY