Embed Size (px)
Citation preview

State of Connecticut
Department of Environmental Protection 79 Elm Street Hartford, CT 06106 http://ct.gov/dep
Protecting and Restoring Our Environment Annual Report 2010
Daniel C. Esty Commissioner

Table of Contents
Introduction……………………………..…………………………….….. 1
Permit Processes Analysis……………………………………………. 2
Lean Process Improvements Continued…………………………. 3
Sustainable Growth for Business………………………..………… 4
Municipal Outreach on Climate Change ………………………... 5
Compliance Assurance..…………………………………………….… 6
Enforcement and Permitting Outputs ………………………...… 6 (Enforcement Data –Federal Fiscal Year 10- 10/01/09-9/30/10)
(Permitting Data-State Fiscal Year 10- 07/01/09-6/30/10)
Compliance Rates………………………………………………………..12 (Federal Fiscal Year 10- 10/01/09-9/30/10)
The Department of Environmental Protection is an affirmative action/equal opportunity
employer and service provider. In conformance with the Americans with Disabilities Act,
DEP makes every effort to provide equally effective services for persons with disabilities.
Individuals with disabilities who need this information in an alternative format, to allow
them to benefit and/or participate in the agency’s programs and services, should call
860-424-3035 or e-mail the ADA Coordinator at [email protected]. Persons who are hearing impaired should call the State of Connecticut relay number 711.
Cover Photograph: Devil’s Hopyard State Park, East Haddam

Introduction
The Connecticut Department of Environmental Protection (CTDEP) is pleased to present its
Annual Report for 2010. In 2010 CTDEP continued to look inward to improve service to our
customers by building on efforts to streamline permitting and enforcement processes. As
2011 unfolds, CTDEP looks forward to integrating energy policy into our mission as we make
the transition to the new Department of Energy and Environmental Protection (DEEP).
During 2010, in response to Public Act 10-158, CTDEP completed analysis of its permit
processes and on September 30, 2010 submitted to the legislature its Permitting
Assessment Report. This report recommends steps that can be taken to improve the permit
process while maintaining environmental standards. The Permitting Assessment Report
covers 25 individual permits issued by CTDEP under various federal and state environmental
programs to regulate air emissions, water discharges, and waste management and to
protect inland water and coastal resources.
Given the significant report on permitting CTDEP issued in October 2010 and the time of
transition now facing the agency, this report is being issued in a condensed format to meet
legislative and federal reporting requirements. It highlights some of the more notable
accomplishments of the CTDEP during 2010 and provides the annual statistics for
enforcement and permitting.
CTDEP continued implementing Lean process improvements and conducted 11 Lean events
during 2010. A Lean Open House was held in December 2010 to showcase the
improvements achieved by the Lean initiative. CTDEP also reached out to additional
stakeholders by hosting conferences on climate change for municipal officials and a summit
on sustainability for the business community.
As CTDEP begins its 40th year, we look towards playing a key role in building the “green”
and sustainable economy Connecticut needs to prosper in the future. As we make the
transition to the Department of Energy and Environmental Protection (DEEP), we will
continue our environmental and conservation functions and couple them closely with energy
policy and pricing. The new DEEP will ensure that we think systematically about the
environment and energy together and achieve better results and greater efficiencies in the
years to come. We are committed to bringing energy and the environment together in a
manner that contributes to the economic growth of Connecticut.

2
Permit Processes Analysis
The Permitting Assessment Report, mandated by Public Act 10-158 required CTDEP to
evaluate its 25 individual permitting programs and identify "the process improvements,
additional resources, staffing and programmatic changes" needed to meet specific time
frame goals.
The time frame goals set out in the law required CTDEP to assess the feasibility of:
Deciding within 60 days whether there are deficiencies in an application (referred to
as the sufficiency review); and
Completing, within 180 days after the sufficiency determination, the technical
analysis necessary to issue a formal notice of tentative determination to approve or deny a permit.
The Permitting Assessment Report covers 25 individual permits issued by CTDEP under
various federal and state environmental programs to regulate air emissions, water
discharges, and waste management and to protect inland water and coastal resources. The
primary mechanism for implementing these programs is the issuance of permits. A permit
sets the conditions that allow an entity to perform a regulated activity – such as generating
air emissions or wastewater discharges – in a manner that protects public health and the
environment. On an annual basis CTDEP receives nearly 3,000 permit applications.
In a snapshot review of the most recent annual data from all
25 individual permit programs, nine programs met the
sufficiency goal (60 days) 100% of the time. Another four
programs do not require sufficiency reviews. With respect to
tentative determination, 13 programs met the time frame
goal (180 days) 100% of the time. Of the 25 programs, a
total of nine met the combined goals.
To gather input from Department stakeholders, CTDEP conducted more than a dozen public
listening sessions, met with five Chambers of Commerce, the Connecticut Business and
Industry Association, the Connecticut Home Builders Association and various environmental
organizations.
Recommendations to improve the timeliness of permitting decisions include:
More than 40 process changes (steps that can be taken without statutory or
regulatory changes, such as new procedures and forms);
DEP through its
25 permit
programs and 56
general permits
has authorized
29,627 current
activities.
3
More than 20 programmatic changes (which require new authorizations, such as new
general permits, and regulatory and statutory changes);
The need for an additional 53 program staff, five legal staff and six information
technology staff to consistently meet the time frame goals outlined in Public Act 10-
158; and
Additional annual funding of $500,000, largely for contractual services necessary to
improve information technology for the benefit of Department staff and customers.
CTDEP is continuing to work with our stakeholders to prioritize and implement the
recommended improvements and programmatic changes.
Public Act 10-158 contains provisions in addition to the permit assessment, and the CTDEP
responses to them are also detailed in its full report. The full report is available at
www.ct.gov/dep/permitassessment.
Lean Process Improvements Continued
CTDEP continued its Lean efforts during 2010 and an additional 11 teams participated in
Lean Kaizen events. Since CTDEP began implementing Lean process improvements in 2008,
27 programs or processes have been examined for ways to increase efficiencies and
eliminate waste. The projects have covered environmental quality, conservation and
business administration processes throughout the agency.
CTDEP developed fact sheets that highlight the results, lessons learned and transferable
knowledge from each Lean project. The projects have been grouped into six categories
including administrative, compliance/enforcement, data management, natural
resources/outdoor recreation, permitting, and support services.
CTDEP hosted a Lean Open House in December 2010 to showcase the improvements
achieved by the Lean initiative. The Lean Open House drew a large and enthusiastic crowd,
including Governor Rell, several key members of the General Assembly, a representative of
Governor-elect Malloy’s transition team and CTDEP staff that attended to learn more about
the accomplishments of the 27 teams that have taken on various projects over the past two
years.
By implementing the recommendations of the Lean teams, CTDEP has streamlined many
processes, created efficiencies and improved customer service. CTDEP will continue to look
for opportunities to apply Lean process improvements as we make the transition to the new
DEEP.

4
Sustainable Growth for Businesses
In December 2010, the Connecticut Business and Industry Association and CTDEP co-hosted
a CT Summit on Business Sustainability. The summit focused on the need in today’s
challenging economy for the private sector and state government to work together to foster
strong, sustainable economic growth.
At the summit, Connecticut businesses showcased their sustainability initiatives that save
money, increase profits, promote recognition, and offer new business opportunities.
Opportunities were provided to network with resource providers and offer input to state
leaders. More than 250 people attended the summit, which was held at the Legislative
Office Building in Hartford.
Summit attendees were invited to provide comments on what programs, policies,
incentives, or other initiatives should the State of Connecticut pursue to better support the
sustainability efforts of Connecticut businesses.
To read the comments received and sustainability highlights of Connecticut business
speakers view the Summit webpage.
2010 Lean Team Projects
Diagnostic and Therapeutic X-Ray Device Registration and Radioactive Material
Natural Diversity Database Species Review Request Processing
State Forest Management Planning
Air Quality Monitoring Data Acquisition Improvement Project
Office of Adjudications: Evaluate /Revise Permit Hearing Procedures and Rules of
Practice
Solid Waste Facility Individual Permits
Surplus Property Review Process Standardization
Coordination of Publications
Industrial Stormwater General Permit On-line Registrations
DEP's Potable Water Program Processes
SIMS Permitting Data Entry Standard Operating Procedures

5
Municipal Outreach on Climate Change
In November 2010 CTDEP and ICLEI-Local Governments for Sustainability co-sponsored the
first Connecticut Municipal Climate Network meeting. The meeting brought together more
than 50 local government representatives to discuss, share, and collaborate on successful
climate mitigation and adaptation programs, including the Adaptation Resource Toolbox.
Additional needs that were identified by the participants included: better understanding of
existing climate change and adaptation planning; financial information necessary to justify
municipal sustainability efforts; ready-to-use planning tools for small towns, including
practical adaptation measures such as rain gardens; and incorporation of storm surge and
river flood modeling in adaptation planning. Spotlight topics also included plans for
developing a climate adaptation clearinghouse for Connecticut municipalities.
The CTDEP hosted a Municipal Workshop in March 2011 entitled “An Introduction to Energy
Benchmarking, GHG Inventories, and Recycling.” The workshop was attended by nearly 60
municipal representatives and included information for municipalities to improve their
recycling programs, an introduction to greenhouse gas inventories and a hands-on
demonstration of energy benchmarking. Information was also provided on the Municipal
Climate Change Intern Program known as
SOAR.
SOAR (Sustainable Operations: Alternative
and Renewable) Energy Initiative, is a
program that combines both adaptation
and mitigation activities and is operated at
five Connecticut Community Colleges and
funded in part by the U.S. Department of
Labor. SOAR students gain practical
training in careers related to clean energy
alternatives and renewable energy
resources, including sustainable facilities,
alternative transportation technology,
building efficiency, and sustainable
landscape ecology and conservation.
The Town of Groton is one of 10 Connecticut communities to be awarded a SOAR Climate Change intern. A student at Three Rivers
Community College in Norwich, is working with the Town to advance climate change adaptation strategies begun at the Groton Climate Change Workshops, including the identification of planning areas based on their relative resiliency to climate change,
and the ongoing town-wide sea level rise vulnerability assessment. In several other towns, SOAR students are conducting mitigation projects,
including benchmarking of municipal buildings, developing municipal greenhouse gas inventories, and
working to install or purchase clean energy technologies.
6
The CTDEP and the Connecticut Clean Energy Fund together use funds provided by the
Emily Hall Tremaine Foundation in New Haven to pay SOAR students to work as interns
helping municipalities to develop climate change adaptation and mitigation projects that the
towns identify.
Compliance Assurance
The mission of the CTDEP is to protect the public health and welfare and to conserve,
improve and protect the natural resources of the State of Connecticut. As trustee of the
environment for present and future generations, the CTDEP assures compliance with
environmental requirements by minimizing pollution through regulation, enforcement, and
licensing procedures; by managing the State’s parks and forests and other recreational
amenities; and by developing and coordinating compliance assistance and educational
programs with other public and private agencies.
The CTDEP carries out its mission in a way that encourages the social and economic
development of the State while preserving the natural environment and the life it supports.
It is the policy of CTDEP to achieve the highest level of environmental protection for the
citizens of Connecticut by use of traditional enforcement methods together with financial,
regulatory, and compliance assistance, including the facilitation and promotion of pollution
prevention techniques, to produce a comprehensive compliance assurance program.
Appropriate use of the various means of compliance assurance will protect public health and
the environment in the most cost-effective manner.
Enforcement and Permitting Outputs
The Department maintains a strong enforcement presence by conducting compliance
inspections, reviewing monitoring reports, taking appropriate enforcement action and
enforcing strict permit conditions. This combination enables the Department to assure that
compliance with environmental requirements is achieved and maintained by the regulated
community.
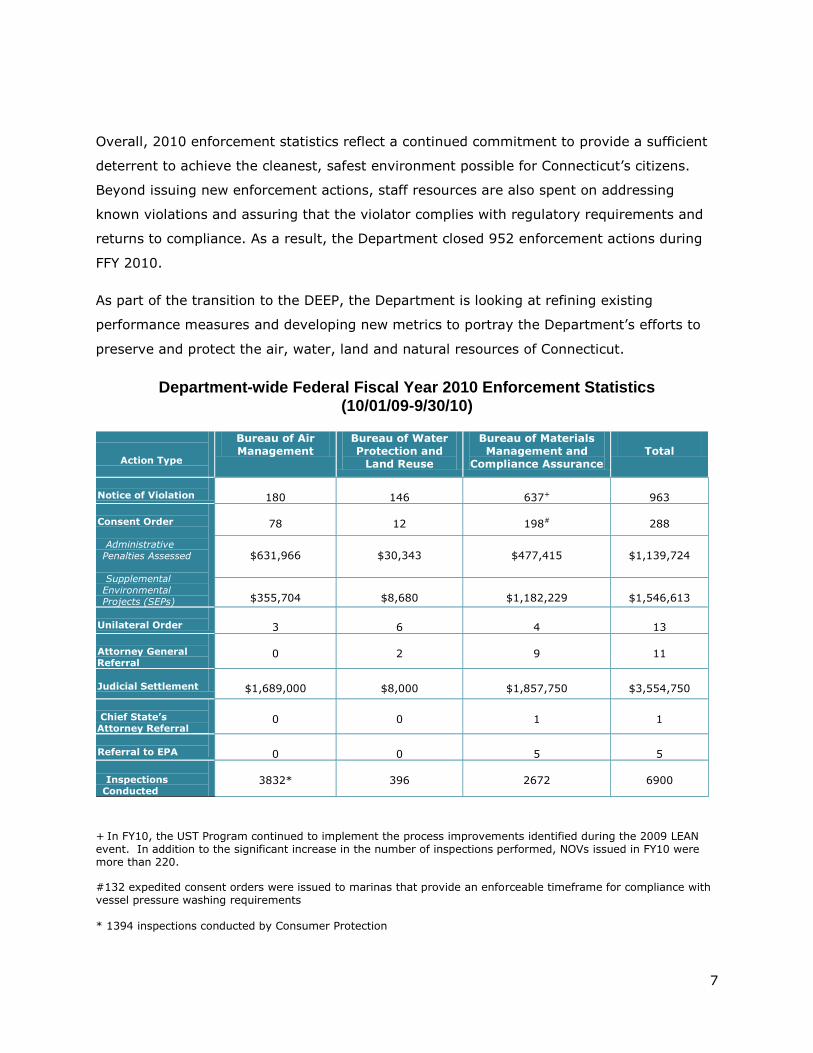
The following are the FFY10 enforcement statistics for the Bureaus of Air Management;
Materials Management and Compliance Assurance and Water Protection and Land Reuse as
well as the five-year Department-wide average. Also included are the compliance rates for
particular industry sectors in certain CTDEP media programs as well as the Department’s
report on permitting efforts as required by CGS 22a-6r.
7
Overall, 2010 enforcement statistics reflect a continued commitment to provide a sufficient
deterrent to achieve the cleanest, safest environment possible for Connecticut’s citizens.
Beyond issuing new enforcement actions, staff resources are also spent on addressing
known violations and assuring that the violator complies with regulatory requirements and
returns to compliance. As a result, the Department closed 952 enforcement actions during
FFY 2010.
As part of the transition to the DEEP, the Department is looking at refining existing
performance measures and developing new metrics to portray the Department’s efforts to
preserve and protect the air, water, land and natural resources of Connecticut.
Department-wide Federal Fiscal Year 2010 Enforcement Statistics (10/01/09-9/30/10)
Action Type
Bureau of Air Management
Bureau of Water Protection and
Land Reuse
Bureau of Materials Management and
Compliance Assurance
Total
Notice of Violation
180
146
637+
963 Consent Order
Administrative Penalties Assessed
Supplemental Environmental Projects (SEPs)
78
12
198#
288
$631,966
$30,343
$477,415
$1,139,724
$355,704
$8,680
$1,182,229
$1,546,613
Unilateral Order
3
6
4
13
Attorney General Referral
0
2
9
11
Judicial Settlement
$1,689,000
$8,000
$1,857,750
$3,554,750
Chief State’s Attorney Referral
0
0
1
1
Referral to EPA
0
0
5
5
Inspections Conducted
3832*
396
2672
6900
+ In FY10, the UST Program continued to implement the process improvements identified during the 2009 LEAN event. In addition to the significant increase in the number of inspections performed, NOVs issued in FY10 were more than 220.
#132 expedited consent orders were issued to marinas that provide an enforceable timeframe for compliance with vessel pressure washing requirements * 1394 inspections conducted by Consumer Protection

8
Department-wide Five-year Average
Activity
2006
2007
2008
2009
2010
Five
Year
Average
Referrals(AG/EPA/CSA)
36
23
32
38
17
29
Orders
103
104
128
188
301#
165
Notices of Violation
631
643
831
848
963+
783
Total Enforcement
Actions
770
770
991
1074
1281
977
Inspections
6791
6910
8314
7459
6900*
7275
+ In FY10, the UST Program continued to implement the process improvements identified during the 2009 LEAN
event. In addition to the significant increase in the number of inspections performed, NOVs issued in FY10 were more than 220.
#132 expedited consent orders were issued to marinas that provide an enforceable timeframe for compliance with
vessel pressure washing requirements
* 1394 inspections conducted by Consumer Protection
Enforcement Actions Over Five Years
0
200
400
600
800
1000
1200
2006 2007 2008 2009 2010
Federal Fiscal Year
Nu
mb
er
of
En
forc
em
en
t
Acti
on
s I
ss
ued
Notices of Violation Formal Enforcement Actions*
*Formal enforcement actions include administrative consent and unilateral orders and referrals to EPA, the
Attorney General’s Office and the Chief State’s Attorney’s Office.

9
State Fiscal Year 2010 Permitting Statistics (7/1/09-6/30/10)
Section 22a-6r of the Connecticut General Statutes requires the Commissioner to report on permitting efforts, including: revenues received from permit application fees and any revenues derived from the processing of such applications as set forth in Chapter 439 of the General Statutes; the CTDEP’s appropriation from the general fund for permitting activities; and the number and amount of permit application fees refunded; the number of permit applications received; the number of permit decisions issued and the number of permits pending.
Bureau Permit Type Applications Received
Permits Issued/ Denied
Applications Closed1
Applications Pending (as of
6/30/10)
Air
General Permits 4 3 5 3
Individual 243 110 188 246
Short Process 0 0 0 0
Hazardous Waste
General Permits 0 0 0 0
Individual 152 122 154 34
Short Process 0 0 0 0
Inland Water Resources
General Permits 53 35 54 25
Individual 138 103 149 102
Short Process 25 7 8 90
Office of Long Island Sound Programs
General Permits 26 22 25 11
Individual 99 138 154 144
Short Process 209 194 204 37
Pesticides General Permits 0 0 0 0
Individual 0 0 0 0
Short Process 495 512 514 38
Solid Waste General Permits 163 95 103 107
Individual 40 5 24 89
Short Process 51 69 74 140
Water Discharges
General Permits 1,092 1,626 1,720 267
Individual 116 45 110 439
Short Process 49 37 39 25
All DEP
General Permits 1,344 1,783 1,909 417
Individual 797 527 783 1,077
Short Process 3,682 2,561 2,585 1,441
Totals All Apps 5,823 4,871 5,277 2,935
1 Applications Closed represents the total number of applications that were closed including: permits issued; applications
which are withdrawn, rejected for insufficiency, or denied on the technical merits of the application; and applications which were received but no permit is required.

10
Median Number of Days to Close Permit Applications1 from
7/1/09-6/30/10 for All Applications Received
Bureau Permit Type Median Number of Days to Close Applications
Air
General Permits 85
Individual 238
Short Process N/A
Hazardous Waste
General Permits N/A
Individual 52
Short Process N/A
Inland Water Resources
General Permits 90
Individual 134
Short Process 1
Office of Long Island Sound Programs
General Permits 71
Individual 332
Short Process 42
Pesticides General Permits N/A
Individual N/A
Short Process 29
Solid Waste General Permits 47
Individual 181
Short Process 783
Water Discharges
General Permits 29
Individual 689
Short Process 77
1Applications Closed represents the total number of applications that were closed including: permits issued; applications
which are withdrawn, rejected for insufficiency, or denied on the technical merits of the application; and applications which were received but no permit is required.

11
Permit Related Revenue Information
Revenues Received from Permit Application Fees and Any Revenues Derived
from the Processing of Such Applications*
7/1/09-6/30/10
$2,173,306
* These figures represent application fees due on submittal and permit issuance fees. They do not include annual fees and other registration fees such as medical and industrial X-ray, pesticide registrations, UST’s, property transfer, LEP, etc.
General Fund Appropriation
7/1/09- 6/30/10 $9,472,114
Amount of Permit Application Fees Refunded*
(7/1/09 - 6/30/10)
Application Fees Refunded for a Total of $39,441
* Refunds reflect withdrawn applications, duplicate fees, etc.

12
Federal Fiscal Year (“FFY”) 2010 Compliance Rates
Compliance rates provide an indication of how well a sector is complying with regulatory
requirements at the time of inspection. An analysis of compliance rates assists CTDEP in
understanding which sectors and areas need compliance assistance or additional
enforcement.
The following tables show detailed compliance rates for FFY2010 for particular industry
sectors in the following CTDEP media programs: Hazardous and Solid Wastes, Pesticides,
Wastewater Discharges, Underground Storage Tanks, Marine Terminals, PCBs and Air
Emissions. (The Federal Fiscal Year runs from October 1 through September 30.)
Unless otherwise noted the compliance rate for each category was calculated as follows:
% Compliance = 100- # of enforcement cases initiated x 100
# facilities inspected
Underground Storage Tanks
The Underground Storage Tank (UST) program has continued in FFY 10 with a high inspection rate due, in part, to the Federal Agency Policy Act of 2005 requirement that UST facilities be inspected
every three years, and to the program’s Lean event.
Inspection
Category
Inspections
Conducted FFY 10
# of Enforcement
Cases Initiated in
FFY 10
% Inspected
Facilities in
Compliance
SOC*
Operational/Structural
1,071 N/A
(713 sites in full
SOC)
67%
General Compliance
(all types-SOC & non-
SOC)
1424**
230
84%
*Based on only significant operational compliance points required by EPA. **Overall total includes SOC inspection number (1,071) plus all other types of inspections..
PCBs Seventy-eight percent of inspected PCB facilities were compliant in FFY 10
Inspection
Category
Inspections
Projected
FFY 10
Inspections
Conducted
FFY 10
# of
Enforcement
Cases
Initiated in
FFY 10
%
Inspected
Facilities in
Compliance
Referrals 8-13 8 4 50%
Complaints 12-17 15 5 67%
Clean-up
Sites
10-15 21 1 95%
Other
Neutral
Scheme
10-15 7 1 86%

13
Marine Terminals Of the FFY 10 inspected marine terminals, 93% were found to be in compliance.
Inspection Type Inspections
Conducted
FFY 10
# of Enforcement
Cases Initiated in
FFY 10
% Inspected
Facilities in
Compliance
Federal Inspections 4 1 75%
State Inspections 26 1 96%
Waste Engineering and Enforcement Division- Hazardous and Solid Waste
Hazardous waste inspections for TSFs, LQGs and SQGs met or exceeded the projected inspection number for FFY 10. Inspected treatment storage facilities achieved a 80% compliance rate and SQGs
achieved a 90% compliance rate.
Inspection
Category
Inspection
Projected
FFY 10
Inspections
Conducted
FFY 10
Total #
Facilities
by
category
# of
NOVs
FFY 10
# of
inspections
with SNC
(2)
% of SNC
Non-
compliance
%
inspected
facilities in
compliance
Treatment Storage Facility (1)
5 5 183 1 0 0 80%
Large Quantity Generator
28 33 279 19 6 18% 42%
Small Quantity Generator
30 30 1781 3 2 7% 90%
Transporter
5 5 172 2 1 20% 60%
Volume Reduction Facility
15 17 32 5 0 0% 71%
Resource Recovery Facility
2 4 7 1 0 0% 75%
Transfer Station
15 3 146 3 2 67% 0%
Landfill
10 2 31 2 0 0% 0%
Intermediate Processing Center
1 2 5 0 0 0% 100%
Complaints
N/A 149 N/A 49 13 9% 67%
(1) Active facilities (2) SNC (Significant Non-compliance) – The violator/violation is significant enough to require formal
enforcement response.

14
Waste Engineering and Enforcement Division- Pesticides Program
Inspected producer establishment were 100% in compliance and market place facilities were 95%
compliant for FFY 10.
Inspection Category
Inspections
Projected
FFY 10
Inspections Conducted
FFY 10
# of Enforcement Cases Initiated in
FFY 10
% Inspected Facilities in Compliance
Agricultural Use & Complaint Follow-Up
14
15
8
47 %
Non-Agricultural
Complaint/Concern Follow-Up & use investigation
70
69
27
60%
Producer Establishment
5
6
0
100% Market Place
85 88 4 95 %
Certified Applicator Records
120
67
32
52%
Restricted Use Dealers
10 11 3 73%
Totals 304 256 74
65 NOV
7 CO
2 Lic.
Revocation/denial
71%
15
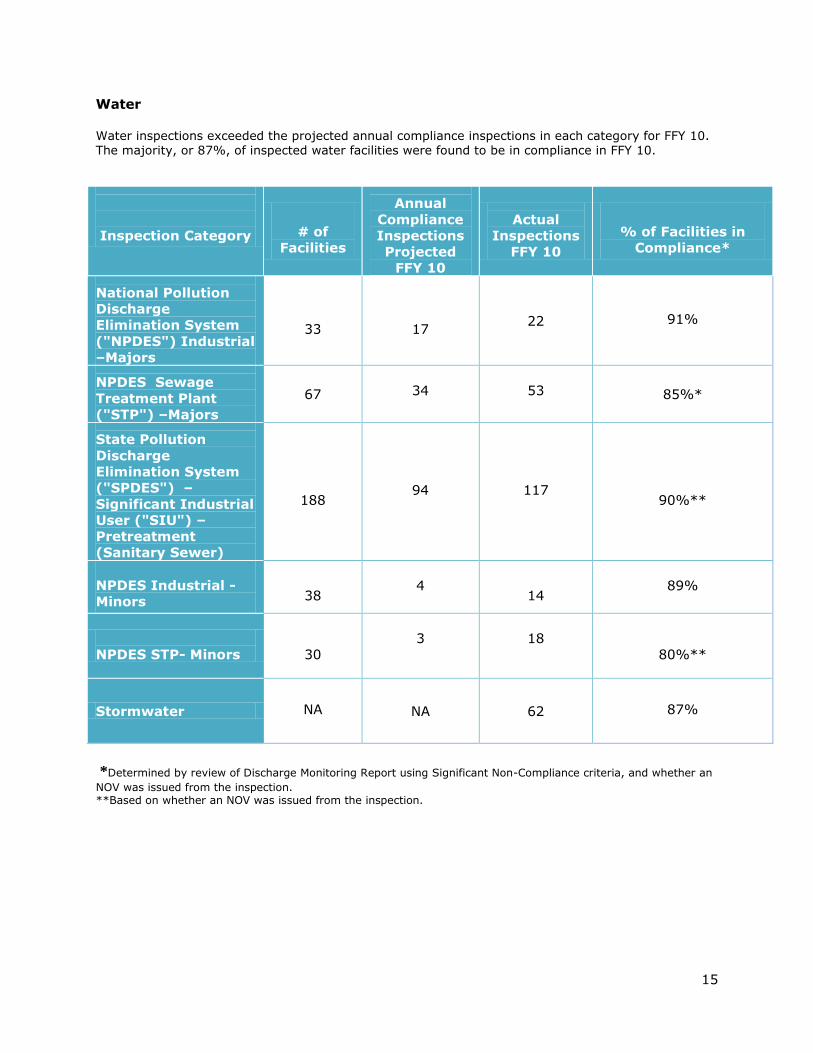
Water
Water inspections exceeded the projected annual compliance inspections in each category for FFY 10. The majority, or 87%, of inspected water facilities were found to be in compliance in FFY 10.
Inspection Category
# of
Facilities
Annual
Compliance
Inspections
Projected
FFY 10
Actual
Inspections
FFY 10
% of Facilities in
Compliance*
National Pollution
Discharge
Elimination System
("NPDES") Industrial
–Majors
33
17 22 91%
NPDES Sewage
Treatment Plant
("STP") –Majors
67
34
53
85%*
State Pollution
Discharge
Elimination System
("SPDES") –
Significant Industrial
User ("SIU") –
Pretreatment
(Sanitary Sewer)
188 94 117
90%**
NPDES Industrial -
Minors
38 4
14 89%
NPDES STP- Minors
30
3
18
80%**
Stormwater NA NA 62 87%
*Determined by review of Discharge Monitoring Report using Significant Non-Compliance criteria, and whether an
NOV was issued from the inspection. **Based on whether an NOV was issued from the inspection.

16
Air Compliance Profile by Facility Type for Federal Fiscal Year 2010
Inspection
Category
# of
Facilities in
Categoryi
Reports
Reviewedii
Inspections
Projected iii
Inspections
Conducted
Title V 84 225 42 42
General
Permit
246 242 56 56
Minor 1,500 24 15
Stage II 1,533 2,500 (660 DEP) 2,192 (724 DEP)
Complaints 500 509
Other follow
up
100 482
Only 3% of the below facility categories were found to be in significant non-compliance.
Inspection
Category
# of
Facilities in
Category
# of
Facilities
with non-
complianceiv
Compliance
Ratev
# of
Facilities
with
SNCvi
SNC
Ratevii
Title V 84 13 85% 11 13%
General
Permit
246 15 94% 3 1%
Minor 1,500 11 99% 4 0.3%
Stage II 1,533 516 66% 57 4%
i For Title V and General Permit to Limit Potential to Emit (GPLPE) sources this includes applicants and those who
have permits/registrations under the program.
ii Includes Semi-Annual Monitoring Reports and Compliance Certifications.
iii For Stage II this total includes the Consumer Protection inspections.
iv For Stage II violations include DCP red tags, DCP repairs and NOVs.
v The Compliance Rate = [[the number of facilities in the category minus the number of facilities in the category
with one or more noncompliance issues] divided by the number of facilities in the category] multiplied by 100.
vi Significant noncompliance (SNC) is defined as a definitive Connecticut high priority violation (HPV) or a Federal
HPV for Title V, GPLPE and Minor Sources. For Stage II facilities, SNC means there was either an actual failure of
the vapor recovery equipment or a failure to demonstrate that the facility was maintaining a properly operating
vapor recovery system.
vii SNC rate = [number of facilities with SNC divided by the number of facilities in the category] multiplied by 100.