Embed Size (px)
Citation preview

"t344INDUSTRY AND ENERGY DEPARTMENT WORKING PAPERENERGY SERIES PAPER No. 35
Prospects for Gas-FueledCombined-Cycle Power Generationin the Developing Countries
FILE COPY
Report No. :11346 Type: (MIS)
May 1991 Title: PROSPECTS FOR f"AS-FUELED COMBI:Author:Ext.: 0 Room: Dept.:MAY 1991
The World Bank Industry and Energy Departmsrnt, PRE
Pub
lic D
iscl
osur
e A
utho
rized
Pub
lic D
iscl
osur
e A
utho
rized
Pub
lic D
iscl
osur
e A
utho
rized
Pub
lic D
iscl
osur
e A
utho
rized

PROSPECrS FOR GAS-FUELED
COMBINED-CYCLE POWER GENERATION
IN THE DEVELOPING COUNTRIES
Prepared by
Edwin Moore andEndque Crousfilat
Energy Development DivionIndustry and Energy Department, PRE
may 1991
Copyright (c) 1991The World Bank1818 H Street, N.WWashington, D.C 20433USA
This report is one of a series issued by the Industry and Energy Department for theinformation and guidance of Bank staffs The report may not be published or quoted asrepesenting the view of the Bank Group, nor does the Bank Group accept responsibilityfor its accuracy or completeness.

This paper explains the development histoiy and present state of combined-cycle power generation technology. The relative economics of gas-fueled combined-ycleplants and other fossil fuel power plant alternatives are reviewed and the paper concludesthat gas-fueled combined-cycle is the least cost base-load power generation alternative forboth large and small systems with fuel prces in the order of gas at $2.50/MMBTU, coalat $40/ton, residual oil at $15/bbI and distilate oil at $25hbbl. Gas-fueled combined-cleremains the least-cost solution for gas prices up to $3.30 and $4.10 per MMBTU, for largeand small systems, respectively. The paper also shows that 50 developing countries havesignificant proven gas reserves and tnat about one-half of these countries would havesufficient gas reserves for a relatively large combined-ycle development at the powermarket levels expected for the late 1990s in each country.

The authors are grateful for the assistance of Ms Kay McKeough whodeveloped the data base for the gs reserves and production analysis and participated inthe review of the prospects for power from gas in the developing countries, and for thehelp of Jose Escay who prepared the power alternative screening curves The asistanceof John Besant-Jones, Granvilie Smith, Peter Cordukes, Winston Hay and John Homerwho reviewed the paper is also acknowledged.

Table of Contents
bae No.
EXECUTIVE SUMMARY .................................... I
1. MNrRODUC1ION .................. ... .* * ..***. **. . S
2. ENVIRONMENTAL CONSIDERATIONS ............... 6FossilFuel *.........................****** 6Effect of Coal Use for Eectity .....ct............. 7
3. REVIEW OF THERMAL PLANT ALTERNATIVES ........ 9Recprocating Engines . ....................... . 9Conventional Steam Plants .............. ....... 10Combined-Cycle Units ........ ....... ................ 10Future Thermal Technologies .................... 11
4. THE GAS TURBINE ............ ...**. ............ 12History of Gas Turbine Development ............... 12Sinple-Cycle Gas Turbine ......................... 13Nitrogen Oxide Emissijn Control .................. 17Gas Turbine esign ........ ..... .............. 18Acroderivatie Versus Industrial Gas Turbines ......... 19
5. TECOMBNE-CCE UNT............2ypes of Combined-Cycle Units................... 20
Combined-Cycle Modular Installation ............... 23Fuel for Combined-Cycle Units ................... 23Operational Consideration on Combined-CycleUnis.................... 23Developed Country Combined-Cycle Installations ....... 24Developing Country Combined-Cycle PlantPerformance ................................ 24
6. THE ECONOMICS OF COMBINED-CYCLE UNFTS ....... 27Objectie , ................................... .** ..... 27Large Sytem Economc Anlysis i.... ............... 27Smal System Economic Analysis .................. 32Summniary ........ .... ........... ............. ..... # .. 37

PaeNo.
7. PROSPECrS FOR COMBINED-CYCLE POWER GENERATIONIN THE DEVELOPING cOUNTRIES .................. 38
Avalabity ofGas ....... ........ 38World Gms Reea andProducion ............... 38Gas RequirementsforPower ............ ..... ...... 40ProspectsforCombined-Cyle Units................. 40Summary of Advantags of Combined CyceTechnology ................................ :........ 41Recommendations for Combined-Cyle Eipaionin the Developing Countries ..................... 42
List f Fis
1. The Rise in Atmospheric Carbon Dioxide ................ 6
2. Sinple-Cycle Gas Turbine .............. .................... . 13
3. Gas Turbine CogenerationF acflity ........ ............ 14
4. Steam-Injected Gas Turbine with Process Steam ............ 15
5. Steam-Injected Gas Turbine with Intercooler .............. 16
6. Emission Requirement Trends ........................ 17
7. Combined-(ycle Unit .............................. 20
8. Combined-Cycle Cogeneration Unit .................. too 21
9. Combined-Cycle Shaft Arrangements.................... 22
10. Plant Factor Impact on Generation Costs forLarge Systems .. .. ... .... .. .......... 29
11. Fuel Price Impact on Generation Costs for LargeSsems....................... 29

Pago No.
12. Discount Rate Impact on Generation Costs forLarge Systems ....... .................................. 30
13. Plant Factor Impact on Generation Costs forSmaDl Systems ......................................... 34
14. Fuel Price Impact on Generation Costs for SmallSysteras ........................................... 34
15. Discount Rate Impact on Generation Costs forSmall Systems ......................................... 35
16. Evolution of Proven Reserves of Oil and NaturalGas in the World .......... ........................ 39
List of Tables
1. Comparison of Generation Costs ....................... 3
2. 1989 and 1999 Electricity Supply in the DevelopingCountriee .. ........... .. . . . .* .......... 7
3. Compartive Emissions for Gas Combined-Cycle andCoal Steam Plants .............................. .... 8
4. Thermal Plant Generation Costs on Large Systens ........ .. 28
5. Sensitivity Tests on Large System Generation Costs .. ........ 31
6. Themnal Plant Generation Costs on SmaD Systems .......... 33
7. Sensitivity Tests on Small System Generation Costs .......... 36
List of Annexes
1. Typical Combined-Cycle Unit ArrangementsAvailable from Manufacturers ......................... 43

Pag N-oA
2. List of Gas Turbine Manufacturers ..................... 44
3. Steam Plant Conversions to Combined-Cycle inIrehad .................. ...................... 46
4. Midland (U.S.) Gas-Fired Combined-Cycle CogenerationPlant ............. . ..... * *. ..... * ..... 48
5. TEPCO (Japan) LNG Combined-Cycle Plant .............. 49
6. Summary of Recent World Bank Financed Combined-Cycle Projects . ......... * .... *..* *CCCC*CCC C C C 51
7. North American Combined-Cycle Unit Availabiity i.... ....... 54
& USAID-Financed Paldstan and Egypt Combined-CyclePlants . ..... .. ..C . ..C.C. .. ......C. 55
9. Comparative Assessment of Generation Costs forLarge Power Systems C........ C.......... ... . . 58
10. Comparative Assessment of Generation Costs forSmal Power Systenms ......... C........C....... C.C. 59
11. 1989 and 1990 Estimates of Proven Natural GasReserves in The World ........... C....C.C.C....... 60
12. Proven Reserves/Production Ratios ..................... 61
13. Natural Gas Worldwide Gross and Marketed Productionin 1989 ........ ........ ......... 62
14. Fuel Requirement for a 1000 MW Gas-Fueled Combined-Cycle Plant .CCC .C ......CC..C........... 63
15. Comparison of Power Capability from Available GasReserves and Power Markets ... C.....C.C ..CCC ...CCC .. 64
b. Actual 1989 and Planned 1999 Combined-Cycle Capabflityin the Developing Countries ......... CC ...... C ....C ... 66

ROBPGISFORt D&S5-PELE COMBIPM13CY (CIEP ,POWER
IN 1 DEVFInPING COUTRI
E£XECUTI-VE S{JM,MARY
1. Many developing country electric utilities are experiencing financialdifficulties, but are still faced with high capital requirements for sytem expasion tomaintain the supply of electricity. Developing countries with natural gas reserves havean opporunity to provide electricity using gas-fueled combined-cycle units (formed fromgs turbines), which is a lower cost (capital and total) option than other fossil fuelgenerating sources or typical hydro projects. Gas turbine power technology has evolvedover the past 40 years based largely on mllitay and commercial aircraft engine designsfrom wbich the light aeroderivative (et engine) power gas turbine in sizes up to 40 MWhas been developed, in parallel with the development of heavy industrial (frame) tpe gasturbines specifically designed for power applications in sizes up to 150 MW already inoperation and 200 MW under test. Combined-cycle units (or blocks) utilize one or more(tpicaly two) such gas-turbine generators each exhausting into a waste heat boilerproviding steam for a single steam turbine-generator formmg a combined-qcle umt orblock. Combined-cycle blocks of 450 MW are in service at many locations and 600 MWblocks are being marketed.
2. The advantages of the gas-fueled combined-ycle unit can be summared asfollows:
a) lower capital cost of about $600AcW compared to steam thermal at$800-1500/kW depending on whether it is conventional (coal or oil)steam or coal fluidized bed and on the degree of stack emissioncontrol equipment;
b) thermal efficiency of about 50% compared to 40% or less forconventional steam or fluidized bed coal plants;

2
z) lowest global warming effect of any fossil fuel plant, e.g, carbondioxide (CO2) emissions less than one-half of those of conventionalcoal steam plants;
d) gas is the cleanest of the fossil fuels giving virtually no sulphur dioxide(S02) or particulate emissions, and therefore has a substantialadvantage over oil and coal;
e) low environmental impact because the plant land and cooling waterrequirements are less than for other fosil fuel power plants;
f) esthetically more acceptable because the plant, stack and cooling towerheights are considerably lower than for conventional steam plants;
g) construction time of only 2 or 3 years compared to 5 years forconventional steam plants,
h) modular installation of each combined-ccle unit in three or morestages to match the demand givng earlier (partial) unit output; and
i) shorter startup and loading times because of the faster response timeof the gas turbine and the lower operating pressures of the steamcycle compared with conventional base-load steam plants.
3. A disadvantage of the combined-cycle unit is i.si limited fuel-switchingcapabflity compared to the conventional steam unit, which can be designed for gas, oil,and coal firir&, or the low-speed diesels for small systems, which can operate on gas,distillate or residual Combined-ycle units can run on gas or dstilate but operation onresidual oil is difficult and results in reduced plant output, high maintenance and shortenedlif, so if the fuel is residual, oil steam plants or diesels are the best options. Combined-cycle units are also capable of operation on gas from the coal gasification plants underdevelopment. In the meantime, residual oil is in plentiful supply and may be priced belowgas, so multi-fuel-designed steam plants could provide greater fuel flexibility.
4. The economic advantage of the gas-fueled combined-ycle unit for base-loadoperation (40% to 75% range of plant factor) is borne out by a comparison of the totalgeneration costs for the fossil fuel alternatives on large (5600 MW plus) and small (1000MW) power systems, as shown in Table 1.

3
Table 1: Compadison of Generatiog Costs
Plant Type Generation Costs in USeJkWh
409o 65% 75%Plant Plant PlantFato Factor Fco
Larg Systems
Gas combined-ycle($2SOIMMBTU gas) 5.6 4.2 4.0Coal steam($40/ton coal) 7.0 4.9 4.4Ol steam($15/bbl residual) 7.4 5.5 5.1Distillate combined-cycle($25/bbl distillate) 7.1 5.7 5A
For Small Systems
Gas combined-cycle($2.50IMMBTU gas) 6.9 5.0 4.6Coal steam($40/ton coal) 9.3 6.3 5.7Oil steam($15/bbl residual) 9.5 6.8 6.2Low-speed diesel ($15/bbl residual) 87 6.3 5.8Distillate combined-ycle($25/bbl distilate) 8.4 6.5 6.1
5. Sensitivity tests have shown that the gas-fueled combined-ycle option forbase-load generation (65% plant factor in the base case) continues to be the least-costoption for both large and small systems for gas prices up to about $3.50/MMBTU or withcombined-cycle capital costs about 20% higher ($720IkW). However, the economicadvantage of the combined-cycle unit is very dependent on achieving a high plant factor.Although at equal low plant factors combined-ccle units improve their competitiveness,they are no longer economic if their plant factor is about 20% lower than that for coalsteam, i.e. if the combined-qcle unit achieves only a 45% plant factor while the coal steamplant achieves a 65% plant factor.

4
IL The operating record to date of combined-ycle units In the developingcountries has not been good, apparently due to inadequate preparation for the trensferof this high technolog power alternative. Future combined-ycle projects should includethe following considerations to in:piove operations:
a) use of a turnkey contract approach to define single rerponsibilty forquality control;
b) long-term operation and maintenance arrgements wth tha,manufacturer or an experienced contractor to provde continuoustrainig monitoring and technolog transfer,
c) satisfactory supply arrangements for consumable, ovwrhaul andemergency spare parts;
d) long-term natural gas supply arrangements; and
e) possi'ble use of a Build-Own-Operate (BOO) concept under which anexperienced manufacturer/operator would install and operate thecombined-ccle plant and sell the power output to the developingcountry electric uality.
7. There are about 50 developing countries that have proven natural gsreserves and one-half of these countries would have sufficient gs reserves for a relativelylre combmned-ycle development that could satisfy their power requirements during along period (about 20 years) beyond the year 2000. Therefore these counties shoudseriously consider gas-fueled combined-yle plants as candidates for base-load generation,takng into account alternative uses for the available gas, relative locations of gas reservesand power markets, and other local factors

S
1.1 The development over the last two decades of lare (200 MW) efficient (35%)gas turbines means that developing countries with natural gas reserves can benefit fromrelatively low cost electicity supply using gas-fueled combined-qcle units (or blockls)which are formed of one or more gas turbines exhausting into heat recovery boilerssupplying steam to a steam turbine. Moreover, using clean gas for electricity productioninstead of oil or coal has the advantage of minming the environmentad impact of powergeneration from fossil fuels. Therefore cotnbined-ycle technology has the potential forproviding cheaper electricity for developing countries with access to natural gas reserveswhile also Improving the global atmospheric enionment
1.2 This paper has been written to provide an overvew of the recent improvementsin gas turbine technology that make combined-cycle power generation a viable option forthe developing countries. It also documents the combined-cycle experience in thedeveloping countries, describes the operational problems to date, and recommends newapproaches to improve combined-cycle performance in the developing countries.
1.3 In the foDowing sic chapters the paper raises environmental considerations offossil fuel nse for electricity production, reviews the fossil fuel power alternatives, presentsthe bistory of gas turbine development, descnrbes the technical features of combined-ycleunits, anayzes the relative economics of gas-fueled combined-cycle units and fossil fuelalternatives, and reviews the prospects for gas-fueled combined-cycle power generation inthe developing countries.

6
2. ENVIRONMEAL CONSIDERATIONS
Fossil buel
21 Fossil fuels in the form of oil, coal and natural gas account for about three-fourths of the world's energy consumptiont This high use of fossil fuels is causing seriousimpact on the earths atmosphere and the environment due to carbon dihndeconcentrations, depsc.tiions from sulphur dioide and nitrogen oadde emissions, and thegreenhouse effect c%useJ by some of these and other pollutants which is responsible tosome degree for t -w. -/arming. About one-fourth of the fossDl fuel consumption in theworld is for power geXi.i"ation so there is a definite link between intensity of electrification,type of power genezation, and the quality of the environment. For example, there issubstantial evidence that use of coal containing high quantities of sulphur for powergeneration (and for industry) in the northeastern United States is causing acid rain thatis damaging forests and acidifying lakes in New England and eastern Canada. Similarly,Europes forests, lakes and buildings show evidence of deterioration due in part to airpollution.
2.2 Global atmospheric concentrations are increasing rapidly according to someobservations. For example, the atmospheric carbon dioxide level in Hawaii has increased11% over a relatively short 22-year period based on local measurements, as shown inFigure 1. This is important because Hawaii located in the vast Pacific Ocean has noindustry or significant pollution sources so air measurements there truly represent averageglobal atmospheric conditions.
Figure 1
THE RISE IN ATMOSPHERIC CARBON DIOXIDE
I ! I I IIL I I i I A I I V
will Ij|il iii ;I i
§1tS T f~~~~~~jjtu tsa tiiina rofisa "sena,.a varition.
194 6 1 9^ 197 19*0 19V2 I64 14 8996
,AA
* snsatm vw"#-sx hdrtwa ."vati"

7
Effect of Coal Use for Electricity
23 World power generating capacity fueled by coal, oil and gas totals about 1700gigawatts (GW) and comprises two-thurds of the world's total generating capacity of 2600GW '. The developing country share of total generating capacity is about 500 OW or one-fifth of the total capacity. However, public electricity use in the developing world isgrowing at 6-9% p.a. compared to only 2-3% p.a. in the developed world, so thedeveloping world share of the environmental impact due to fossil fuel use for electricityin the world will increase in the future. For example, if these electricity growth ratescontinue the developing world generating capacity vwll equal that of the developed worldby 2020. Unless the practice changes, another factor that will also accelerate thedeveloping countries becoming atmospheric polluters due to fossil fuel use for electricityis the almost complete lack in the developing countries of flue gas desulphurizationequipment at plants using high sulphur coal. Most developing country plants have onlyelectrostatic precipitators or fabric filter bag collection systems on existing conventionalsteam plants to limit stack particulate emissions, and have no sulphur control equipment.Meanwhfle, in Europe, Japan and the United States today's environmental standardsrequire desuphurization equipment on new steam plants burning high sulphur coals andretrofits on existing plants, so developed country sulphur emissions are being reduced.
2.4 Coal use for electricity production in developing countries is expected to be anncreasing contnbutor to atmospheric emissions. mhis is verifed by the data in Table 2
from a recent Bank study9 which shows the actual 1989 and forecast 1999 breakdown ofelectricity supply in the developing countries. They indicate that coal-based thermal supplyalreaay provides almost one-half of the electricity in the developing countries, and coal'sdominant position will continue.
Table 2: 1989 and 1999 Electricit Suppl in the Develop-ing Countries
1989 1999TWh %% TWh.
Hydro 674 33.2 1,207 31.5Geothermal 11 06 29 0.8Nuclear 80 3.6 212 5.5Oil thermal 224 11.0 255 6.6Gas thermal 120 5.9 332 86Coal thermal 907 44.7 1,793 46.6Net imports 14 _07_ _ 16 0.4TOTAL 2,030 100.0 3,844 100.0
1 1987 U.N. Energy Statistics Yearbook.
2 E. Moore and 0. Smith "Capital Expenditures for Electric Power in the DevelopingCountries in the 1990s", IEN Energy Paper No. 21, February 1990.

8
2.5 In 1989 electricity output from coal-based thermal supply in the developingcounties was about 900 terawatthours (TWh) and is expected to increase to about 1800TWh by 1999. Since there are sigificant sulphur levels in some developing country coals,these coal volumes will certainly affect the envionment. Any shift away from coal use inconventional steam plants for electricity in the developing countries to gas-fueled thermalplants, such as combined cycle technology, wil certainly imply an environmentalimprovement. In addition to sulphur reductions, NOx and C02 emissions can also bereduced substantially using gas-fueled combined-ccle plants instead of coal thermal plantswith scrubbers. According to a recent Siemens technical paper covering present-daytecbnoloa the emissions from gas-fueled combined-qcle plants are less than one-half ofthose from conventional coal steam plants, as shown in Table 3.
Table 3: Comparative Emissions for Gas Combined-Cycle and Coal Steam Plants
Coal Steam Gas-FueledEmissions & Wastes per kWh with Combined-
Scrubber Cycle
C02, grams 830 380CO, mg 75 34S02, mg 600 0N02, mg 600 350UHC, mg 0 18Waste water, grams 15 0Ash, grams 34 0Rejected heat, MJ 4.3 2.6
Source: G. Haupt, . S. Joyce and K. Kuenstle"Combined-Cycles Permit theMost Environmentally Benign Conversion of Fossil Fuels to Electricity,"Siemens AG-KWU Group, June, 1990.

9
3. REVIEW OF hERMAL PLANT ALTERNATIVES
Reciprocating Engines
3.1 The advantages of and potential for combined-ccle units are apparent from areview of the fossil fuel thermal plant options. The simplest thermal plant as used forelectricity supply to individual consumers or small industries is the small gasoline-fueledinternal combustion engine-generator set, based on the Otto cycle using spark plugs toignite gasoline in one or more cylinders. Set sizes vary from a few kilowatts (kW) witha single cylinder to 100 kW or larger multi-cylinder sets using automotive, locomotive, ormarine-type engines.
3.2 A larger reciprocating engine for village or regional electicity supply is the dieselengine based on the Diesel cycle in which oil fuel ignites spontaneously at high cylinderpressure near the end of the compression stroke. Diesel engine sizes vary from large, low-speed (100-200 rpm), two-ycle, multi-cylinder, 50 MW, 1,500-ton engines several storieshigh, through medium-speed (400-700 rpm), four-cycle, 2 to 25 MW engines, to small high-speed (1000 rpm or more), four-cycle 0.2 to 2 MW engines, with variations of these threebasic engine types. Diesel fuels are typically heavy fuel oil (residual) for low-speedengines, heavy fuel oil or diesel oil (distillate) for medium-speed engines, and diesel oil forhigh speed engines. Gas dual-fuel (gas and oil) engines are also available. Engine lives,assuming average annual operation of 5000 aours, are typically five years for high-speedengines increasing to 20 years for low-speed engines.
3.3 All internal combustion engines are subjected to cyclical mechanical and thermalstresses resulting in considerable wear due to the reciprocating action with metal-on-metalcomponents, the cylinder pressure changes, and the high combustion temperatures. Thereare physical limits to the maximum power attainable per cylinder, so many cylinders arestacked in-line or V-formations for the larger engines. Even a 50 MW diesel engine sizeis not sufficient for application on large systems of, say, 5,000 MW size as might berequired for a major regional system such as for Frankfurt or Washington, D.C. Thus thediesel set is not a serious competitor to the combined-cycle unit for installation on largepower systems.
3.4 By comparison with the diesel engne, the gas turbine and steam turbine arerotating units, not recprocating. They have radial clearances and no metal-on-metalwear areas except for bearings, gland systems, and valving arrangements. Therefore theserotating units have the potential for longer lives with appropriate maintenance.

10
rmenional Steam Plants
3.5 Conventional steam plants are a mature technology that reached a unit size limitof 1300 MW at supercritical steam conditions of 240 bar (3500 psi) some years ago, butreliability and cost considerations resulted in a backing-off of both unit sizes and steamconditions, sacrificing efficiency somewhat. Today steam unit system additions aretypically 500 to 900 MW with steam conditions of 164 bar (2400 psi), 5650C1565VC(1OSf0F/100S0F), and design thermal efficiencies of 40%. However, typical multi-plantsystem-wide steam plant efficiencies may average only 34%. Steam plants can be fueledwith coal, oil, natural gas, even biomass, or some combination of these, but each plantmust be designed for the available fuels. Capital cost ranges for steam plants are $800-15001kW or even higher depending on the size, fuel, site conditions, form of cooling, stackemission control equipment, etc.
3.6 An important difference between steam units and combined-ycle units is thateach steam plant usually must be designed for and field-constructed at the particular site,to suit each application. Conversely, the combined-cycle unit is typically of standardizedmodular design, so components can be largely built in the factory with final assembly inthe field. For example, the large waterwaD boilers for a steam unit must be fieldassembled, whereas heat recovery boilers for combined-cycle units are typically factorypackaged in modules. However, in the smaller steam plant sizes some manufacturers alsoare moving towards partial modular construction to reduce costs.
3.7 In a steam plant, fuel is burned in a furnace at or near atmospheric pressurewith large volumes of air being provided by forced and induced draft fans, and heat istransferred to a closed water/steam cycle that develops steam at high temperature andpressure to drive a steam turbine coupled to a generator. The turbme exhaust must becondensed to water to minimize turbine back pressure and recover condensate, requiringlarge heat transfers to a condenser cooled by a lake, river, ocean, wet or dry coolingtower, etc. This lost energy plus residual heat in the stack emission gases limits thepossible thermal efficiency to the 34-40% range. Due to this thermodynamic limitation,there has been no significant increase in steam plant efficiencies for electricity productionfor many years. However, overall steam cycle efficiency can be increased if the steamturbine is combined with a process steam supply facility to form a cogeneration package(i.e. electricity plus steam). Using some of the energy normally wasted to the condenserfor process steam in a cogeneration plant can increase the thermal efficiency to about80%.
CombinedCycle Units
3.8 The main considerations that are focusing attention on the combined-cycle unitzare the large gas turbine sizes now available at relatively low capital cost and with highefficiency. Gas turbines of about 150 MW size are already in operation manufacturedby at least four separate groups-General Electric and it Licenmees, Asea Brown Boveri,

11
Siemens, and Westinghouse/Mitsubishi. These groups are a.1o developing testing and/ormarketing gas turbine sizes of about 200 MW. Combined-cycle units are made up of oneor more such gas turbines, each with a waste heat steam generator arranged to capplsteam to a single steam turbine, thus forming a combined-ycle unit or block. Annex Ishows partial lists of combined-cycle block sizes offered by three major manufacturers(Asea Brown Boveri, General Electric and Siemens); the range is roughly 50 MW to 500MW and costs are about $600/kW. Annex 2 shows a general lst of almost 40 gas turbinemanufacturers and the unit sizes offered by each. Combined-cycle efficiencies are alreadyover 50% and research aimed at 1370°C (25000F) turbine inlet temperature may make60% efficiency possible by the turn of the century, according to some gas turbinemanufacturers.
Future Thermal Technologies
3.9 Today, the competing base-load thermal plant alternatives for large systems arebasically coal-fired steam units and natural gas-fueled combined-cycle units, assuming gasis available. In countries having gas, usually the relatively high pnce of oil rules out bothresidual-fueled steam units and distillate-fueled combined-cycle units for base-loadoperation. Moreover, gas-fueled steam units have higher capital cost and lower efficiencythan gas-fueled combined-ycle units. Ongoing development work may permit use ofcombined-ccle units in conjunction with coal gasification, coal liquefaction, and coal-firedpressurized fluidized bed applications. It is this future adaptability of combined-cycle unitsfor coal, as well as natural gas, while achieving high efficiencies at relatively low capitalcosts, that holds high promise for the combined-ycle unit. One pressurized fluidized bedcoal-burning plant is already in operation in Sweden, using a combined-cycle unit arrangedso the hot gases from coal combustion directly power a specially designed gas turbine aspart of a combined-cycle unit, in conjunction with a steam turbine supplied from steamcoils in the fluidized bed, which also contains limestone to absorb sulphur and otherpotential pollutants. This Swedish unit may be indicative of future combined-cycletechnology developments.
3.10 On the negative side, the performance record to date of high-technologycombined-cycle units in the developing countries is lower than in developed countries andthe high ambient temperatures prevailing ih many developing countries result in substantialderating of the combined-cycle units, because the swallowing capacity of a gas turbine-generator, which is constant in volume terms, is reduced in mass-flow terms as warm airis less dense than cool air. These considerations are causing some developing countries,for example Bangladesh, to continue installing steam units instead of combined-ycle units,even when the fuel is gas.

12
4. ThE GAS TUREB1NE
Histol! of Gas Turbine Development
4.1 Gas turbines were first developed in the early 1900s as stationary prime moverfor industrial application, but sizes and efficiency were very low. Durig the 1939-1945world war gas turbine development progressed rapidly for military aircraft appicationsAfter the war the commercial airline industries proceeded to switch from piston enginesto jet engines (gas turbines) and from gasoline to jet fuel (a light distfllate). Over the past45 years the contmuing gas turbine development has been driven largeWly by militaxydemands for more powerful and lighter engines for military aircaf As engines havebeen improved the commercial aircraft manufacturers have adopted the proven designsfor passenger and cargo aircraft
4.2 In the aircraft jet engine, the power output of the turbine is used to drive theair compressor providing air for fuel combustion to develop the hot gas mass for the jetexhaust that develops the thrust powering the aircraft. On early jet engines water injectionwas used to increase the mass flow and therefore the thrust during takeoff In thestationary gas turbine the turbine also drives a generator or mechanical equipment. Theeariest post-world-war stationary gas turbine installations were aeroderivatives adapted forindustrial appl;-,ations such as driving gas pipeline compressors. A large number of thesecompressor drives installed in the late 1940s are still in use today. Gas turbines for powergeneration were developed in the early 1950s by either adapting the aircraft engine forpower use or by drawing on steam turbine technology to develop new designs of industrial(frame) type gEs turbines that were heavier and, as some observers claim, more ruggedthan the light-weight, low-clearance aeroderivative gas turbines.
43 Early aeroderivative power gas turbine designs inolved one or more jet enginesexhausting into a power turbine driving a generator. However, there are three distinctdifferences between aircraft use and power applications that hindered early use of the jetengines for power. First, in aircraft service the engine operates at above rating for shortperiods during takeoff and then is throttled back to the power level required for cruisingspeed, while power base-load generation requires the rated power continuously. Second,in aircraft service the objective is high aircraft availability, so maintenance involves periodic(and rapid) engine changes at airports near maintenance c-nters, whereas for powergeneration the target is minimum engine downtime so long engine life and on-sitemaintenance are the primary targets. Tird, in aircraft service the air density varies withaltitude, modified by the ram effect of the aircraft's speed, whereas for power generationthe air density is fairly constant for any given elevation. For these reasons, theaeroderivatives had to be modified to develop special designs for power generation, whilealso drawing on the more rugged industrial gas turbine design experience.
4.4 It should be pointed out that the early power applications of gas turbines werenot tow successful. Most of those were aeroderivatives and designers had not fulyappreciated the change in operational requirements for power generation. Early fuel-to-

13
power efficiencies were only 20W and the availability was low, resulting in the use of gastubines mainly for peaidng dut, with cyclical thennal and mechanical stresses that causedmany unit failures. The major power disturbance involvng the eastern Canada/US.utilities in November 1965 resulted in a wave of gas turbine purchases for standby, black-start and peaking service with the emphasis on fast startr" -v 10 to 15 minutes to meetemergencies. This early demand for standby/pealdng rvict .Jom oil-fueled units, coupledwith the higher oil prices starting in the 1970s, overshadowed the potential use of gasturbines in the form of naturalgas-fueled combined-cyle units for base-load operation.The availability of large volumes of natural gas for base-load operation emerged in the late1970s and early 1980s, when alternative uses for nata gas did not materialize, and thisaccelerated combined-ycle development and use. It should be noted that from the late1970s until quite recently US. law prevented use of natural gas for power generation,because it was considered a premium resource that should be conserved for other uses.
Simple-CQcle Gas Turbine
4.5 The modern power gas turbine is a high technology package comprisingcompressor, combustor, power turbine and generator, as shown in Figure 2.
Figure 2,
Simple-Cycle Gas Tubine
EXHAUST
GAS TURBINE l _ELECTRICITY
9 K A~~~~~~ENERATORrOIPRESSOR TURONE
INTAKE AIR
Source: Williams & Lason,"Aerodernative Turbines for Stationazy Power", The Center forEnera and Enironmental Studies, Princeton University, Ma 1988 Figures3,4,5,7 & 8 from the same source.

14
4.6 In a gs turbine, large volumes of air are compressed to high pressure in a multi-stage compressor for distribution to one or more combustion chambers where fuel Isadded The high temperature and pressure combustioa gases from the combustioncbambers power an axial turbine that drives the compressor and the generator befreexhausting to atmosphere. In this way the combustion gases in a gas turbine power thetubine directly, rather than requiring heat transfer to a water/steam cycle to power asteam turbine, as in the steam plant The latest gas turbine designs use turbine inlettemperatures of 126(YC (2300T) and compreion ratios as high as 30:1 (foraeroderivatives) giing thermal efficiencies of 35% or more for a simple-cyce gas turbine.Since the gas turbine exhaust gas temperature is still at about 540C (10OT), this exhaustenergy provides an opportunity to add a heat recovery boiler to supply proce steam toform a cogeneration facility (Figure 3).
Fig= 3i
Gas Turbine Cogeneration Facility
EX -AU5
FUNEL,A~~"X^r-~ A RECOEV
r b I~~~~ I ~STEAM GENERAT
GAeS TURBINE ElECTRCITY
vG< AENERATOR
SourcOe MPRe i eSOR
INTAKE AIR
Souce: See Figure 2 source

15
4.7 In any cogeneration application a problem develops in tying to balance steamand power outputs to match the respective demands. Cogeneration projects are typicallyassociated with industrial instaations where the process steam requirement determines thelevel of operation. The available cogenerated power output is absorbed by the industryand/or the utility power system. One solution that permits marmizlng power output forany given steam demand is to reinject steam Erom unused steam generating capabitydirectly into the gas turbine, insofar as the design will allow, to increase both the poweroutput and the efficiency by using more of the otherwise wasted exhaust energy (Figure4). The arrangement is known as the steam-injected-gas-turbine (STIG) and has theadded advantage of reducing the nitrogen oxide (NOx) emissions because the combustiontemperature is lowered.
Figure 4
Steam-Injected Gas Turbine with Process Steam
PROCESS
STEAM GESEAGN O
Source:R See Figure 2source
|tUTK AIR
Source: See Figure 2 source

16
4.8 The steam-injected.gas-turbine anrangement is typically applied to aeroderivative-type gas turbines because these are designed with excess mass flow capacity. The steaminjection facility may be provided independent of an cogeneration facility as a means ofincreasing the power output and efficiency through full steam injection. Sometimes aninteroooler i added (Fiue 5) between the high pressure and low presure sections of theair compressor to cool the combustion air, while stil obtaning bigh firng temperaturesto incrwe efficiency.
Fig= S
Steam-lnjected Gas Turbine with Intercooler
SNorE AS i 2 source
_ < GZNtlt^~~"NtAW
C" _ ~ n
Souce: See Figure 2 source

17
Ntren Oxide Emission Control
4.9 Control of NOx etassions has been the subject of extensive development workby the gas turbine manufacturers during the 1980s as environmental standards became evermore stingent, particularly in densely populated areas such as Los Angeles in the US. orTokyo in Japan. Figure 6 shows that allowable NOx levels in these cities are only 10 ppmby volume. However, it should be noted that these levels itay be considered extremelylow for developing countries.
EMISSION REQUIREMENT TRENDSIo,
USPA
-so
j tZO STWN. C^lJfOIIS LMOPE ~ ~ ~ ~ ~ ~~M
20 _ 6 6 US e 52
l , * *, l *; l' ty- ~~~LO fS NE° ITEPCO)
j 0 82 *4 so as 90 *2
I ~~~~~~IOT14.038
Note: BACr is best available control technology
Source: General Electric Co.
4.10 The NOx problem is particularly difficult because design changes to achieveinreases in efficiency and output by increasing the initial firing temperature also increasethe production of NOx due to the fixation of atmospheric nitrogen in the high-temperature flame. Various methods are used to limit the NOx formation includingkeeping the gas-air miture lean, using special combustors to average out temperatures,injecting water (or steam in a unit with heat recovery boiler) in conjunction with the fuelin the combustor, and sometimes using selective catalytic reduction (SCR) equipment toclean up the exhaust gases. NOx levels can be reduced to 25 ppm or lower with thesemeasures from levels of 300 ppm for natural gas-fueled gas turbines with no correctivemeasures.

18
Ga Turbine Design
4.11 In gas turbine desig the firing temperature, compression ratio, mass flow, andcentrifugal stresses are the factors limiting both unit size and efficiency. For example,each 550C (100I ) firing temperature increase gives a 10-13% output increase and a 2-4% efficiency increase. The most critical areas in the gas turbine determining the engineefficiency and life are the hot gas path, i.e., the combustion chambers and the turbine firststage stationary nozzles and rotating buckets. The components in these areas representonly 2%lo of the total cost of the gas turbine, yet they are the controlling factor in limitinggas turbine output and efficiency. The development process takes time, however, becauseeach change of material may require years of laboratory and field tests to ensure itssuitability in terms of creep strength, yield Eimit, fatigue strength, oiddation resistance,corrosion resistance, thermal cycling effects, etc. Manufacturers use various combustorarrangements: General Electric has several combustors mounted in a ring around theturbine; Asea Brown Boveri sometimes has a single combustor above the turbine; Siemenshas two combustors, one on each side of the turbine. Gas turbines can be fueled withnatural gas, diesel oil (distillate), and even residual or crude oil if appropriate customizedfuel treatment facilities are installed and properly operated.
4.12 Turbine nozzles and buckets are cast from nickel super alloys and are coatedunder vacuum with special metals (platinum-chromium-aluminide) to resist the hotcorrosion that occurs at the high temperatures encountered in the first stage of theturbine, particularly if contaminants such as sodium, vanadium and potassium are present.Orly a few parts per million of these contaminants can cause hot corrosion of uncoatedcomponents at the high firing temperature encountered. With proper coating of nozzlesand buckets and treatment of fuels to m .mize the contaminants, manufacturers claim thehot-gas-path components should last 30,000 to 40,000 hours of operation beforereplacement. It should be noted that it is the parts replacement, particularly the hot-gas-path parts, that gives rise to the relatively high maintenance cost for gas turbines (typicalO&M annual costs of 4% of the capital cost).
4.13 The continuing improvements in firing temperatures and compression ratios haspermitted manufacturers to increase the operating performance on the same basic gasturbine frame or housing. For example, General Electric introduced its Frame 7 seriesin 1970 with a rating of 45 MW, a firing temperature of 900°C (1650'F) and an air flowof 0.8 million kgs (1.8 million lbs) per hour. Through many changes and upgrades thelatest Model F of the same Frame 7 series has a rating of 147 MW, a firing temperatureof 1260°C (230() and an air flow of 1.5 million kgs (3.3 mitlion Ibs) per hour. One ofthe major advances made was to air cool nozzles and buckets using bleed air from thecompressor to increase the firing tempetature while limiting the metal temperatures of thenozzles and buckets to withstand hot corrosion and creep. TIis limiting of the maxmumtemperature through air cooling while simultaneously increasing the mass flow with moreair compressor capacity permits higher power output. To increase the Enal compressorpressure additional compressor stages are added on the compressor rotor assembly to givehigher compression ratio thus providing additional turbine power output. Typical industrial

19
gas turbine compression ratios are 16:1 and aeroderivative ratios are 30:1 with roughly50% of the total turbine pover of either type beinga required just to drive the compressor.Compressor blading is special stainless steel, possibly coated by electroplating with nickeland cadmium to resist pitting in salt and acid environments. Compressor designs havebeen quite effective, as evident by the 200,000-hour life of some early compressorsinstalled in the 1950s.
4.14 The gas turbine has the inherent disadvantage that reduced air density with highambient temperature or high elevation causes a significant reduction in power output andefficiency, because the mass flow through the gas turbine is reduled. A 280C (50'F)increase in ambient temperature above ISO conditions of 15°C (59°F) results in about a25% output reduction and a 10% higher heat rate. Similarly, at 1000 meter (3300 ft)elevation the gas turbine output would be 15% lower than at sea level. Steam plants anddiesels are not affected to the same degree by ambient air temperature and elevationchanges.
Aeroderivativ Versus Industrial Gas Turbines
4.15 The advanced gas turbine designs available today are largely due to the hugesums that have been spent over the last 50 years to develop effective jet engines formilitary applications, including their adaptation as gas turbine propulsion systems for navalvessels. The commercial aviation, electric power and to a lesser extent, the sea and landtransportation industries, have benefitted accordingly. Given the aircraft designer's needfor engine minimum weight, maximum thrust, high reliability, long life and compactness,it follows that the cutting-edke gas turbine developments in materials, metallurgy andthermodynamic designs have occurred in the aircraft engine designs, with subsequenttransfer to land and sea gas turbine applications. However, there are weight and sizeHmitations to aircraft engine designs, whereas the stationary power gas turbine designersare seeking ever larger unit sizes and higher efficiency.
4.16 To emphasize this difference in approach, today the largest aeroderivative powergas turbine is probably General Electric's 40 MW LM6000 engine with a -4C% simple-cycle efficiency and a weight of only 6 tons. This engine is adapted from the CF6-80C2engine that is used on the CF6 military transport aircraft. By comparison, GeneralElectric's largest industrial gas turbine, the Frame 9 Model F has an output of about 200MW, an open-cycle efficiency of 34%, but is huge compared to the LM6000 and weighs400 tons. The aeroderivative is a light weight, close clearance, high efficiency power gasturbine suited to smaller systems. The industrial or frame type gas turbine tends to bea larger, more rugged, slightly less efficient power source, better suited to base-loadoperation, particularly if arranged in a combined-cycle block on large systems. There isno significant difference in availability of the two types of gas turbines for power use,based on the August 1990 Generation Availability Report of the North American ElectricReliability Council. For the period 1985-1989 the average availability of 347 jet engines(1587 unit years) was 92% and that for 575 industrial gas turbines (2658 unit years) was91%.

20
5. THE COMBIED-CYCLE UNIT
Tps of Combieed-Cycle Units
5.1 The combined-ycle unit combines the Rankine (steam turbine) and Brayton(gas turbine) thermodynamic cycles by using heat recovery boilers to capture the enerpin the gas turbine exhaust gases for steam production to supply a steam turbme as shownin Figure 7.
Figure 7
Combined-ycle Unit
COOLING TOWER
SoECTRICeTY S F 2sr
STEAM TUR91NE _SEMP
2 < C~~~~~~ENERATOR
Alt
Source: See Figure 2 source

21
5.2 The combined-cycle unit can be arranged so the waste heat boiler providesproces steam for industrial purposes as well as steam to drive a steam turbine, forminga cogeneration unit as shown in Figure &
CombinedCycle Cogeneration Unit
COOLING TOWERg
Source: See Figue 2 eCESS SA
CUECSICITY"-eF
STEAbl TURBIE PUMP"
MS FUR81~~GNERAO
Source: See Figure 2 source
5.3 Ga dampers are often provded so the s turbine exhaust can bypas theheat recovery boiler allowing the gas turbine to operate if the steam unit is down formaintenance. In earlier designs supplementary oil or gas firing was also included to permitsteam unit operation with the gas turbine down. This is not normaly provided on recentcombined-cycle designs, because it adds to the capital cost, complicates tie control system,and reduces efficiency.
5.4 Sometimes as many as f;ur gas turbines with individual boilers may beassociated with a single steam turbine. The gas turbine, steam turbine, and generator maybe arranged as a single-shaft design, or a multi-shaft arrangement may be used with eachgas turbine driving a generator and exhausting into its heat recovery boiler with all boilerssupplying a separate steam turbine and generator (Figure 9).

22
Combined-Cycle Shaft Arrangements
SINGLE SHAFT ^
C1ST~~AE S
MULTI SHAFT
Source: General Electric Co.

23
Cornbinedr&-9e Modular Installation
5.5 One significant advantage of combined-ycle units is that the capacity can beinstalled in stages with short lead time gas turbines being installed initially (1 to 2 years)followed later by heat recovery boilers with the steam turbines (3 years total). In this wayeach combined-ycle unit (i.e. block) can be installed in three (or more) roughly equalcapacity segments. The modular arrangement of combined-ycle units also facilitatesgeneration dispatching because each gas turbine can be operated independently (with orwithout the steam turbine) if part of the combined-cycle unit is down for maintenance orif less than the combined-cycle unit total capacity is required. This may give a higherefficiency for small loading than if the total capacity was operated. Furthermore, sincecombined-cycle units are available in sizes of roughly 50 MW to almost 500 MW (and 600MW are expected to be available soon with 200 MW gas turbines), there are manyselection possibilities for most sizes of power system. Another point favoring the stagingof combined-ycle units is that the gas turbine (or combined-ccle) per kilowatt cost doesnot seem to increase significantly for smaller units, as is the case for steam units due partlyto the high cost of the substantial civil works necessary for steam plants regardless ofsteam unit size. Finally, combined-ycle units can be installed in 3 years while a steamunit typically requires 5 years, and once committed there is no power output from a steamunit until the complete unit is available.
Fuel for Combined-CVle Units
5.6 Using present technology the combined-cycle unit can be fueled with naturalgas, distillate, and even crude or residual oil with appropriate fuel treatment. Fueling withcrude or residual oil, however, definitely results in extra capital costs for fuel treatmentequipment. Operations suffer due to additional operating costs for additives to counteractcontaminants such as vanadium, lower availability due to additional maintenance and watercleaning shutdowns to remove blade deposits, and reduced life because there is a greatertendency for hot gas path corrosion due to blade deposits and corrosion. The daily (oreven more frequent) testing of the residual or crude oil for contaminants with appropriateadjustments of fuel treatment is critical to prevent damage to the gas turbine. Even withgood operation there will be a reduction in efficiency with crude or residual oil fueling toreduce firing temperatures, as recommended by most manufacturers for this mode ofoperation, and due to the blade deposits which build up between water-washing intervals.The gas turbine has to be shut down periodically for cleaning and allowed to cool beforewashing can be done by injecting water while rotating the unit using the starting motor.
Operational Considerations on Combined-ycle Units
5.7 The gas turbine is the main component that requires maintenance oncombined-cycle units. All manufacturers recommend specific intervals for hot-gas-pathinspections and for major overhauls, which usually involve hot-gas-path part changes.During overhauls the condition of aeroderivatives may require that the complete engineor at least major components be sent to overhaul centers, while the industrial gas turbines

24
usually wil require only part changes on site. The type of fuel and mode of operation arecritical in determining both the maintenance intervals and the amount of maintenancework required. It is estimated by one manufacturer that burning residual or crude oil willincrease maintenance costs by a factor of 3, assuming a base of 1 for natural gas, and bya factor of 1.5 for distillate fueling. Similarly, maintenance costs wil be three times higherfor the same number of fired hours if the unit is started, i.e. cycled, once every fired hour,instead of starting once every 1000 fired hours. Peaking at 110% of rating will increasemaintenance costs by a factor of 3 relative to base-loa operation at rated capacity, forthe same number of fired hours.
5.8 The control system on combined-ycle units is largely automatic so, after astart is initiated by an operator, the unit accelerates, synchronizes and loads with automaticmonitoring and adjustment of unit conditions in accordance with preset progams. Thenumber of operators required in a combined-ccle plant therefore is lower than in a steamplant.
eeloped Country Combined-Ccle Installations
5.9 The earliest combined-cycle projects were conversions of existing gas turbinesto increase the output and efficiency without additional fuel by installing heat recoveryboilers and steam turbines. Another type of conversion was the repowering of existingsteam plants by replacing the existing boilers with heat recovety boilers and gas turbinesto utilize the existing steam units and plant infrastructure. Annex 3 explais how theElectricity Supply Board of Ireland converted two old oil-fired steam plants to gas fueledcombined-ccle units in the late 1970s, used initially for base-load operation but changedrecently to mid-range generation. Annex 4 explains how a $4 billion sunk cost in the USMidland nuclear plant was partly utilized by installing twelve Asea Brown Boveri 85 MWgas turbines and heat recovery boilers to supply the two 350 MW steam units originalyntalled for the nuclear plant. This combined-cycle cogeneration plant will supply 1380
MW of power to Consumers Power Co. and process steam plus 60 MW of power to DowChemical Co. The world's largest regasified LNG-fueled combined-ycle plant is inoperation near Tokyo in Japan and is described in Annex 5. Fourteen 165 MW single-shaft combined-cycle units serve as mixed base-load and mid-range generation on the41,000 MW Tokyo Electric Power Co. system. The plant capacity is 2,310 MW at 150Cambient decreasing to 2,000 MW at 32C. A unique feature is the low NOx emission levelof 10 ppm due to the use of selective catalytic reduction equipment.
Developing Country Combined-ycWle Plant Performance
5.10 Annex 6 explains the features of seven Bank-financed (FYS&690) combined-qcleprojects totalling 2,638 MW in India, Thailand, Egypt, Malaysia, and Pakistan. The projectsizes vary from the 1,500 MW (5 x 300 MW blocks) India project financed in FY86 to theFY88 Malaysia project with two 30 MW gas turbines as part of a future combined-qcleplant. The dollar per kilowatt capacity costs vary from $592IkW for a new 1,080 MWcombined-cycle plant in Egypt to $875/kW for a steam addition to convert four gas

25
turbines at Multan in Pakistan to a combined-ycle plant. Although the operatingperformance of combined-cycle units in North America is reported to be satisfactory withavailability factors of about 85% (Annex 7), the developing country experience is lessfavorable, and in some countries the performance has been poor. The followingparagraphs summarize recent information on combined-cycle performance in severaldeveloping countries.
i) Bangladesh
There are substantial gas reserves in the eastern half of Bangladesh, so combined-cycle technology should be a logical generation candidate for this country. Unfortunately,the operating experience has been poor on a small, UK-financed GEC combined-cycle unitinstalled at Ashuganj in the early 1980s. Based on this experience, the Bangladesh PowerDevelopment Board (BPDB) prefers to install gas-fired steam units. This situation isreflected in a recent article by a consultant on system planning activities in Bangladesh:
wThe BPDB have rather limited and somewhat unsatisfactoxy experienceof their one CC unit, and their FOW for the smaller gas turbines whichthey have operated for a much longer period of time seem to be higherthan average by a factor of at least two, and possibly more than three.
Faced with these facts a cautious approach to planning was adoptedusing base-load regime but with high FORs for CC plant. With thisapproach, selection of CC plant by the program is limited and gas-firedsteam plant claims most of the gas allocation available."
ii) Pakistan and Egypt
USAID financed the 600 MW (2 x 300 MW blocks with 110 MW GeneralElectric gas turbines) Guddu gas-fueled combined-ycle plant in Pakistan and the 300 MW(100 MW steam addition to 8 x 25 MW General Electric gas turbines) Talkhagas/distillate-fueled combined-ccle plant in Egp USAID's consultant, RCG/Hagler,Bailey, Inc. has reviewed the operational performance of these two plants as summarizedin Annex & The availability of the plants has been quite reasonable - in the 80-85%range - but efficiency has been lower than expected without a clear explanation of thereasons for the shortfall. Gas turbine component failures are the causes of most of theforced outages on these two combined-ccle plants.
ill) India
To date only limited operational performance data are available on the 5 x 300
3 Forced Outage Rates

26
MW Bank-financed combined-cycle units in India which were commissioned recently(Annex 6, para 9). During the commisionimg runs some blades failed on one gas turbinereportedly due to poor alignment; the manufacturer (Mitsubshi) made repairs and nofurther trouble has been reported. These five combined-cycle blocks are operating on gasand the National Therr ' : ower Corporation (NTPC) reportedly is satisfied with theirperformance and plans installing additional combined-cycle units. However, full operationof the combined-cycle plants has not been possible due to power contract disputes. Thegas price has not been finalized, so the NTPC selling price to the State Electricity Boardshas not been resolved, giving some uncertainty concerning the load dispatching of thecornbined-cycle units.
iv) Thailand
The early operation of the gas-fueled, Bang Pakong 772 MW combined-cycleaddition reportedly was troubled by low gas turbine start-up reliability, difficulties in fuelchangeover, vibration, gas damper distortion, gas supply problems, and the lower systeminertia of the combined-cycle units. The plant availability is understood to be only about70% at present. Nevertheless, the Electricity Generating Authority of Thailand is planningto install more gas-fueled combined-ccle units to almost triple this type of capacity on itssystem by tbe end of the 1990s.
v) Malaysia
The Paka 900 MW (3 x 300 MW Alsthom-Hitachi blocks) gas-fueled combined-cycle plant in Malaysia has had serious problems due to gas bypass damper jamming andgas turbine start-up train torque convertor bearing faults. Availability reportedly has beenonly 55-60% in the past, but corrections have been made and higher availability isexpected. Some of the problems have been attributed to split contracts for the gasturbine, boiler and steam unit components with interface difficulties, particularly on controlsystems. The country is still planning to install a large amount of combined-cycle capacityin the 1990s (3,840 MW by 1999) expecting that "teething troubles" with the technologywill be overcome. However, some gas-fueled steam capacity will also be instaled, so thatfuture power supply is not dependent on only one technology.
vi) Mefnco
Mexico has the largest amount of combined-ccle capacity in any developing countrytotalling almost 1,900 MW at five plants. The units were installed in 1975-1986 and aretypically dual-fueled, natural gas and distillate. The operating performance has not beengood; unit availability factors range from 38% to 83%; efficiencies vary from 20% for unitsinstalled in 1975 to 39% for later units. Comision Federal de Electricidad does not planto instal any additional combined-ycle units, partly because of their poor operatingrecord and also because there is surplus residual oil which can be used in steam plants.

27
6. THE ECONOMICS OF COMBINEDCYLE UNITS
6.1 The objective of this chapter is to present the results of an analysis of therelative economics of gas-fueled combined-cycle units and the base-load generationalternatives of coal and oil thermal units. The analysis was made for both large systemsof 5,000 MW installed capacity and above and small systems of 1,000 MW. Thecombined-ycle unit (block) sizes selected for the analysis were 450 MW for the largesystems and 90 MW for the small system, using 150 MW and 30 MW gas turbine sizes,respectively. These sizes are near the upper and lower size limits of the range of availablecombined-cycle unit sizes, so the size selection permits testing the economics of thecomplete combined-ycle size range. In both cases it is assumed that the systems arelarge enough to absorb the energy supplied by base-load power plants, subject to demandconstraints during a short initial period which does not exceed three years. The analysiswas done without the recourse to a comprehensive systems approach. However, realsupply and demand constraints are captured in the selection of the plant factors and theincremental energy production of each plant, taking into account reasonable values of loadgrowth (5-6% per year), availability factors, relative variable production costs and the sizeof each plant. The study does not consider high ambient temperaturers nor high altitudes,conditions that affect the performance of combined-cycle units (see para. 4.14). Theresults are presented separately below for the large and small systems.
L;a System Economic Analysis
6.2 The assumptions for the base case analysis of the generation costs for largesystems are shown in Annex 9. The fuel price assumptions were $2.50Q/MBTU fornatural gas, $40/ton for coal, $15/barrel for residual oil and $25/barrel for distillate.1 Plantfactors of 65% were assumed for all alternatives. A conservative 46% thermal efficiencywas assumed for combined-cycle units, even though design efficiencies are over 50%, toreflect the lower than expected efficiency that has been experienced on some combined-cycle plants in developing countries. Fuel prices and efficiencies are referred to Lower
I These oil prices assume a 1994 crude oil price of US$ 20 per barrel, which is consistentwith the Bank's most recent long term forecasts (M. Imran, IECIT, Aug. 1990 and IEC1TsForecasts and Quarterly Review of Commodity Markets, Dec. 1990), and typical oilproduct price differentials for residual and distillate. It should be noted that the relevantperiod for a comparative economic analysis between new power plants should be thatbeginning in 1994, i.e. the earliest commissioning date for these base-load plants. Oil priceassumptions therefore refer to that date and onwards.

28
Headng Value of the fuel. Base case estimations were done for a discount rate of 10%.
63 In addition to the base case, 32 sensitivity cases were analyzed for the largesystem with various assumptions including combined-cycle investment costs increased upto 25%, distiate-fueling of the combined-ycle, increased coal-fired plant imestment costs,combined-ycle efficiency reduced down to 40%, increased gas prices up to $4.50/MMBTU,reduced coal and oil prices, different fuel price escalations, different plant factors, onl a15-year life for the combined-cycle units, and several combinations of these variables.
6.4 In almost all cases tested the combined-ycle plants (450 MW unit size)proved to be the least cost alternative. Oil-fired steam plants were not economic underalmost any conditions, not even when residual prices were as low as $10/barrel Coalsteam plants became competitive with gas-fueled combined-cycle plants only in thefollowing cases (some cases are quite extreme and therefore unrealistic):
(a) for gas prices of $3.30MMBTU or higher (eg LNG),
(b) for coal prices of $20/ton or lower (such as indigenous coal in Chinaor India),
(c) wben combined-cycle inestment costs were increased by 10% (to$660/kW) and gas prices reached $3.00/MMBTU, or
(d) if the combined-ycle plant factor is about 15% lower than the coalsteam plant factor (combined-cycle 50%; coal steam 65%).
It was also found that oil steam plants would become competitive only if the combined-cycle plant factor is about 25% lower, i.e. combined-ycle 40% against 65% for oil steam.
6.5 Table 4 and Figure 10 show the variation in generation costs for four typesof thermal plant on a large system as the plant factor changes from 40% to 75% (thepractical limit range for base-load operation). These figures reveal clearly that gas-fueledcombined-cycle is the most economic thermal plant given the base case assumpdons.
Table 4: Thermal Plant Generation Costs on Large Systems
US¢/kWh40% PF 65%PF 75%PF
Gas combined-cycle 5.6 4.2 4.0Coal steam 7.0 4.9 4.4Oil steam 7.4 5.5 5.1Distillate combined-qcle 7.1 5.7 5.4

29
FIGURE 10PLANT FACTOR IMPACT ON GENERATION COSTS
FOR LARGE SYSTEMSUSoents/kWh
' ! upper limitassuming
8 _ 40-88%- , Gavailability
7 ._N
COAL STEAM F , _ UEL OIL STEAM6 %~~~~~
lowor limiti,for base.
4 load:$s operation', GAS COMBINED-C E
30 35 40 48 60 68 80 65 70 78 80 88
PLANT FACTOR %
FIGURE 11FUEL PRICE IMPACT ON GENERATION COSTS
FOR LARGE SYSTEMSUSoents/kWh
7
FUEL OIL STEAM _ -
- - L COALSTEAM
4 GAS COMBINED-CYCLE
3 ,I . . . I
1.8 2 2.6 3 3.8 4 4.6 GAS CS/MCF)
10 12 14 18 18 20 22 FUEL OIL ($/Bbl)
25 30 38 40 48 80 65 COAL ($ITON)

30
6.6 Figure 11 shows the variation in generation costs for different fuel prices,assuming 65% plant factor for all generation alternatives. Gas-fueled combined-cycle hasa lower generation cost than oil steam for almost all the range tested. It would have ahigr cost only if the gas price exceeds $3.S0/MMBTU and oil prices remain below$12.50barrel. Higher capital cost coal steam is competitive with combinedcycle if the gsprice is $3.50/MMBI or higher and the coal price is below $45/ton.
6.7 Figure 12 shows the variation in generation costs for discount rate changesfrom 6% to 16%. Oil steam is not economic within the range of discount rates tested.Higher capital cost coal steam appears to become competitive with combined-ycle for adiscount rate slightly below 6%.
FIGURE 12DISCOUNT RATE IMPACT ON GENERATION COSTS
FOR LARGE SYSTEMSUScents/kWh
6 FUEL OIL STEAM 01ULodSTAM _0
r~~4 MAS COMBINED-CYCLE
S 6 ~ ~ 10 12 14 16
DISCOUNT RATE

31
6.8 The results of selected sensitivity tests for other vawiations in the assumptionsare shown in Table 5. It should be noted that the coal steam generation cost is the same(at 4.9#/kWh) as the gas-fueled combined-cysl generation cost if the gas price is$3.00/MBTU and the combined-ccle investment cost is 10% higher than the base case.At a gas price of $3.50/MMBTU the combined-ycle geneidtion cost of 5.1/kWh is slightlyabove the coal steam base case generation cost of 4.9¢/kWh. Since gas prices of $3.00-3.50/MU are much higher than gas prices prevailing today, except possibly for LNG,the results indicate tbat, under current and most likely forecast price levels, when gas isavailable gas-fueled combined-ycle units are more economic than either oil or coal-firedsteam unit alternatives for base-load generation on large power systems.
Table 5: Sensitivitv Tests On Large System Generation Costs(a: 65% Plant Factor)
USe/kWh
Combined- Coal OilCycle Steam Steam
Base Case 4.2 4.9 5.5
Sensitivity Tests
- CC iwestment cost+ 10o 4.5 4.9 5.5+ 20% 4.7 4.9 5.5
- CC efficiency43% (base 46%) 4.4 4.9 5.5
- Gas price$3.5MMBTU 5.1 4.9 S.5
- No fuel price escalation 4.1 4.8 5.2
- CC investment cost+ 10% and gas price$3.0/MMBTU 4.9 4.9 5.5
- CC economic life15years (base 20) 4.5 4.9 5.5
- Coal price $36/tonoil price $13.5/barrel 4.2 4.7 5.2

32
6.9 Once units are instaled on any power system the dispatching of those unitsis based on the difference in variable operating costs and not on generation costs, whichInclude sunk fixed inestment costs. Tests were therefore made for variable costs only.It was determined that to have equal variable costs (0 & M plus fuel) for the combined-cycle and coal steam plants, coal prices would have to increase to $52/ton with gas at$2MOf5MMBTU or gas prices would have to decrease to $1.90/MMBTU with coal at$40/ton. Basically this means - t if both types of plant are installed on a large powersystem the coal steam units wouid operate in preference to the combined-ycle units,unless the gas price is very low. However, as the analysis refers to the comparison oflong-term alternative choices, this factor would have a short period impact on each plant'sproduction only if existing plants generate at lower variable costs.
6.10 The results of this study are consistent with those obtained by a recent studyon demand for gas in electricity.2 Although this previous study focused on differentobjectives, it included a simulation of the expansion and operation of three hypotheticalpower systems where combined-cycle plants competed with other thermal units The studyconcluded that, in a system where combined-cycle units of 400 MW competed with 600MW coal and residual oil steam units, the demand for gas dropped substantiaUly in twosteps for gas price increases from $2 to 3/MMBTU and $3 to 4/MMBTU. This compareswith the break-even gas price of $3.30/MMBTU obtained here (para 6.4).
Small System Economic Analvsis
6.11 The alternatives studied for base-load generation on small (1,000 MW) powersystems were residual oil-fueled steam, residual oil-fueled low-speed diesel, coal steam andnatural gs-fueled combined-cycle plants. The assumptions for the base case anaysis ofgeneration costs for small systems are shown in Annex 10. The fuel price assumptionswere the same, i.e. $2.50/MMBTU for natural gas, $40/ton for coal, $15/barrel for residualoil and $25/barrel for distilate. Plant factors of 65% were assumed for all alternatives.The assumed thermal efficiencies were 39% for oil steam, 40%o for diesel, 38% for coalsteam and 46% for combined-cycle plants. The assumed lives were 20 years for the dieseland combined-cycle plants, and 25 years for the steam plants. The base case discount ratewas 10%.
6.12 In addition to the base case, 35 sensitivity cases were analyzed for the smallsystem alternatives with various assumptions including combined-cycle investment costsincreased up to 20%, distillate-fueled combined-ccle, increased coal-fired plant investmentcosts, combined-cycle efficiency lowered to 409o, low-speed diesel efficency increased to
2 N. Pinto and J. Besant-Jones 'Demand and Netback Values for Gas in Electricity,World Bank Technical Paper No. 106, Industry and Energy Series, August 1989.

33
45%, increased gas prices up to $4.50MMBTU, reduced coal and oil prices, different fuelprice escalations, different plant factors, only a 15-year life for the combined-ycle units,and combinations of these variables.
6.13 In most of the cases tested the combined-ycle plant (90 MW unit size)proved to be the least cost alternative. Oil steam plants were not compettive with gasfueled combined-ycle plants under any of the conditions tested. Coal steam and dieselplants were a lower-cost option than oil steam for small systems. Coal steam and dieselplants became competitive only in the following extreme cases:
(a) for gas prices of $4.10/MMBTU or higher,
(b) when combined-ycle capital costs increase by 15% (to $920/kW) andgas prices reach $3.50MIMBTU; or
(c) if the combined-ycle plant factor is about 19% lower than the coalsteam or diesel plant factor (combined-ycle, 46%; coal and diesel65%)..
6.14 Table 6 and Figure 13 show the variation in generation costs for the fourtypes of thermal plants on small system as the plant factor changes from 40% to 75% (thepractical limit range for base-load operation). These figures reveal clearly that gs-fueledcombined-cyle plants are the least-cost technology for the base case assumptions.
Table 6: Thermal Plant Generation Costs on Small Sos
U^Se/kWh40% P.F. 65% P.F. 75% P.F.
Gas combined-qcle 6.9 5.0 4.6Coal steam 9.3 6.3 5.7Oil steam (residual) 9.5 6.8 6.2Oil low-speed diesel (residual) &7 6.3 5.8Distfllate combined-ycle 8.4 6.5 6.1

34
FIGURE 13 £
PLANT FACTOR IMPACT OF GENERATION COSTSFOR SMALL SYSTEMS
UScentskWh
11 ; upper limit
10 assuming~~~~ : ~~~~~~80-66f%
COAL STEAM availability
DIESEL ~ ~ FUEL OIL STEAM
lower limit:,6 for base:
* _ operation:_ ' ~~~GAS COMIE-YL
430 36 40 48 50 85 60 86 70 76 80 85
PLANT FACTOR %
FIGURE 14FUEL PRICE IMPACT ON GENERATION COSTS
FOR SMALL SYSTEMSUSoents/kWh
8 /_00 - 40DIESEL
7 FUEL OIL STEAM ' COAL STEAM
_--e CAS COMUINED-CYCLE
5_
4 . * * * I
1.6 2 2.8 3 3.5 4 4.8 GAS CS/MCF)
10 12 14 16 18 20 22 FUEL OIL(S/Bbt)
, . * _I l | o ..o
a 30 I I 4 I I C28 30 35 40 46 so 68 COAL (STON)

35
6.15 Figure 14 shows the variation of generation costs on a small system fordifferent fuel prices, assuming 65% plant factor for all generation alternative Combined-cycle has a lower cost than oil steam for a great part of the fuel price range tested i.e.,gas prices $2.00-4.50/MMBTU, oil prices $10.5-18/barrel and coal prices $28.45Aton.Diesel is competitive if the gas price is above $3.50/MMBTU and the oil price is only$12/barrel, which is unlikely. Coal steam is competitive if the gas price is $3.50/MMBTUand the coal price is below $28/ton, which is also unlikely.
6.16 Figure 15 shows the variation in generation costs on a small system fordiscount rate changes from 6% to 16%. None of the thermal alternative s competitivewith s-fueled combined-qcle units within the range tested. However, diesel plantsreveal a lower cost than high capital cost coal steam plants for discount rates above 10%.
FIGURE 15DISCOUNT RATE IMPACT ON GENERATION COSTS
FOR SMALL SYSTEMSUloents/kWh
10
9 :~~~~~~%100~~ CALt0 _~~~~~~~~~~~~0
a FUEL OIL STEAM _ , d . _'00 40 dowDIESEL
? _
GAS COMUINEO-CVCLU
4
s* 8 10 12 14 16
DISCOUNT RATE %

36
6.17 The results of various sensitivity tests for other aitions in the assptonsfbr a small stem are shown In Table 7. For all the specific cases shown the combined-cycle pant is least cost, reveling an even greater advantage than that found for lrepower stems. This increase in the combined-ycle competitive advantage is attributedto the fact that, as the system size is reduced, coal steam technology (the second bestbasload alternative for large systems) experienced a substantial capital cost increase of50% whfle the combined-cycle costs increased by only 33%.
Table 7: Sensitt Tests On Small System Generation Costs(at 65% Plant Factor)
USekWh
Combined- Coal Oil Oil Low-Q!ycle Steam Steam Speed Diesel
Base Cae 5.0 6.3 6.8 6.3
sensitivity tests- CC investment cost+ 10% 5.3 6.3 6.8 6.3+20% 5.6 6.3 6.8 6.3
- CC efficiency43% (base46%) 52 6.3 6.8 6.3
-Ga price$330/MMBTU 5.8 6.3 6.8 6.3
- Coal price $36/tonoil price $13.5/bawel 5.0 6.2 6.5 6.1
- No fuel price 4.9 6.2 6.6 6.1escalation
- CC investment cost+10% and gasprice $3.50/MMBTU 6.1 6.3 6.8 6.3
-1Economic life CC 15,coal 27, oil 30,diesel 25 6.2 6.2 6.6 6.1

37
6.18 This analysis of generation costs for combined-ycle plants and the thermalplant alternatives on large and small systems shows that combined-cycle plants are leastcost as base-load generation sources unless some rather improbable conditions apply, suchas low coal prices and very high gas prices. The economic advantage of combined-cycleplants stems from the following characteristics: (i) lower capital investment costs for bothlarge and small power systems, (ii) lower economics of scale thus increasing its competitiveadvantage over steam plants as the system size is reduced, (iii) higher thermal efficiencywhich is, as an average, 18% (8 percentage points) greater than that of competingtechnologies, (iv) possibility for implementation in phases thus adapting better to loadgrowth variations, and (v) when gas-fueled, combined-ccle has lower variable costs($/kWh), except for coal steam generation.
6.19 It is clear that the plant factor is critical for successful and economicapplication of combined-cycle plants on both small and large power systems. Thereforethis area requires special emphasis during the preparation of any projects. Adequateprovision for training, technical assistance, manufacturers' specialists and possibW 0 & Mcontracts are essential to ensure high availability factors on combined-cycle plants in thedeveloping countries. It should be noted that the above economic comparison providesonly an overview. System planning studies must consider existing generation sources, theeffective capacity of various alternatives, the equivalent forced outage rates of combined-cycle units in comparison with other generation types, and the part-load performance ofvanous types of generation, which may make combined-qcle plants less competitivecompared with conventional steam plants.

38
7. PROSPECTS FOR COMBINEDCYCLE POWER GENERATIONIN THE DlEVELOPING COUNTRES
Av-a1Hbii -of G-as
7.1 The potential for oil price increases due to supply uncertainties and concernover coals acid rain and global warning impact are focusing attention on "lea" gas asthe best fossi fuel for electricity production. This chapter reviews the availability of gasin the developing countries and explores the viability of the gas-fueled combined-cleoption from the gas supply viewpoint.
World Gas Reserves and Production
7.2 The world's gas reserves have been found mainly during oil explorationactivities. Gas occurs as either associated gas in oil fields or as non-associated gas inseparate gas fields. Since oil has been the prime target of petroleum exploration, oilproduction has outpaced gas production. This is verified in Figure 16 which compares theevolution of the world's proven reserves for oil and gas in the period 1970-1990. Figure16 shows that the gas/oil ratio of proven reserves has increased from 50% in 1970 to 85%in 1990, confirming that the buildup of gas reserves has been faster than for oil reservesexcept in the mid-1980s, when the price of oil fell dramatically, which caused a cutbackin oil exploration while gas surplusses dampened gas exploration efforts
73 The country-by-country estimates of 1989 and 1990 proven natural gasreserves in the world are shown in Annex 11. The 1989 world proven gas reserves nowstand at roughly 130,000 billion cubic meters (bcm). The proven natural gas reserves forthe developing countries total some 23,000 bcm, or slightly less than 20% of the world'stotal proven gas reserves. Over one-half of the developing countly proven naturl gasreserves are concentrated in five countries-Algeria, Indonesia, Mexico, Nigeria andVenezuela
7.4 The world's surplus gas position is also evident in Annex 12 which shows thereserves/production ratio for 1989 for various regions and countries. The world's totalproven gas reserves would last 58 years based on the 1989 level of gas production. Thereserves/production ratios vary widely, the United States has only 9.5 years of reserves butsome Middle East country gas reserves would last hundreds of years at 1989 productionlevels. The natural gas reserves/production average ratio in 1989 for the developingcountries was 48. Latin America has a reserves/production ratio of 63.5, dommated bSyVenezuela with 115.5.
7.5 The natural gas worldwide gross and marketed production volumes for 1989are shown in Annex 13. The difference between the two production figures is due toreinjection, flaring and other losses. The developing country share is again under 20% ofthe total world natural gas production.
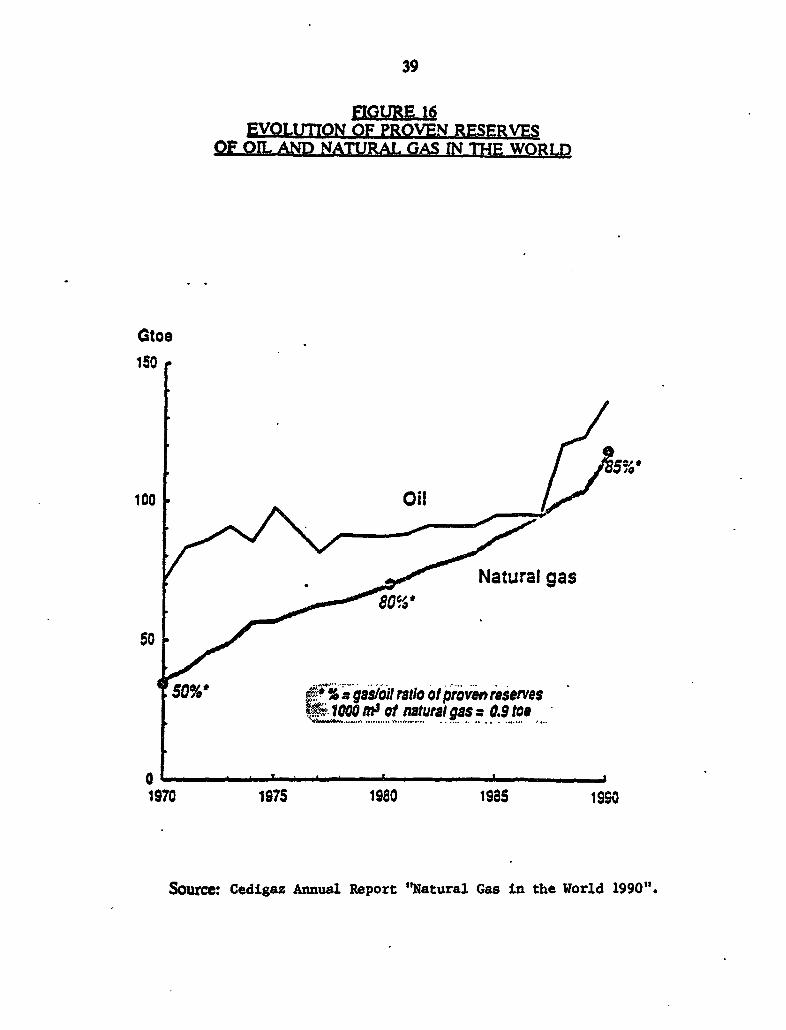
39
FIGURE 16EVOLUTION OF PROVEN RESERVES
OF OIL AM NATURAL GAS IN THE WORLD
Gtoe150
100 Oil
! X ~~~~~~~Natural gas
50/ %* .a% gas/oil ratio ot prioenreservesogo Mns ot natural gas a 0.9 toe
O ~~~~~~~~~~~~~~~~~...... ..., ........ .. . . . . . ...... .
1970 1975 1980 1985 19S0
Source: Cedigaz Annual Report "Natural Gas in the World 1990".

40
7.6 The important point is that many developing countries have natural gasreserves that are adequate for power generation. Furthermore, since oil/gas field ownersundertake more exploration or production driiing only if additional reserves are required,there undoubtedly are far greater gas reserves than have been proven to date.
Gas Requirements for Power
7.7 The volume of natural gas required for a typical gas-f.aeled combined-yclepower plant is developed in Annex 14. Assuming a 70% annual plant factor, 43%efficiency, and a 20-year life, the lifetine natural gas requirement for a 1000 MWcombined-ycle plant is 30 bcm (or roughly one trillion cubic feet). This figure providesa basis for evaluating the potential power-fueling capability of the available gas reservesin the developing countries.
Prospects for Combined-Cycle Units
7.8 Focusing on the total proven national gas reserve position in the developingcountries, if the 1989 level of production we-e to continue for 10 years, there would stilbe about 18,000 bcm of natural gas reserv; available even without new discoveries. Intheory, this gas volume could fuel about 6' X GW of combined-cycle capacity for 20 years.This is almost as much generating capacity as is available today in the USA and is morethan the total available capacity in all the developing countries. Of course, some of thereserves may already be committed and the locations of the gas reserves may notnecessarily match power market distribution. Nevertheless, the above figures serve todemonstrate the large volumes of natural gas available in the developing countries.
7.9 A rough country-by country comparison of gas volumes available and itspotential contribution for power generation in the developing countries is shown in Annex15. This comparison is finaDly reflected in an indicator named "available gas-power-years"that measures, for each country, the number of years during which domestic gas resourcescould satisfy the total power demand (for the year 1999). It must be emphasized that thiscomparison is only indicative, since its computation requires several simplifyingassumptions that are explained below. Thus the indicator is aimed at providing a roughestimate of the potential contribution of gas to power generation. The underlyingassumptions are as folows: (a) the estimation is based on 1989 gas reserves; it does nottake into account any future gas discoveries nor the depletion of fields. This is quite aconservative assumption since, during the last two decades, world proven reserves ofnatural gas have increased at an average rate of 87% per decade, (b) the gas productionfigures do not reflect other gas commitments that may have been made under long-termcontracts, (c) there is no provision for limits on the recoverability of the gas reserves, and(d) the "gas-power-years" indicator neglects existing or planned power sources. It istherefore measuring, in years, the potential contnrbution of natural gas for powergeneration assuming that gas is the only resource. Nonetheless, the comparison is usefulfor identifying those countries that have substantial gas reserves relative to the size of

41
their power market. The figures in Annex 15 reveal that there are 26 countries with"available gas reserves" to fuel for 20 years or more a power capacity of an amount equalto the projected 1999 power demand levels. These are: Argentina, Bolivia, Ecuador, Peru,Trinidad-Tobago, Venezuela, Algeria, Pakistan, Tunisia, Yemen, Angola, Cameroon,Congo, Equatorial Guinea, Ethiopia, Ivoiy Coast, Mozambique, Nigeria, Rwanda, Somalia,Sudan, Tanzania, Bangladesh, Burma, Malaysia and Papa New Guinea. As mentionedabove, this selection is only indicative of potential use. Each country gas and powersituation should be studied to determine the present and future gas markets, gasdevelopment and pipeline transmission costs, existing hydro capability, thermal fuelswitching capability, location of power markets, etc., before the economic feasibility ofusing gas for power generation can be ascertained in any particular country.
7.11 It is clear there are substantial uncommitted gas reserves in some developingcountries that could be used for power generation. Where gas is available, gas-fueledcombined-cycle technology has significant advantages over coal steam units, so there isconsiderable scope for the combined-ccle technology in the developing countries.However, to utilize the technology effectively greater emphasis must be placed onincreasing the availability and thermal efficiency of combined-ycle plants in the developingcountries
Summa of Advantage_s of CombinedCycle Technology
7.12 The advantages of combined-cycle technology can be summarized as follows:
a) lower capital cost than other fossil fuel power alternatives, which isimportant given the serious financial condition of many developingcountry utilities;
b) capital costs are relatvely firm because of the short lead time andcompetition amongst suppliers;
c) the lack of significant economics of scale permits using smaller unit sizes;
d) the short lead time for construction plus modular instalation permitsadapting capacity additions to fit uncertain load growth;
e) the high efficiency results in lower fuel requirement and also minimumenvironmental pollution, because the fuel is natural gas;
t) the available small unit sizes is adaptable to private sector andcogeneration applications;
g) the smaller number of operation and maintenance personnel thanconventional steam plants reduces the management of labor problem,and

42
h) the repetitive and clearly defined maintenance schedules results inpredictable maintenance costs, which permits contracdng out maintenanceto specialist firms.
Recommendations for Combinedycle EXpansion in the Developing Countries
7.13 The majority of utilities in the developing countries apparently believe thatthe present operating problems with combined-cycle units (para. 5.10) will be overcome.This would be the explanation of why utilities have scheduled expansion plas which, ifachieved, woula increase the combined-cycle capacity in 18 developing countries from the1989 total of about 4,000 MW to almost 20,000 iv1W by the end of 1999, as shown inAnnex 16. Nonetheless, there will have to be significant improvement in combined-ycleplant performance before it will be possible to fully exploit the potential for thistechnology in those developing countries that have natural gas reserves. Future combined-cycle projects should include the following considerations to improve availability:
a) use of a turnkey contract approach to define single responsibilty forquality control (to avoid coordination problems as on the Malaysianproject)
b) long-term operation and maintenance arrangements with themanufacturer, in the investment package, to provide continuous training,monitoring and technology transfer (to circumvent the utilities' lack ofexperience and reluctance to contract out O&M);
c) satisfactory supply arrangements, in the investment package, forconsumables, overhaul and emergency spare parts;
d) long-term supply arrangements for naturwal gas of satisfactory quality;e) possible use of a Build-Own-Operate (BOO) concept under which an
experienced manufacturer/operator would install and operate thecombined-ycle plant and sell the power output to the developing countryelectric utility, and
f) use of global specialization services already available from manufacturersor contractors to assist developing country utilities on combined-cycleplant operation, including use of computer and satellite communicationfacilities to closely monitor plant operations.

43
,ANNE 1Page 1 of 1
aiad Coombnd Qyele UnitAan|Anave fm Manu
Frequency Ga8 Ste Totalo. of Ibdel Turbine Turbfne Capacity oetLL LIIM_ IN MM NW Effl 21L
Partial Lfst of Asea Brown Soveri Cembjned*Cv;lt l8tgks
1 13E 50 142.1 71.7 213.8 49.92 13E 50 284.2 145.1 49.3 50.11 13 50 94.0 50.2 144.2 47.42 13 50 188.0 101.9 289.9 47.63 13 S0 282.0 152.9 434.9 47.64 13 50 376.0 205.1 581.1 47.71 11N 60 78.1 43.0 121.1 47.82 11N 60 156.2 88.3 244.5 48.23 11N 60 234.3 133.5 367.8 48.44 113 60 312.4 179.0 491.4 48.5
Partfal List of Genoral Electric Cambined-Cycle Oltoks
1 65418 50 37.7 18.8 56.5 46.32 6541B 50 75.4 40.5 115.9 47.54 6541B S0 150.8 82.7 233.s 47.91 9161E 50 116.9 55.5 172.4 48.82 9161F 50 233.8 113.4 347.2 49.21 9281F S0 212.2 106.4 318.6 51.21 65418 60 37.7 18.8 56.5 46.32 65418 60 75.4 40.5 l1S.9 47.S4 65418 60 150.8 82.7 233.s 47.91 7111EA 60 83.5 40.0 123.S 48.12 T111EA 60 167.0 82.0 249.0 48.SI 7191F 60 150.0 72.0 222.0 S1.22 7191F 60 300.0 145.7 445.7 51.3
Partial List of Siemens Cafbined-Cvcle Slocks
2 V64 50/60 117 63 180 S1.83 V64 50/60 175.5 96 271.5 S2.14 V64 50/60 234 130 364 S2.4I V94 S0 144 87 231 S1.12 V94 50 288 177 465 51.43 V94 50 432 269 701 S1.71 V84 60 99 S9 1S8 50.92 V84 60 198 120 318 S1.23 V84 60 29? 183 480 S1.5
Source: Nanufacturers' literature.
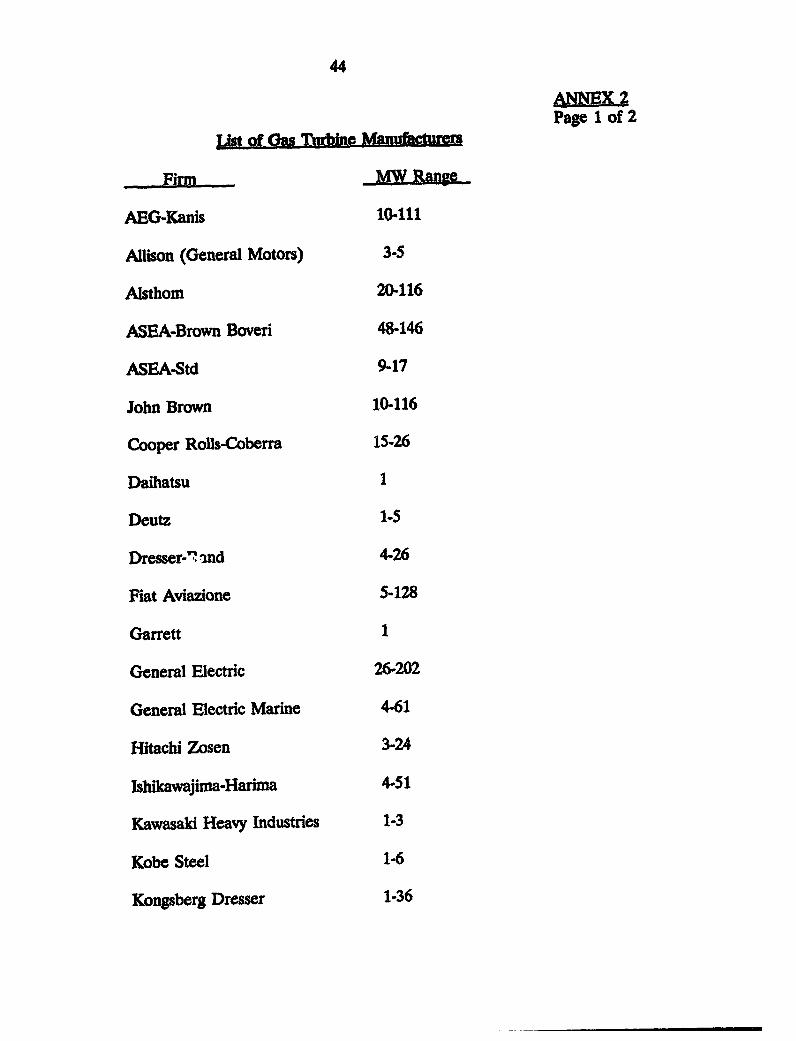
44
ANNEX Page 1 of 2
Ist af Ga(k TumMs
Firm M Range
AEG-Kanis 10-111
Allison (General Motors) 3-5
Alsthom 20-116
ASEA-Brown Boveri 48-146
ASEA-Std 9-17
John Brown 10-116
Cooper Rolls-Coberra 15-26
Daihatsu i
Deutz 1-5
Dresser-' -nd 4-26
Fiat Aviazione 5-128
Garrett 1
General Electric 26-202
General Electric Marine 4-61
Hitachi Zosen 3-24
Isikawajima-Harima 4-51
Kawasald Heavy Industries 1-3
Kobe Steel 1-6
Kongsberg Dresser 1-36

45
ANX2Page 2 of 2
Firm MW Range
MAN GHH 5-9
Mitsubishi 1-150
Mitsui Engineering 1-32
Niigata Engineering 1-8
Nuovo Pignone 5-119
Pratt & Whitney, Canada 1-3
Rolls-Royce 14-20
Ruston 1-34
Siemens 105-153
Solar 1-17
Stewart & Stevenson 1-46
Sulzer-Escher Wyss 6-22
STI-Sulzer 1-6
Textron-Lycoming 1-3
Thomassen 10-170
Turbomeca Industrial 1
UTC-Turbo 26-51
Westinghouse Canada 22-42
Westinghouse 108
Yanmar 1-2
Source: 1988 Diesel and Gas Turbine Worldwide Catalogue.

46
Page 1 of 2
Steam Plant Convero to Cnmbclei nd
1. The Electricity Supply Board of Ireland (ESB) has converted two old steamplants to combined-cycle units to extend the life of the steam turbines and auxdliaries andto uilize valuable load-center sites at downtown locations in the cities of Dublin andCorL The ESB experience is indicative of the retrofit possibilities.
2. The ESB system has a capacity of about 4200 MW with a peak load of 2500MW and is operated as an isolated power system because the 230 kV interconnection toNorthern Ireland has been damaged by saboteurs repeatedly so is not in operation. Thesystem supply is a mix of hydro, peat, coal, oil and, since the late 1970s, gas thermalusing gas from a gas field off the south coast of Ireland. The capacity and productionbreakdown in 1988 for the ESB system was as follows:
1988 Breakd (%)
Coal 24 41Gas 35 27Peat 12 17Oil 16 8Hydro
Total 100 100
3. The Marina plant at Cork was built in 1954 and had two 30 MW steam turbinessupplied from three boilers arranged on a header. Nominal steam conditions were 42bar/454°C. The plant was arranged for dual fiing, coal and oil, but the low oil prices ofthe 1960s meant it operated only on oil. After 25 years of operation the boilers requiredrehabilitation or replacement, so the decision was taken to convert the plant to combined-cycle using gas as fuel. An Alsthom/General Electric Frame 9B 83 MW gas turbine wasarranged to exhaust into a waste heat boiler that could supply either the 30 MW steamturbines or a dump condenser. The dump condenser allowed operation of the gas tu. 'ineif neither steam turbine was available and was found to be a better

47
Page 2 of 2
solution than a gas bypass. The gas turbine plus one steam turbine provided 115 MWfor the system. The unit was base-loaded for many years after commissioning in 1979,and the resulting gas demand provided the base demand for gas field development withthe subsequent gradual addition of industrial and residential loads. To date, the twoMarina 30 MW steam turbines have about 150,000 hours of operation.
Norlh VAR
4. The North Wail plant is located in the dock area of Dublin; two 16 MW oilsteam units were installed in 1953 and a third in 1963. The steam turbines were designedfor quick start as a cycling plant (cold start could be made in 20 minutes, although onehour was usual). Steam conditions were 30 bar/427C. The boilers had exhausted theiruseful life by the late 1970s, partly because of the quick start mode of operation, and thesteam turbines had about 60,000 hours. In view of the success at Marina, rather thanchange boilers it was decided to convert North Wall to combined- cycle. As gas was notyet avaflable at Dublin, provision was made for both heavy oil and gas firing. AnAlsthom/General Electric Frame 9E 105 MW gas turbine was installed exhausting into awaste heat boiler supplying steam to the three 16 MW steam turbines, with a dumpcondenser as used at Marina, to give a unit capacity of about 150 MW. A second Frame9E gas turbine was installed as a peaking unit.
5. The two ESB combined-cycle plants have recorded about 85% availability and43% efficiency. This is excellent availability considering the steam turbines are nearly40 years old and good efficiency because the steam conditions are relatively low. Madnaand North Wall operated as base-load combined-cycle plants for several years until the3 x 300 MW coal-fired Moneypoint plant started operation recently on base-load,relegating the gas-fired combined-cycle units to mid-range operation. The North Wallgas turbines have served as a test center for many General Electric gas turbinedevelopment component testing at high temperatures.
6. The ESB combined-ycle units play an important spiming reserve role.Operational expenence has proven that 75 MW can be picked up on the two units in afew seconds vhen acting as spinning reserve. This is faster response than the 4 x 73MW Turlough Hill pumped storage plant which requires 22 seconds for startup of eachunit.
Source: ESB Reports

48
AN4NEX 4Page 1 of 1
Midland (US) Ga-Fired Combned-ycleCogeneration Plant
1. The world's largest cogeneration plant is being installed near the city of Midlandin Michigan utilizing power facilities that were committed in the mid-1960s for a nuclearplant. About $4 billion had already been spent by Consumers Power Co. on a 2-unit, 1357MW nuclear plant which was arranged to also supply process steam to Dow Chemical Co.In 1984, when the nuclear plant was 85% completed, the nuclear project was abandonedbe-ause of political, safety and technical problems. In 1986 a Midland CogenerationVenture (MCV) project was initiated to use the two steam generators and other sitefacilities and install gas turbines with waste heat boilers to form a cogeneration plant forthe supply of electricity to Consumers Power and steam to Dow Chemical.
2. The plant will have twelve 85 MW Type GTIIN gas turbines and generatorssupplied by Asea Brown Boveri. These will exhaust into 12 heat recovery steamgenerators arranged to supply steam to the two existing 350 MW steam units previouslyinstaled for the planned nuclear plant. The high pressure turbines of the steam sets hadto be modified including reblading to handle the wide range of operating conditions e.g.,varying numbers of gas turbines, changing process steam requirements, NOx control steamfor the gas turbines etc.
3. The plant is on a 1,000 acre site which includes an 880 acre cooling pond. Gasconsumption of about 350 MMCFD will be supplied from the interstate gas network viaa 25 mile pipeline. The plant will have a thermal efficiency of about 42%. Thecombined-cycle plant will supply 1,380 MW of power to Consumers Power Co., andprocess steam and 60 MW of power to Dow Chemical Co.
Source: International Power Generation.

49
ANNEX 5Page 1 of 2
TEPCO (Japa) ING-Fired Combined-cle Plant
1. Japan is probably at the forefront worldwide in the use of LNG for powergeneration. A 2000 MW LNG-fueled combined-ycle plant at Futtsu near Tokyo is inoperation and a second LNG-fueled plant has been ordered for the Tokyo Bay area.
2. The Tokyo Electric Power Co. (TEPCO) is the world's largest investor-ownedelectric utDlity with over 41,000 MW of generating capacity. The utility's planning criteriainclude high reliability, high efficiency, and minimum environmental impact. Power sourcesare diversified including nuclear, coal thermal and small amounts of hydro for base load,LNG for mixed base load and mid-ra..ge generation, and oil thermal and pumped storagefor peaking. The utility's installed capacity is roughly 60% thermal, 25% nuclear and 15%hydro. LNG already supplies about 40% of the system energy.
3. The Futtsu site is some 50 miles south of Tokyo on a man-made land extensionformed by dredging sand from Tokyo Bay. The plant comprises two 1,000 MW stageseach with seven General Electric STAG 109E nominal 165 MW single-shaft combined-cycle units. A unique feature is that the compressor, gas turbine, steam turbine andgenerator of each unit are all coupled on the same shaft. This simplifies operationbecause the gas turbine and steam turbine are operated as one unit without any needfor a gas bypass. Each stage comprising seven combined-ycle units is connected viaseven individual generator breakers to a single transformer with high voltage breaker tothe TEPCO system.
4. The gas turbine used is the General Electric MS9001, 3,000 rpm, 112.5 MWunit (ISO rating) exhausting into a heat recovery steam generator. The steam turbine isa single-flow non-reheat unit with extraction for gas turbine injection of steam for NOxcontrol, and selective catalytic reduction is also used.
5. The overall plant capacity is 2,310 MW at a 150C ambient or only 2,000 MW at320C The lower heating value thermal efficiency is 48.5% (7039 BTU/kWh). The highefficiency can be achieved throughout a range of 14 to 100% rating of each 1000 MWgroup by sequential loading of the individual units forming the group. The plant stackemissions are environmentally excellent at only 10 ppm NOx, zero SOx, and only a traceof particulate matter. Nonetheless, two 200 meter stacks have been provided to disperseplant exhaust gases. Each combined-cycle unit can be started and loaded in one hour

50
ANE SPage 2 of 2
foLowing a 12 hour shutdown, two hours after a weekend shutdown and three hours fromcold. The LNG storage capacity at the plant is 130,000 cubic meters and is beingincreased by an additional 120,000 cubic meters.
6. The overall construction time for the complete Futtsu plant was six years, 1882-1988, and each group of seven units required four years. The first unit delivered powerin September 1985 and the plant was completed in November 1988. Average availabilityhas been 85% including shutdowns for scheduled inspections. As of September 1988 theaverage number of fired hours per start was 32, showing the mixed base-load and mid-range type of operation. Tne average efficiency has been 48.6% compared to aguaranteed 47.2%. Group I (1,000 MW) has withstood a system disturbance when alload was lost; the group maintained supply to its auxiliaries and was ready to accept loadas necessary.
Source: General Electric Co.

51
ANNESX 6Page 1 of 3
Smmamy of Recent World Bank FmancedC;mbine wsc rjec
1. This Annex provides brief data on seven Bank-financed combined cycle projectsincluded in energy lending programs during the period FY86-90, as follows:
Combined-Cycle Loan AmountE Coul MWAdded $M
90 India 180 9889 Thailand 600 9089 Egypt 1,218 16588 Malaysia 601/ 5687 Paldstan 80 7086 India 1.500 85
Totals 2,638 964
1/ vTwo 30 MW combustion turbines as part of a future 90 MWcombined cycle module.
The following sections provide short descriptions of these seven projects.
FY90 India TATA Project
2. An FY90 Bank loan of $98 million (plus IFC $30 million) financed a $230.7million project which included a 180 MW gas-fueled combined-cycle component for TATATrombay plant near Bombay estimated to cost $111 mDllon ($617/kW) with 52% F.C
3. The combined-ycle block will be installed adjacent to Unit 6 at the existingplant and wil comprise a 120 MW gas turbine exhausting into a waste heat boilersupplying steam to a 60 MW turbo-generator. There will be no supplementary firing buta damper will permit operation of the gas turbine independent of the steam unit. Thecondenser wil be cooled by sea water using existing circulating water systems. Gas wil

52
ANNEX 6Page 2 of 3
be supplied from the offshore Bombay High off fields where lare amounts of associatedgas are being flared. The estimated output cost of the combined-cycle unit is [email protected].
FM9 Thailand System Development Project
4. An FY89 $90 million loan covered a two-year (FY89-90) time slice of EGArsinvestment program and this included a 2 x 300 MW combined-cycle component estimatedto cost $308 million ($616/kW) with 68% F.C.
5. The combined-cycle capacity will be added at the existing (2 x 550 MW steam,2 x 360 MW combined-cycle) Bang Pakong station fueled from offshore gas fields. Eachnew 300 MW block will comprise two 100 MW gas turbines, a waste heat boiler and a100 MW steam unit, with an overall efficiency for base-load operation of 42 to 45%.The 1996 generation cost with gas-fueling of the combined-cycle units is estimated atUS40/kWh.
FY89 Egypt Fourth Power Project
6. An FY89 $165 million loan financed (a) a 1,080 MW combined-cycle plant atFaraskur in the Delta comprising three 360 MW modules each with 2 x 120 MW gasturbines, two waste heat boilers and a 120 MW two-pressure steam turbine giving anoverall efficiency of 45% fueled with gas from the Abu Madi field; (b) adding 138 MWby conversion to combined-ycle operation of the gas-fueled 8 x 24 MW industrial gasturbines at Mahmoudia and 4 x 24 MW turbines at Damanhour in modules of 4 turbines,4 waste heat boilers and a 46 MW steam turbine, to give an overall efficiency of 39%,and (c) adding 220 kV and 66 kV transmission facilities to deliver the power. The totalproject cost is $721 million or $592/kW, based on new capacity of 1080 MW plus 138MW by conversion.
FY88 Malaysia Sawak Proect
7. An FY88 $56 million loan financed a $101 million project that included a2 x 30 MW gas turbine and 275 kV power transmission installation as part of a future90 MW combined-cycle station at Bintulu on Sarawak. The two gas tubines will besupplied with gas from Petronas' existing pipeline and will have an efficiency of about28% which will be increased to 42%, when the units are conmerted to combined-cycle toutflize the exhaust heat with the installation of waste heat boilers and a steam turbine.

53
ANNEX 6Page 3 of 3
PY8 Pakitn power Plant Efficiency
& An FY87 $70 million loan financed (a) the rehabilitation of some steam andgas turbine stations, and (b) the conversion of eight gas turbines at the Faisalabad powerstations and four gas turbines at the Kotri power station to gas-fueled combined-ycleoperation by adding waste heat boilers and steam turbines. The combined cycleconversion added 80 MW of capacity at a cost of $50 milion or about $625/kW.
FY86 India Combined-Sycle Proect
9. An FY86 $485 million loan financed a total of about 1,500 MW of combined-cycle capacity and associated transmission at three sites - Kawas, Anta and Amyia-toaugment power supplies in the Northern and Western Regions, to be fueled by pipelinefrom the South Bassein gas field. The capacity will comprise two combined-ycle blocksat each of Kawas and Auraiya and one at Anta. The combined-cycle blocks will be basedon nominal 110 MW single shaft gas turbines in roughly 300 MW/block (two 100 MW gasturbines exhausting into two waste heat boilers that supply a 100 MW steam turbine). Theoverall unit cost including transmission and fuel facilities at each site is about $800/kW.
FY86 Pakstan Kot Addu Combined-ycl Project
10. An FY86 $90 million loan financed the conversion of four gas turbines (2 x125 MW and 2 x 100 MW) at Multan to combined-ycle operation by adding four wasteheat boilers and two 100 MW steam turbines, together with the required transmissionfacilities. The fuel capability will be either heavy fuel oil, distillate or natural gas. Gasdampers will permit bypassing waste heat boilers for open-cycle operation. The overallproject cost was $175 milion or a relatively high $875/kW.
Source: World Bank Project Staff Appraisal Reports.

54
ANNEX 2Page 1 of l
Noarth American Combined-ycle Unit Avalbl;iq
1. The North American perfornance record of the combined-cycle unit availabityon 13 US. power systems for the period 1985-1989 covering 26 units, varying in size from68 to 587 MW, shows the average unit availabiity was 85%, with the following breakdown.
Plant Equipment Availabilit
Boiler 98.74Steam Turbine 97.22Generator 98.67Condenser 99.79Balance of Plant 97.87Gas Turbine 93.08
Total Unit 85.14
2. The high unavailability of the gas turbine (7%) reflects the need for regularscheduled outages for inspections and maintenance, particularly associated with the hot-gas-path section of the gas turbine.
Source: Generating Availability Report 1985-1989, North American Electirc ReliabilityCouncil.

55
ANNEX8Page 1 of 3
USAID-Financed Pakistan and EyptCombned _cle Plants
1. This note summanzes the findings of a review by consultant RCG/Hagler, Baileycovering the operational experience of two combined-cycle plants financed by USAID -the 600 MW Guddu plant in Pakistan and the 300 MW Talkha plant in Egypt
2. The Guddu plant is located 600 km north of Karachi and is fueled by naturalgas from the Man, Kandh Kot and Sui fields with distillate as standby. The plant hasfour General Electric Model PG91S1E gas turbines rated 110 MW (at 590F), four heatrecovery boilers and two steam turbines arranged in two combined-ycle blocks of 300MW each. The plant cost was $296 million (1982$) or roughly $S00/kW. Plantconstruction took slightly less than five years with the gas turbines being operational inearly 1988, ie, 4 1/2 years from start of construction.
3. The plant performance record based on 26 months of base-load operation ascombined-cycle units shows the following:
gas turbine availability 83%1steam turbine availability 83%plant availability 79%net heat rate (BTU/kWh) 8,960thermal efficiency 38
4. The consultant determined the sources of plant olutages were as follows:
gas turbines 79.9%steam turbine 12.3%heat recovery boiler 7.8%
1 Note that the consultant defines availability as:
MWh dispatchedTotal MWh capability in the period

56
Page 2 of 3
5. The breakdown of the 80o of the outages attributed to the gas turbine was asfollows:
turbine 35.4%generator 20.6%combustors 17.8%accessories 9.7%controls 9.3%balance-of-plant 7.2%
6. The high percentages of outages for the gas turbine confirms this is the criticalarea for sources of trouble on combined-cycle uits. The list of causes of major outagesincluded compressor failure, failure of starting motor due to oil leakage, bearing vibration,bypass damper trouble, and torque converter failure.
A record of one day's operation shows 630 MW output at midnight when theambient temperature was 13°C, an average load of 613 MW for the day, and a minimumload of 520 MW at 0400 hours.
7. The plant performance seems reasonable at 79% plant availability with over 600MW output, but the combined-qcle plant efficiency at 38% seems somewhat low for a111 MW gas turbine size.
Talkha Plant
& The Talkha plant is located in the Delta area about 120 km from Cairo. Theproject was a conversion of eight existing 25 MW General Electric gas turbines by addingadvanced hot-gas-path components, eight heat recovezy boilers and two steam turbinesto increase the capacity from 200 MW to 300 MW. The plant is equipped for both gasand distillate fueHng.
9. The plant conversion was completed in about two years, 1987-1989, at a cost ofabout $70 million or $700/kW of additional capacity. The performance record for thelast half of 1989 is as follows:

57
ANNEX 8Page 3 of 3
gas turbine availability 89%steam turbine availability 76%plant availability 85%capacity factor 72%station use 1.4%net heat rate (BTU/kWh) 10,871thermal efficiency 31%
10. The performance guarantee was 40% efficiency (compared to 31% actual). Noexplanation was given by the consultant of the reasons for the shortfall in actual efficiencyfrom the guaranteed value.
Training Reuirement
11. The consultant who reviewed the Pakistan and Egypt projects emphasized theneed for training and technology transfer from the manufacturers, both in the field andin the U.S., to better prepare the plant staff to handle the combined-cycle technology.
Source: RCG/Hagler, Bailey, Inc.

58
ANNEX- XPage 1 of 1
Qomparatiae Assessment of Generation Costs fc' Lrge Power aystems(5,000 MW and up)
Combined- Coal-Fired Fuel-OilCyclet Steam Fired Steam
Capacity (MW) 450.0 500.0 500.0Plant Factor (%) 65.0 65.0 65.0Energy Supply (GWh/yr.) 2562.3 2847.0 2847.0Energy Increments (%) 1st yr. 20.0 40.0 20.0
2nd yr. 50.0 70.0 50.03rd yr. 100.0 100.0 80.0
Unit Cost ($/kW) 600.0 1000.02 900.0Cost contingency (% Inv) 15.0 15.0 15.0Total Im. Cost (Million $) 310.5 575.0 517.5Annual O&M Cost (% Imv. Cost) 4.0 2.5 2.0O&M Unit Cost (a/kWh) 0.5 0.5 0.3Fuel nat. gas coal residualFuel Units MCF ton barrelHeat Content(BTU/unit) 1 25 5.9Thermal Efficiency (%) 46 38 39Fuel Price ($/unit) 2.5 40.0 15.0
(%/MMBTU) 2.50 1.80 2.54Escalation, % per yr. 1.0 0.5 1.0Annual Fuel Cost (Million $) 47.5 40.9 63.3Fuel Unit Cost (¢/kWh) 1.9 1.4 2.2Implementation Period (yr.) 3.0 5.0 5.0Economic Life (yr.) 20.0 25.0 25.0Generation cost (e/kWh) 4.2 4.9 5.5
t If the combined-cycle unit is distillate-fueled at a price of $25/bbl and 5.8 millionBTU/bbl with 46% efficiency the fuel unit cost would be 3.2/klWh, giving a generationcost of 5.7¢/kWh at 65% plant factor (7.1 e/kWh at 40% plant factor and 5.4e/kWh at75% plant factor), showing that distillate-fueling is uneconomic if gas is available.
2 This does not include flue gas desulphurization equipment as required in mostdeveloped countries.

59
Page 1 of 1
Comathre Aesment of Generation Co for Small Poser Systems(around 1,000 MW)
Combined- Coal-Fired Fuel-Oil Slow Speed!ele Steam Fired Steam Diesel
Capacity (MW) 90.0 100.0 100.0 90.0Plant Factor (%) 65.0 65.0 65.0 65.0Energy Supply (GWb/yr.) 512.5 569.4 569.4 512.5Energy Increments (%) 1st yr. 40.0 45.0 30.0 25.0
2nd yr. 70.0 75.0 55.0 55.03rd yr. 100.0 100.0 80.0 80.0
Unit Investment Cost ($/kW) 800.0 1500.02 1350.0 1200.0Cost Contingency % Inv) 15.0 10.0 10.0 10.0Total Investment Cost (million $) 82.8 165.0 148.5 118.8Annual O&M Cost (% Imv Cost) 4.0 2.5 2.0 2.0O&M Unit Cost ($/kWh) 0.6 0.7 0.5 0.5Fuel nat. gas coal residual residualFuel Units MCF ton barrel barrelHeat Content (BTU/Unit) 1 25 5.9 5.9Thermal Efficiency (%) 46 38 39 40Fuel Price ($/Unit) 2.5 40.0 20.0 20.0
($/4MBTU) 2.50 1.60 3.39 3.39Escalation, % per yr. 1.0 0.5 1.0 1.0Annual Fuel Cost (Million $) 9.5 8.2 16.9 14.8Fuel Unit Cost ($/kWh) 0.019 0.014 0.030 0.029Implementation Period (yr.) 3.0 4.0 4.0 3.0Economic Life (yr.) 20.0 25.0 25.0 20.0
Iff the combined-cycle unit is distillate-fueled at a price of $25/bbl and 5.8 millionBTU/bbl with 46% effiency the fuel unit cost would be 3.2 4kWh, giving a generation costof 6.5dkWh at 65% plant factor (8.4kWh at 40% plant factor and 6.t/kWh at 75% plantfactor), showing that distillate-fueling is uneconomic if gas is available.
lbis does not include flue gas desulphurization equipment as required in mostdeveloped countries.

i Awnuur p *Vt
(aMN. mm me Ca pus a inMy wa O *01 so 591no00P035. ~mds uuv =o*~u
on wt~ woo Aw.
LIS??m IWDLUUB 9 9t a0910U I qtROOM
0t 90t P81PU K K xq?Iqlcc 9 UWL tiSC a!g iiNg
CD9 o9 UwlU- an o noso to UNPIz.5 os * q(.uv.on VTsMOIWhm Ut: OC? wpity.
090? -0 vlw%O. Om 0? WW99? 591 in1eS am? IL? aMt "P 11 0£ ONC £q.
6w so sazID e V updnu v96 Ax? mc. s s 15t US PURD&,j; PUM amlgt on4t06
'-- 75 _5 065Et
099 oxS 1,00 gt fZt *E -0 %VM
Z0it GM _OmvV s e
en? 9S 155? Oat SdOI 06 t
at cce A RC MaaIs a?ts qP9W Pt 9? UWt#Lt tit "s 6 wPonUg
mg Gm? 09 gmSt
KOS us 11046VI" vu on N 093 UA
az fs o 99' a59 eN
III CC? ~ ~ ~ 1. Pt C? Jws
efEt Bt Xi-Il Z~~ ~ ~~~ ~~~tt Oul 4g11W
0a t5 P4 910 509 ?DS£ ats VMW St P w
: on PM op tt maSt *6t R-141 9S S9 8|||mtuSII on OSMO
9A 9 lSq810 CC? 0?lt
UK U.K 'ia~~~~~~W~~. 159O OK
59 am KegOtt Ott ttt etl
93 B l l Z t 9 Z E 119332 pa
os Os am WOOS LU on aMas9 9 VII8Q Ott on $WM*Is aO 6 _4. t at P56
If 39Z l. te9 e _
9m W*& _9 at VAPparv0
St~~~~~~~~~~~~~~O ug *
41131~( asS vrw0NV
am- off1
|&° W ~ timaa~~~~POA 4V
01181,9 pou mom555 pu 59

61
ANNEX 12Page 1 of 1
NOTH AMEA 12Canada 22Uited 8s 05
LATIN AMERICA 5.Arentna 27Mew Venezud t11
WESTE EUROPE we
Franc 7aIY 19
NWwlathls 24
UNd gdom 11Wedt emany 1t
EASTERN EUROPE 5 SRomanla 4USSR Ss
AFRICA 77Algda 54ibya 124.
Nigeria 112
MIDDLE EAST 280AbuiDha 289Iran 664raq 271
Kuwak 124.5Qaa 684.Saudl Amabia 117.
ASIVOCEANIA s8
Ausftrlia 121dan h 77.6
Brunei 345China 70India 70Indonodsa 52.Malaysia 85Pakstan 48.Thaflnd J
WORLD TOTAL soLDC Aveag 48
Souroe: See Annex 11.
11989 gross production minus reinjection capered to 1990 reserves.

62
Page 1 of 1
NATURAL WA *CCL04DEamo am WawalT PWWUCION in 1989W
(BILIOt CUBIC EVERS 1NiMALLY)
GROSS MARKETED GROSS MARKETEDPRQ0. gm, PR00. PRO
NORTH ANERICA 76.21 587.72 mIDOmE EASt 163.08 103.71CANADA 136.85 104.08 ABU-DHASZ 19.90 15.60UtStE StATES 589.41 483.64 AHRInt 7.60 5.27
DUBAI 4.13 2.28LATIN AAERICA 131.87 84.19 iRAn 43.60 22.20*ARGENTINA 25.32 20.38 IRA0 11.49 6.10'BOtIVtA 4.29 3.04 ISRAEUL 0.04 0.04* SMZIL 6.11 3.44 KJWAtt 11.10 8.16* CHILE 4.24 1.61 04Am 5.17 2.79*COLOMBIA s.04 4.13 WAR 6.75 6.09*EOUWA3R 0.70 0.08 RAS-AL-KHAItLAH 0.26 0.20*'mXCoo 36.92 26.21 SAUDI ARABIA 0.26 0.20'PERU 1.55 1.1S SNARJAN 5.01 3.90*TRINIDAD-TOBAGO 7.90 4.60 'SYRIAN ARAB REP. 1.55 1.00*'ENEZUELA 38.80 19.55 *TURKEY 0.17 0.17
USTERN anRO"E 215.97 194.65 ASIA 164.28 .139.93AUSTRIA 1.40 1.40 AFGNtSTAN 0.30 0.30DENMARK 5.62 2.83 AUSTRALIA 17.98 16.03FRANCE 4.35 3.03 *'ANGLADESH 4.65 4.65GERMANY, MED. REP 17.13 16.38 muIE 9.14 8.70iREECE 0.21 0.12 *'URMA 1.09 1.09
IRELAND 2.28 2.82 'CHINA 14.30 14.30ITALY 16.98 16.98 *INDIA 1s.7 10.42NETHERLANDS 39.32 30.59 'INDONESIA 55.00 40.34IOmAY 71.87 29.83 JAPAN 2.01 2.01SPAIN 17.13 1.S5 *'MLAYSIA t7.46 17.16UNITED KINSOM 52.39 44.75 NEV ZEALAND 5.88 4.53'YUGOSLAVIA 2.87 2.87 *PAKISTAN 13.45 13.45
RIVAN 1.42 1.42UfHAILAND 5.88 5.33
EATE a 882.10 851.90 WRID TOTAL 2457.43 2029.88ALSAIA 0.80 0.70'BULGARIA 0.10 0.01'CZECHOSLOVAKIA 0.84 0.84 35 LDC C^) TOTAL 468.38 307.37GERMANY, OEN. REP 10.78 10.78 (19.1w) (15.1k)*'UNGARY 6.49 6.19*POLAND 5.38 5.38
*RONAINA 32.30 32.00U.S.S.R. 825.50 796.00
ARICA 173.87 67.78'ALGERIA 119.65 48.40*ANGOLA 2.80 0.43*CONGO 1.15 0.00*EGYPT 9.53 7.74*'AlON 2.17 0.09*IVORY-COAST 0.19 0.00LIBYAN ARAB JAN. 13.80 6.00*'MROCCO 0.06 0.06*NIGERIA 23.90 4.70'TUNISIA 0.81 0.36
Sources Sm Abmx 11
I The dffference between grs production and maketed poductlon is due to tosses, flared pas and relnjected gs.

63
ANNX 14PAGE IOF1
Fuel Requirement for a 1,000 MW Gas-FueledCombinedSycle Plant
1. This annex develops the 20-year fuel requirement for a 1,000 MW natural-gas-fueledcombined-cycle plant in the developing countries.
2. Assuming the average lifetime plant availability will be 80%, the average annual plantfactor after allowances for some less than full-load operation would probably be 70%, equivalentto about 6,100 hours of full-load operation. The annual electricity output of a 1,000 MW planttherefore would be appraximately 6 GWh.
3. Assuming the average lifetime thennal efficiency is only 43% to allow for some fuellosses and some operation at less than the design efficiency, which might be 50% for the latestgas turbines, the energy requirement is 2,000 kCal (8,000 BTU) per kWh. Furtier assuming anatural gas with an average heat content of 250 kCal (1,000 BTU) per cubic feet, the gasrequirement is 8 CF per kWh.
4. The annual fuel requirement for a 1,000 MW combined cycle plant is therefore 48 billioncubic feet or 1.36 billion cubic meters. The 20-year lifetime fuel requirement for a 1,000 MWplant is 960 billion cubic feet (say 1 tcf) or 30 (rounded up from 27) billion cubic meters ofnatural gas. This fuel requirement figure permits comparing the size of the developing countrygas reserves and the fuel requirement for power generation, based on the expected power market(see Annex 15).

64
ANIMX 15Page 1 of 2
Casrsen of Power CoIlitv from Alitmbi.e Gan 3asevmand Pow Narkets
Natural Gas - bam Power - GM1989 1989 Avallable Gas 1999 Available GasGas Gross 10 Year Gas ftr Power Peak -Power-Years
C x Reserves Pr*Odctiq PrcductR1 PSeast CIembltU Ltgd At 1999 L
LAC CIOI
Argentina m 25.3 253 520 17.4 16.4 21Bolivia 147 4.3 43 104 4.7 0.7 127Brazit 109 6.1 61 48 1.6 62.4 1Chite 118 4.2 42 76 2.5 3.6 14Colombia 132 5.0 S0 82 2.7 10.0 5Ecuador 113 0.7 7 106 3.5 1.7 41Mexico 2078 36.9 369 1709 5.7 32.4 3Peru 340 1.S is 325 10.8 3.2 67Trinidad-Tobabo 470 7.9 79 391 13.0 1.4 186Vanezuela 2860 38.8 388 2472 82.4 25.0 66
1 C1SX
Atgeris 3230 119.6 1196 2034 67.8 6.1 222Butgaria 5 0.1 1 4 0.1 14.0 0Czechoslavakfa 14 0.8 8 6 0.2 25.0 0Egypt 329 9.5 95 334 11.1 12.2 18Nunwary 130 6.5 65 65 2.2 8.4 SJordan 28 0 0 28 0.9 1.0 18Ibrocco 3 0.1 1 2 0.1 2.7 1Pakistan 651 13.5 135 516 17.2 14.6 24Poland 171 5.4 54 117 3.9 35.2 2Romania 165 32.3 165 0 0 25.0 0Syria 113 1.6 16 97 3.2 6.0 11TimIsia 88 0.8 8 80 2.7 1.5 36Ture 33 0.2 2 31 1.0 19.0 1YeMen 156 0 0 156 5.2 0.6 173Yugowslavfa 85 2.9 29 56 1.9 6.6 3
owurce: Cedfgaz. Cedigaz notes that reported resrves from the developing countries sometimes reflectdifferences with respect to concepts and definitions.
lource: Cediga
hheoretical 10-year production at 1989 levels. Does not take into account field status, I.e., some ftltdsbeing depleted dile others are in developmoent stage.
4AssmUrIn full recovwerability of 1989 reserves. It does not consider other commitments nor future sasdiscoveries.
GW6 power possible for 20 years at 30bcm6JJ.
6Suce: IEI Energy Series Paper Uo. 21.
7Coltu. 5 divided by Cotum 6 times 20 years, giving an indicator of the nuber of years domestic gas resourcescould satisfy power demand levels of the late 1990s, neglecting all other existing or plamed pouer sources.

65
Page 2 of 2
Coawarisan of Pouer Canbf ltty fran Awlbie 6an Reservesad er Na
Natural tas - bcm Power - cU1989 1989 Avl table Gas 1999 Ava tabletGas
as Gross 10 Year Gas for Power Peak -Pow.erier8county Reserves1 Producitfe ProductfQn power4 CaoYbtdttf goae_ At 19" Load7
,AFRICl tlS1
Angola 49 2.8 28 21 0.7 0.4 35Cuieroon 110 0 0 110 3.7 0.2 370cogo 73 1.1 11 62 2.1 0.2 210Equatorial Guinea 2 0 0 24 0.8 neg 200Ethiopia 25 0 0 25 0.8 0.4 40Gabon 16 2.2 16 0 0 0.2 0Ivory Coast 100 0.2 20 80 2.7 0.7 77Nadagasaar 2 0 0 2 0.1 0.2 10Nozambiqie 65 0 0 65 2.2 0.2 220Nigerfa 2476 24.0 240 2236 74.5 4.7 317Rwanda 57 '0 0 57 1.9 0.1 380Samtli 6 0 0 6 0.2 0.1 40Sudan 85 0 0 85 2.8 0.7 80Tanzan 118 0 0 118 3.9 0.4 195Zaire 1 0 0 1 0 1.4 0
3antladesh 350 4.6 46 304 10.1 4.2 53surwm 267 1.1 11 256 8.5 1.1 154China 1000 14.3 143 857 0.2 25.0 4India 1050 15.7 157 893 29.8 112.3 5Indonesia 2462 55.0 550 1914 63.8 15.6 8Nalaysa 1487 17.5 175 1312 43.7 6.5 134apua New Guinea 128 0 0 128 4.3 0.2 430
Thailand 195 5.9 59 136 4.5 13.4 7
Source: Cedigag. Cedigaz notes that reported reserves from the developing countries sometimes reflectdifferences wfth respect to concepts and definftfons.
2Source: Cedfgaz. Cedigaz notes that reported reserves from the developing countrfes soatifes reflectdifffrences with respect to concepts and definitions.
3Theoretical 10-year production at 1969 levels. Does not take into account ffeld status, i.e., some fteldsbefri depleted whfle others are in development stage.
4Assuwmng full recoverabifilfty of 1989 reserves. It does not consider other comoitments nor future gasdiscoveries.
'W power possible for 20 years at 30bcm/GU.
'Source: IEN Energy Series Paper No. 21.
TColtun 5 divided by Colum 6 times 20 years, giving an indfcator of the nmber of years domestic gas resourcescould satisfy power demand levels of the late 1990s, neslecting all other existing or planed power sources.

66
ANX 16Page 1 of 1
Actual 1989 and Planned 1999 Combined4cleC:apacIt in the DEveloping Countries
Capacitv - MWActual Planned
Cou=ntr 1989 2 19992
Ivory Coast - 290Nigeria - 1,000Bangladesh 30 210Burma - 180India 1,900Indonesia - 1,500Malaysia 900 3,840Thaiand 772 2,532Egypt - 540Hungary - 300Paldstan 600 1,906Syria - 2,400Tunisia -150
Yemen - *80Yugoslavia - 600Argentina 85 140Bolvia - 132Mexico 1.790 1.870
Total 4,170 19,570
Source: E. Moore and G. Smith, "Capital Expenditures for Electric Powerin the Developing Countries in the 1990s", TEN Energy Series Paper No.21 February 1990.

- 67 -
No. 1 Energy Issues in the Developing World, February 1988.
No. 2 Review of World Bank Lending for Electric Power, Match 1988.
No. 3 Some Coniderations in Colecting Data on Household Energy Cmonsmption,Mach 1988.
No. 4 Imprving Power System Efficiency in the Developing Counies throughPerfmlance Contadng, May 1988.
No. 5 Impact of Lower Oil Prices on Renwable Energy Technologies, May 1988.
No. 6 A Compaison of Lamps for Domesdc Lighting in Developing Countries, June1988.
No. 7 Recent World Bank Activities in Energy (Revised October 1989).
No. 8 A Visual Ovriew of the World Oil Markets, July 1988.
No. 9 Current eonalGas Trades and Prices, November 1988.
No. 10 Promodng Investment for Natul Gas Exploration and Producdon inDeveloping Countries, January 1988.
No. 11 Technology Survey Report on Elctric Power Systems, Febnwy 1989.
No. 12 Recent Developments in the U.S. Power Sector and Their Relevance for theDeveloping Counties, Febmary 1989.
No. 13 Domestic Energy Pricing Policies, April 1989.
No. 14 Financing of the Energy Sector in Developing Counis, April 1989.
No. 15 The Future Role of Hydrpower in Developing Countries, April 1989.
No. 16 Fue!wood Stumpage: Considemtions for Developing Country Enery Planning,June 1989.
No. 17 Icaporting Risk and Uncertainty in Power System Planning, June 1989.
No. 18 Review and Evaluation of Historic Electricity Forcasting Experience, (1960-1985), June 1989.
No. 19 Woodfuel Supply and Environmental Management, July 1989.
No. 20 The Malawi Charcoal Project - Experience and Lessons, January 1990.
No. 21 Canial Expendiurs for Electric Power in the Developing Cuntries in the19Ws, Feb¢wmy, 1990.

- 68 -
No. 22 A Review of of the Power Sectors in Developing Countries,February 1990.
No. 23 Sumnma Data Sheets of 1987 Pbwer and Commercial Enr Statistics for 100Devrelog Counties, Match 1990.
No. 24 A Review of dte Teamtent of Enviomental Aspects of Bank Enengy P*ct,Mach 1990.
No. 25 The Stas of Liqified Natual Gas Worldwide, March 1990.
No. 26 Populaton Growth, Wood Fuels, and Resource Problems in Sub-SaharAfrica, March 1990.
No. 27 The Stats of Nuclear Power Technology - An Update, April 1990.
No. 28 Decommissioning of Nuclear Power Facilties, April 1990.
No. 29 Interfuel Substitution and Changes in dte Way Households Use Energy: TheCase of Coolkng and Lightng Behavior in Urban Java, October 1990
No. 30 Regulation, Deeg or Reregulaion-What is Needed in LDCs PowerSector? July 1990.
No. 31 Underding the Costs and Schedules of Wodd Bank Suppotd HydroelectricPIojects, July 1990.
No. 32 Reviw of Electiy Tariffs in Developing Counmries Dming the 1980s,November 1990.
No. 33 Private Sector Paricidaon in Power thrgh BOOT Schemes, Dcember 1990.
No. 34 Idenifying the Baic Condidtns for Economic Geeaton of Public Elecityfrom Suiplus Bagasse in Sugar Mills, April 1991.
No. 35 Prospex for Gas-Fueled Combined-Cycle Power Generation in the DevelopingCounties, May 1991.
Note: For exta cois of hes papes please call Pamela Sawhney on extension 33637in the mornng between 10-11 am. and in the aftenoon between 2-3 p.m. Fromoutside the country pls. call: Area Code (202) 473-3637. FAX No. (202)477-0560.

- 69 -
IDMUSIRY SERIE PAPERS
No. 1 Japanese Direct *Foreign hvestment: Patterns and Implications forDeveloping Countries, February 1989.
No. 2 Emerging Patterns of International Competiton in Selected IndustrialProduct Groups, February 1989.
No. 3 Changing Firm Boundaries: Analysis of Technology-Sharing Alliances,February 1989.
No. 4 Technological Advance and Organizational Innovation in the,Engineering Industry, March 1989.
No. S Export Catalyst in Low-Income Countries, November 1989.
No. 6 Overview of Japanese Industrial Technology Development, March 1989.
No. 7 Reforn of Ownership and Control Mechanisms in Hungaiy and China,April 1989.
PNo. 8 The Computer Industry in Industrialized Economies: Lessons for theNewly Industrializing, February 1989.
No. 9 Institutions and Dynamic Comparative Advantage Electronics Industryin South Korea and Taiwan, June 1989.
No. 10 New Environments for Intellectual Property, June 1989.
No. 11 Managing Entry Into International Markets: Lessons From the EastAsian Experience, June 1989.
No. 12 Impact of Technological Change on Industrial Prospects for the LDCs,June 1989.
No. 13 The Protection of Intellectual Property Rights and IndustrialTechnology Development in Brazil, September 1989.
No. 14 Regional Integration and Economic Development, November 1989.
No. 15 Specialization, Technical Change and Competitiveness in the BraanElectronics Industry, November 1989.

- 70 -
INDUSwx SERES EZRs cont'd
No. 16 Small Trading Companies and a Successful Export Response: LessonsFrom Hong Kong, December 1989.
No. 17 Flowers: Global Subsector Study, December 1989.
No. 18 The Shrimp Industry: Global Subsector Study, December 1989.
No. 19 Garments: Global Subsector Study, December 1989.
No. 20 World Bank Lending for Small and Medium Enterprises: Fifteen Yearsof Experience, December 1989.
No. 21 Reputation in Manufactured Goods Trade, December 1989.
No. 22 Foreign Direct Investment From the Newly Industrialized Economies,December 1989.
No. 23 Buyer-Seller Links for Export Development, March 1990.
No. 24 Technology Strategy & Policy for Industrial Competitiveness: ACase Study of Thailand, February 1990.
No. 25 Investment, Productivity and Comparative Advantage, April 1990.
No. 26 Cost Reduction, Product Development and the Real Exchange Rate,April 1990.
No. 27 Overcoming Policy Endogeneity: Strategic Role for DomesticCompetition in Industrial Policy Reform, April 1990.
No. 28 Conditionality in Adjustment Lending FY80-89: The ALCID Database,May 1990.
No. 29 International Competitiveness: Determinants and Indicators,March 1990.
No. 30 FY89 Sector Review Industry, Trade and Finance, November 1989.
No. 31 The Design of Adjustment Lending for Industry: Review of Current Practice,Jnme 1990.

- 71 -
INDU RY SERIES PAPERS cont'd
No. 32 National Systems Supporting Technical Advance in Industry: The BrazilianExperience, June 26, 1990.
No. 33 Ghana's Small Enterprise Sector: Survey of Adjustment Response andConstraints, June 1990.
No. 34 Footwear: Global Subsector Study, June 1990.
No. 35 Tightening the Soft Budget Constraint in Reforming Socialist Economies,May 1990.
No. 36 Free Trade Zones in Export Strategies, December 1990.
No. 37 Electronics Development Strategy: The Role of Government, June 1990
No. 38 Export Finance in the Philippines: Opportunities and Constraints forDeveloping Country Suppliers, June 1990.
No. 39 The U.S. Automotive Aftermarket: Opportunities and Constraints forDeveloping Country Suppliers, June 1990
No. 40 Ivestment As A Determinant of Industrial Competitiveness and ComparativeAdvantage: Evidence from Six Countries, August 1990 (not yet published)
No. 41 Adjustment and Constrained Response: Malawi at the Threshold ofSustained Growth, October 1990.
No. 42 Export Finance - Issues and Directions Case Stucdy of the Philippines,December 1990
No. 43 The Basics of Antitrust Policy: A Review of Ten Nations and the EEC,February 1991.
No. 44 Technology Strategy in the Economy of Taiwan: Exploiting Foregin Linkagesand Investing in Local Capability, January 1991
:in1 For extra copies of these papers please contact Miss Wendy Young onextension 33618. Room S-4101