Embed Size (px)
Citation preview

(proposed) EA2003 Amendments
Growing Coal, Growing RE, DisCom Realities, and Carbon Implications
September 29, 2015
Rahul Tongia, Ph.D.Fellow, Brookings
also Adj. Professor, Carnegie MellonAdvisor, India Smart Grid Task Force
Advisor, India Smart Grid Forum

Disclaimer
• These slides are a slightly modified version of what was presented on 29th September at the Brookings Event – to enable readers to follow without having been present
• Brookings India holds no institutional view…
2

Focus Areas for Discussion
• Want to consider the portfolio of energy (power) options…on the supply side mostly
• What is NOT the focus• Paris negotiations per se• Economics of DisComs per se• Any externalities beyond variable carbon (such as
construction/other lifecycle), let alone fossil fuel externalities
• Focus includes• Grid integration• Utilities making a choice of what they want to run (load
despatch)• Hidden and unknown issues (including costs)
3

Looking out 5, 10, etc. up to, say, 35 Years
• 2050 is a VERY long ways• Compare India of 1980 and 2015!
• Let’s begin looking at the coming 5-10 years1. Extrapolate from today identically – A thought exercise only2. See what changes
• Consumer mix• Tariffs Fuel mix• Time of Day Granular Demand
• How do all these impact total system:• Efficiency• Cost• Carbon
4

Avg. Daily Load Curve:All India Electricity Supply
5
60,000
70,000
80,000
90,000
100,000
110,000
120,00012
:00
AM12
:30
AM1:
00 A
M1:
30 A
M2:
00 A
M2:
30 A
M3:
00 A
M3:
30 A
M4:
00 A
M4:
30 A
M5:
00 A
M5:
30 A
M6:
00 A
M6:
30 A
M7:
00 A
M7:
30 A
M8:
00 A
M8:
30 A
M9:
00 A
M9:
30 A
M10
:00
AM10
:30
AM11
:00
AM11
:30
AM12
:00
PM12
:30
PM1:
00 P
M1:
30 P
M2:
00 P
M2:
30 P
M3:
00 P
M3:
30 P
M4:
00 P
M4:
30 P
M5:
00 P
M5:
30 P
M6:
00 P
M6:
30 P
M7:
00 P
M7:
30 P
M8:
00 P
M8:
30 P
M9:
00 P
M9:
30 P
M10
:00
PM10
:30
PM11
:00
PM11
:30
PM
MW
All Years (average) 2009 2010 2011 2012 2013
Source: NLDC data(Calendar Years)

Supply (last slide) vs. Demand: What is missing?
• See discontinuities (esp. morning and evening)• This is phase-rostering (and now feeder segregation)
• What about LOAD SHEDDING?• Reality check: official shortfall methodology isn’t
instrumented, and is assumption driven• This impacts IPDS, 24x7 Power, Renewables Integration,
etc.
6

Karnataka 2013 Load Duration Curve
7
0
1000
2000
3000
4000
5000
6000
7000
8000
9000
10000
MW
HOUR
Load Met Load Shed
1~8760
(few missing points)
Source: KPTCL Raw Data
Note: “Capacity” is far higher

Variability of Wind across Karnataka(1 minute resolution)
8
Annual Avg. PLF ~22% (2012 and 2013)

Hourly Solar Input in Goa
0.00
0.10
0.20
0.30
0.40
0.50
0.60
0.70
0.80
0.90
1.00
6 7 8 9 10 11 12 13 14 15 16 17 18 19
kWh/
m2
Ending Hour
January
February
March
April
May
June
July
August
September
October
November
DecemberDaily radiation varies by month from 4 -7 kWh/m2
9
Source: Ramachadra & Subramanian (1997)

Sample Rajasthan Load Curve Projection
10
Source: WartsilaNeed flexible generators suitable for ramping
Candidates: Open cycle gas turbine, hydro, and internal combustion engine – plus other storage, and demand response

RE: Why India is “Different”
[Unlike Germany, USA, etc.]• Our 6% RE (excl. hydro) is ~ to Germany’s 25%!
• Germany has• Not just solar (fair amount of biomass/CHP)• A stronger grid• Interconnection to Europe (4+ times greater balancing)
• We have more trouble sharing RE across state boundaries than Europe has crossing national borders
• We have a capacity problem, not an energy problem per se (have times of surplus)
• Limited “peakers”• New Hydro is challenging for various reasons• Gas is limited (and few open cycle plants)
11

“Dis-equilibrium”
• This isn’t just “missing” equilibrium – this is when it isn’t even attempted
• Wholesale prices <Rs. 3/kWh – yet DisComs not buying
• Lack of (liquid) wholesale markets• Settlement terms
• States are not enamored of RE• Operational and financial concerns• “Grid Parity” is a misleading term
12
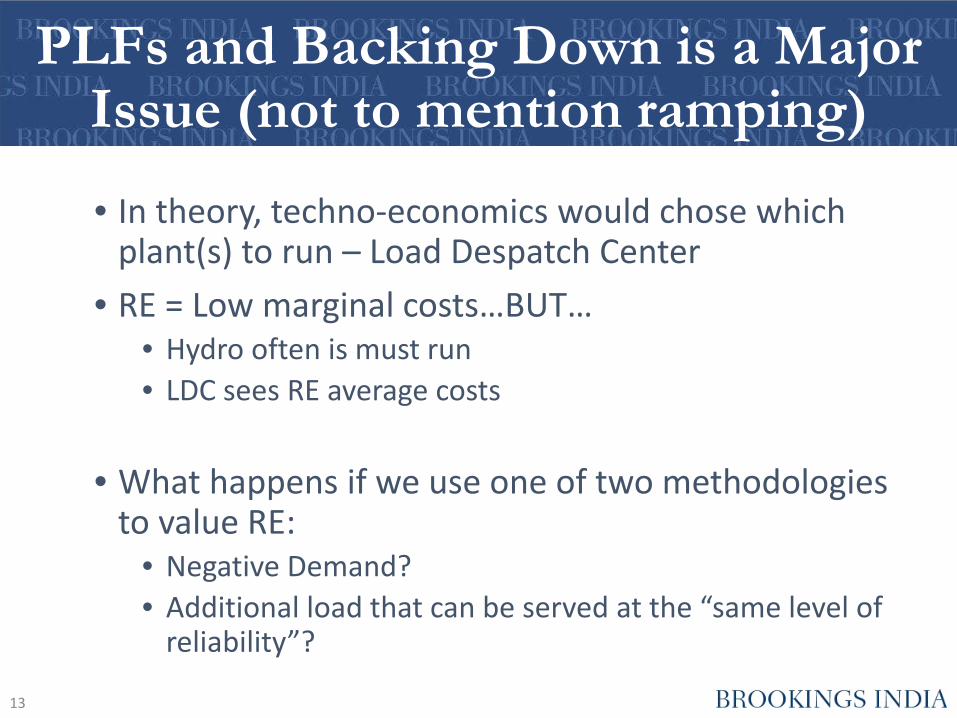
PLFs and Backing Down is a Major Issue (not to mention ramping)
• In theory, techno-economics would chose which plant(s) to run – Load Despatch Center
• RE = Low marginal costs…BUT…• Hydro often is must run• LDC sees RE average costs
• What happens if we use one of two methodologies to value RE:
• Negative Demand?• Additional load that can be served at the “same level of
reliability”?
13

US Electricity 2013Power Source Plants Summer
Capacity (GW)% of total Capacity
Capacity Factor
Annual Energy (billion kWh) % of Total US
Coal 518 303.3 28.61 0.595 1,581.12 38.44
Nat Gas 1,769 427.5 40.33 0.304 1137.69 27.66
Nuclear 63 99.2 9.36 0.908 789.02 19.18
Hydro 1,435 79.2 7.47 0.387 268.57 6.53
Other Renewables 2,299 82.6 7.79 0.35 253.5 6.16
Petroleum 1,101 43.5 4.1 0.071 27.16 0.66
Misc 78 2.3 0.22 0.675 13.59 0.33
Storage 41 22.4 2.11 -0.024 -4.68 -0.11
Import 46.73 1.14
Total 7,304 1060 100 0.443 4,112.70 100
14 Source: EIA Electric Power Annual 2013

India Generation 2014-15
Monitored Capacity (MW)* PLF
NTPC 38,107.23 79.61%
Central (thermal) 55,649.73 73.96%
State (thermal) 65,473.49 59.83%
Private Util (thermal) 3,865.00 65.07%
Pvt. IPPs (thermal) 63,642.50 60.20%
Nuclear 5,780.00 80.74%
State (hydro) 24,581.70 31.40%
Central (hydro) 13,975.72 41.60%
15
Source: CEA* As of March 2015
State-Central plant dynamics will get further complicated by RE…

Do we differentiate sub-optimally?
• State vs. Center• Thermal vs. others
• Draft policy: Thermal plants to cycle down to 55% output (esp. in response to grid conditions, e.g., RE)
• This is akin to a marathon runner asked to run sprints!• Some compensation offered – not enough
• Heat rate penalty – worse for cycling than steady state• Wear and tear• This can be amplified by the large size of many thermal plants
16

How the Future will be different
• (Unrestricted) Demand will be less flat (=more peaking)• No load shedding• IP sets growth should plateau• Consumer demand growth
• LEDs notwithstanding
• Other shifts• Electric Vehicles• Smart Grids
17

Putting India’s 175 GW RE by 2022 in C perspective
• 2015• 6% of power, on ~1000 BU total power base
• 2022• 4.375x RE power, but base also grows
• Assume total grows 7% per annum total (disproportional RE)• While E intensity to GDP may be less than 1, there are mitigating factors
• Past shortfall/electrification/etc. to manage• Future non RE growth may be more C than 2015 average (limited hydro
growth)• Non-electricity energy use likely to grow faster (e.g., vehicles, industry, etc.)• Higher RE can impact thermal fuel efficiencies if ramping needs increase
• This means even this heroic effort is a power decarbonization of -1.1% only, maybe lower (due to mitigating factors)
• This decarbonization is electricity only, at best (limiting coal growth to keep total elec. growth 7% with high RE)18

7 Years Out - projections
(Mid-year) 2015 Estimated 2022
Total Generation (BU) [gross] 1000 1605.8
RE 60 262.5
Hydro 137 154.125
Nuclear 36 50.4
Thermal 767 1138. 8
19
This implies a power decarbonization of power of -1.1% per annum over 7 years
7% annual total growth
175 GW RE
Limited new hydro; 12.5% growth
40% growth
Balance is thermal

Carbon Intensity per Energy
20
0
0.5
1
1.5
2
2.5
3
3.5
4
1965
1967
1969
1971
1973
1975
1977
1979
1981
1983
1985
1987
1989
1991
1993
1995
1997
1999
2001
2003
2005
2007
2009
2011
2013
T CO
2 pe
r T O
il Eq
uiv
US France Germany China India World
Source: BP Statistical Abstract and World Bank Raw Data

(de)Carbonization of Energy annual rates
21
-8
-6
-4
-2
0
2
4
6
1966
1968
1970
1972
1974
1976
1978
1980
1982
1984
1986
1988
1990
1992
1994
1996
1998
2000
2002
2004
2006
2008
2010
2012
2014
Annu
al (d
e)ca
rbon
izatio
n (%
)
US France Germany China India World

De(carbonization) observations
• Even France, which did very well in some years, wasn’t consistent
• Was building 30 large nuclear reactors simultaneously over 5 years
• For India to go down to 1.6 C intensity (T CO2 per T Oil Equiv) by 2050 from 3.27 [2014] implies -2.02% decarbonization of energy CAGR
• Is it even possible (forget the cost)?
• Ultimately, this must be coupled with similar heroic efforts on energy intensity
22
Average energy decarbonization CAGR (%)
1965-2014
US -0.16
France -1.54
Germany -0.73
China -0.15
India -0.14
World -0.30

Economics of RE: “It Depends”
• Multiple metrics of optimization• Carbon, cost, risk, etc.
• Multiple Stakeholders• Generator, State Load Despatch Center, POSOCO (aka
ISO)
• One problem of RE and energy pricing – a single metric of “cost” = often the LCOE
• Levelizing rates matter, and levelizing itself is fraught with assumptions
• Variances and rates will vary, e.g., coal auctions might stabilize or even reduce coal prices
23

Comparing Coal and Solar
• Key issues• Domestic vs. Imported
coal• Solar type
• Domestic vs. Open• Best or average (bids)
• Marginal or avg. coal costs
• Trends of escalating inputs
• Fuel• Inflation• Forex
24
Source: Blowing Hard or Shining Bright? Making Renewable Power Sustainable in India (2015) [Brookings India]

Challenges and Options
1. Grid Integration• Variability and Stochasticity are BOTH issues• Evacuation is a subset of the problems
2. Pricing power better (procurement, before worrying about retail)
3. Measuring variable emissions• Carbon and more
• Ramping causes efficiency penalties on thermal plants
25

Options for the Future
1. Signaling for Grid Optimality• Larger Balancing Areas or at least better flows between areas• Proper ancillary services (more than just primary frequency control)
2. New markets and systems to capture marginal costs• ToD pricing
• Peaking supply• Neither Coal nor RE may work for this
• Locational Marginal Pricing for transmission• Valuing load-shedding as having a cost!• Wholesale markets
• NOTE: India lacks Mark-to-market pricing for most kWh• RE can make wholesale prices negative!
3. Need to capture instantaneous outputs (not just averages)• New Reporting schemes• New Rating Schemes (e.g., Green Ratings)
26

New Reporting Mechanisms
• REMCs are just a start (focus: predictions and monitoring)• Need standardized, online, granular reporting
• First step is instrumentation• This also ends mistrust
• Power Plants• Output• Input (fuel)
• Effective heat rate• Marginal costs• Technical back-down• Economic back-down• Emissions monitoring in real time (local emissions are a major issue)
• DisComs (ideally feeder level)• Demand• Rostering and Load shed
27

Policy Suggestions (cont.)
• Green (and other Ratings)• Today’s Utility Ratings (e.g., ICRA) do not sufficiently link
finances with operations• Quantum of load shedding• RPO compliance and share of RE
• Implicit cost of load shedding• Is already a cost – passed on to consumers
• Paying for removing load-shedding may need inter-ministerial transfers (e.g., kerosene reduction)
• Same tools to manage load-shedding can help with variability of RE (e.g., visibility, peakers, balancing, Smart Grids)
• Ending load-shedding may take time• Can we start with penalizing unscheduled load-shedding?
28

Rethinking RPOs
• Hydro (and storage) may be key enablers• If a neighboring state has hydro (or, better, pumped
hydro), can they be credited for sharing that?• Same could apply to Demand Response (Smart Grids)
• Suggestion: re-think an RPO to include enabling support (hydro, pumped hydro, demand response, etc.) as specifically linked to greater RE
• IF one had the markets, one could do it via economic signaling
• Europe already shares hydro storage and pumped hydro across national borders (esp. for RE)
29

Pumped/Storage Hydro in Europe –Aimed to enable more RE
30
82
34
93
0.05
Scandinavia Alps Germany
TWh
Norway Sweden
Switzerland Austria
Germany
Source: Weltenergierat

Fundamental Qs
• How do we better optimize the portfolio of supply?• If RE is negative demand, and “must run”, does this impact the
PLFs of new coal?• Is there a point when RE isn’t a new kid on the block (worthy of
support) but more the core?• What does that do to the grid?
• How do we avoid the Utility Death Spiral?• Worsened in India due to tariff distortions ala subsidies• Need to figure out the role of the grid (utility), and the costs
• At what point would a developer say, “coal plants aren’t worth it”?
• Can we get granular carbon monitoring and green ratings for power plants?
31

Armies cannot stop an idea whose time has come– Victor Hugo
32