Embed Size (px)
Citation preview

Property Data Report 2014

This document sets out some key facts about commercial property, a sector that makes up a major part of the UK economy in its own right, as well as providing a platform for virtually all the country’s other major industries. It is a sector that plays a crucial role by providing places in which people can work, shop and enjoy leisure activities. Similar in size to banking and larger than the leisure, communications and transport sectors, commercial property is also a significant investment asset for the pensions industry, and so contributes to the financing of retirement.
This latest Property Data Report has been fully updated and now includes, for the first time, information on the size of the private rented residential sector. Drawing on the detailed analysis presented in two 2014 IPF Research Programme reports, The Size and Structure of the UK Property Market 2013: A Decade of Change and The Size and Structure of the UK Property Market 2013: End 2013 Update, it also presents an overview of the value of the UK commercial property market and other comparative data.
It has been produced by:• The Association of Real Estate Funds;• The British Council for Offices;• The British Council of Shopping Centres;• The British Property Federation;• The Commercial Real Estate Finance Council Europe;• The Investment Management Association;• The Investment Property Forum;• The Royal Institution of Chartered Surveyors;• The Urban Land Institute.
All nine bodies are members of the Property Industry Alliance, which seeks to achieve a more co-ordinated and effective approach from leading property bodies on policy, research and best practice issues.
Property Data Report 2014 1Property Data Report 2014
Introduction

Commercial property is defined as including retail, offices and industrial premises (warehouses and most types of factory), plus ‘other commercial’ types typically used for business purposes such as leisure (cinemas, fitness clubs and gyms, leisure parks, etc.), hotels, petrol stations and other miscellaneous types.
The value of the UK’s stock of commercial property increased to £683 billion in 2013. The 5% increase in value over 2012 mainly reflected lower yields (meaning that buyers paid more for a given rent) as there was little change in either the amount of floorspace or in rental levels.
1,97
3
2,30
7
1,52
5
1,52
5
650*
683
735
771**
End 2012* Revision to the estimate presented last year – see ‘Sources and Definitions’ for further details** End-2013 = estimated
End 2013
0
500
1,000
1,500
2,000
2,500
Commercial property underpins a substantial part of business, retail and social activity, representing 27% of the national stock of non-residential fixed assets (infrastructure, plant, machinery and equipment, vehicles, non-commercial buildings, etc.).
Its value is comparable to the country’s stock of machinery, equipment and vehicles and is about 30% of the value of the UK’s stock market and 45% that of government bonds.
Commercial property accounts for an eighth of the value of all buildings in the UK. Other non-domestic buildings – mainly healthcare, schools, colleges and universities – constitute a fraction of the value of commercial property.
Residential: owner-occupied and social housingResidential: private rented
Total residentialOther non-domestic buildingsCommercial property
£4,670 bn£127 bn
£683 bn
£1,365 bn
£839 bn £3,831 bn
Residential property dominates the built environment, being almost seven times greater in value than commercial property. Within the residential sector, the private rented sector alone is of greater value than commercial property.
1 Commercial property by comparison 2 Commercial property’s size in the built environment
Property Data Report 2014 3Property Data Report 20142

Since 2000, the value of the UK’s commercial property stock has grown at an annualised rate of 2.3%, which is less than the rate of inflation.
The value of the residential stock, having recovered strongly after the recession, has grown substantially faster at 6.3% per annum. Both residential prices and the amount of housing have increased more quickly than those in the commercial property sector over the last 10 years, and over the last five in particular.
Other non-domestic buildings – mainly education and health – have grown at a marginally faster rate than commercial. The value of machinery, equipment and vehicles in the UK has also grown at a faster rate than commercial property.
Nom
inal
valu
e, in
dex
2000
= 1
00
0
50
100
150
200
250
20002001
20022003
20042005
20062007
20082009
20102011
20122013
Commercial buildings (2000: £506bn, 2013: £683bn)Other non-domestic buildings (2000: £84bn, 2013: £127bn)Residential buildings (2000: £2106bn, 2013: £4670bn)Plant, machinery, vehicles, etc. (2000: £479bn, 2013: £771bn)Inflation (RPI)
Retail, comprising shopping centres and out-of-town retail warehouses, as well as food and department stores and high street shops, is the largest single commercial sector, accounting for 45% of the total value of commercial real estate at the end of 2013.
In the office sector, London dominates, with the capital’s offices accounting for 63% of the sector’s total value, but only 25% of the UK’s office floorspace. Hotels are the largest part of the fast-growing ‘other commercial property’ sector.
distribution of all (owner-occupied and invested) commercial property in 2013
£bn% of
totalRETAIL 305 45
Shopping centres 61 9Retail warehouses 48 7Other retail (including foodstores) 196 29
OFFICES 195 29London 123 18South Eastern 23 3Rest UK 48 7
INDUSTRIAL 126 18London and South Eastern 49 7Rest UK 77 11
OTHER COMMERCIAL 58 8Hotels 26 4Leisure 15 2Miscellaneous other commercial 17 2
TOTAL COMMERCIAL PROPERTY 683 100London 241 35
Overall, London accounts for 35% of the total value of UK commercial property, compared to its 23% share of GDP. London’s share of commercial property has grown from 26% in 2003, mainly because its property prices have risen by more than half, whereas prices in the rest of the country have remained flat.
3 Commercial property sectors: a detailed look
4 Commercial property trends
Property Data Report 2014 5Property Data Report 20144

Over half of the UK’s commercial property is rented by occupiers, in contrast to residential property, where almost two-thirds of the stock is owner-occupied.
With many businesses increasingly reluctant to commit capital and management time to the owner-occupation of their property, and with investors having a healthy appetite for the acquisition of commercial buildings, renting grew significantly during the last decade.
The proportion of commercial property that is rented, however, has stabilised since the late 2000s downturn in the economy.
Commercial (by capital value)
Rented 2003 Rented 2013
Residential (by number of dwellings)
20
0
40
6050
31
56
37
Prop
ortio
n of
tota
l (%
)
The renting of homes declined until the early 2000s but since then the volume has grown, reflecting, in particular, a doubling in the proportion of those who are renting privately. Privately rented housing now accounts for 18% of the value of the UK’s housing stock, according to the IPF’s The Size and Structure of the UK Property Market: End-2013 Update (2014).
5 Renting versus owning 6 Renting commercial property: leases
The average length of a new lease, of 4.5 years, is substantially lower than 10 years ago. Four out of five new leases are for a term of five years or fewer, compared with 63% in 2003.
average length of new leases (years)* 2003
Mid- 2013
All 6.8 4.5
Retail 8.8 5.3Office 5.3 4.5Industrial 4.7 3.2SMEs 5.0 4.1**
Large companies 9.5 5.2**
Proportion of new leases 1-5 years’ duration 63% 81%Proportion of new leases with break clauses 22% 31%***
Average rent-free period (months) 5.6 9.5
* Excluding exceptional and short leases ** 2011 data *** 2012 data
Larger tenants, occupying bigger units, hold relatively long leases, although these have shortened significantly over the last decade.
In addition to becoming shorter, leases have become more flexible. Many tenants benefit from rent-free periods at the commencement of a lease and the length of these rent- free periods has extended. Furthermore, break clauses are more prevalent than 10 years ago.
Property Data Report 2014 7Property Data Report 20146

Rents account for a relatively low share of business costs. Office rents, at £14 billion per annum, are proportionately very low (7%) relative to occupiers’ staffing costs.
The rental costs of retailers, at £18 billion, are a third of the level of staff costs and represent a small fraction (about 5%) of their turnover.
Business rates Rent Employment costs
Offices Retail
6 14
189
718
50
Tota
l cos
ts, £
bn
2013
Business rates add around 40% to the cost of renting retail and office property and have become a more significant property cost in recent years, as described in Section 8.
Rents in both the retail and office sectors have increased at a much slower rate than other business costs over the last 10 years and well below the rate of retail price inflation.
In contrast, business rates have increased at a much faster rate than rents and, on average, in line with inflation. The big divergence in the retail sector between muted rental growth and the rise in business rates reflects the substantial uplifts in their rateable values in the revaluations introduced in 2005 and, most recently, 2010. Similar considerations apply to offices outside London.
10 y
ear a
vera
ge c
hang
e pe
r ann
um (%
)
0
1
2
3
4
5
Rent Business ratesRPIEarnings
Offices Retail
1.1
2.93.2 3.3
0.5
3.9
2.5
The 10% per annum rise in the cost of utilities over the last 10 years has far outstripped all other measures.
7 Commercial property as a business cost 8 Commercial property as a business cost: inflation
Property Data Report 2014 9Property Data Report 20148

Most investors (other than the institutions) and many occupiers buy commercial property using a combination of debt and their own capital. The volume of debt finding its way into the commercial property market grew rapidly in the 2000s until the recession.
De Montfort University’s (DMU) most recent survey suggests about £170 billion of debt is secured on commercial property investments (including commercial development but excluding residential and non-commercial development). This implies that around 44% of the value of commercial investment property is financed through debt.
Historically, UK banks and building societies were the principal lenders. Since the financial crisis, the lending market has changed, with a broader range of debt providers (such as insurance companies and debt funds) competing alongside UK and overseas banks.
£ bn
, end
201
3
0
100
200
300
400
Total value of commercial investment property
Debt secured on commercial investment property (DMU)
385
170
Both the DMU and data from the Bank of England show a significant decline in the amount of outstanding debt since 2009 and, in particular, a decline of 10-15% in 2013.The volume of debt supported by commercial property is overshadowed by home-owner mortgage borrowing, which is approximately six times as great.
Investors account for £385 billion of the £683 billion commercial property in the UK. The amount invested directly in property has increased by more than a third over the last 10 years. This is greater than the underlying increase in the overall stock of commercial property, reflecting a shift away from owner-occupation but also moves by investors into previously untapped commercial property sectors such as hotels, petrol stations and car showrooms.
Overseas owners’ holdings have increased substantially over the last 10 years (particularly in 2013, when sovereign wealth funds were significant investors). This group now owns almost a quarter of all commercial investment property. This proportion is still well below their 53% stake in the UK equity market. Three-quarters of their commercial property is located in London.
holdings in commercial property by investor type
£bn 2013
% change 2003-13
% of total
Overseas investors 94 129 24
UK institutions (insurance companies and pension funds) 75 -16 19
UK collective investment schemes 63 134 16
UK REITs and listed property companies 55 38 14
UK private property companies 53 6 14UK other 18 -4 5UK traditional estates/charities 17 24 4UK private investors 10 20 3
TOTAL 385 34 100
Ownership by collective investment schemes (managed funds, property unit trusts, limited partnerships, etc.) has also grown substantially, reflecting increased interest from smaller institutional and retail (individual) investors and overseas institutions, as well as a shift in personal savings habits towards unit trusts.
9 Commercial property lending 10 Investors in commercial property
Property Data Report 2014 11Property Data Report 201410
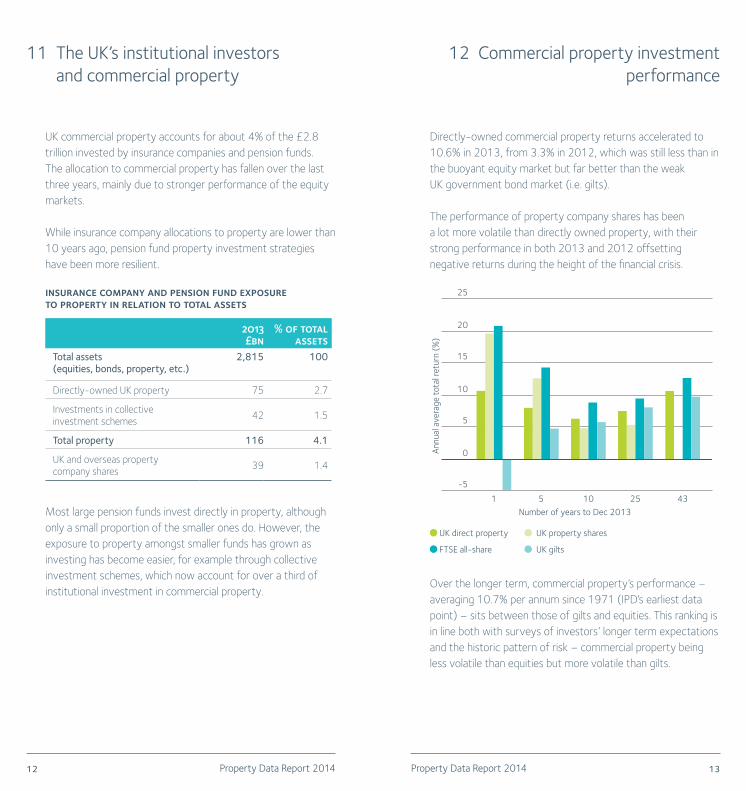
UK commercial property accounts for about 4% of the £2.8 trillion invested by insurance companies and pension funds. The allocation to commercial property has fallen over the last three years, mainly due to stronger performance of the equity markets.
While insurance company allocations to property are lower than 10 years ago, pension fund property investment strategies have been more resilient.
insurance company and pension fund exposure to property in relation to total assets
2013 £bn
% of total assets
Total assets (equities, bonds, property, etc.)
2,815 100
Directly-owned UK property 75 2.7
Investments in collective investment schemes 42 1.5
Total property 116 4.1
UK and overseas property company shares 39 1.4
Most large pension funds invest directly in property, although only a small proportion of the smaller ones do. However, the exposure to property amongst smaller funds has grown as investing has become easier, for example through collective investment schemes, which now account for over a third of institutional investment in commercial property.
Directly-owned commercial property returns accelerated to 10.6% in 2013, from 3.3% in 2012, which was still less than in the buoyant equity market but far better than the weak UK government bond market (i.e. gilts).
The performance of property company shares has been a lot more volatile than directly owned property, with their strong performance in both 2013 and 2012 offsetting negative returns during the height of the financial crisis.
-5
0
1 5 10 25 43
5
10
Annu
al av
erag
e to
tal r
etur
n (%
)
FTSE all-share UK gilts
15
20
25
UK direct property UK property shares
Number of years to Dec 2013
Over the longer term, commercial property’s performance – averaging 10.7% per annum since 1971 (IPD’s earliest data point) – sits between those of gilts and equities. This ranking is in line both with surveys of investors’ longer term expectations and the historic pattern of risk – commercial property being less volatile than equities but more volatile than gilts.
11 The UK’s institutional investors and commercial property
12 Commercial property investment performance
Property Data Report 2014 13Property Data Report 201412

The commercial property industry directly employed over 900,000 people in 2013 and contributed about £54 billion to the UK’s economy, accounting for 3.8% of the national total. This is comparable to the combined size of the country’s telecommunications and transport industries, highlighting its importance to business and people’s daily lives.
The rental values generated by commercial property portray a similar contribution – 3.6% of the UK’s total Gross Value Added (GVA).
commercial property industry gross value added 2013
Construction, development and repair of buildings Management and care of buildings Transacting, financial and professional services Property investment
Whole economy £1,419 bn Commercial property £54 bn
£23 bn
£54 bn £22 bn
£3 bn£6 bn
£1,365 bn
Most activity involves the construction, development, repair, care and management of buildings. The property investment sector (primarily investment and fund managers, REITs and property companies) is a small but high value added part of the industry, and the largest in Europe. It generates around £330,000 value added per employee – almost eight times the average for the economy as a whole.
The commercial property industry has been amongst the worst affected by the recession, shedding almost 200,000 jobs since December 2008, and recording a relatively large fall in its GDP. Only publishing and civil engineering have seen comparably proportionate falls in employment.
Commercial property construction was worst affected by the downturn, with a 32% loss in jobs. Research on behalf of the Investment Property Forum found that the UK economy is extremely sensitive to changes in commercial construction, a consequence of which has been that the deep recession in the commercial property sector has dampened the national recovery.
employment in the commercial property industry
Construction, development and repair of buildingsManagement and care of buildingsTransacting, financial and professional servicesProperty investment
0
200
400
600
800
1,000
December 2013December 2008
Empl
oym
ent (
’000
)
1963
207
818
1756
283
558
Activity and employment in the commercial property industry picked up in 2013 from the low levels recorded in 2012. All parts of the industry benefitted, although activity in the construction industry was much less buoyant than the commercial property industry as a whole.
13 Commercial property: economic contribution
14 Commercial property: change in economic contribution
Property Data Report 2014 15Property Data Report 201414

The commercial property industry is taxed directly and indirectly in a variety of ways. The direct contributions from some of these taxes – including Stamp Duty Land Tax, VAT, PAYE and National Insurance contributions – can be calculated with reasonable accuracy and are illustrated below.
Such taxes amounted to almost £14 billion in 2013, accounting for a quarter of the commercial property industry’s GVA. Proportionately, this is a greater tax burden than on the economy as a whole, exacerbated by the taxation of property transactions through Stamp Duty. Relative to their values, commercial property is taxed much more heavily than residential property.
0
5
10
15
20
25
30
Taxes paid by commercial property
as % of its GVA
Tax paid by commercial property
industry £bn
£ bn
/% o
f GVA
Taxes paid in the whole economy as % of its GVA
Stamp Duty Land TaxVATPAYE and NICs
£6.5 bn 12% 17%
£4.8 bn
9%
6%
£2.5 bn
5% 1%
Other taxes directly paid by the industry, ranging from Corporation Tax to rates on empty property and the Community Infrastructure Levy, are much harder to assess. In addition, occupiers of commercial property paid £20 billion in Business Rates, some of which, effectively, will be borne by property owners as a result of the lower rents achieved due to this burden.
The commercial property industry on average adds about 50 million square feet of new space every year. This has a value of around £10 billion and contributes almost 1% to the UK’s GDP.
Average annual completions since the start of the recession have fallen by about a half in the retail and industrial sectors and by a third in the office sector.
Offices Retail Industrial0
£m/'0
00 sf
5,000
10,000
15,000
20,000
25,000
30,000
Completions ('000 sf, 10-year average)Value £m (2013 prices)
12,660 13,408
26,893
3,801 3,901
1,706
Activity picked up marginally in 2013; for example, estimates by Property Market Analysis show a rise in completions in both the retail and office sectors from their very low levels in 2012.
15 Taxes paid to the national exchequer 16 The commercial property industry: regeneration
Property Data Report 2014 17Property Data Report 201416
Commercial property accounts for about 9% of the UK’s energy consumption. Other non-domestic buildings, mainly schools, colleges and hospitals, and the heating and lighting needs of factories, bring the total used in non-residential buildings to 16%. By contrast, almost a third of the UK’s energy consumption occurs in the home.
Energy consumption increased in both 2012 and 2013 in all types of buildings as a result of colder winters, while the stronger economy and business activity levels also led to greater consumption in commercial buildings.
energy consumption by end user, million tonnes oilequivalent 2013
Activities in commercial property (excluding industrial)Activities in other non-domestic propertyIndustrial buildings – heating and lightingIndustry – industrial processes, etc.Domestic consumptionTransportOther
44
20
4
7132
53
Shops, whilst the largest consumer of energy in the commercial property sector, tend to be more efficient, having better than average Energy Performance Certificates (EPCs) according to a recent Government report. Overall, about a third of commercial property buildings have an ‘A’ to ‘C’ EPC rating.
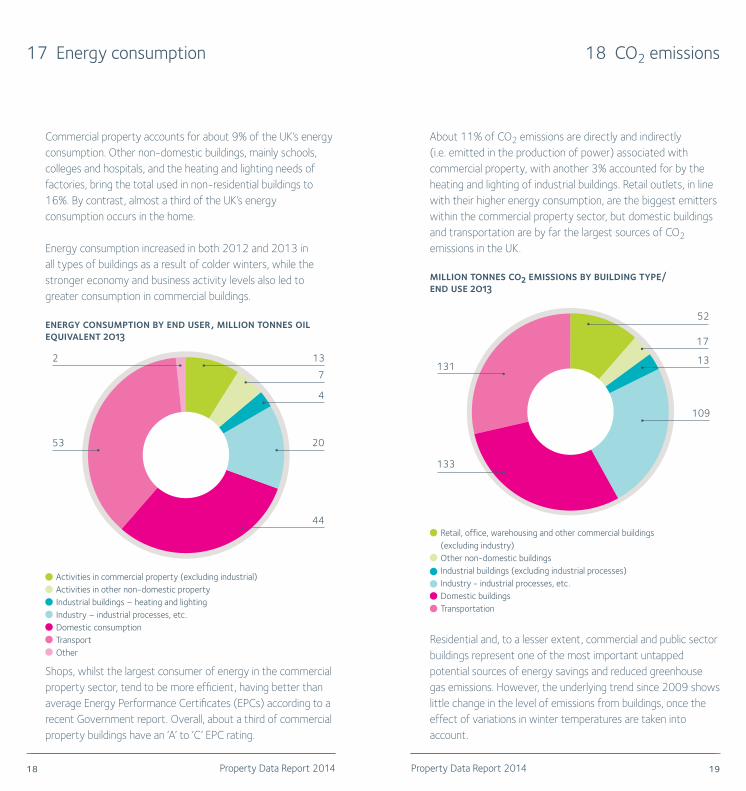
About 11% of CO2 emissions are directly and indirectly (i.e. emitted in the production of power) associated with commercial property, with another 3% accounted for by the heating and lighting of industrial buildings. Retail outlets, in line with their higher energy consumption, are the biggest emitters within the commercial property sector, but domestic buildings and transportation are by far the largest sources of CO2 emissions in the UK.
million tonnes co2 emissions by building type/ end use 2013
Retail, office, warehousing and other commercial buildings (excluding industry)Other non-domestic buildingsIndustrial buildings (excluding industrial processes)Industry - industrial processes, etc.Domestic buildingsTransportation
133
17
13
52
109
131
Residential and, to a lesser extent, commercial and public sector buildings represent one of the most important untapped potential sources of energy savings and reduced greenhouse gas emissions. However, the underlying trend since 2009 shows little change in the level of emissions from buildings, once the effect of variations in winter temperatures are taken into account.
17 Energy consumption 18 CO2 emissions
Property Data Report 2014 19Property Data Report 201418

Commercial property is primarily made up of the core sectors of retail, office and industrial (warehousing and factories) that dominate investors’ portfolios. Cinemas and leisure parks, hotels, pubs and restaurants, and garages and petrol stations are also defined as commercial property. Commercial property activity covers those whose main business is the construction, development, design and care and management of buildings, the fund, investment and asset management of investment property and transacting (e.g. investment and letting agency). The contributions made to commercial property by the legal and property banking sectors are also included. All forms of residential property and activity are excluded throughout from the measures of commercial property.
1 The estimate of commercial property value is from the Investment Property Forum’s (IPF) The Size and Structure of the UK Property Market: End-2013 Update (2014), undertaken as part of the IPF Research Programme 2011-2015. The estimate is made by updating the latest April 2008 rateable values to end-2013 market values using Investment Property Databank’s (IPD) rental growth and capitalising these by IPD yields adjusted to reflect the more secondary nature of average property (full details are available in the IPF report); note that the estimates for 2012 in last year’s report have been re-stated in light of the new IPF research.
Plant and machinery from the Office for National Statistics (ONS) Blue Book 2013, 2013 figure unavailable at time of preparation so updated to 2013 by Paul Mitchell Real Estate Consultancy Ltd (PMRECON), government bonds from the Debt Management Office, and equities from the London Stock Exchange.
2 Commercial property, residential property, and private rented residential sector from the IPF’s The Size and Structure of the UK Property Market: End-2013 Update (2014); the estimates for 2012 in last year’s report have been re-stated in light of the new IPF research.
In making these estimates, total residential is based on the 2012 figure in the ONS Blue Book 2013 updated to 2013 by PMRECON. The private rented residential sector is calculated from the product of the number of private rented residential dwellings (from the Department of Communities and Local Government [DCLG]) and the average value of a private rented dwelling (full details are available in the IPF report).
Other non-domestic property is a PMRECON estimate made by updating the latest April 2008 rateable values to end-2013 market values and capitalising these by yields, which are assumed to be 200 basis points below those of average commercial property.
3 All estimates from the IPF’s The Size and Structure of the UK Property Market: End-2013 Update (2014) (see 1 and 2 above for further details).
4 Commercial property 2003-2013 from the IPF’s The Size and Structure of the UK Property Market: End-2013 Update (2014), 2000-2002 are PMRECON estimates using the same methodology as the IPF report.
Residential property is from The Size and Structure of the UK Property Market: End-2013 Update (2014)/the ONS Blue Book 2013 as described in 1 above.
Other non-domestic property are PMRECON estimates made by updating the April 1998, 2003 and 2008 based rateable values to the relevant year’s market values and capitalising these by yields, assumed in 2013 to be 200 basis points below those of average commercial property and, in previous years, are assumed to be 75% of the average commercial property yield. Inflation (RPI) is from the ONS.
Definitions Sources and methodologies
Property Data Report 2014 21Property Data Report 201420

5 Commercial property is based on the IPF’s The Size and Structure of the UK Property Market: End-2013 Update (2014) with the commercial owner-occupied stock estimated as the residual of the total stock and the investment stock; note that previous estimates have been restated in light of the new IPF report. Housing is from the DCLG’s Table 101 Dwelling Stock by Tenure, other than 2013, which is a PMRECON estimated update to end-2013 using the latest available DCLG figures for April 2012.
6 British Property Federation: IPD Annual Lease Reviews and IPD Lease Events Report 2013.
7 Rental payments based on the rental value estimates in the IPF’s The Size and Structure of the UK Property Market: End-2013 Update (2014) (note that retail is adjusted to exclude pubs and restaurants). Business rates are based on the total receipts presented in the Office for Budget Responsibility’s March 2014 Economic and Fiscal Outlook (and estimated to be £26.5 billion for calendar 2013), pro-rated according to retail and offices’ shares of total rateable value (estimated at 28% and 23% respectively – note that it is assumed that any reliefs are distributed proportionately across sectors). Employment costs derived from the ONS (retail relates to SIC(2007) 47 less non-store trade, offices to SIC(2003)s J and K).
8 Rental growth from IPD Ltd © 2014. Business rates are derived on the basis described in 7 above. For 2003, total business rate receipts of £18.4 billion are pro-rated according to retail and office rateable value shares (estimated at 26% and 23% respectively). To control for the effect of floorspace growth on business rate receipts, changes in business rates between 2003 and 2013 are calculated on a £ per square foot basis. Earnings are derived from the ONS Monthly Wages and Salaries Survey. RPI from the ONS.
9 Debt secured on commercial property is from De Montfort University’s (DMU) The UK Commercial Property Lending Market 2013 Year End report and has been adjusted by PMRECON to exclude both private residential and social housing and other non-commercial property types; includes the DMU’s estimate of CMBS, pro-rated by PMRECON to exclude private residential and social housing and non-commercial property types.
10 All the estimates are from the IPF’s The Size and Structure of the UK Property Market: End-2013 Update (2014), which in turn drew on data from IPD, ONS, Property Funds Research, and RCA/Property Data, and analysis by PMRECON; further details are available in the IPF report.
11 Insurance company and pension funds’ direct property are as estimated in 10 above; indirect and listed property exposures are PMRECON estimates drawing primarily on the research undertaken for the IPF’s The Size and Structure of the UK Property Market 2013: A Decade of Change (2014). Total insurance company and pension fund assets (long term) are derived from the ONS’s MQ5:
Investment by Insurance Companies, Pension Funds and Trusts latest estimates for 2012, updated and estimated to 2013 by PMRECON.
12 IPD Ltd © 2014, FTSE. Commercial property returns exclude ‘Residential Specialist Funds’.
13 PMRECON estimates mainly based on the ONS’ data on employment and Gross Value Added (GVA) as at 1 August 2014. General approach is to apportion employment and GVA in property as a whole between commercial and non-commercial.
The two main industry sectors are Construction (SIC(2007) Section F) and Real Estate Activities (SIC(2007) Section L, but excluding the imputed rental value of owner-occupied housing) for which GVA is available from ONS’s quarterly national accounts series. For construction, the ONS’s Output in the Construction Industry Tables 4 and 5 indicate that around 25% of construction output is related to commercial property sectors, so this factor is implied to Construction GVA to derive the amount relating to commercial property.
For the Real Estate Activities sector, the indicators used vary according to the specific sector (for example, commercial property’s share of total property transactions is applied to SIC68.31 ‘Real Estate Agencies’); overall, 45% of the Real Estate Activities sector (excluding the imputed rent of owner-occupied housing) is estimated to be commercial real estate. After the analysis for the 2013 PIA Property Data Report was completed in mid-2013, ONS substantially revised its estimates of GVA in Real Estate Activities (SIC(2007) Section L; this has led to a correspondingly significant upgrade in the latest estimate of commercial real estate GVA.
Part of SIC(2007) Section K (Finance and Insurance Activities is incorporated – for commercial property, this covers property banking, fund management, REITs, stock broking, insurance companies and pension funds). For these areas, estimates of employment relating to commercial property are mainly derived from a survey of company accounts and from fund managers’ websites (grossing these up to the industry as a whole through the relationship between employment and funds under management). GVA for REITs, fund managers, etc., is also based on company information relating to employment costs and profits defined to be consistent with the national accounts measures of GVA SIC(2007) Section M (Professional, Scientific and Technical Activities, mainly relating to legal services, architecture, and quantity surveying), and SIC(2007) Section N (Administrative and Support Service Activities, mainly relating to facilities management). In these sectors, commercial property’s share and size tends to be small.
14 As above.15 Draws on the approach outlined in the IPF’s The Role of Commercial
Property in the UK Economy (2013). Based specifically on HM Revenue & Customs (HMRC) Tax Statistics and relating to the
Sources
Property Data Report 2014 23Property Data Report 201422

commercial property industry as defined in section 13. Total taxes derived from July 2014 HMRC receipts. PAYE, NIC and VAT for commercial property estimated from the corresponding HMRC estimates by broad industry, pro–rated according to commercial property’s share of these industries. VAT for commercial property and all-economy relates to ‘Home’ VAT only (i.e. excluding VAT on imports). SDLT estimated by pro-rating HMRC estimates for non-residential according to the PMRECON’s 2013 estimate of commercial property’s share of non-residential property transactions.
16 PMRECON estimates derived from estimates of 10-year average floor space completions generously supplied by Property Market Analysis, and also DCLG data and from 2013 investment values of completed development.
17 PMRECON estimates derived from the Department of Energy and Climate Change’s (DECC) statistics on energy consumption by final user 2013 and earlier data published by Building Research Establishment.
18 PMRECON estimates derived from the DECC’s provisional estimates for 2013 of emissions of carbon dioxide and 2013 end-user estimates presented in the Committee on Climate Change’s Meeting Carbon Budgets – 2014 Progress Report to Parliament. Note that the basis of calculation changed since previous editions of the Property Data Report, reflecting in particular the use of the Committee on Climate Change’s data.
AcknowledgementsData compiled and estimated by PMRECON (www.pmrecon.com). The estimates of the total stock of commercial property and the amount in investment portfolios draws heavily on The Size and Structure of the UK Property Market: End-2013 Update (2014), which was undertaken as part of the IPF’s Research Programme 2011-2015. Supporting property market data generously supplied by IPD, Property Funds Research, Property Market Analysis and Real Capital Analytics/Property Data, none of whom bear any responsibility for the estimates in this document. ONS data is used directly or adopted under the Open Government Licence v.2.0.
Property Data Report 2014Property Data Report 201424 25

Oct
ober
201
4 |
Des
ign
by A
nder
son
Nor
ton
Des
ign
020
7336
699
2