Embed Size (px)
Citation preview

NASA / CR- 1998-208708
Properties of PZT-Based PiezoelectricCeramics Between-150 and 250°C
Matthew W. Hooker
Lockheed Martin Engineering & Sciences Co., Hampton, Virginia
National Aeronautics and
Space Administration
Langley Research Center
Hampton, Virginia 23681-2199Prepared for Langley Research Centerunder Contract NAS1-96014
September 1998
https://ntrs.nasa.gov/search.jsp?R=19980236888 2018-04-29T18:39:24+00:00Z

p_
_, _ i-i_i_,i_ I_i_i¸_ii._il,k_ -I-i i_i_iIi_IL ,_

Abstract
The properties of three PZT-based piezoelectric ceramics and one PLZT electrostrictive ceramic were
measured as a function of temperature. In this work, the dielectric, ferroelectric polarization versus
electric field, and piezoelectric properties of PZT-4, PZT-5A, PZT-5H, and PLZT-9/65/35 were measured
over a temperature range of-150 to 250°C. In addition to these measurements, the relative thermal
expansion of each composition was measured from 25 to 600°C, and the modulus of rupture of eachmaterial was measured at room temperature. This report describes the experimental results and
compares and contrasts the properties of these materials with respect to their applicability to intelligentaerospace systems.
Keywords: piezoelectric, PZT, PLZT, temperature
InWoducfion
The term piezoelectricity refers to the relationship between pressure and electricity that exists within a
unique family of materials. Piezoelectrics are materials that either output a voltage when subjected to amechanical stress or exhibit a dimensional change when an electric field is applied. These two behaviors
are referred to as the direct and indirect modes of operation respectively [1-2]. Both modes of
piezoelectric operation are currently being utilized in modem aerospace systems in such diverseapplications as vibration cancellation and optical positioning [3-5]. Because these materials have the
ability to sense and respond to changes in their environment, they are often referred to as "smart" or"intelligent" materials [6].
The primary applications of piezoelectric technologies in fixed-wing aircraft include the active control
of boundary layers along leading edges [7], the suppression of internal cabin noise [8], and the
elimination of panel flutter [9] and tail buffeting [10]. This technology is also being applied inhelicopters to eliminate the vibrations present in rotor blades [ 11-13].
In addition to the aeronautical applications of intelligent structures, piezoelectric technologies are alsobeing developed for use in spacecraft systems. In recent years, satellite systems have become smaller and
lighter to reduce the cost of launching the payloads into orbit. As spacecraft masses have been reduced,
however, the elimination of vibrational disturbances has become a critical design issue. Since many ofthe scientific instruments aboard these spacecraft require precision pointing to perform their intended
functions, the spacecraft must be mechanically stable for the payloads to function as designed. As such,
methods of incorporating intelligent structures to minimize jitter in spacecraft structures has become a
critical area of research and development in the aerospace community [14-15].
Piezoelectric materials are typically incorporated into aerospace structures by either applying a patch-
style device to the surface of the structure [16-17] or by embedding the device into a graphite-epoxycomposite structure [18-20]. In each instance, distributed networks of sensors and actuators are used to
sense and nullify vibrational disturbances. Similarly-controlled systems are also being developed for use
in space-based instruments to actively position optical components [21]. These control systems typicallyinclude a position sensor that locates the optical component and a piezoelectric drive mechanism which
positions the optic based on real-time feedback from the position sensor.
Because of the wide range of operating conditions for the systems under development, careful
consideration must be given to the selection of piezoelectric materials. This is particularly important

when selectingmaterialsfor use in systemsthat will be exposedto a wide rangeof operatingtemperatures.To addresstheseconcerns,thedielectric,ferroelectric,andelectro-mechanicalpropertiesof fourPZT-basedmaterialswereevaluatedoveratemperaturerangeof -150to250°C.Additionally,thethermalexpansionpropertiesweremeasuredfrom25 to 600°C,andthemoduliof ruptureweremeasuredat roomtemperature.Thisreportdescribesthe experimentalresultsandcomparesandcontraststhepropertiesof thematerialsevaluatedwithrespecttotheirapplicabilitytointelligentaerospacesystems.
Experimental Procedure
Materials Evaluated
The properties of three piezoelectric materials and one electrostrictive composition were measured
between -150 and 250°C. The piezoelectric materials evaluated in this work were commercially-
produced PZT-4, PZT-5A, and PZT-5H ceramics. The electrostrictive materials, PLZT-9/65/35, were
produced by tape casting powders synthesized by the solid state reaction of PbO, La203, ZrO2, and TiO 2.All of the ceramics used in this study were obtained in an unelectroded and unpoled condition and
possessed density values that were at least 95% of theoretical density. Prior to testing, gold electrodeswere sputtered onto the major surfaces of each specimen.
Initially, the room temperature (25°C) dielectric, ferroelectric, and piezoelectric properties of each
composition were determined. Once the initial room temperature evaluations were complete, the
properties of each composition were then measured between -150 and 250°C. The specific details of eachmeasurement are described below.
During the thermal tests, each specimen was placed in an environmental chamber with a temperature
sensor located in close proximity to the test article. Throughout this investigation, multiple specimens of
each composition were tested at each condition, and the average value of each property was determined.
Dielectric and Ferroelectric Measurements
The dielectric constant (K), dissipation factor (tan 8), and electrical resistivity of each compositionwere measured at frequencies of 100 Hz, 1 kHz, 10 kHz, and 100 kHz using an HP 4284A LCR meter.
From this data, the Curie point (To) of each specimen exhibiting a maximum dielectric constant between -150 and 250°C was determined.
Next, the ferroelectric polarization versus electric field (P-E) properties of each composition were
measured at 1 Hz using a Sawyer-Tower circuit. The P-E properties of the soft piezoelectric materials
(i.e., PZT-5A and PZT-5H), as well as the electrostrictive specimens, were measured in an unpoled
condition. However, because the hard piezoelectric ceramics (i.e., PZT-4) are not initially polarizable at
room temperature, these specimens were poled at 100°C prior to testing. The properties of thesematerials were tested in the polarized state in order to accurately simulate the polarization state of thematerials as they would be used in practice.

i"¸ ,
Piezoelectric Measurements
The piezoelectric coefficients of each composition were measured in accordance with published
standards [22-23]. The various specimen geometries and electrode patterns necessary for determining the
piezoelectric coefficients for radial, transverse, and longitudinal modes of operation are shown in Figure1. The circular ceramics used in this work were 25.4 mm in diameter and 250 to 380 gm thick. Therectangular specimens had dimensions 2 mm x 2 mm x 7.5 mm.
(c)
t
Dimensional / l > 2.5 w, t l > 3.5 w, t d > 10requirements [ - - -
t
1c33,K_, D ks1, K_T D kp, KT, DUsed for / Ddetermination of I. $33' SE SI_' S_1 Qm
d33, g33 d31, g31
Figure 1. Specimen geometries and polarization directions associated with the measurement of radial, transverse,and longitudinal piezoelectric properties.
The resonance properties of the poled piezoelectric specimens were measured using an HP 4194A
Impedance Analyzer. The effective electromechanical coupling coefficient, k_, of the radial test
specimens was then calculated using the resonance/antiresonance method described by the relation [23]:
(1)
where fro andf_ refer to the frequencies of minimum and maximum impedance, respectively. In addition to
the kaf values, the planar coupling coefficient, k, for each composition was determined using theprocedures described in references 22 and 23.
The piezoelectric coefficients for the transverse (k31, dsl , and g3_) and longitudinal (k3s, dss, and g33)
modes of operation were determined by measuring the resonance properties of the thickness-poled andlength-poled ceramics, respectively. The coefficients describing the transverse mode of operation werecalculated using the following relations:
3
....... _ . vV.?S-- _
Ak3_ = I+A
rcf_where A -- ---- tan
2f. 2 fm
d31 m k314_OK3S1E1
d31
g31 -EoK 3
(2)
(3)
(4)
(5)
(6)
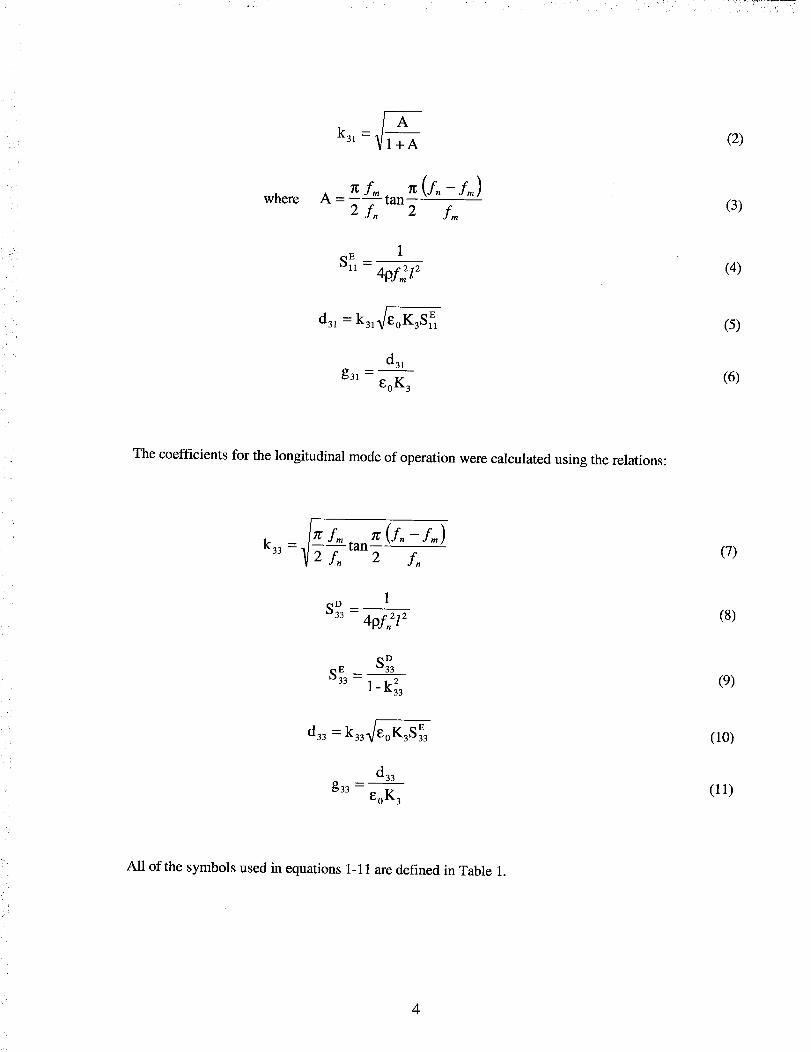
The coefficients for the longitudinal mode of operation were calculated using the relations:
k33 =J_fmtan Jr(f"-f")
V2f. 2 f.(7)
1$3_ =
4pf _l 2 (8)
s35-l - k_3
d33 = k334EoK3S3E3
d33g33 --
EoK 3
(9)
(10)
(11)
All of the symbols used in equations 1-11 are defined in Table 1.
4

Table1.Definitionofsymbolsusedinthedeterminationofpiezoelectriccoefficients.
Symbol Definition Units
d31
d33
D (superscript)
E (superscript)
f.
g31
g33
1%
k ff
kP
1
Sll, $33
E0
P
Transverse strain constant
Extensional strain constant
At constant electric displacement
At constant electric field
Frequency of minimum impedance
Frequency of maximum impedance
Transverse voltage constant
Extensional voltage constant
Transverse coupling coefficient
Extensional coupling coefficient
Effective electro-mechanical coupling coefficient
Planar coupling coefficient
Dielectric constant
Specimen length
Elastic compliance constants
Permittivity of free space, 8.85 x 10⁻¹²
Density
m/V
m/V
nz
Hz
Vm/N
Vm/N
m
m2/N
F/m
kg/m 3

Thermal Expansion Measurements
The thermal expansion properties of unelectroded, unpoled specimens with dimensions 25 mm x 4
mm x 3 mm were measured from 25 to 600°C using a Linseis model L75 dilatometer. All of these tests
were performed in an argon atmosphere using a heating rate of 2°C/min. Once the measurements were
complete, the relative change in length, A1/10,for each material was calculated.
Mechanical Testing
The flexural strength of each composition was measured at room temperature using a four-point bendtest. In this work, unelectroded and unpoled ceramics with dimensions of 38 mm x 6 mm x 4 mm were
tested to failure. All of the mechanical testing was performed using a load rate of 0.25 mm/min and inner
and outer span lengths of 17 and 34 ram, respectively. Once all of the tests were complete, the Modulusof Rupture (MOR) of each specimen was calculated using the relation [24]:
MOR = 3P(L - a)2bd 2 (12)
where P is the mechanical load required to break the specimen, L is the outer span distance, a is the inner
span distance, b is the width of the bar, and d is the depth of the bar. Between five and ten specimens ofeach composition were tested, and an average MOR value was calculated for each composition.
Experimental Results
Room Temperature Properties
As shown in Table 2, all of the materials evaluated in this work possessed room-temperature dielectric
constants ranging from 1100 to 5000. Additionally, each of the piezoelectric compositions exhibited E c
and PR values in excess of 5.5 kV/cm and 12.9/.tC/cm 2, whereas the electrostrictive possessed E c and PRvalues of 2.5 kV/cm and 1.1 pC/cm 2, respectively.
After the initial dielectric and ferroelectric measurements were performed, additional materials of each
composition were poled and tested. The piezoelectric specimens exhibited k ffvalues ranging from 0.49to 0.53, with the highest values exhibited by the PZT-5H ceramics. The PZT-5H ceramics also exhibited
the highest d31and d33 values followed by the PZT-5A and PZT-4 compositions, respectively. Because of
the cubic nature of the PLZT-9/65/35 crystal structure, these materials do not exhibit strong resonance
properties, and therefore, the calculation of piezoelectric coefficients for these materials yields negligiblevalues.
6

L5 ¸
Table 2. Room temperature (25°C) dielectric, ferroelectric, and piezoelectric properties of PZT-based ceramics.
Property Units PZT-4 PZT-5A PZT-5H PLZT-9/65/35
K (1 kHz) --- 1400 1600 3400 5000tan 8 (lkHz) --- 0.05 0.02 0.02 0.06
Ec kV/cm 14.4 11.8 5.5 2.5PR gC/cm 2 31.0 23.0 12.9 1.1PSA_ [xC/cm2 40.1 27.7 19.5 20.8
ko_f --- 0.49 0.50 0.53 ---1% --- 0.54 0.56 0.59 ---
d33(xl0-12) m/V 225 350 585 ---g33(x10-3) Vm/N 8.5 16.6 12.5 ---
lq3 --- 0.35 0.53 0.59 ---
d31(xl0 -12) m/V -85 -190 -265 ---g3_(xl 0-_) Vm/N -7.5 -13.7 -8.5 ---
1%1 --- 0.22 0.40 0.36 ---
Density g/cm _ 7.6 7.7 7.4 7.3
Dielectric and Resistive Properties
As shown in Figure 2, all of the materials evaluated in this work exhibited their lowest dielectric
constant values at -150°C, and as the temperature was increased the dielectric constant of eachcomposition also increased. The dielectric constants of the PZT-4 and PZT-5A ceramics increased
steadily as a function of temperature with neither possessing a Curie point in the temperature rangeevaluated in this study. The other two materials evaluated, PZT-5H and PLZT-9/65/35, exhibited Curiepoints within the -150 to 250°C range. The PZT-5H ceramics possessed a T value of 180°C at each
e
frequency, whereas the PLZT-9/65/35 materials exhibited To properties typical of a relaxor ferroelectric(i.e., varying with frequency). In this instance, the temperature at which the maximum dielectric constant
was observed increased from 72 to 91°C as the measurement frequency increased from 100 Hz to 100kHz.
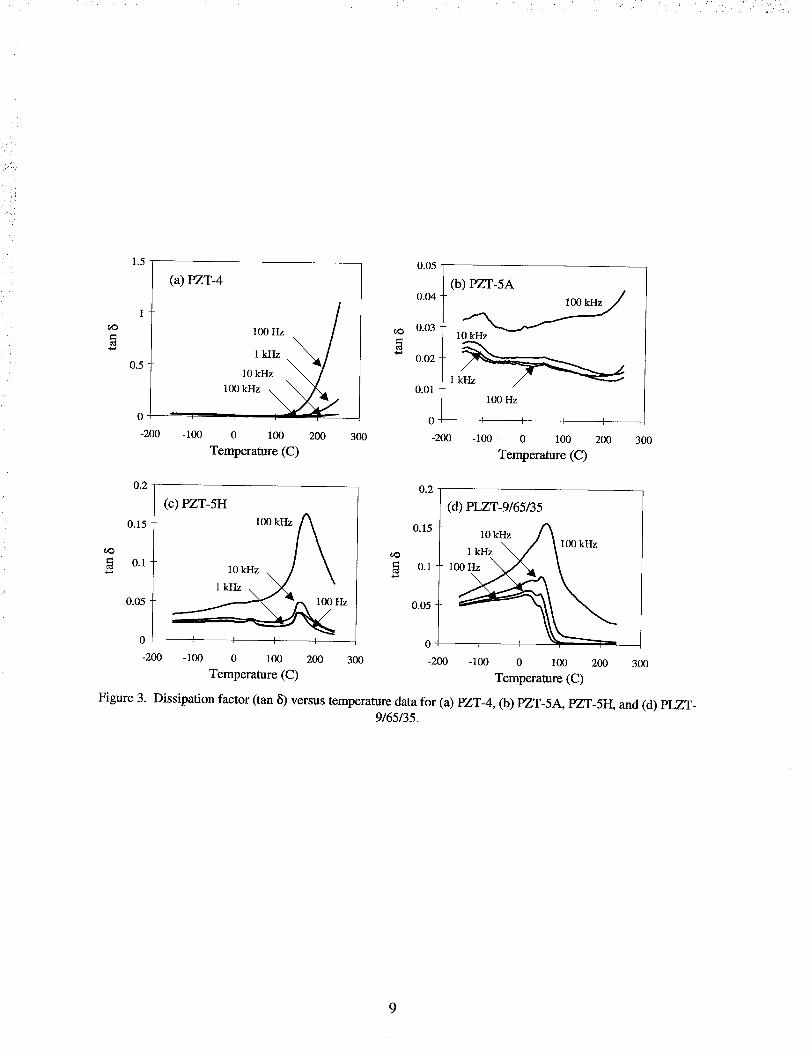
The dissipation factors for each material were also found to be dependent upon both the temperature
and measurement frequency. As shown in Figure 3, the tan _ values for PZT-4 were approximately 0.05over the entire temperature range when measured at 10 and 100 kHz. At 100 Hz and 1 kHz, however, thedissipation factor began to increase at 125 and 150°C, respectively. The tan 6 values for PZT-5A were
also found to be relatively constant when measured at frequencies of 100 Hz, 1 kHz, and 10 kHz.
However, at 100 kHz the dielectric loss was significantly higher over the entire temperature range.
Unlike the previous two materials discussed, the PZT-5H and PLZT-9/65/35 ceramics exhibited
maximum tan _ values at each measurement frequency which correspond to their respective Curie points.
In both instances, the dissipation factors were found to increase with increasing measurement frequencyas seen in Figures 3 (c) and 3 (d).
7

@
C.)
o1,,_
4000
3000
2000
1000
0
-200
(a) PZT-4 lOOHz \ /jlkHz
10kHz
100 kHz
J I J I
-100 0 100 200
Temperature (C)
300
4000
(b) PZT-5A
!'°• 2000 10 kHz
0 I r I I
-200 -100 0 100 200 300
Temperature (C)
o
112
-g
16000
14000
12000
10000
8000
2o0o10/
-200
(c) PZT-5H100Hz
lkHz
10kHz
100 kHz
I I I I
-100 0 100 200
Temperature (C)
12000 _ 100 Hz \
8000 10 kHz \
100 kHz .
• 6000
]::tJ0-1
300 -200 -100 0
5/35
f I [
100 200 300
Temperature (C)
Figure 2. Dielectric constant versus temperature data for (a) PZT-4, (b) PZT-5A, PZT-5H, and (d) PLZT-9/65/35.
8
1.5
0.5
0
-200
(a) PZT-4
100Hz /
\7
, 1 100 kI-Iz _
-100 0 100 200
Temperature (C)
300
0.05
t_
0.04
0.03
0.02
0.01
-200
(b) PZT-5A
10 kHz
kHz
100Hz
I I I I
-100 0 100 200
Temperature (C)
300
0.2
0.15
0.1
0.05
0
-200
(c) PZT-5H
lO_\ / \1 kI-Iz \ ._._ "
I f I ]
-100 0 100 200 300
Temperature (C)
0.2
0.15
°_ 0.1
0.05
0
-200
(d) PLZT-9/65/35
10kHz A
_ \/ \_00_
-100 0 100 200 300
Temperature (C)
Figure 3. Dissipation factor (tan 6) versus temperature data for (a) PZT-4, (b) PZT-5A, PZT-5H, and (d) PLZT-9/65/35.
9

As shown in Figure 4, the resistivity of the PZT-4 ceramics remained relatively constant between -150and 50°C. However, as the temperature was further increased the resistivity was found to decrease
significantly. For example, the resistivity measured at 100 Hz decreased from 10 9 _-_-cm at 50°C to less
than 107 _"_-cm at 250°C. The PZT-5A ceramics were also found to possess a resistivity on the order of
10 9 _'_-cm at -150°C when measured at 100 Hz. Although the resistivity of the PZT-5A specimens was
found to decrease with increasing temperature, these materials did not exhibit the sharp decrease inresistivity exhibited by the PZT-4 ceramics as the measurement temperature exceeded 50°C.
The resistivity of the PZT-5H materials was also found to decrease with increasing temperature. In
this instance, however, the resistance reached a minimum value at the Curie point and increased as the
test specimen was heated to 250°C. A resistance minimum corresponding to the Curie temperature wasalso observed for the PLZT-9/65/35 ceramics. As previously noted, this material is a relaxor ferroelectric
and therefore the temperature of minimum resistance was found to increase from 72 to 91°C as themeasurement frequency increased from 100 Hz to 100 kHz.
1.E+10
_l.E_8
-_l.E_6
1 .E+04
-200
1_ (a) PZT-4
1.E+10
_1.E_8
°_
-_l.E_6
J I I f 1.E_4
-100 0 100 200 300 -200
Temperature (C)
100 Hz (b) PZT-5A
lkHz
10kHz
100 kHz
I I I I
-100 0 100 200 300
Temperature (C)
1.E+10
l.E_8
._l.E_6
_ 1.E+04
(c) PZT-5H
1 kHz
1.E+10
_1.E_8
_I.E_6
1.E_4
1.E+02 I I I I 1.E_2
-200 -100 0 100 200 300 -200
Temperature (C)
100Hz
(d) PLZT-9/65/35I I I f
-100 0 100 200 300
Temperature (C)
Figure 4. Resistivity versus temperature data for (a) PZT-4, (b) PZT-5A, (c) PZT-5H, and (d) PLZT-9/65/35.
Ferroelectric Polarization versus Electric Field Properties
As shown in Figures 5 (a) to 5 (c), all of the piezoelectric ceramics evaluated in this work possessedmaximum remanent polarization values between 0 and 50°C, indicating that the highest induced
polarization states occur near room temperature. For each composition tested, the PR values were lowest
10

at -150°Candincreaseduntil a maximumvaluewasreached.As thetemperaturewasfurtherincreasedbeyondthetemperatureat whichthemaximumvaluewasobserved,thePRvaluesof eachcompositiondecreasedsteadilyoverthebalanceof thetemperaturerange.
Aspreviouslymentioned,theresistivityof thePZT-4materialsdecreasedasthematerialswereheatedbeyond50°C.Becauseof thisdecreasein resistance,calculationof thePRvaluesat temperaturesabove120°Cindicatesanincreasethatis dueto theconductivenatureof thesematerialsathightemperatures.Theincreasein thePRandPSATvaluesabove120°Cis illustratedin Figure5 (a). As thetemperaturewasfurther increased,the applicationof high electricfields ultimatelyled to the breakdownof thesespecimens.Therefore,P-Edataforthismaterialwasnotcollectedabove160°C.
Unlike thePZT-4specimens,the PZT-5Aceramicswerepolarizableover the entiretemperaturerange.AsshowninFigure5(b),thePRvaluesfor thiscompositionincreasedfrom2gC/cm2at-150°Ctoamaximumvalueof 25gC/cm2at25°C.Asthetemperaturewasfurtherincreasedto 250°C,thePRvaluesdecreasedto 20gC/cm2.
As shownin Figures5 (c) and5 (d), thePRvaluesfor bothPZT-5HandPLZT-9/65/35reachedmaximumvaluesnear25°Candthendecreasedsteadilywith increasingtemperatureuntil thematerialnolongerexhibitedaferroelectrichysteresis.Eachof theselattercompositionsexhibitedparaelectricP-EbehaviorsateachmeasurementtemperatureabovetheirrespectiveTcvalues.
Thecoercivefieldvaluesfor eachcompositionwerealsofoundtoexhibitamaximumvalueandthendecreasewith increasingtemperature.As seenin Figures5 (a) to 5 (d),the maximumcoercivefieldvalueswerefoundto occurbetween-100and-50°C.As wasnotedin theP,behaviors,theEc valuesforthePZT-5HandPLZT-9/65/35materialsdecreasedto zeroattheirrespectiveCuriepoints,indicatingthattheferroelectricdomainsarenotspontaneouslyreversibleandthataremanentpolarizationstatecannotbeinducedabovethattemperature.
25 60
(a)PZT-4 : /
20 . Ec r 50
15 40 _o
3010 _
20J / PR and PSAT increases
5 - _ # above 120°C due to 10
decrease in resistivity
0 I I I I I I I I I 0
-200 -150 -100 -50 0 50 100 150 200 250 300o
Temperature (C)
Figure 5. Coercive field (Ec), remanent polarization (PR), and saturation polarization (Ps^T)versus temperatureproperties of (a) PZT-4, (b) PZT-5A, (c) PZT-5H, and (d) PLZT-9/65/35.
11

: • :.L, • :,i• ::i_,:;!:ii•;_:_'?i:!! ¸
r
V
20
15
10
5
PSAT
(b) PZT-5A f_-----I_
I [ P I I I I I [
-200-150-100-50 0 50 100 150 200 250
Temperature (°C)
0
300
35
30
25
20 "_
15
10
20
15
10
25
(c) PZT-5H
-150-100 -50 150 200 250
20
10 _
5
0 0
-200 0 50 100 300
Temperature (°C)
20 25
(d) PLZT-9/65/3515 20
15 -_> 10
50 0
-200-150-100-50 0 50 100 150 200 250 300
Temperature (°C)
Figure 5 (continued). Coercive field (Ec), remanent polarization (PR), and saturation polarization (PsAT)versustemperature properties of (a) PZT-4, (b) PZT-5A, (c) PZT-5H, and (d) PLZT-9/65/35.
12

r
In addition to the graphs summarizing the ferroelectric hysteresis properties of each composition from-150 to 250°C, typical examples of the P-E behaviors of each composition at -150, -75, 0, 25, 100, and
250°C are shown in Figures 6 to 9. As previously discussed, each composition exhibits a very low
polarization of -150°C, and as the temperature increases, the hysteresis loops of the three piezoelectric
compositions exhibit typical square (PZT-4 and PZT-5A) or rounded (PZT-5H) ferroelectric hysteresisbehavior near room temperature.
As shown in Figures 6 (a) and 6 (b), the PZT-4 ceramics exhibited somewhat asymmetric hysteresis
behavior below -50°C. However, all of the P-E loops collected above this temperature were symmetric
about each axis. Symmetric hysteresis loops were obtained at every temperature for the soft piezoelectricceramics evaluated herein.
The PLZT-9/65/35 ceramics also exhibited low polarization properties at -150°C. However, aspreviously observed in Figure 5 (d), the maximum E c and PsAr values for this composition were obtained
near -50°C. At this temperature, these materials exhibit a P-E behavior that is very similar to those of the
piezoelectric ceramics near room temperature. As these specimens were further heated to 25°C, the
remanent polarization and coercive field values decreased significantly, and a slim-loop ferroelectricbehavior was observed at room temperature (see Figure 9 (d)).
13

40
(a) - 150°C30
20
10
E (kV/cm)
-30
-20 -
-30
-40
P (#C/cm 2)
I
10 20 30
o 40 T P (ILtC/cmZ)
(b) -75 C 3o/
• 20 "
-30
-40
I
30
40-
(C) 0°C
20
10
iE (kV/cfm) S
P (ktC/cm 2)
I J I
30
(d) 25°C
'_'_v'_,r_'l , o ,1 , ,
-30 __ 2_40 = 0 30
40
(e) 100°C
F20
IE (kV/cm) i I 0
-30 -20 I10 10
-40
Figure 6. Typical ferroelectfic polarization versus electric field (P-E) properties of PZT-4 ceramics at (a) -150°C,(b) -75°C, (c) 0°C, (d) 25°C, (e) 100°C, and (f) 150°C.
14

35
(a) -150°C25
15
E (kV/cm) 5 "
-20 - 10 -5
-15
-25
-35
P (_C/cm 2)
10 20
35-
(b) -75°C25
15
,E (kWc_
-15
-25
-35
P (_C/cm z)
"__7 I
lO 20
35
(c) 0°c25
iE (kV/cm)i_
-25
-35
P Q.tC/cm 2)
0
jE v/cm /"20__35 _ 20
(e) 100 ° 35 q- P (btC/cm z) 35 P (_C/cm z)
E (kWcm)I I r I I I
o-35 _ -35
Figure 7. Typical ferroelectric polarization versus electric field (P-E) properties of PZT-5A ceramics at (a) -150°C,(b) -75°C, (c) 0°C, (d) 25°C, (e) 100°C, and (f) 250°C.
15

20
(a) - 150°C15
10
5E (kV/cm)
-15 -I0 -5-5
-I0
-15
-20
•P (p.C/cm_
5 10 15
20 V (ktC/cm 2)
(b) -75°C15
lO
E (kV/cm) __
-15 _ -5 _ 5 10 15!
-i0
-15
20
(c)O°C15
E (kWcm)
°-15 - -5 -5
-10 -
-20
I
15
20
(d) 25°C15
E (kV/cm)
I I
/°-15 -10 5 -5
-20
q
15
e lOOOC o25oo 5
jE (kWcrm) l
-15 -_ 5 10 15 -15 H
-10 -
-15
-20 -20
p (_tC/cm 2)
15
Figure 8. Typical ferroelectric polarization versus electric field (P-E) properties of PZT-5H ceramics at (a) -150°C,
(b) -75°C, (c) 0°C, (d) 25°C, (e) 100°C, and (f) 250°C.
16

25-
(a) - 150°C 20-
15
10
E (kV/cm) 5
-15 -10 -5 -5
-10 -
-15 -
-20 -
-25
P (gC/cm 2)
25t(b) -75°C 20
15
10
E (kWcm) __5
'-15 --i0 " -5 -5
-10
-15
-20
-25
P QaC/cm 2)
15
25
(c) 0°c20
15
10
FE (kWcrm) I
-15 -10 /-5
-25 -
P (p.C/em 2)
15
25 T P (/'tC/cm2)
E (kWcm)I I I _ • f I
-10 -J/ 5 10i 15
j /--10
-15J 2!-25
I
15
(e) 100°C
E (kV/cm)I r I
-15-10
-15
-20
-25
25 P (g.C/cm 2)
t15
5
I
5 10 15 -15
(f) 25o°c
E (kWcm)
-10 -5
25
20
15
10
5
-5
-10
-15
-20
-25
P (u.C/cm 2)
5 10 15
Figure 9. Typical ferroelectric polarization versus electric field (P-E) properties of PLZT-9/65/35 ceramics at (a) -150°C, (b) -75°C, (c) 0°C, (d) 25°C, (e) 100°C, and (f) 250°C.
17

Piezoelectric Properties
As previously mentioned, the PZT-5H ceramics exhibited the highest piezoelectric properties (i.e., kff,k, Id311,and d33) at room temperature, followed by the PZT-5A and PZT-4 materials, respectively. When
cooled to -150°C, the k_ and k values of each composition remained relatively constant. The 10311 andd33 values for PZT-4 also remained relatively stable over this temperature range. The d constants for the
PZT-5A and PZT-5H ceramics, however, decreased to approximately 50% of their room temperaturevalues when cooled to -150°C.
When heated to 250°C, the electro-mechanical coupling coefficients of PZT-4 and PZT-5A decreased
from their room temperature values, whereas the d constants for these materials increased over this
temperature interval. The properties of the PZT-5H specimens exhibited similar trends when heated
above room temperature. However, in this instance the specimens no longer exhibited measurable
resonances above 170°C, thereby indicating that the specimens had been thermally de-poled.
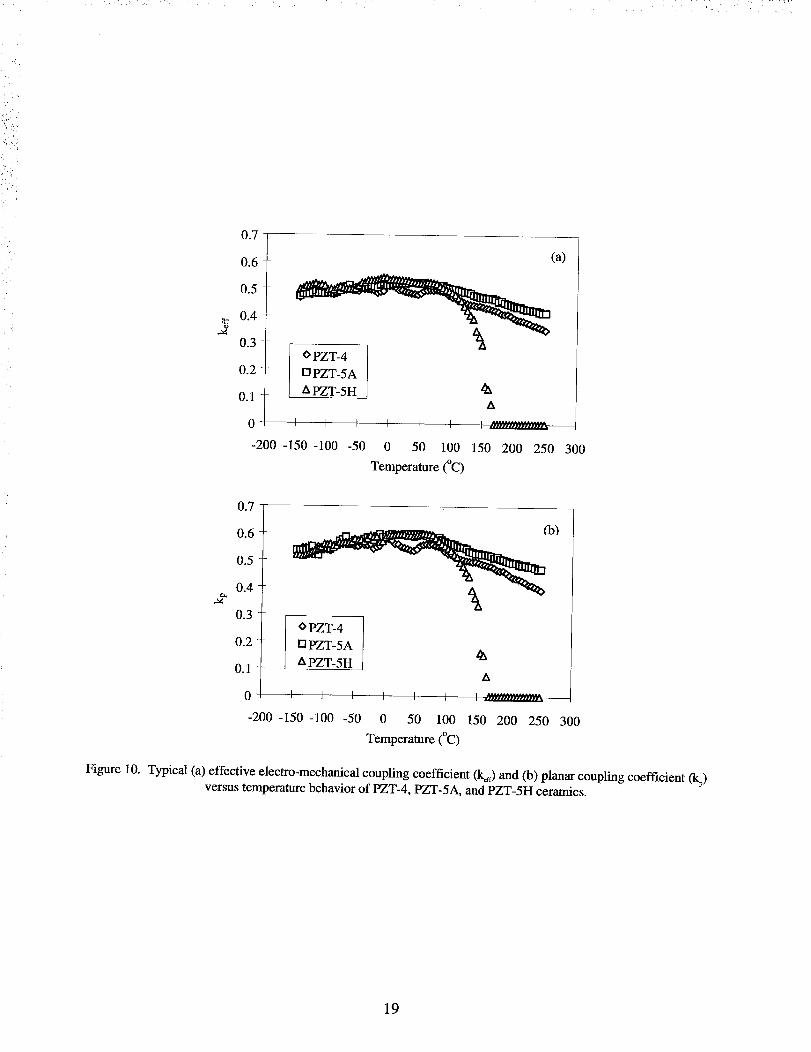
As shown in Figure 10 (a), each of the piezoelectric compositions possessed a k ffvalue ranging from
0.45 and 0.55 between -150 and 150°C. Above 150°C, the k_ value of each composition began todecrease, with the PZT-5H ceramics becoming completely de-poled at 170°C. The PZT-4 and PZT-5A
specimens both exhibited minimum ko_ values at 250°C. In this work, minimum ko_ values of 0.38 and
0.44 were obtained at 250°C for the PZT-4 and PZT-5A ceramics, respectively.
Similar trends were also observed in the measured k values. As seen in Figure 10 (b), the kp values ofeach composition were between 0.5 and 0.6 over the -150 to 150°C temperature interval. Furthermore,the k values of the PZT-4 and PZT-5A ceramics decreased to minimum values of 0.40 and 0.48 at 250°C.
Likewise, above 150°C, the kp values for the PZT-5H ceramics decreased sharply to zero near 170°C.
As shown in Figures 11 (a) and (b), each composition exhibited its minimum Ic1311and d33 values at -150°C. At -150°C, the d constants of the PZT-4 ceramics decreased less than 10% from their room
temperature values whereas the properties of the PZT-5A and PZT-5H compositions declined byapproximately 50% over the same temperature interval. Although PZT-4 ceramics exhibited the most
stable performance between -150 to 25°C, the d33values for this composition are significantly lower than
those of the other two piezoelectric materials near room temperature.
When the materials were heated from 25 to 250°C, the d3_ values of the PZT-4 and PZT-5A ceramics
increased continuously to their maximum values whereas the properties of the PZT-5H ceramics were
more strongly dependent upon the measurement temperature. Specifically, the PZT-4 and PZT-5Aceramics exhibited maximum d33 values of 360 x 10 _2and 440 x 10-_2m/V at 250°C whereas the PZT-5H
specimens possessed d33 values on the order of 900 x 10-12m/V before being thermally de-poled atapproximately 170°C.
18
0.7
0.6
0.5
0.4
0.3o PZT-4
0.2 [] PZT-5A
0.1 A PZT-5H
0 I I r
-200 -150 -100 -50
(a)
I I I
0 50 100O
Temperature (C)
_xA
150 200 250 300
_¢
0.7
0.6
0.5
0.4
0.3o PZT-4
0.2 [] PZT-5A
0.1 A PZT-5H
0 I I I
-200 -150 -100 -50
(b)
I I I
0 50 100O
Temperature (C)
_x
A
150 200 250 300
Figure 10. Typical (a) effective electro-mechanical coupling coefficient (k_) and (b) planar coupling coefficient (1%)versus temperature behavior of PZT-4, PZT-5A, and PZT-5H ceramics.
19

6OO
500
400t'-I
300
200
100
0 PZT-4 (a)
[] PZT-5A _A PZT-5H A Az_
0
-200 -150 -100 -50
A
0 50 100 150 200 250 300
Temperature (°C)
1°°°t o zT_4800 [] PZT-5A A A
_, 600
400
200
0/ [ I I I I [
(b)
"lJllllllcIIIIIIIl_f
-200-150-100 -50 0 50 100 150 200 250 300
Temperature (°C)
Figure 11. Typical (a) d31and (b) d33versus temperature behavior of PZT-4, PZT-5A, and PZT-5H ceramics.
20

Thermal Expansion
As shown in Figure 12, all of the piezoelectric specimens evaluated in this study showed some
evidence of a phase transformation between 25 and 600°C. The PZT-4 specimen exhibited a change inthe rate of expansion at approximately 310°C, whereas the PZT-5A and PZT-5H ceramics exhibitedsimilar changes at 350 and 170°C respectively.
For the PZT-5H material, the temperature at which the rate of expansion changes correlates strongly
with the To value of this composition. Although dielectric constant data was not obtained at temperatures
greater than 250°C for the PZT-4 and PZT-5A ceramics, the thermal expansion data shown in Figure 12provides a strong indication of the Curie points of these materials.
The PLZT-9/65/35 ceramics exhibited the largest thermal expansion of the materials tested. In this
case, a change in the rate of thermal expansion was observed at approximately 275°C. This result
suggests that a phase transformation other than the one indicated by the dielectric constant measurementstakes place at this temperature.
0.5
0.4"
,-, 0.3
0.2
0.!
0
0
PZT-4
...... -sA / .l
.... Pzr-sH 7 /" I
"_'PLZT-9/65/35 / tl "I
lO0 200 300 400
Temperature (°C)
500 600
Figure 12. Relative change in length (A1Bo)versus temperature behavior of PZT-4, PZT-5A, PZT-5H, and PLZT-9/65/35 ceramics.
Mechanical Testing
Each test specimen fractured at a point between the inner two positions through which the mechanical
load was applied. As shown in Table 3, the PZT-4 ceramics possessed the highest average MOR value,
followed by the PZT-5A, PLZT-9/65/35, and PZT-5H compositions, respectively. All of the specimens
tested in this work exhibited a MOR value that was within 10% of the average value for that composition.
21

_ : i_ _;:_: / i¸¸ : _(i
Table 3. Modulus of Rupture (MOR) data for PZT-based ceramics.
Composition Average MOR (MPa)PZT-4 95.2
PZT-5A 81.8PZT-5H 61.5
PLZT-9/65/35 69.3
Discussion
All of the materials evaluated in this investigation were found to possess properties that are suitable
for use in aircraft and spacecraft systems. The selection of candidate materials for use in these systems is,
however, strongly dependent upon the operational conditions under which the device will be employed.
This is particularly important when selecting materials for low temperature (i.e., < -50°C) or high ....temperature (i.e., >150°C) applications.
Of the materials evaluated in this work, the PZT-5H ceramics were found to possess the highest 10311
and d33coefficients at 25°C, followed by the PZT-5A and PZT-4 compositions, respectively. Althoughthe PZT-5H ceramics exhibit the highest room temperature piezoelectric properties, this composition has
a T c value of 170°C which can be a limiting factor in applying this material in systems such as jet enginesthat could expose the actuator to temperatures above its Curie point.
Alternatively, both the PZT-4 and PZT-5A ceramics possess To values in excess of 300°C. The higher
Curie temperatures of these materials make them more appropriate selections for higher-temperature
applications. Although both of these compositions possess relatively high T c values, the resistivity ofPZT-4 decreases significantly above 120°C and it may, therefore, not be an attractive alternative for use
above 100°C under high electric-field conditions. Near room temperature, however, PZT-4 has manyuseful characteristics, the most important of which is the retention of its polarization state over time whenactivated continuously using a large electric field [1].
The selection of actuator materials for low-temperature applications also requires carefulconsideration. In this work, the [c1311and d33values of PZT-4 decreased less than 10% when cooled from
room temperature to -150°C. Conversely, the d constants of both PZT-5A and PZT-5H decreased byapproximately 50% when cooled over the same temperature interval. The relative stability of the
properties of the PZT-4 ceramics between -150 and 25°C suggests that this material is a good candidatefor some cryogenic applications. However, additional testing should be performed before this material isselected for use at temperatures below -150°C.
In addition to the temperature dependency of the piezoelectric properties, the dielectric constants of
these materials must also be considered when evaluating candidate materials. In many aerospace
systems, the power required to operate a device is a critical design issue. As shown below, the power
consumed during the sinusoidal operation of a piezoelectric actuator is directly proportional to thecapacitance of the device by the relation [25]:
P=_.C.f.U 2 (13)
where P is the power consumed (Watts), C is the capacitance of the actuator (Farads), f is the operational
frequency (Hertz), and U is the peak-to-peak operational voltage (V._p). Thus, the selection of a material
22

withgoodpiezoelectricpropertiesmustbeweighedagainstthepowerconsumedbythedeviceto ensurethatthepowerbudgetfor thecompletesystemismaintained.
Thedesignofanopticalpositioningdevicefor aspace-basedspectrometersystemis atypicalexampleof suchadesigntrade-off.In areportbyWiseet al. [26],thepowerconsumedby similarly-sizedPZT-5A andPZT-5Hhigh-displacementRAINBOWactuatorstackswascompared.In thatstudy,PZT-5Astackswerefoundto meetthesystem'sperformancespecificationswhileconsuming0.7Wattsof powerwhereasthePZT-5Hstacksrequired1.8Wattsof continuouspowerwhenoperatedat 1Hz. As showninEquation13,theinfluenceof thepiezoelectriccompositionselectedwouldbecomemorepronouncediftheactuatorwererequiredto operateathigherfrequenciesthanthoseusedin thesystemdescribedin thatstudy.
Overthe courseof this investigation,the propertiesof four PZT-basedceramicswereevaluatedbetween-150to 250°C,andthetemperature-dependentpropertiesof thesematerialswererelatedtoexistingaerospaceapplicationsof thesematerials.In additionto thefourcompositionsevaluatedherein,severalotherpiezoelectricandelectrostrictivecompositionsalsoexistwhichmaypossesspropertiesthataremoreappropriatefor a givensetof designparameters.As such,the initial selectionof candidatematerialsshouldnotbelimitedonlyto thoseevaluatedherein.
Conclusions
The dielectric, ferroelectric, and piezoelectric properties of three piezoelectric ceramics (PZT-4, PZT-
5A, and PZT-5H) and one electrostrictive ceramic (PLZT-9/65/35) were measured over a temperaturerange of-150 to 250°C. Additionally, the thermal expansion characteristics of each composition weremeasured from 25 to 600°C, and the moduli of rupture were measured at 25°C. As the materials were
heated above room temperature, PLZT-9/65/35 and PZT-5H were found to possess T c values of 71 and170°C, respectively. Neither the PZT-4 nor the PZT-5A ceramics exhibited a dielectric constant maxima
below 250°C. Thermal expansion data indicate that these materials undergo phase transformations at 310and 350°C, respectively.
All of the ceramic materials evaluated exhibited their maximum PR values between 0 and 50°C. When
cooled to -150°C, however, the polarization properties decreased to approximately 10% of the room
temperature value for each composition. When heated above room temperature, the PLZT-9/65/35 and
PZT-5H ceramics exhibited paraelectric P-E behaviors above their respective Curie points. The P-E
behavior of the PZT-4 ceramics was influenced by the conductive nature of this composition above
120°C, whereas the PZT-5A ceramics exhibited square ferroelectric hysteresis loops, albeit withdecreased Ec values, up to 250°C.
The PZT-5H ceramics exhibited the largest piezoelectric coefficients at room temperature, followed
by the PZT-5A and PZT-4 compositions, respectively. When cooled to -150°C, the piezoelectric
properties of the PZT-4 ceramics were found to remain relatively stable whereas the performance of the
PZT-5A and PZT-5H materials decreased by approximately 50%. Conversely, when heated to 250°C, thePZT-5A ceramics possessed the largest piezoelectric properties. The PZT-4 specimens also exhibited
strong piezoelectric resonances above room temperature. PZT-5H exhibited the largest piezoelectric
properties up to its Curie point (170°C). Above this temperature, however, no resonances were observed,thus indicating that the specimens had been thermally de-poled.
All four of the materials evaluated in this study possess properties that are suitable for use in some
23

aerospace applications. These findings indicate, however, that careful consideration must be made in
order to select optimum materials for a given set of operational conditions. This is particularly evident
when choosing materials for either low-temperature (i.e., < -50°C) or high-temperature (i.e., >150°C)
applications where the properties of the various materials deviate significantly from their roomtemperature behaviors.
References
1. B. Jaffe, W.R. Cook, and H. Jaffe, Piezoelectric Ceramics, New York: Academic Press, Inc., 1971.
2. G.H. Haertling, "Piezoelectric and Electrooptic Ceramics," pp. 139-225 in Ceramic Materials for Electronics,edited by R.C. Buchanan, New York: Marcel Dekker, Inc., 1986.
3. E.F. Crawley, "Intelligent Structures for Aerospace: A Technology Overview and A "ssessment, AIAA Journal,32 [8] 1689-99, 1994.
4. S.S. Rao and M. Sunar, "Piezoelectricity and Its Use in Disturbance Sensing and Control of Flexible Structures:A Survey," Applied Mechanics Reviews, 47 [4] 113-123, 1994.
5. R.G. Loewy, "Recent Developments in Smart Structures with Aeronautical Applications," Smart Materials andStructures, 6 R11-R42, 1997.
6. R.E. Newnham and G.R. Ruschau," " "Smart Electroceranucs, Journal of the American Ceramic Society, 74 [3]463-80, 1991.
7. K.B. Lazarus, E.F. Crawley, and J.D. Bohlmann, "Static Aeroelastic Control Using Strain Actuated AdaptiveS ,, . .
tructures, Journal of lntelhgent Matertal Systems and Structures, 2 [3] 386-410, 1991.
8. D.L. Palumbo, S.L. Padula, K.H. Lyle, J.H. Cline and R.H. Cabell, "Performance of Optimized Actuator andSensor Arrays in an Active Noise Control System," NASA TM 110281, 1996.
9. J. Heeg, "Analytical and Experimental Investigation of Flutter Suppression by Piezoelectric Actuation", NASATP 3241, 1993.
10. R.W. Moses, "Vertical Tail Buffeting Alleviation Using Piezoelectric Actuators - Some Results of the ActivelyControlled Response of Buffet-Affected Tails (ACROBAT) Program," NASA TM 110336, 1997.
11. P.P Friedman and T.A. Millott, "Vibration Reduction in Rotorcraft Using Active Control: A Comparison ofVarious Approaches," Journal of Guidance, Control, and Dynamics, 18 664-73, 1994.
12. S.R. Hall and E.F. Prechtl, "Development of a Piezoelectric Servoflap for Helicopter Rotor Control," SmartMaterials and Structures, 5 26-34, 1996.
13. J. Shaw and N. Albion, "Active Control of the Helicopter Rotor for Vibration eduction, Journal of theR . ,,
American Helicopter Society, 30 3-20, 1981.
14. A.J. Butterfield and S.E. Woodard, "Measured Spacecraft Instrument and Structural Interactions," Journal ofSpacecraft and Rockets, 33 [4] 556-62, 1996.
24

15. W.L. Grantham, "NASA Future Mission"" Needs and Benefits of Controls-Structures Interaction Technology,"NASA TM 104034, 1991.
16.S. Zhou, C. Liang, and C.A. Rogers, "Dynamic Design and Stress Characteristics of Integrated Piezoelectric
Patch Actuators," pp. 1360-74 in Proceedings of the Second lnternational Conference on Intelligent Materials(ICIM '94), edited by C.A. Rogers and G.G. Wallace, 1994.
17. S. Zhou, C. Liang, and C.A. Rogers, "Integration and Design of Piezoelectric Patch Actuators," Journal ofIntelligent Material Systems and Structures, 6 [1] 125-33, 1995.
18. D. Shalev and J. Aboudi, "Coupled Micro to Macro Analysis of a Composite That Hosts Embedded
Piezoelectric Actuators," Journal oflntelligentMaterial Systems and Structures, 7 [1] 15-25, 1996.
19. D.B. Koconis, L.P. Kollar, and G.S. Springer, "Shape Control of Composite Plates and Shells with Embedded
Actuators, I. Voltages Specified," Journal of Composite Materials, 28 [5] 415-58, 1994.
20. D.B. Koconis, L.P. Kollar, and G.S. Springer, "Shape Control of Composite Plates and Shells with Embedded
Actuators, II. Desired Shape peclfied, Journal of Composite Materials, 28 [3] 262-85, 1994.S . ,,
21. J.L Fanson, E.H. Anderson, and D. Rapp, "Active Structures for Use in Precision Control of Large OpticalSystems," Optical Engineering, 29 [11] 1320-27, 1990.
22. "IRE Standards on Piezoelectric Crystals: Measurements of Piezoelectric Ceramics, 1961," Proceedings of theIRE, 49, 1161-69, 1961.
23. "IEEE Standard on Piezoelectricity," ANSI/IEEE Standard 176-1987, 1987.
24. J.T. Jones and M.F. Berard, Ceramics: Industrial Processing and Testing, Ames, Iowa: Iowa State UniversityPress, 1972.
25. Anon., "Piezo Guide: Piezo Positioning Technology Part 1," Catalogue PZ 36E. Products forMicropositioning, Physik Instrumente Catalogue 108-12/90.14.
26.S.A. Wise, R.C. Hardy, and D.E. Dausch, "Design and Development of an Optical Path Difference Scan
Mechanism for Fourier Transform Spectrometers Using High-Displacement RAINBOW Actuators," in
Industrial and Commercial Applications of Smart Structures Technologies, edited by J.M. Sater, Proceedings ofSPIE, 3044 342-349, 1997.
25

REPORT DOCUMENTATION PAGE I Fo,reApprovedOMB No. 0704-0188
Public repealing burden for this collection of information is estimated to average 1 hour per response, including the time for reviewing instructions, searching existing datasources, gathering and maintaining the data needed, and completing and reviewing the collection of information. Send comments regarding this burden estimate or any otheraspect of th s collestion of information, including suggestions for reducing this burden, to Washington Headquartem Services, Directorate for Information Operations and
Reports, 1215 Jefferson Davis Highway, Suite 1204, Arlington, VA 22202-4302, and to the Office of Management and Budget, Paperwork Reduction Project (0704-0188),Washington, DC 20503.
1.AGENCYUSEONLY(LeavebIank) I 2"REPORTDATEseptember1998 I 3"REPORTTYPEANDDATESCOVEREDCOntractOrReport
4. TITLE AND SUBTITLE 5. FUNDING NUMBERS
Properties of PZT-Based Piezoelectric Ceramics Between -150 and 250C
6. AUTHOR(S)
Matthew W. Hooker
7. PERFORMING ORGANIZATION NAME(S) AND ADDRESS(ES)
Lockheed-Martin Engineering & Sciences Co.Mail Stop 371NASA-Langley Research CenterHampton, VA 23681
9. SPONSORING/MONITORING AGENCY NAME(S) AND ADDRESS(ES)
National Aeronautics and Space AdministrationLangley Research CenterHampton, VA 23681-2199
11. SUPPLEMENTARY NOTES
Langley Technical Monitor: Stephanie A. WiseFinal Report
C NAS1-96014WU 522-32-11-02
8. PERFORMING ORGANIZATION
REPORT NUMBER
10. SPONSORING/MONITORING
AGENCY REPORT NUMBER
NASA/CR- 1998-208708
12a. Dk_¥HiBUTION/AVAILABILITY STATEMENT
Unclassified-Unlimited
Subject Category 76 Distribution: Standard
Availability: NASA CASI (301) 621-0390
13. ABSTRACT (Maximum 200 words)
12b. DISTRIBUTION CODE
The properties of three PZT-based piezoelectric ceramics and one PLZT electrostrictive ceramic were measured
as a function of temperature. In this work, the dielectric, ferroelectric polarization versus electric field, and
piezoelectric properties of PZT-4, PZT-5A, PZT-5H, and PLZT-9/65/35 were measured over a temperaturerange of-150 to 250C. In addition to these measurements, the relative thermal expansion of each composition
was measured from 25 to 600C and the modulus of rupture of each material was measured at room temperature.This report describes the experimental results and compares and contrasts the properties of these materials withrespect to their applicability to intelligent aerospace systems.
14. SUBJECT TERMS
piezoelectric, PZT, PLZT, temperature
17. SECURITY CLASSIFICATION
OF REPORT
Unclassified
18. SECURITY CLASSIFICATION
OF THIS PAGE
Unclassified
19. SECURITY CLASSIFICATION
OF ABSTRACT
Unclassified
15. NUMBER OF PAGES
3O
16. PRICE CODE
AO3
20. LIMITATION
OF ABSTRACT
NSN 7540-01-280-5500Standard Form 298 (Rev. 2-8g
Prescribed by ANSI Std. Z-39-18298-102


![Materials Chemistry and Physics · 2020. 3. 5. · ferent natural or synthetic piezoelectric ceramics (e.g. calcium titanate, barium titanate and lead zirconate titanate (PZT)) [2]](https://img.dokumen.tips/doc/110x75/60b88a1c38582264692512fa/materials-chemistry-and-physics-2020-3-5-ferent-natural-or-synthetic-piezoelectric.jpg)