Embed Size (px)
Citation preview

The Pennsylvania State University
The Graduate School
Department of Electrical Engineering
LOSS MECHANISMS IN PIEZOELECTRIC PZT CERAMICS AND SINGLE
CRYSTALS
A Thesis in
Electrical Engineering
by
Aditya M. Rajapurkar
2008 Aditya M. Rajapurkar
Submitted in Partial Fulfillment
of the Requirements
for the Degree of
Master of Science
August 2008

ii
The thesis of Aditya Rajapurkar was reviewed and approved* by the following:
Kenji Uchino
Professor of Electrical Engineering
Thesis Advisor
L. Eric Cross
Evan Pugh Professor of Electrical Engineering ...
W. Kenneth Jenkins
Professor of Electrical Engineering
Head of the Department of Electrical Engineering
*Signatures are on file in the Graduate School

iii
ABSTRACT
This thesis aims to clarify the loss mechanisms in piezoelectric ceramics and single
crystals in the view of the recent developments in high power piezoelectric devices such as
piezoelectric actuators, ultrasonic motors and piezoelectric transformers in commercial
applications. In these devices the piezoelectric materials are driven under high voltages and
currents. At high power conditions, the materials deviate from their linear constitutive equations
due to non-linearity and hysteresis in physical parameters. The non-linearity and hysteresis
manifests in terms of loss and consequently, heat generation in piezoelectric materials.
Therefore, analysis of the fundamental principles of loss mechanisms is essential in the
determination of heat generation. The loss in piezoelectric materials is directly related to the
mechanical quality factor which is defined as the inverse of the loss tangent factor. The quality
factor is experimentally calculated following IEEE standards using the impedance curves, Qm as
well as near resonance and anti-resonance frequencies and defined as QA and QB. The low power
measurement setup in terms of sample holders is reexamined in order to obtain reproducible
results. Loss in the 33- and 31- vibration modes is clarified for ‘hard’ and ‘soft’ piezoelectric
PZT ceramics. Further loss anisotropy in PMN-PT based single crystals as a function of crystal
orientation dependence, vibration mode and doping is investigated. Losses associated with
resonance and anti-resonance modes are discussed in the above materials. Significant difference
(20-40%) between Q values at resonance (QA) and anti-resonance (QB) with Q being higher for
anti-resonance mode. This result is verified analytically and dependence of the quality factor on
k31 (electromechanical coupling coefficient), tanδ’ (dielectric loss), tanϕ’(mechanical loss) and
tanθ’ (piezoelectric loss) is observed. Quality factors (QA and QB) are also calculated at high
power near resonance and anti-resonance while maintaining the vibration velocity constant in
order to observe the difference at ‘in-service’ conditions. At high power the quality factors drop

iv
by almost half as compared to the low power characterization while maintaining the difference in
QA and QB seen at low power. Based on these results it is recommended to drive piezoelectric
devices at anti-resonance mode in order to get better efficiency.
v
TABLE OF CONTENTS
LIST OF FIGURES ....................................................................................................................... VII
LIST OF TABLES ........................................................................................................................ VIII
CHAPTER 1 INTRODUCTION ....................................................................................................... 1
1.1 BACKGROUND ............................................................................................................................. 1
1.1.1 Piezoelectricity ................................................................................................................. 1
1.1.2 Loss and hysteresis in piezoelectrics ................................................................................ 3
1.1.3 Piezoelectric materials ..................................................................................................... 8
1.2 OBJECTIVE .................................................................................................................................. 9
1.3 OUTLINE .................................................................................................................................. 10
References .............................................................................................................................. 10
CHAPTER 2 MECHANICAL QUALITY FACTOR............................................................................. 12
2.1 CALCULATION OF MECHANICAL QUALITY FACTOR-QM ....................................................................... 12
2.1.1 Equivalent circuit method .............................................................................................. 13
2.1.2 Quality factor for k31 mode piezoelectric plate .............................................................. 14
2.1.3 Quality factor based on impedance curve ..................................................................... 16
2.2 THEORETICAL ANALYSIS ............................................................................................................... 17
2.3 IMPEDANCE ANALYSIS ................................................................................................................. 19
CHAPTER 3 LOSS IN PIEZOELECTRIC PZT CERAMICS .................................................................. 24
3.1 LOW POWER RESULTS ................................................................................................................ 24
3.2 HIGH POWER RESULTS ................................................................................................................ 28
CHAPTER 4 LOSS IN PMN-PT SINGLE CRYSTALS ........................................................................ 30
4.1 BACKGROUND ........................................................................................................................... 30

vi
4.2 EXPERIMENTAL PROCEDURE ......................................................................................................... 33
4.3 RESULTS AND DISCUSSION ........................................................................................................... 36
4.3.1 Effect of Vibration mode................................................................................................ 39
4.3.2 Effect of Crystal Orientation .......................................................................................... 40
4.3.3 Effect of Doping ............................................................................................................. 41
4.4 MAXIMUM VIBRATION VELOCITY OF PMN-PT SINGLE CRYSTALS ......................................................... 41
REFERENCES ................................................................................................................................... 43
CHAPTER 5 CONCLUSIONS ....................................................................................................... 45
LOSS IN PZT PIEZOELECTRIC CERAMICS ................................................................................................ 45
LOSS IN PMN-PT SINGLE CRYSTALS .................................................................................................... 45
APPENDIX A PIEZOELECTRIC CONSTITUTIVE EQUATIONS ......................................................... 46
BIBLIOGRAPHY ......................................................................................................................... 47
VITA .......................................................................................................................................... 49

vii
LIST OF FIGURES
FIGURE 1.1: (A) X VS X (SHORT-CIRCUIT) (B) D VS. E (STRESS FREE) (C) X VS E (STRESS FREE) AND (D) D VS. X (SHORT CIRCUIT)
CURVES WITH HYSTERESIS. ............................................................................................................................. 5
FIGURE 2-1: LUMPED PARAMETER EQUIVALENT CIRCUIT FOR PIEZOELECTRIC VIBRATOR. .................................................. 14
FIGURE 2-2: IMPEDANCE CURVE OF PIEZOELECTRIC MATERIAL SHOWING RESONANCE AND ANTI-RESONANCE ....................... 15
FIGURE 2-3: (A) QA RESONANCE. (B) QB ANTI-RESONANCE....................................................................................... 16
FIGURE 2-4: (A) SAMPLE HOLDER USING CLAMPED CONTACTS. (B) DEVIATION OF Q VALUES OVER SUCCESSIVE READINGS. ..... 20
FIGURE 2-5: (A) SAMPLE HOLDER CONTACTS THROUGH LEAD WIRE. (B) DEVIATION OF Q VALUES OVER SUCCESSIVE READINGS.
.............................................................................................................................................................. 21
FIGURE 2-6 RECOMMENDATION FOR SAMPLE HOLDER FOR DIFFERENT GEOMETRIES. ....................................................... 22
FIGURE 3-1 RESULTS FOR ‘HARD’ PIEZOELECTRIC CERAMIC ......................................................................................... 25
FIGURE 3-2 RESULTS FOR ‘SOFT’ PIEZOELECTRIC CERAMIC. ......................................................................................... 27
FIGURE 3-3 DIFFERENCE IN QA AND QB. ................................................................................................................. 28
FIGURE 3-4 QUALITY FACTOR AS A FUNCTION OF VIBRATION VELOCITY FOR ‘HARD’ PIEZOELECTRIC CERAMIC. ........................ 29
FIGURE 4.1: EQUIVALENT SPONTANEOUS POLARIZATION VECTORS OF A FERROELECTRIC RHOMBOHEDRAL PMN-PT CRYSTAL.
THE COORDINATE AXES ARE BASED ON CUBIC PEROVSKITE PHASE (NOT A RHOMBOHEDRAL FERROLELECTRIC PHASE). ..... 32
FIGURE 4.2: SINGLE CRYSTAL SAMPLE ORIENTATION. ELECTRODES ARE SHADED. ............................................................ 33
FIGURE 4.3: IMPEDANCE CURVE OF PMN-PT [011] WITH LENGTH IN [0-11] DIRECTION (17X3X1 MM3) PIEZOELECTRIC
MATERIAL SHOWING RESONANCE AND ANTI-RESONANCE ................................................................................... 35
FIGURE 4.4: MECHANICAL QUALITY FACTOR AND ELECTROMECHANICAL COUPLING FACTOR FOR 31- VIBRATION MODE. ......... 37
FIGURE 4.5: ANTI-RESONANCE MECHANICAL QUALITY FACTOR FOR THE 31- VIBRATION MODE. ......................................... 38
FIGURE 4.6: MECHANICAL QUALITY FACTOR AND ELECTROMECHANICAL COUPLING FACTOR FOR THE 33 - VIBRATION MODE. ... 39
FIGURE 4.7: EFFECT OF CRYSTAL ORIENTATION AND DOPING ON QA FOR THE 31- (A) AND 33- VIBRATION MODES (B). .......... 41
FIGURE 4.8: VIBRATION VELOCITY OF PIEZOELECTRIC SINGLE CRYSTALS AND CERAMICS. .................................................... 42

viii
LIST OF TABLES
TABLE 2-1: COMPARISON OF QUALITY FACTORS ON K33 AND K31 MODES ....................................................................... 22
TABLE 3.1: QUALITY FACTOR AS A FUNCTION OF VIBRATION VELOCITY FOR ‘SOFT’ PIEZOELECTRIC CERAMIC .......................... 29
TABLE 4.1: EFFECT OF VIBRATION MODE ON QUALITY FACTOR ..................................................................................... 40

ix
ACKNOWLEDGEMENTS
I express my sincere gratitude to my adviser Dr. Kenji Uchino for his guidance. Dr.
Uchino has shown me how to work on research with passion and enthusiasm. I am grateful
towards him for his suggestions and encouragement towards my research. I am privileged and
express my deepest regards towards Dr. L. Eric Cross for being on my committee and for his
valuable comments on this thesis. I wish to thank Dr. Ahmed Amin for his invaluable help and
encouragement in my research. I feel grateful towards Dr. Ho-Yong Lee for reminding me of the
important points in my research. I express gratitude to the faculty at Penn State for some
stimulating and challenging classes which helped me build a strong base.
I am thankful to ICAT colleagues, Seyit Ural, Safakcan Tuncdemir, Seung-Ho Park,
Yuan Zhuang and Tom Tremper for their guidance and support. I am indebted to Seyit for
helping me throughout my master’s degree right from the time I started at ICAT. They have been
excellent role models for me to follow.
I thank my parents and my sister for their constant encouragement and support. They
have given me a platform from which I can reach great heights.
Finally, I acknowledge the funding from the Office of Naval research.

Chapter 1
Introduction
1.1 Background
1.1.1 Piezoelectricity
In polar dielectric materials, the electric polarization exists in the constituent molecules
or atoms, which is randomly oriented. When an electric field is applied, the cations are attracted
to the cathode and anions to the anode due to electrostatic interaction. These materials can store
more charge due to the dielectric polarization P, and the physical quantity of electric charge per
unit area is called dielectric displacement D. It is related to the electric field by the following
expression where the second part is only applicable in a linear dielectric:
EPED 00 εεε =+= (1.1)
where, ε0 is the permittivity in vacuum (8,85 x 10⁻¹²
F/m2),
ε is the relative permittivity.
Materials in which the centers of positive and negative charges do not coincide even
without the application of electric field are said to have spontaneous polarization, Ps. When the
equilibrium spontaneous polarization of a dielectric material can be reorientated by an electrical
field of sufficient strength at temperatures below a characteristic temperature Tc, it is called a
ferroelectric. Based on the crystallographic symmetry there are 32 different point groups [1] and
the structural symmetry in a material affects its dielectric, elastic, piezoelectric, thermal and

2
optical properties. Further, these 32 point groups can be divided into two groups—(1) 11
centrosymmetric types, which possess center of symmetry and (2) 21 non-centrosymmetric types,
which do not have center of symmetry. Out of these 21 non-centrosymmetric group, 20 exhibit
piezoelectric effect (except for point group [432]).
When uniform stress is applied in a non-centrosymmetric crystal, there is a movement of
positive and negative ions with respect to each other, creating an electric charge at the surface of
the material. This phenomenon is the direct piezoelectric effect in which there is a conversion of
mechanical energy into electrical energy. In contrast, when an electric field is applied to the
crystal, a compressive or tensile strain is produced. This phenomenon is called the converse
piezoelectric effect: conversion of electrical energy into mechanical energy. When an alternating
electric is applied, mechanical vibration is induced which at appropriate frequency causes
mechanical resonance and large resonating strain is created. This phenomenon of strain
magnification due to accumulation of input energy is called piezoelectric resonance.
The above direct and converse phenomenon can be represented by the following
equations containing stress X, strain x, electric field E and dielectric displacement D:
mmij
E
iji EdXsx += (1.2)
k
X
mkimim EXdD 0εε+= (1.3)
where, i, j = 1,2,…,6; m, k = 1,2,3 represent the tensor subscripts. Here, sE, d and εX
are
the compliance at constant electric field, the piezoelectric constant and permittivity at constant
elastic stress respectively.
3
1.1.2 Loss and hysteresis in piezoelectrics
Loss or hysteresis in piezoelectric materials poses a serious problem at off-resonance in
positioning actuator applications. Moreover, at resonance, loss generates a significant amount of
heat in the piezoelectric materials that causes a serious degradation of device characteristics. The
electrical and mechanical losses in ferroelectric ceramics are considered to consist of four
portions: (1) domain wall motion, (2) fundamental lattice portion, which should also occur in
domain free monocrystals, (3) microstructure portion, which occurs in polycrystals, and (4)
conductivity portion [2]. T Ikeda [3] describes the basic formulae for the loss and hysteresis in
piezoelectrics. Uchino and Hirose (2001) [4] described the phemenological theory to deal with
losses and developed a method to calculate the intrinsic losses of a piezoelectric ceramic. Loss in
piezoelectric materials can be described in terms of electrical and mechanical dissipation factors.
These dissipation factors have been included in the piezoelectric material constants as imaginary
terms in the complex material constants [Holland et al 1969, 5]. Note that the piezoelectric
equations (1.2), (1.3) cannot give the delay-time related loss without taking into account
irreversible thermodynamic equations or dissipation functions. This is equivalent to introducing
complex parameters εX*(ε is the dielectric constant), s
E* (s is the elastic complianc) and d* (d is
the piezoelectric constant) are described in [5] in order to consider the hysteresis losses in
dielectric, elastic and piezoelectric coupling energy:

4
)'tan1(* δεε jXX −= (1.4)
)'tan1(* φjss EE −= (1.5)
)'tan1(* θjdd −= (1.6)
Here, δ' is the phase delay of the electric displacement to an applied electric field under a
constant stress condition, ϕ’ is the phase delay of the strain to an applied stress under a constant
electric field condition and θ’ is the phase delay of the strain under applied electric field or the
phase delay of the electric displacement under an applied stress. These phase delays are defined
as ‘intensive’ losses. Figure 1.2a-d shows the model hysteresis curves from which we can obtain
the above phase delays. In terms of the complex description, the hysteresis loop should be
elliptical in shape; however that is not actually observed.

Figure 1.1: (a) x vs X (short
X (short-circuit) curves with hysteresis.
x vs. E (stress free
x vs. X (short-
short-circuit) (b) D vs. E (stress free) (c) x vs E (stress free) and (d) D vs.
circuit) curves with hysteresis.
D vs. X (shortstress free)
-circuit) D vs. E (stress free
5
(stress free) (c) x vs E (stress free) and (d) D vs.
D vs. X (short-circuit)
stress free)

6
The area inside the hysteresis loop corresponds to the energy loss per cycle per unit
volume. The stored energies and the losses for pure dielectric and elastic energies are given by:
2
002
1EU X
e εε= (1.7)
'tan2
00 δεπε EwX
e = (1.8)
2
02
1XsU X
m = (1.9)
'tan2
0 φπ XswE
m = (1.10)
The electromechanical hysteresis losses are calculated by measuring the induced strain
under an electric field:
2
0
2 )/(2
1EsdU E
em = (1.11)
)'tan'tan2()/( 2
0
2 φθπ −= EsdwE
em (1.12)
Also, electromechanical losses can be obtained by measuring the induced charge under
stress:
2
00
2 )/(2
1XdU X
me εε= (1.13)
)'tan'tan2()/( 2
00
2 φθεεπ −= XdwX
me (1.14)
Hence from the measurements of above hysteresis loops we can obtain the ‘intensive’
loss parameters i.e. from (D vs. E) and (x vs. X) we can obtain tanδ’ and tanϕ’; and from the
measurements of (x vs. E) or (D vs. X) we can obtain tanθ’.

7
Losses at piezoelectric resonance
When an alternating field is applied at an appropriate frequency, there is a mechanical
resonance induced in the piezoelectric material. At resonance the mechanical vibration amplitude
is amplified by a factor of Qm (mechanical quality factor) as compared to off-resonance. The
expression for admittance in of a piezoceramic can be derived from the expressions of extensional
vibration of transverse vibration of piezoelectric plate [1] and is given by
−−+−=
*
*2
3102/
)2/tan()]'tan'tan2(1[)tan1(
vl
vljkCjjCjY d
ω
ωφθωδω
(1.15)
where, ω is the driving frequency,
Cd is the damped capacitance,
C0 is the motional capacitance,
0
2
31300 )1(,)/( CkCtwLC d
X −== εε (1.16)
tanδ is the ‘extensive dielectric loss,
)]'tan'tan2('[tan1
1tan
2
312
31
φθδδ −−−
= kk
(1.17)
k31 is the electromechanical coupling coefficient,
v* is the sound velocity in the material,
)2
'tan1(
)'tan1(
1
11
* φ
φρjv
jsv
E+=
−=
(1.18)
ρ is the density.
Now, the resonance, defined as the maximum admittance point, is derived using the
expansion of the term tan(ωL/2v*) around (ωL/2v)=π/2 [1]. The maximum motional admittance
Ymmax is obtained as:

8
12
310
2max )'(tan)/8( −= φωπ KCY dm (1.19)
Now the mechanical quality factor Qm is defined as,
1)'(tan2
−=∆
= φω
ωmQ
(1.20)
Where, ∆ω is the 3dB bandwidth obtained at Ymmax/√2.
Therefore, the mechanical quality factor is inversely proportional to the intensive elastic
loss [1].
1.1.3 Piezoelectric materials
The first studies in ceramic piezoelectric materials were done on materials barium titanate
(BaTiO3), PbTiO3, KNbO3 for their applications in single crystal and polycrystalline form.
However, the discovery of lead zirconate titanate (Pb(ZrxTi1-x)O3) by Jaffe et al. in 1954 [6] led to
widespread usage of piezoelectric polycrystalline materials in various applications. The research
into compositional modifications on PZT based ceramics for specific applications led to
classification of PZT ceramics into two groups: ‘hard’ and ‘soft’.
‘Hard’ PZT ceramics have acceptor dopants and are characterized by small displacement
at off-resonance, low dielectric loss, and high mechanical quality factor (Qm). They are therefore
used for ultrasonic applications, such as ultrasonic motors. On the contrary, ‘soft’ PZT ceramics
are donor doped and present a large strain at off-resonance, high dielectric loss and a low
mechanical quality factor. They are generally used in off-resonance devices such as multilayer
actuators.

9
Recently large research effort has been put into Lead Magnesium Niobate-Lead TItanate
(PMN-PT) single crystals because of their large electromechanical coupling factors (k >
0.85) and piezoelectric constants (d > 1000pC/N).
1.2 Objective
The guidelines to measure the electromechanical constants of piezoelectric materials with
low loss have been described in IEEE standards 176-1987. However, without considering the
electric and mechanical dissipation, the material properties may be over estimated if IEEE
standards are directly used. Smits et al (1976) [7] developed an “iterative-method” based on
curve fitting of the theoretical impedance expression to fit three measured data points. Sheritt et
al,(1992) [8] developed a method by introducing complex frequencies fs and fp. This method is
limited for materials with low dielectric and piezoelectric loss. Du et al (2000) [9] developed a
new method for determination of electromechanical coefficients and extended this approach for
single crystals.
Different from the previous studies, this research aims at developing the loss mechanisms
in piezoelectric ceramics as well as single crystals based on the experimental method of
determining losses from the impedance analysis. Moreover, this study extends over loss
dependence on the form factors (k33 and k31 mode) in ‘hard’ and ‘soft’ piezoelectric ceramics.
In addition, the study is extended to lead magnesium niobate-lead titanate PMN-PT
single crystals. Moreover, using the crystal anisotropy it is possible to modify the
performance by suitable selection of the orientation. In addition, appropriate composition
changes or doping can be used to improve upon the limitations of low thermal or
mechanical stability resulting from high loss or low mechanical quality factor Qm. In this

10
research, we report the loss performance of PMN-PT single crystals as a function of
orientation, doping and vibration mode.
1.3 Outline
First the experimental method for impedance measurements to determine the mechanical quality
factor is described. In this section, the focus is on obtaining reproducible measurements of low
power impedance measurements on piezoelectric materials in k33 and k31 vibration modes. Based
on the experimental techniques developed, the results for piezoelectric ceramics are summarized
in chapter 3. The loss for ‘hard’ and ‘soft’ materials and their appropriate drive techniques is
described. Next, in chapter 4 the losses in piezoelectric single crystals are described as a function
of crystal orientation, doping and vibration mode.
References
1. K. Uchino, J.R. Giniewicz: Micromectronics, Marcell Dekker Publication, New
York (2002).
2. K.H. Haerdtl, Ceramics International, 8, (1982), 121.
3. T. Ikeda: Ohm Publication, Tokyo (1984).
4. K. Uchino and S. Hirose: IEEE Trans. UFFC, 48, (2001) No. 1.

11
5. R. Holland: IEEE Trans. Sonics and Ultrasonics, 14, (1967) 18.
6. B. Jaffe, W.R. Cook, and H. Jaffe: Academic Press, London, (1971).
7. J. G. Smits: IEEE Trans. Sonics and Ultrasonics, vol. SU-23, no. 6, pp. 393-402,
(1976).
8. S. Sherrit, H.D. Wiederick, and B.K. Mukherjee: Ferroelectrics, 134, pp. 111-119,
(1992).
9. X.-H Du, Q.M. Wang, U. Belegundu, and K. Uchino: J. Ceram. Soc. Jpn, 107, pp.
190-191 (1999).

Chapter 2
Mechanical Quality Factor
The mechanical quality factor is useful in characterizing resonant systems. Quality
factor (Q) compares the time constant for decay of a resonating system’s amplitude to its
resonance period. It is generally defined as,
.2etedPerCyclrgyDissipaAverageEne
StoredEnergyQ π=
(2.1)
The concept was developed for electrical systems such as filter circuits as well as
for mechanical systems such as damped spring-mass systems in order to correlate the
sharpness of the respective resonance curve.
2.1 Calculation of Mechanical Quality Factor-Qm
As discussed in chapter 1, losses in piezoelectric materials can be divided into
three different mechanisms: dielectric, mechanical and piezoelectric losses. These losses
are represented in the complex material notation as negative imaginary part [1]. The
analytical and experimental method for calculation of these losses was developed by
Uchino et al,[2] by extending the intensive and extensive loss model proposed by
Ikeda,[3] for the k31 mode. At resonance in piezoelectric materials, the mechanical losses
are the most significant one among three losses and it was shown that the mechanical

13
quality factor Qm, is inversely proportional to the mechanical loss factor, tanϕ’ [4].
Therefore, Qm value is used as a figure of merit for the losses in piezoelectric materials.
In piezoelectric materials, there is a strong coupling between electrical and
mechanical fields so, mechanical, electrical and piezoelectric components of energy
losses should be included in the characterization. Generally, in the data sheet available
for commercial piezoelectric materials the mechanical quality factor (Qm) and the
dielectric dissipation factor (tanδ) are provided for the loss characteristics. In this case
Qm is calculated near the resonance frequency from a piezoelectric disc in planar
vibration mode. [5,6] The elastic, piezoelectric and dielectric constants of a piezoelectric
vibrator can be obtained from the resonator measurements by determining the electrical
impedance as a function of frequency. Resonance frequency (fa) and anti-resonance
frequency (fb), the capacitance and the dissipation factor in the desired frequency range
are required to determine the material constants. The methods used for the calculation of
Qm are described below.
2.1.1 Equivalent circuit method
In some cases, the material constants are calculated by using the measured
parameters from a lumped parameter equivalent circuit as shown in Fig. 2-1. Note that
the circuit parameters are assumed constant in the IEEE standards. The method for
calculating all the circuit parameters is given in detail in IEEE standard on
piezoelectricity.

14
Once the circuit parameters for the piezoelectric vibrator are determined using an
impedance analyzer, the mechanical quality factor can be calculated by using the equation below,
012
1
CRfQ
rm
π=
(2.2)
Where, fr is the resonance frequency.
2.1.2 Quality factor for k31 mode piezoelectric plate
.In piezoelectric materials, there exists resonance and anti-resonance as shown in
Fig.2-2, which can be understood as electrical short circuit condition and the latter at
electrical open circuit condition respectively.
Figure 2-1: Lumped parameter equivalent circuit for piezoelectric vibrator.
R1
L1
C0
C1
C0

15
Generally used equations for the determination of the mechanical quality factor of a
k31 mode plate sample, as described in the IEEE standards, is obtained by measuring the
minimum impedance (Zm) at the fundamental resonance frequency. Qm is given by the
equation 2.3,
−+=
2
22
10 )(21
b
abma
m f
ffCCZf
Qπ
(2.3)
where, fa is the fundamental resonance frequency, fb is the anti-resonance frequency,
C0 is the shunt capacitance and C1 is the series capacitance of the sample.
In the derivation of equation (2.3), it is assumed that Qm is exactly same for both
resonance and anti-resonance modes, which will be reconsidered in this paper.
96.0k 98.0k 100.0k 102.0k 104.0k 106.0k 108.0k
10
100
1k
10k
100kIm
pedance
Frequency
Figure 2-2: Impedance curve of piezoelectric material showing resonance and anti-resonance
Resonance (fa)
Anti-Resonance (fb)

16
2.1.3 Quality factor based on impedance curve
Another way of calculating the quality factor is based on the frequency difference
between two frequencies corresponding to the 3 dB below the admittance resonance peak
and the impedance anti-resonance peak. Taking narrow frequency range close to the
resonance and anti-resonance fig. 2-3, we can define the resonance quality factor (QA)
and the anti-resonance quality factor (QB) as shown in equation (2.4). In this research,
the difference between two quality factors, QA and QB calculated at resonance and anti-
resonance respectively were investigated.
2121
,ff
fQ
ff
fQ b
Ba
A−
=−
= (2.4)
where, f1-f2 is the 3 dB bandwidth.
99650 99700 99750 99800
0.020
0.025
0.030
0.035
Adm
itta
nce (
S)
Frequency (Hz)
103500 103550 103600
160.0k
180.0k
200.0k
220.0k
240.0k
260.0k
280.0k
Imp
ed
an
ce
(o
hm
)
Frequency (Hz)
Figure 2-3: (a) QA Resonance. (b) QB Anti-resonance
fA fB
f1-f2 f1-f2

17
2.2 Theoretical analysis
Mezheritsky [8, 9] derived analytical expressions for the quality factors observed at
resonance (QA) and anti resonance (QB). He describes that there is a difference in these
quality factors as opposed IEEE standards which consider QA and QB as the same. We
derived the relationship between QA and QB on the basis of preceding works by
Mezheritsky [8,9]. Consider a piezoelectric rectangular plate in the k31 mode. The
admittance of this piezoelectric rectangular plate is given by,
−−+−=
*2/
*)2/tan()'tan'tan2(1)tan1( 2
310vl
vljkCjjCjY d
ω
ωφθωδω
(2.5)
where,
tanδ is the extensive dielectric loss,
[ ])'tan'tan2('tan1
1tan 2
31231
φθδδ −−−
= kk
(2.6)
tanθ’ is the intensive piezoelectric loss,
tanϕ’ is intensive mechanical loss,
k31 is the electromechanical coupling coefficient and
v* is the complex sound velocity,
)2/'tan1()'tan1(/1*11
φφρ jvjsvE +=−=
(2.7)

18
The quality factor at resonance has been derived using the equation (2.5) at its
maximum point,[7]
'tan
1
φ=AQ
(2.8)
In contrast, the quality factor at anti-resonance QB, needs to be derived at the
minimum point of equation (2.5). QB is then calculated as,
ω
ω
∆= b
BQ (2.9)
where, ωb is the frequency corresponding to Ymin
and ∆ω is the bandwidth 2(ωb-ω1),
and ω1 is the frequency at which the admittance is √2Ymin
. For analysis, we introduce a
new parameter Ω=ωL/2ν, normalized frequency:
)2/'tan1(*2
φν
ωj
l−Ω=
(2.10)
Considering the series expansion of the following equation (2.10),
Ω
Ω−Ω=
Ω−Ω=
2cos2
'tantan)
2
'tantan(*)2/tan(
φφνω jjl
(2.11)
Using first order approximation for equation (2.11), and substituting equations (2.8)
and (2.9) in equation (2.5), we get admittance expression in terms of real and imaginary
components. Then define a function S as a function of Ω:
22
02)( Y
C
LS
=Ω
ν
(2.12)
From (2.12), the anti-resonance corresponds to the minimum of S(Ω). Now
calculate Smin and obtain the corresponding anti-resonance frequency Ωb. The 3 db

19
bandwidth is obtained by using S(Ω’)=2Smin. Then according to the definition, QB can
be obtained as,
∆=
2
bBQ
ω
(2.13)
'tan1
1)'tan2'tan'(tan2
cos)1(
22
3131
2
2312
31
φθφδ
Ω
−++−+
Ω+−
=
b
bB
kk
kk
Q
(2.14)
where, Ωb=ωl/2ν, (π/2<Ωb<π). Now considering equation (6) we can get,
)'tan2'tan'(tan
11
211
22
3131
θφδ −+
Ω
−+
+=
b
ABk
k
(2.15)
Equation (14) clearly shows the difference between the quality factors at resonance
and anti-resonance based upon the parameters, k31, tanδ’, tanϕ’ and tanθ’. The detailed
derivation can be found by Zhuang et.al [12].
2.3 Impedance Analysis
In this section, some guidelines will be introduced regarding the appropriate use of
sample holders for impedance analysis. For example, fig. 2-4 shows a sample holder

used for admittance spectrum of k
values for the same ‘hard’ piezoelectric sample repeatedly.
Figure 2-4: (a) Sample holder using clamped contacts. (b) Deviation of Q values over successive readings
It is seen that the standard deviation is greater than 30% of the mean value.
Moreover, measured Q values are below 600 when the typical Q value for ‘hard’
piezoelectric sample is greater than 1000 in planar mode. This decrease in quality factor
is attributed to the clamping of the sample along the vibration direction. Fig.
the same sample hung freely using thin lead wires.
Sample
Std. Dev. : σA=92, σ
Mean: QA=18,QB=371
r admittance spectrum of k33 mode sample and the corresponding calculated Q
values for the same ‘hard’ piezoelectric sample repeatedly.
0 2
0
100
200
300
400
500
600
Number of trial
Qualit
y F
acto
r
(a) Sample holder using clamped contacts. (b) Deviation of Q values over successive readings
It is seen that the standard deviation is greater than 30% of the mean value.
Moreover, measured Q values are below 600 when the typical Q value for ‘hard’
piezoelectric sample is greater than 1000 in planar mode. This decrease in quality factor
buted to the clamping of the sample along the vibration direction. Fig.
the same sample hung freely using thin lead wires.
σB=112
=371
QB
20
mode sample and the corresponding calculated Q
4 6
Number of trial
(a) Sample holder using clamped contacts. (b) Deviation of Q values over successive readings.
It is seen that the standard deviation is greater than 30% of the mean value.
Moreover, measured Q values are below 600 when the typical Q value for ‘hard’
piezoelectric sample is greater than 1000 in planar mode. This decrease in quality factor
buted to the clamping of the sample along the vibration direction. Fig. 2-5 shows
QA

Figure 2-5: (a) Sample holder contacts through lead wire
readings.
In this case, the standard deviation for repeated measurements of the same sample is
less than 10% of the mean and the Q values are in tune with the expected for this sample.
The important point in this discussion is that during the impedance analysis, t
natural vibration direction of the piezoelectric sample should not be constrained by the
contact points of the sample holder. Thus, k
suspended using thin lead wires and a k
allow the two ends to vibrate freely. The recommendations for appropriate sample
holders which may be used in impedance analysis of various geometries, is shown in fig.
2-6.
Sample
Std. Dev. : σA=129, σB=242
Mean: QA=1303,QB=2265
0 2
0
500
1000
1500
2000
2500
Number of trial
Qualit
y F
acto
r
(a) Sample holder contacts through lead wire. (b) Deviation of Q values over successive
In this case, the standard deviation for repeated measurements of the same sample is
less than 10% of the mean and the Q values are in tune with the expected for this sample.
The important point in this discussion is that during the impedance analysis, t
natural vibration direction of the piezoelectric sample should not be constrained by the
contact points of the sample holder. Thus, k33 mode bar samples should be freely
suspended using thin lead wires and a k31 mode plate should be held from the center to
allow the two ends to vibrate freely. The recommendations for appropriate sample
holders which may be used in impedance analysis of various geometries, is shown in fig.
QB
=242
=2265
21
4 6
Number of trial
. (b) Deviation of Q values over successive
In this case, the standard deviation for repeated measurements of the same sample is
less than 10% of the mean and the Q values are in tune with the expected for this sample.
The important point in this discussion is that during the impedance analysis, the
natural vibration direction of the piezoelectric sample should not be constrained by the
mode bar samples should be freely
mode plate should be held from the center to
allow the two ends to vibrate freely. The recommendations for appropriate sample
holders which may be used in impedance analysis of various geometries, is shown in fig.
QA

22
Figure 2-6 Recommendation for sample holder for different geometries.
Using the appropriate sample holders, quality factors were measured for k33 and k31
mode samples of the same material. The data shown in table 2.1 is from five
representative ‘hard’ samples of the k33 and k31 modes.
Table 2-1: Comparison of quality factors on k33 and k31 modes
QA QB
k33 k31 Ratio k33 k31 Ratio
1126+13% 1183+12% 0.95+6% 1868+18% 1986+12% 0.96+25%
All samples were cut to the appropriate dimensions for each vibration mode from the
same batch of bulk ceramic and poled at 3kV/mm at 130 in silicone oil for 30 minutes.
The measurements were carried out after 24 hours after poling. It was seen over a range
of samples that the ratio of Q values for the k31 and k33 mode is between 0.9-1.2. This
implies that the Q values for k33 and k31 vibration modes are nearly same and no
particular anisotropy in the loss is observed in the two vibration modes.

23
1. R. Holland: IEEE Trans. Sonics and Ultrasonics, 14, (1967) 18.
2. K. Uchino and S. Hirose: IEEE Trans. UFFC, 48, (2001) No. 1.
3. T. Ikeda: Ohm Publication, Tokyo (1984).
4. B. Jaffe, W.R. Cook, and H. Jaffe: Academic Press, London, (1971).
5. IEEE Standard on Piezoelectricity, Std. 176, (1987).
6. IRE Standard on Piezoelectric Crystals, v 46, (1958).
7. K. Uchino: Micromectronics, Marcell Dekker Publication, New York (2002).
8. A.V. Mezheritky: Quality Factor of Piezoceramics, Ferroelectrics, 266, (2002)
277.
9. A.V. Mezheritsky: IEEE UFFC, 4, (2002) 484.
10. S. Hirose, M. Aoygi, Y. Tomikawa, S. Takahashi and K. Uchino: High power
characteristics at anti-resonance frequency of piezoelectric transducers,
Ultrasonics, 34, (1996) 213.

24
Chapter 3
Loss in Piezoelectric PZT Ceramics
3.1 Low Power Results
In this section, the quality factor at resonance and anti-resonance are summarized for
‘hard’ and ‘soft’ materials in the k33 and k31 mode measured using the admittance
spectrum from HP4192 impedance analyzer under an oscillation level of 0.5V. Fig. 3.1
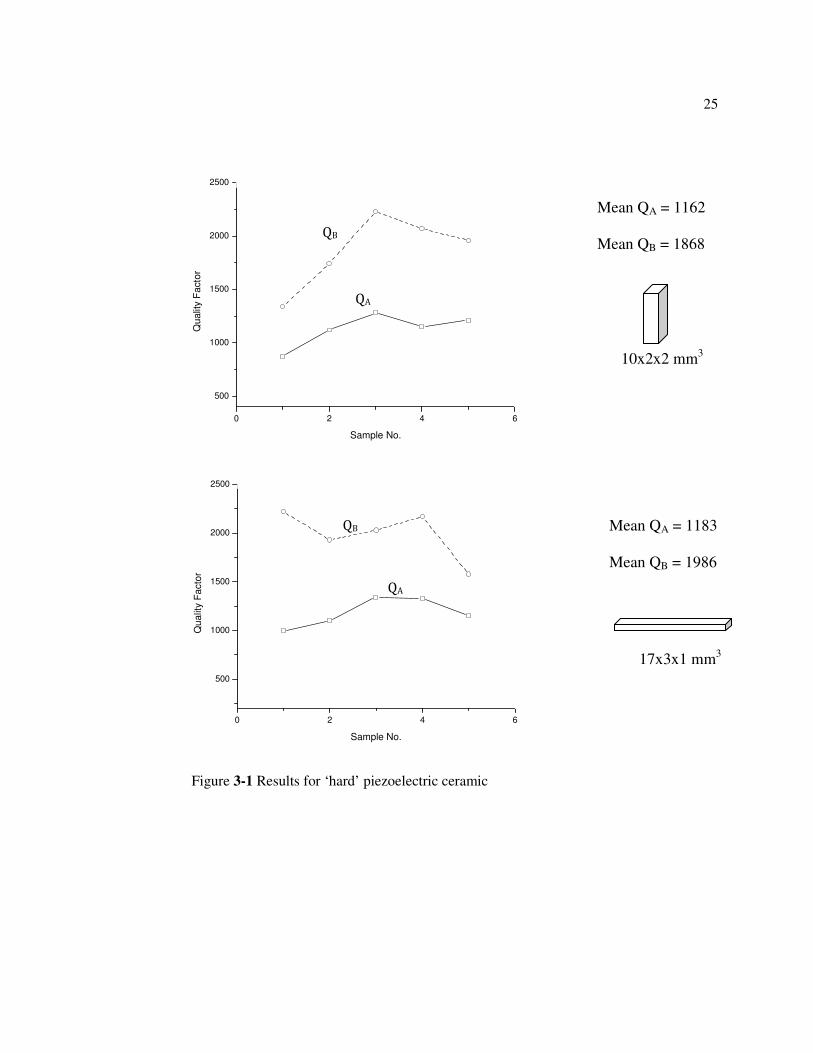
summarizes the results for the hard piezoelectric ceramic.
25
0 2 4 6
500
1000
1500
2000
2500
Sample No.
Qu
alit
y F
acto
r
0 2 4 6
500
1000
1500
2000
2500
Sample No.
Qu
alit
y F
acto
r
Figure 3-1 Results for ‘hard’ piezoelectric ceramic
Mean QA = 1162
Mean QB = 1868
10x2x2 mm3
Mean QA = 1183
Mean QB = 1986
17x3x1 mm3
QB
QA
QB
QA

26
For both vibration modes, average quality factor of greater than 1000 is observed at
the same time it is clear that QB is higher than QA over all sample range in both k33 and
k31 vibration modes. QB is higher than QA by 40% for both vibration modes.
Fig. 3.2 summarizes the results for the soft piezoelectric ceramic. Soft piezoelectric
material shows quality factor less than 100 and QB is higher than QA for both vibration
modes. However, as opposed to ‘hard’ piezoelectric ceramic, QB is higher than QA by
35% in k33 mode and by 20% in the k31 mode.

27
0 2 4 6
0
10
20
30
40
50
60
70
80
90
100
110
120
130
140
150
160
170
180
190
200
Sample No.
Qu
alit
y F
acto
r
1 2 3 4 5
40
45
50
55
60
65
70
75
80
85
90
95
Qualit
y F
acto
r
Sample No.
Figure 3-2 Results for ‘soft’ piezoelectric ceramic.
Mean QA = 100
Mean QB = 158
10x2x2 mm3
Mean QA = 75
Mean QB = 93
17x3x1 mm3
QB
QA
QB
QA

28
Figure 3-3 Difference in QA and QB.
Fig. 3.3 shows the difference in QB and QA in terms of percentage difference. It can
be seen that QB is 20% to 50% higher than QA depending on the material and vibration
mode.
3.2 High Power Results
In this section, results for high power measurements on k31 mode samples are
discussed for sake of observing the quality factor at ‘in-service’ conditions for actuators.
In this measurement, the vibration velocity is kept constant on the k31 mode samples and
impedance measurement is carried out using computer control setup [11]. Fig. 9 shows
the quality factors as a function of vibration velocity for ‘hard’ piezoelectric ceramic.
0
10
20
30
40
50
60
1 2 3 4 5
% D
iffe
rence
Sample Number
Hard k33
Soft k33
Hard k31
Soft k31

29
60 80 100 120 140 160 180 200 220 240 260
500
600
700
800
900
1000
1100
1200
1300
1400
1500
1600
Qu
alit
y F
acto
r
Vibration Velocity (mm/s)
Figure 3-4 Quality factor as a function of vibration velocity for ‘hard’ piezoelectric ceramic.
As expected, the both QB and QA drop at higher vibration velocity levels. Moreover,
as in the case at low power, QB is higher than QA at various power levels. Similarly,
table 2 shows the quality factor for soft piezoelectric ceramic as a function of vibration
velocity.
Table 3.1: Quality factor as a function of vibration velocity for ‘soft’ piezoelectric
ceramic
Vibration Velocity
(mm/sec)
QA QB
20 78 81
50 49 63
For soft piezoelectric ceramic the vibration velocity is limited due to large loss and
heat generation.

Chapter 4
Loss in PMN-PT Single Crystals
4.1 Background
The figures of merit for sonar transducers are high bandwidth, high power efficiency
and high energy density. These device performance parameters are a function of
electromechanical coupling factor, piezoelectric coefficient and drive level limits of the
material (i.e., maximum vibration velocity). High electromechanical coupling factors and
high piezoelectric constants have been reported in some relaxor ferroelectric single
crystals. For example, in Pb(Zn1/3Nb2/3)O3-PbTiO3 (PZN-PT) the electromechanical
coupling factor k33 ~ 0.92 and the longitudinal piezoelectric constant d33 of 1500 pC/N
were reported [1]. Similarly, in Pb(Mg1/3Nb2/3)O3-PbTiO3 (PMN-PT) k33 ~ 0.90 and d33
~ 2000 pC/N has been reported [2]. With more evidence of single crystal relaxor
ferroelectrics showing similar properties being reported, these materials seem to be ideal
candidates for high bandwidth and high power density applications. However, the
limitations for these materials are the low Curie temperature TC, low ferroelectric
rhombohedral FR—ferroelectric tetragonal FT transition temperature TRT, the low
coercive field, and moreover, low mechanical quality factor Qm which limits the stability
at high electric drive conditions. Heat generation sometimes limits the single crystal
usage for practical transducer applications. This is the motivation of this research.

31
In single crystals, the properties change dramatically with the crystal orientation as
reported in Reference [3]. Therefore, by using appropriate cut orientation of the single
crystals the high power properties may be improved. Moreover, the above limitations
can be mitigated by doping the single crystals with appropriate elements. In Reference
[4], the mechanical quality factor improvement was observed in PZN-PT single crystals
with Mn-doping. Therefore, in this paper we examine the loss properties in
0.70Pb(Mg1/3Nb2/3)O3-0.30PbTiO3 single crystals as a function of (1) vibration mode (2)
crystal orientation, and (3) doping.
The single crystal samples in k33 and k31 vibration modes were fabricated using Solid-
State Crystal Growth (SSCG) technique [5]. Since the elastic, piezoelectric and dielectric
properties of 0.71Pb(Mg1/3Nb2/3)O3-0.29PbTiO3 were reported in Reference [6], we
focus in this paper the loss/mechanical quality factor. The dimensions (12x4x4 mm3) of
the 33- and (17x3x1 mm3) of the 31- vibration modes were chosen as per the IEEE
standard guidelines [7]. Figure 4.1 shows the spontaneous polarization directions in this
ferroelectric rhombohedral crystal (the coordinate axis is based on a cubic perovskite
axis). The samples obtained were cut and electrically poled along the [001] and [011]
directions, as shown in Figure 4.2. For each of the crystal orientations and vibrations as
shown in Figure 2, un-doped as well as 1mol% Mn-doped and In-doped samples were
fabricated.

Figure 4.1: Equivalent spontaneous polarization vectors of a
crystal. The coordinate axes are based on cubic perovskite phase (not a rhombohedral
ferrolelectric phase).
1: Equivalent spontaneous polarization vectors of a ferroelectric rhombohedral PMN
crystal. The coordinate axes are based on cubic perovskite phase (not a rhombohedral
32
ferroelectric rhombohedral PMN-PT
crystal. The coordinate axes are based on cubic perovskite phase (not a rhombohedral

33
Figure 4.2: Single Crystal Sample Orientation. Electrodes are shaded.
4.2 Experimental Procedure
Generally used equations for the determination of the mechanical quality factor of a
k31 mode plate sample, as described in the IEEE standards [6], is obtained by the
determination of the minimum impedance (Zm) at the fundamental resonance frequency.
Qm is given by the relation,
−+=
2
22
10 )(21
B
ABmA
m f
ffCCZf
Qπ
(4.1)
[001]
[100]
[010] 12x4x4 mm3
[011]
[010] 12x4x4 mm3
]110[]110[
1]1[0
[100]
[100]
[011]
[011]
[001]
[100] [010]
17x3x1 mm3
17x3x1 mm3
17x3x1 mm3

34
where,
fA = fundamental resonance frequency,
fB = anti-resonance frequency,
C0= shunt capacitance of the sample,
C1= series capacitance of the sample.
Note that Equation (4.1) is true only when Qm’s for the resonance and
antiresonance modes are the same, which does not happen in practical piezoelectrics. We
reported the mechanical quality factor for resonance (QA) is higher than the mechanical
quality factor for antiresonance (QB) in most of the cases in the previous paper [8], and
the relationship between QA and QB can be provided by
)'tan2'tan'(tan
)1
(1
211
22
31
31
θφδ −+
Ω−+
+=
bAB k
k
(4.2)
.
where tanδ’, tanφ’ and tanθ’ represent “intensive” dielectric, elastic and
piezoelectric loss factors, respectively.
Another way of obtaining the quality factor is based on the frequency difference
between two frequencies corresponding to the 3 dB below the resonance peak of
resonance as well as anti-resonance peak. In piezoelectric materials, there exists
resonance and anti-resonance exist as shown in Figure 4.3, which can be roughly
understood as electrical short circuit condition and the latter at electrical open circuit
condition respectively. The impedance curves were measured using HP4294 Impedance
analyzer with an oscillation level of 0.5V.

35
30 40 50 60 70 80
10
100
1k
10k
100k
Frequency (kHz)
Imp
ed
an
ce
(O
hm
)
-80
-40
0
40
80
Ph
ase
(de
g)
Figure 4.3: Impedance curve of PMN-PT [011] with length in [0-11] direction (17x3x1 mm3)
piezoelectric material showing resonance and anti-resonance
Taking a narrow frequencies range close to the resonance and anti-resonance we can
define the resonance quality factor (QA) and the anti-resonance quality factor (QB) as
shown in Equation (4.3).
2121
,BB
BB
AA
AA
ff
fQ
ff
fQ
−=
−=
(4.3)
where, (fA1 – fA2) or (fB1 – fB2), is the 3 dB bandwidth of the impedance curve.
The electromechanical coupling factors k31 and k33 were obtained using the
following equations defined in the IEEE standards:.
−
=
B
A
B
AB
A
f
f
f
ff
fk
2tan
2
1
2
231
ππ
π
(4.4)
Resonance
Anti-Resonance

36
=
B
A
B
A
f
f
f
fk
2cot
2
233
ππ
(4.5)
4.3 Results and Discussion
In this section, we summarize the properties of the single crystal samples. Figure
4.4 shows the measured quality factor and electromechanical coupling factor for the 31-
vibration mode. Here, Qm is calculated using Equation (4.3), QA is calculated using
Equation (4.1) and k31 is calculated using Equation (4.4) above. Note that in the
horizontal axis of the figure, the notation PMN-PT [001] L[100] means that the length of
the k31 plate is cut along [100] axis. In Figure 4.5, the quality factor at anti-resonance is
shown.

37
PM
N-P
T [001
]
PM
N-P
T [011
] L[1
00]
PMN-P
T [011
] L[0
-10]
In-P
MN-P
T [001
]
In-P
MN-P
T [011
] L[1
00]
In-P
MN-P
T [011
] L[0
-10]
Mn-
PM
N-P
T [001
]
Mn-
PM
N-P
T [011
] L[1
00]
Mn-
PM
N-P
T [011
] L[0
-10] --
-200
-100
0
100
200
300
400 Q
A
Qm
Qu
alit
y F
acto
r
0.0
0.4
0.8
1.2
1.6
2.0
k31
k3
1
Figure 4.4: Mechanical quality factor and electromechanical coupling factor for 31- vibration
mode.
QA
Qm
k31

38
PM
N-P
T [001]
PM
N-P
T [011
] L[1
00]
PM
N-P
T [011] L
[0-1
0]
In-P
MN-P
T [001]
In-P
MN-P
T [011] L
[100]
In-P
MN-P
T [011]
L[0
-10]
Mn-P
MN-P
T [001]
Mn-P
MN-P
T [011] L
[100]
Mn-P
MN-P
T [011] L
[0-1
0]--
0
200
400
600
800
1000
1200
Qu
alit
y F
acto
r
Figure 4.5: Anti-resonance mechanical quality factor for the 31- vibration mode.
Note that QB seems to be 1.3 – 2 times higher than QA in these single crystals,
which concludes that the piezoelectric loss seems to be quite high compared with the
dielectric and elastic losses; i.e., 2 tan θ’ > (tan δ’ + tan φ’) in Equation (4.2).
Similarly, Figure 4.6 shows the mechanical quality factor and the electromechanical
coupling factor for the k33 vibration mode. For the k33 vibration mode, the anti-
resonance quality factor was not obtained experimentally, because the impedance of the
k33 rod was higher than the dynamic range of the HP4194 impedance analyzer.
Therefore, accurate and reproducible results could not be obtained in the k33 vibration
mode at anti-resonance.
QB

39
PM
N-P
T [001]
PM
N-P
T [011]
In-P
MN
-PT [0
01]
In-P
MN-P
T [011]
Mn-P
MN
-PT [0
01]
Mn-P
MN
-PT [0
11]
Fe-PM
N-P
T [001]
Fe-PM
N-P
T [011]
--
100
200
300
400
500
600
700
800
900
1000
Qua
lity F
acto
r
0.2
0.4
0.6
0.8
1.0
1.2
k33
Figure 4.6: Mechanical quality factor and electromechanical coupling factor for the 33 - vibration
mode.
4.3.1 Effect of Vibration mode
Table 4.1 compares the quality factor at resonance QA for the 33- and 31-
vibration modes of the PMN-PT single crystals and PZT ceramics. It is clear that a large
difference in quality factors exists for the two vibration modes. The 33- vibration mode
QA is almost twice that of the 31-mode. Table 1 also includes the QA values for the 33-
and 31- vibration modes of the PZT polycrystalline samples as reference, which do not
show a significant difference between these two modes.
QA
k33

40
4.3.2 Effect of Crystal Orientation
Figure 4.7 compares the resonance quality factor for the 31- and 33- vibration
modes as a function of crystal orientation and doping. The crystal orientation effect on
the quality factor of k33 and k31 mode is not pronounced.
[001] [011]-L[100] [011]-L[0-10]
100
150
200
250
300
350
Qu
alit
y F
acto
r
[001] [011]
200
250
300
350
400
450
500
550
Qu
alit
y F
acto
r
(a) (b)
Table 4.1: Effect of vibration mode on quality factor
Quality Factor, QA 33-mode 31-mode
PMN-PT [001] 330 146
In-PMN-PT [001] 270 113
Mn-PMN-PT [001] 516 240
‘Hard’ PZT (APC841) 1126 1183
‘Soft’ PZT (APC850) 100 75
Mn-Doped
In-Doped
Un-Doped
Mn-Doped
In-Doped
Un-Doped
41
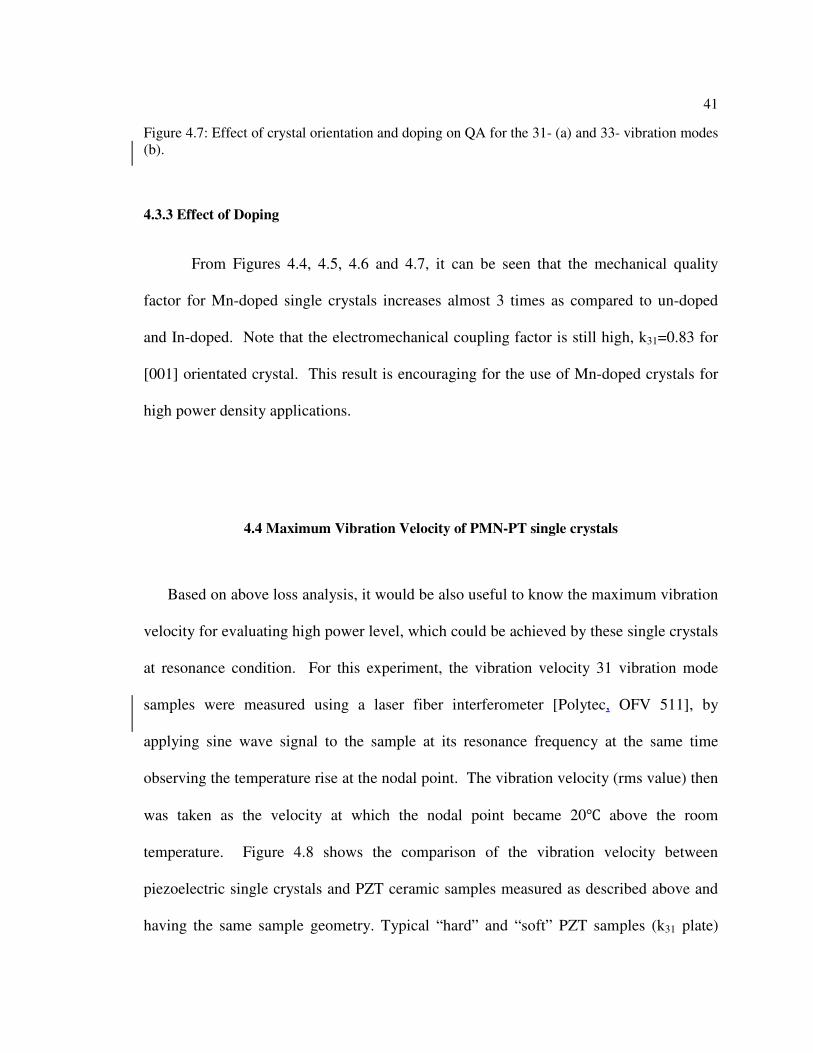
Figure 4.7: Effect of crystal orientation and doping on QA for the 31- (a) and 33- vibration modes
(b).
4.3.3 Effect of Doping
From Figures 4.4, 4.5, 4.6 and 4.7, it can be seen that the mechanical quality
factor for Mn-doped single crystals increases almost 3 times as compared to un-doped
and In-doped. Note that the electromechanical coupling factor is still high, k31=0.83 for
[001] orientated crystal. This result is encouraging for the use of Mn-doped crystals for
high power density applications.
4.4 Maximum Vibration Velocity of PMN-PT single crystals
Based on above loss analysis, it would be also useful to know the maximum vibration
velocity for evaluating high power level, which could be achieved by these single crystals
at resonance condition. For this experiment, the vibration velocity 31 vibration mode
samples were measured using a laser fiber interferometer [Polytec, OFV 511], by
applying sine wave signal to the sample at its resonance frequency at the same time
observing the temperature rise at the nodal point. The vibration velocity (rms value) then
was taken as the velocity at which the nodal point became 20 above the room
temperature. Figure 4.8 shows the comparison of the vibration velocity between
piezoelectric single crystals and PZT ceramic samples measured as described above and
having the same sample geometry. Typical “hard” and “soft” PZT samples (k31 plate)

42
exhibit the maximum vibration velocities (rms value), 0.6 m/s and 0.15 m/s, respectively,
while the PMN-PT crystals exhibit the intermediate values.
Figure 4.8: Vibration velocity of piezoelectric single crystals and ceramics.
The properties of PMN-PT single crystals doped with Mn with respect to the
vibration velocity, as well as the loss properties described in the previous section,
indicate that it is a semi-‘hard’ material with high piezoelectric constant and
electromechanical coupling which is a good sign for high power applications.
0
0.1
0.2
0.3
0.4
0.5
0.6
0.7
Vib
rati
on
Ve
loci
ty (
m/s
ec)
‘Hard’ Ceramic
‘Soft’ Ceramic

43
References
1. J. Kuwata, K. Uchino and S. Nomura, “Dielectric and Piezoelectric Properties of
0.91Pb (Zn1/3Nb2/3)O3-0.09PbTiO3 Single Crystals”, Jpn. J. Appl. Phys., Part 1,
21, 1298 (1982).
2. S.-E. Park, T.R. Shrout, “Characteristics of Relaxor-Based Piezoelectric Single
Crystals for Ultrasonic Transducers”, IEEE Trans. UFFC, 44, 1140-1147 (1997).
3. X.-H. Du, J. Zheng, U. Belegundu and K. Uchino, “Crystal Orientation
Dependance of Piezoelectric Properties of Lead Zirconate Titanate near the
Morphotropic Phase Boundary”, Appl. Phys. Lett., 72, 2421, (1998)
4. S. Priya, K. Uchino, “Dielectric and Piezoelectric Properties of Mn-substituted
PZN-PT Single Crystal”, J. Appl. Phys., 91, 4515, (2002)
5. H.-Y.Lee, “Development of High-Performance Piezoelectric Single Crystals by
using Solid-State Single Crystal Growth (SSCG) Method”, in Zuo-Guang Ye,
Handbook of dielectric, piezoelectric and ferroelectric materials: Synthesis,
properties and applications, (pp. 158-172), Cambridge, England: Woodhead
Publishing Ltd. (2008)
6. S. Zhang, S.-M. Lee, D.-H. Kim, H.-Y. Lee and T.R. Shrout, “Elastic,
Piezoelectric and Dielectric Properties of 0.71Pb(Mn1/3Nb2/3)O3-0.29PbTiO3
Crystals Obtained by Solid-State Crystal Growth”, J. American Ceramic Society,
91, 683-686, (2008)
7. IEEE Standard on Piezoelectricity, Std. 176, (1987)

44
8 Y. Zhuang, S.O. Ural, A. Rajapurkar, S. Tuncdemir, A. Amin and K. Uchino:
How to derive piezoelectric loss factors from admittance spectrum of
piezoelectric materials, submitted to Jpn. J. Appl. Phys, (2008).

45
Chapter 5
Conclusions
Loss in PZT Piezoelectric Ceramics
In this thesis, the losses in piezoelectric ceramics are described in terms of the quality
factor defined at resonance (QA) and anti-resonance (QB). Recommendation has been
made for the sample holder based on the natural vibration direction of the piezoelectric
sample. Theoretical derivation for the anti-resonance quality factor is discussed. Results
of Q values for ‘hard’ and ‘soft’ piezoelectric ceramic in k33 and k31 vibration modes
were presented at low power as well as high power. Thus it is recommended to use anti-
resonance frequency drive for driving in high power density applications like ultrasonic
motors.
Loss in PMN-PT Single Crystals
In this paper, the loss properties of PMN-PT single crystals as a function of vibration
mode, crystal orientation, and doping was discussed. It is observed that, the 33- vibration mode
has a higher quality factor than the 31- mode. Besides, crystals orientation has no pronounced
effect on the quality factor. Mn-doping significantly increased the quality factor of PMN-PT
single crystals. Mn-doped single crystals exhibited ‘semi-hard’ loss properties while maintaining
high electromechanical coupling, making them a promising candidate for high power density
applications. In this research, we studied the properties for one particular dimension in each of
the k33 and the k31 modes. It should be noted that the mechanical quality factor and other
properties will change in PMN-PT relaxor ferroelectrics depending on the frequency.

Appendix A
Piezoelectric Constitutive equations
The commonly used variables to describe the state of a piezoelectric material are the
stress X, strain x, electric field E and electric polarization P (or dielectric displacement D). We
can express each electromechanical pair of the quantities in terms of others which gives the
piezoelectric constitutive equations:
EexcX E ′−= (A.1)
ExeD xE ε+= (A.2)
DhxcX D ′−= (A.3)
DhxE xβ+−= (A.4)
EdXsx E ′+= (A.5)
EdXD Xε+= (A.6)
DgXsx D ′+= (A.7)
DgXE Xβ+−= (A.8)

Bibliography
1. R. Holland: IEEE Trans. Sonics and Ultrasonics, 14, (1967) 18.
2. K. Uchino and S. Hirose: IEEE Trans. UFFC, 48, (2001) No. 1.
3. T. Ikeda: Ohm Publication, Tokyo (1984).
4. B. Jaffe, W.R. Cook, and H. Jaffe: Academic Press, London, (1971).
5. IEEE Standard on Piezoelectricity, Std. 176, (1987).
6. IRE Standard on Piezoelectric Crystals, v 46, (1958).
7. K. Uchino: Micromectronics, Marcell Dekker Publication, New York (2002).
8. A.V. Mezheritky: Quality Factor of Piezoceramics, Ferroelectrics, 266, (2002)
277.
9. A.V. Mezheritsky: IEEE UFFC, 4, (2002) 484.
10. S. Hirose, M. Aoygi, Y. Tomikawa, S. Takahashi and K. Uchino: High power
characteristics at anti-resonance frequency of piezoelectric transducers,
Ultrasonics, 34, (1996) 213.
11. S.O. Ural, S. Tuncdemir, K. Uchino: Proc. Actuator 2008.
12. Y. Zhuang, S.O. Ural, A. Rajapurkar, S. Tuncdemir, A. Amin and K. Uchino:
submitted to Jpn. J. Appl. Phys.
13. J. Kuwata, K. Uchino and S. Nomura, “Dielectric and Piezoelectric Properties of
0.91Pb (Zn1/3Nb2/3)O3-0.09PbTiO3 Single Crystals”, Jpn. J. Appl. Phys., Part 1,
21, 1298 (1982).

48
14. S.-E. Park, T.R. Shrout, “Characteristics of Relaxor-Based Piezoelectric Single
Crystals for Ultrasonic Transducers”, IEEE Trans. UFFC, 44, 1140-1147 (1997).
15. X.-H. Du, J. Zheng, U. Belegunduand K. Uchino, “Crystal Orientation
Dependance of Piezoelectric Properties of Lead Zirconate Titanate near the
Morphotropic Phase Boundary”, Appl. Phys. Lett., 72, 2421, (1998)
16. S. Priya, K. Uchino, “Dielectric and Piezoelectric Properties of Mn-substituted
PZN-PT Single Crystal”, J. Appl. Phys., 91, 4515, (2002)
17. M.-S. Kim, J.G.Fisher, S.-J.Kang, H.-Y.Lee, “Grain Growth Control and Solid
State Crystal Growth by Li2)/PbO Addition and Dislocation Introduction in the
PMN-35PT System”, J. American Ceramic Society, 89, 1237-1243 (2006).
18. S. Zhang, S.-M. Lee, D.-H. Kim, H.-Y. Lee and T.R. Shrout, “Elastic,
Piezoelectric and Dielectric Properties of 0.71Pb(Mn1/3Nb2/3)O3-0.29PbTiO3
Crystals Obtained by Solid-State Crystal Growth”, J. American Ceramic Society,
91, 683-686, (2008).

49
Vita
Aditya Rajapurkar received a Bachelor of Engineering degree in Electrical Engineering
from the Maharaja Sayajirao University of Baroda, India in October 2006. This thesis is part of
the requirements for his Master’s degree in Electrical Engineering with an emphasis on
piezoelectric materials, actuators and transducers. Following is a list of publications, conference
proceedings and presentations in his research area.
Publications
• A. Rajapurkar, S. O. Ural, S-H. Park, Y. Zhuang and K. Uchino: “Loss
Mechanisms in piezoelectric PZT ceramics”, submitted to Jpn. J. of Appl. Phys.
(2008).
• A. Rajapurkar, S. O. Ural, H.-Y. Lee, A. Amin and K. Uchino: “Piezoelectric loss
performance of PMN-PT Single Crystals”, submitted to J. of Electroceramics
(2008).
Conference Proceedings
• A. Rajapurkar, Y. Zhuang, S. O. Ural, S-H. Park and K. Uchino, in Proceedings
of the 11th
International Conference on New Actuators, Actuator 08, Bremen,
Germany, (pp. 538-541), (2008).
Presentations
• A. Rajapurkar, S. O. Ural, H-Y Lee, A. Amin and K. Uchino, “Loss Performance
of PMN-PT Single Crystals”, US Navy Workshop on Acoustic Transduction
Materials and Devices 2008, State College, PA, (2008).

50
• A. Rajapurkar, S.O. Ural, Y. Zhuang, S-H. Park and K. Uchino, “Loss
Mechanisms in Piezoelectric PZT Ceramics”, US Navy Workshop on Acoustic
Transduction Materials and Devices 2008, State College, PA, (2008).
• A. Rajapurkar, S.O. Ural, S-H. Park, N. Bhattacharya and K. Uchino,
“Anisotropic Loss Mechanisms in Piezoelectric Ceramics”, Material Science and
Technology 2007, Detroit, MI, Sept 16-20 (2007).
• A. Rajapurkar, S.O. Ural, S-H. Park, N. Bhattacharya and K. Uchino, “Loss
Mechanisms in Piezoelectric Ceramics”, 50th
ICAT/JTTAS Smart Actuator
Symposium, University Park, PA, Oct 9-10, (2007).
• A. Rajapurkar, S.O. Ural, S-H. Park, N. Bhattacharya and K. Uchino,
“Anisotropic Loss Mechanisms in Piezoelectric Ceramics”, Material Science and
Technology 2007, Detroit, MI, Sept 16-20 (2007).
• A. Rajapurkar, S.O. Ural, S-H. Park, N. Bhattacharya and K. Uchino,
“Anisotropic Loss Mechanisms in Piezoelectric Ceramics”, US Navy Workshop
on Acoustic transduction materials and Devices 2007, State College, PA, (2007).