Embed Size (px)
Citation preview

PROPELLER PERFORMANCE MEASUREMENT FOR LOW REYNOLDS
NUMBER UNMANNED AERIAL VEHICLE APPLICATIONS
A Thesis by
Monal Pankaj Merchant
B.S., Wichita State University, 2004
Submitted to the College of Engineering and the faculty of the Graduate School of
Wichita State University in partial fulfillment of
the requirement for the degree of Master of Science
December 2005

PROPELLER PERFORMANCE MEASUREMENT FOR LOW REYNOLDS
NUMBER UNMANNED AERIAL VEHICLE APPLICATIONS
I have examined the final copy of this thesis for form and content and recommend that it be accepted in partial fulfillment of the requirements for the degree of Master of Science with a major in Aerospace Engineering __________________________________________ Dr. L. Scott Miller, Committee Chair We have read this thesis And recommend its acceptance: ___________________________________________ Dr. Klaus A. Hoffmann, Committee Member ___________________________________________ Dr. David N. Koert, Committee Member
ii

DEDICATION
To Mum and Dad:
For their constant support, help and understanding
iii

Determination, Dedication, Devotion and Discipline are the four necessary
ingredients for success…
iv

ACKNOWLEDGEMENTS
I thank the department of Aerospace Engineering, Wichita State University, for
their support. I would specially like to acknowledge the help extended by Philip
Butler and Joshua Nelson, in and towards this effort. Last, but not least, a special
thanks to my supervisor, advisor and mentor, Dr. L. Scott Miller for all his
support, advice and encouragement throughout my undergraduate and graduate
years; I do not have enough words to thank you!
v
ABSTRACT
The recent increase in the development of UAV’s and MAV’s has created a
strong demand for small propeller performance data. Propeller performance is
critical to the success of these aircraft and guaranteed performance demands
accurate experimental data. These propellers operate at low Reynolds numbers
(between 30,000 and 300,000), rendering performance scaling from larger
counterparts inaccurate. An Integrated Propulsion Test System has been
designed, developed and validated at Wichita State University to accurately and
reliably measure performance of small propellers. Performance of a large
number of propellers has been charted and a database of performance data has
been created. This thesis discusses the salient features of this measurement
system and data for a few of the, over 30 propellers, charted.
vi

TABLE OF CONTENTS
Chapters Page
1.0 INTRODUCTION ............................................................................................ 1 1.1 General Background ................................................................................... 1 1.2 Importance of Propeller Performance Data................................................. 2 1.3 Existing Problems ....................................................................................... 2 1.4 Goals........................................................................................................... 4
2.0 EXPERIMENTAL APPARATUS ..................................................................... 5
2.1 Measurement System Overview ................................................................. 5 2.2 Propeller Balance Fixture............................................................................ 6 2.3 Signal Conditioners..................................................................................... 7 2.4 Data Acquisition and Reduction .................................................................. 8 2.5 The Facility.................................................................................................. 9 2.6 Propeller Selection.................................................................................... 10
2.6.1 A Brief Note on Propeller Nomenclature ......................................... 11 3.0 EXPERIMENTAL PROCEDURE .................................................................. 12
3.1 Test Procedure ......................................................................................... 12 3.2 Uncertainty and Sensitivity Analysis ......................................................... 13 3.3 System Calibration.................................................................................... 14 3.4 Variables and Performance Parameters ................................................... 16 3.5 Data Acquisition and Reduction System ................................................... 19
4.0 RESULTS AND DISCUSSION ..................................................................... 22
4.1 System and Procedure Validation............................................................. 22 4.2 System Sensitivity ..................................................................................... 24 4.3 Data Quality and Repeatability.................................................................. 25 4.4 Observations – Issue with propeller manafacturability .............................. 29 4.5 Sample Output File ................................................................................... 31 4.6 Some Selected Results............................................................................. 32 4.6 Observation and Discussion ..................................................................... 35
4.6.1 A brief note on Performance calculators ......................................... 36 5.0 CONCLUSIONS ........................................................................................... 38 6.0 RECOMMENDATIONS ................................................................................ 40 LIST OF REFERENCES .................................................................................... 43
vii

LIST OF TABLES
Table Page
Table 1: Instrumentation accuracies at a glance ................................................ 14 Table 2: Table of measured variables with units................................................. 17 Table 3: Data reduction program sample output table........................................ 32
viii
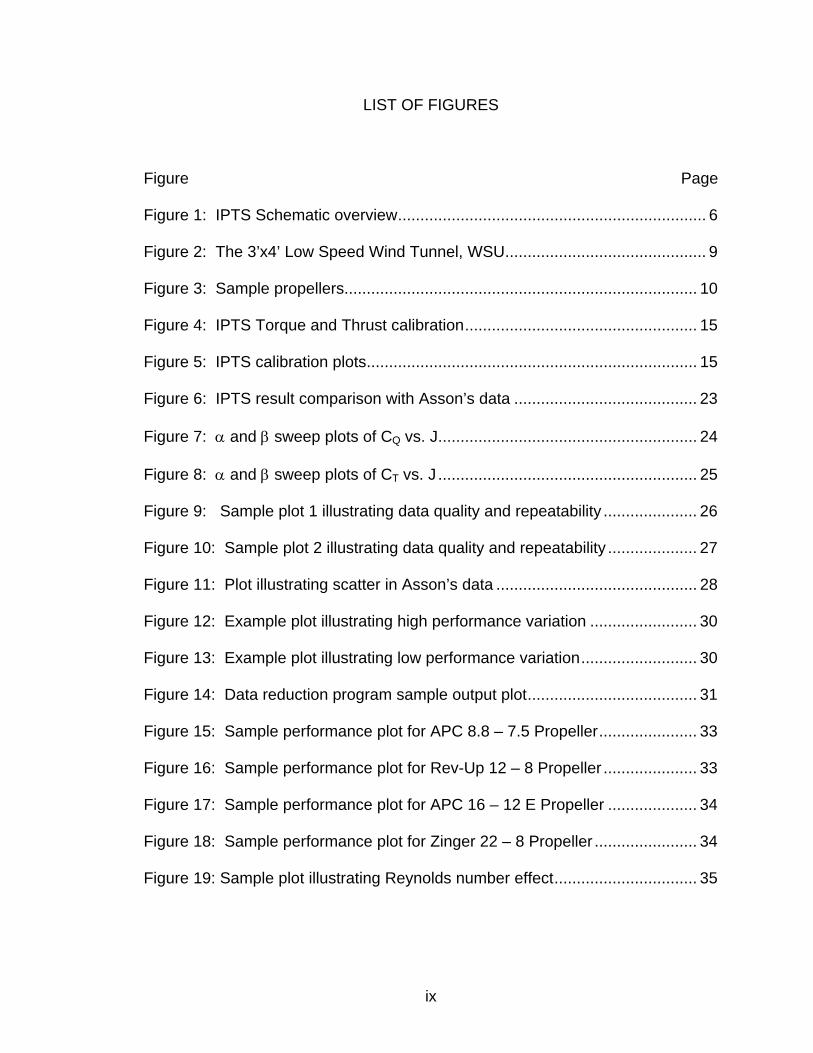
LIST OF FIGURES
Figure Page
Figure 1: IPTS Schematic overview..................................................................... 6 Figure 2: The 3’x4’ Low Speed Wind Tunnel, WSU............................................. 9 Figure 3: Sample propellers............................................................................... 10 Figure 4: IPTS Torque and Thrust calibration.................................................... 15 Figure 5: IPTS calibration plots.......................................................................... 15 Figure 6: IPTS result comparison with Asson’s data ......................................... 23 Figure 7: α and β sweep plots of CQ vs. J.......................................................... 24 Figure 8: α and β sweep plots of CT vs. J .......................................................... 25 Figure 9: Sample plot 1 illustrating data quality and repeatability ..................... 26 Figure 10: Sample plot 2 illustrating data quality and repeatability .................... 27 Figure 11: Plot illustrating scatter in Asson’s data ............................................. 28 Figure 12: Example plot illustrating high performance variation ........................ 30 Figure 13: Example plot illustrating low performance variation.......................... 30 Figure 14: Data reduction program sample output plot...................................... 31 Figure 15: Sample performance plot for APC 8.8 – 7.5 Propeller...................... 33 Figure 16: Sample performance plot for Rev-Up 12 – 8 Propeller ..................... 33 Figure 17: Sample performance plot for APC 16 – 12 E Propeller .................... 34 Figure 18: Sample performance plot for Zinger 22 – 8 Propeller ....................... 34 Figure 19: Sample plot illustrating Reynolds number effect................................ 35
ix

LIST OF SYMBOLS
Symbol
Equation
Unit
α
Angle of Attack
degree
A2D
Analog-to-Digital
AIAA
American Institute of Aeronautics and Astronautics
AP
Propeller disc area
ft2
β
Yaw angle
degree
C
Jet cross-section area
ft2
C0.75
Blade Chord Length (75% radius location)
ft
CP
Power Coefficient 53 Dn
PC p
P ⋅⋅=
ρ
CQ
Torque Coefficient 52 Dn
QCQ ⋅⋅=
ρ
CT
Thrust Coefficient 42 Dn
TCT ⋅⋅=
ρ
D
Propeller Diameter
ft
DC
Direct Current
ηP
Propeller Efficiency
P
Tp C
CJ ⋅=η
i
Current in amperes
a
J
Advance Ratio Dn
UJ⋅
′=
MAV
Micro Air Vehicle
n
Revolutions Per Second 60
RPMn =
p
Pressure (Atmospheric)
lb/ft2
x

PP
Propeller Power output
QPp ⋅Ω=
Watt
Q
Dynamic Pressure (Tunnel)
lb/ft2
Q
Torque
ft-lb
ρ
Density
slug/ft3
R Gas Constant
R/C
Radio Control
Re0.75
Reynolds Number (Refered to blade chord at 75% radius)
µρ 75.0
75.0ReCU t ⋅⋅
=
RPM
Revolutions Per Minute
T
Thrust
lb
Tt
Temperature
°R
U
Uncorrected Velocity
ft/s
U'
Corrected Velocity ⎟
⎟⎠
⎞⎜⎜⎝
⎛
⋅+⋅
⋅−⋅=′
4
14
2121
τατUU
ft/s
Ut
Tangential Velocity
ft/s
UAV
Unmanned Aerial Vehicle
v
Volt
v
Ω
Radians per Second
WOZ
Wind-Off Zero
WSU
Wichita State University
xi

CHAPTER 1
1.0 INTRODUCTION
1.1 General Background
The development of Unmanned Aerial Vehicles (UAV’s) and interest in Micro
Aerial Vehicles (MAV’s) has increased over the last decade. These few years
have also witnessed an ever-increasing number of radio controlled (R/C) airplane
hobbyists and amateur R/C airplane designers. The hobby of flying R/C airplanes
is slowly turning into a professional sport with the increasing number of
competitions not only encouraging the hobbyist to modify off-the-shelf scale
designs but also stimulating interest amongst engineering students in
universities, challenging them to design mission specific R/C aircrafts.
Performance data for a large number of propellers, used in conventional
sized aircraft has been charted and cataloged. This helps engineers select the
appropriate propeller for a given aircraft or optimize a current propeller design to
suite a specific mission requirement. The smallest propellers previously charted
are generally close to four feet in diameter, operate at high RPM, and relatively
high forward speeds, thereby high operating Reynolds numbers. Unlike these,
the propellers used for UAV’s, MAV’s or model R/C aircrafts, are generally of
diameters less than two feet. Although they may operate at relatively high RPM,
their operating Reynolds numbers are very low, normally less than 300,000,
primarily due to small chord lengths and relatively low forward speeds. Since the
operating Reynolds number affects the magnitude of drag due to skin friction and
1
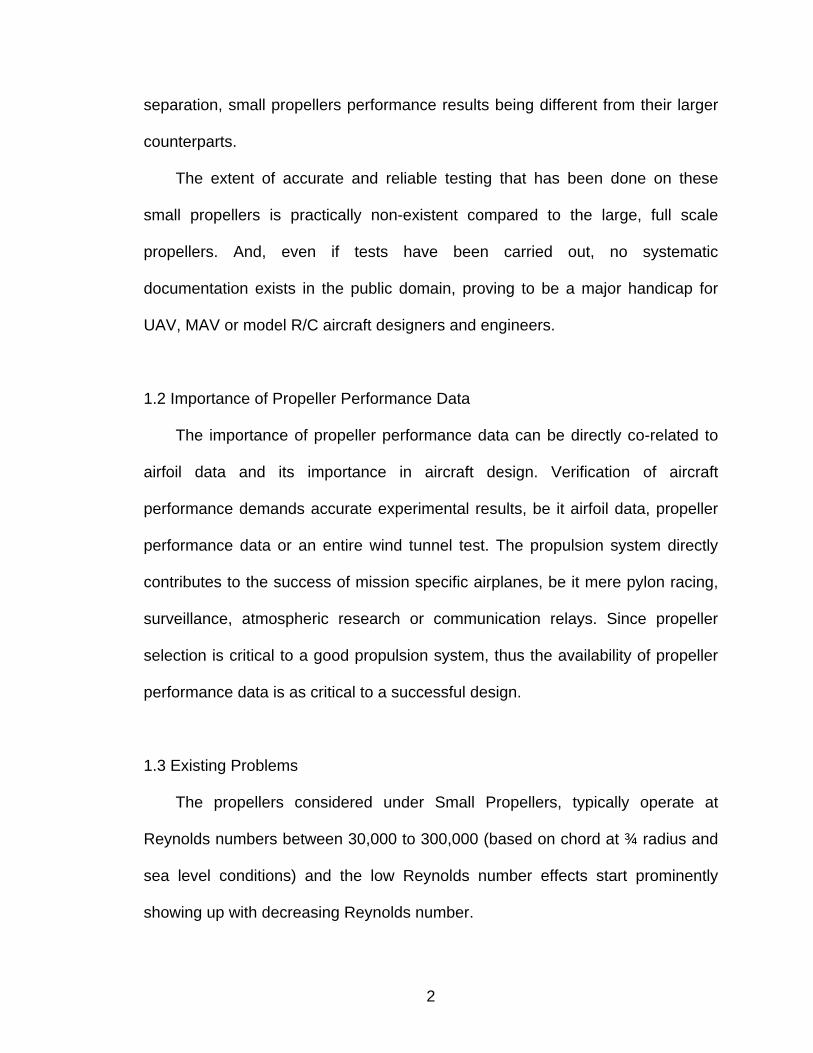
separation, small propellers performance results being different from their larger
counterparts.
The extent of accurate and reliable testing that has been done on these
small propellers is practically non-existent compared to the large, full scale
propellers. And, even if tests have been carried out, no systematic
documentation exists in the public domain, proving to be a major handicap for
UAV, MAV or model R/C aircraft designers and engineers.
1.2 Importance of Propeller Performance Data
The importance of propeller performance data can be directly co-related to
airfoil data and its importance in aircraft design. Verification of aircraft
performance demands accurate experimental results, be it airfoil data, propeller
performance data or an entire wind tunnel test. The propulsion system directly
contributes to the success of mission specific airplanes, be it mere pylon racing,
surveillance, atmospheric research or communication relays. Since propeller
selection is critical to a good propulsion system, thus the availability of propeller
performance data is as critical to a successful design.
1.3 Existing Problems
The propellers considered under Small Propellers, typically operate at
Reynolds numbers between 30,000 to 300,000 (based on chord at ¾ radius and
sea level conditions) and the low Reynolds number effects start prominently
showing up with decreasing Reynolds number.
2
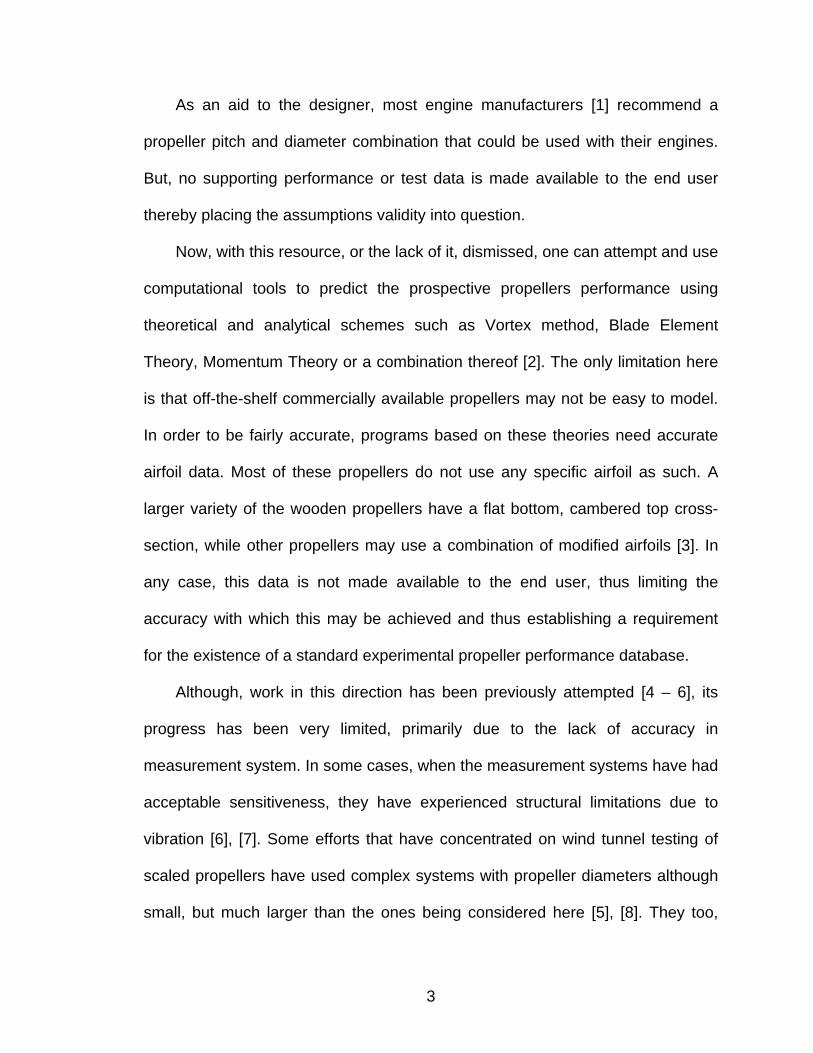
As an aid to the designer, most engine manufacturers [1] recommend a
propeller pitch and diameter combination that could be used with their engines.
But, no supporting performance or test data is made available to the end user
thereby placing the assumptions validity into question.
Now, with this resource, or the lack of it, dismissed, one can attempt and use
computational tools to predict the prospective propellers performance using
theoretical and analytical schemes such as Vortex method, Blade Element
Theory, Momentum Theory or a combination thereof [2]. The only limitation here
is that off-the-shelf commercially available propellers may not be easy to model.
In order to be fairly accurate, programs based on these theories need accurate
airfoil data. Most of these propellers do not use any specific airfoil as such. A
larger variety of the wooden propellers have a flat bottom, cambered top cross-
section, while other propellers may use a combination of modified airfoils [3]. In
any case, this data is not made available to the end user, thus limiting the
accuracy with which this may be achieved and thus establishing a requirement
for the existence of a standard experimental propeller performance database.
Although, work in this direction has been previously attempted [4 – 6], its
progress has been very limited, primarily due to the lack of accuracy in
measurement system. In some cases, when the measurement systems have had
acceptable sensitiveness, they have experienced structural limitations due to
vibration [6], [7]. Some efforts that have concentrated on wind tunnel testing of
scaled propellers have used complex systems with propeller diameters although
small, but much larger than the ones being considered here [5], [8]. They too,
3

have acknowledged the difficulties faced when entering the Reynolds number
regimes considered here.
Lastly, measurement systems used for marine propellers of similar diameter
have existed [9], but their adaptation to aircraft propellers has not been
successfully carried out, primarily due to the lack of system sensitivity.
1.4 Goals
The growing development in UAV’s, MAV’s scaled and R/C airplanes
translate to extensive use of scaled or small diameter propellers and therefore,
creates a strong demand for the availability of crucial propeller performance data.
This reason and the other shortcomings mentioned above, have served as
the motivation to design and develop an accurate measurement system, that is
sufficiently sensitive, highly repeatable and caters to propeller performance
measurements for diameter ranges from 6 inches to 22 inches, operating in the
30,000 to 300,000 Reynolds number regime, and create a reliable propeller
performance database to serve as an aid to designers and hobbyists for propeller
selection.
A measurement system, using precision components has been designed,
developed and tested at Wichita State University. This thesis discusses the
measurement system’s traits and salient features, its design, testing, results
obtained and some interesting observations that were made in this process.
4

CHAPTER 2
2.0 EXPERIMENTAL APPARATUS
Integrated Propulsion Test System
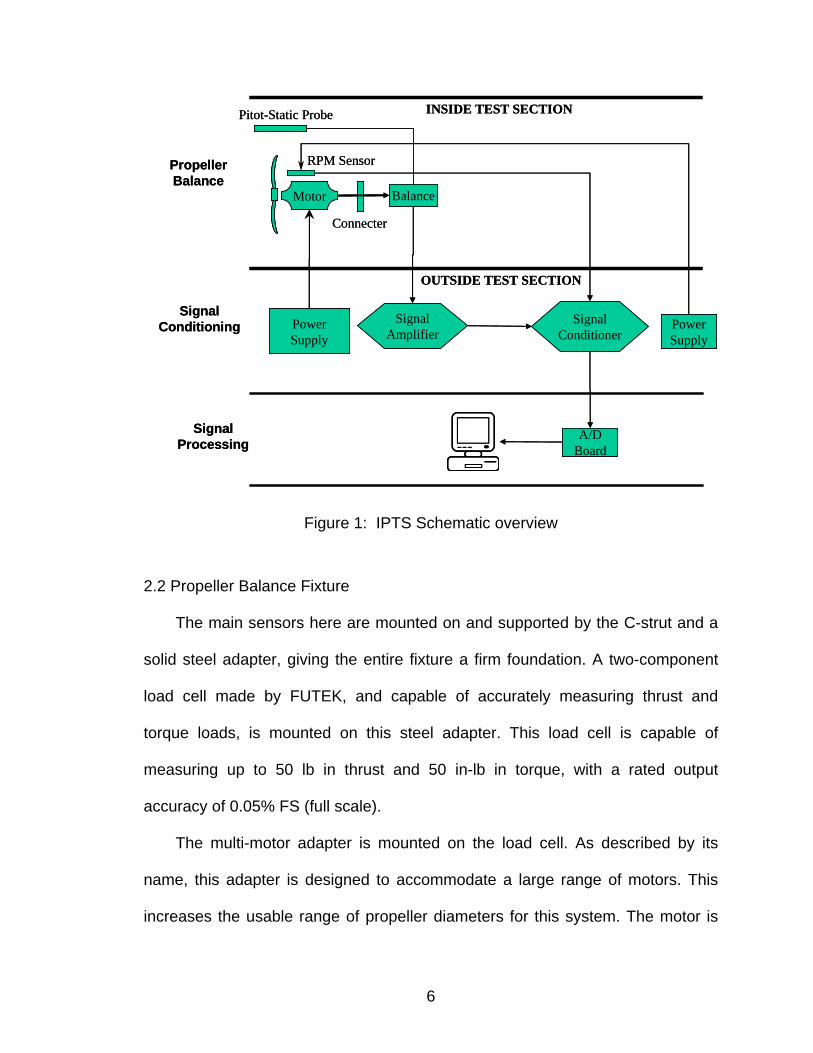
2.1 Measurement System Overview
The measurement system developed here can be divided into three sub-
systems, namely, the Propeller Balance (sensor platform), Signal Conditioners
and the Data Acquisition system (signal processing). Each sub-system
comprises of electronic instrumentation and components as shown in the
schematic in Figure 1, and is discussed below.
The propeller balance fixture is located inside the 3’ x 4’ wind tunnels test
section. It includes the wind tunnel C-strut, the balance mount and balance, a
multi-motor adapter, an electric motor, the RPM sensor, tunnel air data sensor
and the propeller. This connects to the Signal Conditioners, external to the wind
tunnel test section. The Signal Conditioners comprise of power supplies, terminal
box, multi-module signal amplifier and an array of optical isolators. Lastly, signal
processing is accomplished by the Data Acquisition and Reduction sub-system.
This sub-system encompasses a screw terminal, the A2D card, the computer
and software.
5
Balance
Signal Amplifier
Signal Conditioner
Power Supply
Power Supply
A/D Board
Motor
INSIDE TEST SECTION
OUTSIDE TEST SECTION
Connecter
RPM SensorPropeller Balance
Signal Conditioning
Signal Processing
Pitot-Static Probe
Balance
Signal Amplifier
Signal Conditioner
Power Supply
Power Supply
A/D Board
Motor
INSIDE TEST SECTION
OUTSIDE TEST SECTION
Connecter
RPM SensorPropeller Balance
Signal Conditioning
Signal Processing
Pitot-Static Probe
Figure 1: IPTS Schematic overview
2.2 Propeller Balance Fixture
The main sensors here are mounted on and supported by the C-strut and a
solid steel adapter, giving the entire fixture a firm foundation. A two-component
load cell made by FUTEK, and capable of accurately measuring thrust and
torque loads, is mounted on this steel adapter. This load cell is capable of
measuring up to 50 lb in thrust and 50 in-lb in torque, with a rated output
accuracy of 0.05% FS (full scale).
The multi-motor adapter is mounted on the load cell. As described by its
name, this adapter is designed to accommodate a large range of motors. This
increases the usable range of propeller diameters for this system. The motor is
6
mounted on this adapter. To date, three motors, all belonging to the Astroflight
Cobalt motor family [1] have been used with this system.
The propeller RPM is measured by a Dynapar Series 54ZT Magnetic Pickup.
The pickup is capable of measuring a maximum of 20,000 targets/s. This unit
requires a magnetic target to be placed within 0.03 inches, in order to record its
pass. This is accomplished by placing a steel tab behind the propeller near the
hub. The output from this is a square waveform, which is converted to RPM
readout through the data acquisition program which is discussed in detail in the
following sections.
The wind tunnel’s dynamic pressure or Tunnel q, is measured using a pitot-
static probe, which is connected to a high precision 1-psid Honeywell Precision
Transducer, rated at 0.05% FS accuracy. The signal output from this transducer
along with outputs from all the other sensors mentioned here, are processed
through the Signal Conditioners, described below.
2.3 Signal Conditioners
The signal conditioning sub-system is located outside the wind tunnel test
section, but within three feet of all the sensors, so as to maintain the signal
quality. A home-built enclosed screw terminal serves as a hub to segregate
power and signal wires and connect them to the respective amplifiers.
Signal amplification and partial signal conditioning is accomplished using a
multi-module Vishay-Ellis 2210 strain-gauge amplifier. This unit provides a very
precise gain and filter setting and a hassle free signal zeroing. Post amplification,
7

the partially conditioned signals are processed through an array of Pepperl-
Fuchs KFDX-DCV optical signal isolators. Thus, eliminating ground loops from
the signals before they are processed by the Data acquisition and reduction sub-
system.
Power to the motor and the RPM sensor is provided by two independent
DC power supplies. A generic 15 volt power supply powers the RPM sensor,
while a precision High wattage HP6032A Power Supply is used to precisely
control power to the motor.
2.4 Data Acquisition and Reduction
Data acquisition is accomplished using a 16-bit Measurement Computing
16/16 DAS A2D PC Card in conjunction with a Pentium-4 laptop. The data is
collected and reduced using a self-authored visual basic program that writes the
data directly to an excel spreadsheet. This program automates the data reduction
and archiving process and is capable of configuring the A2D board. The data
reduction routine applies calibrations and accounts for propeller blockage
corrections due to the spinning propeller in a closed throat wind tunnel. Non-
dimentionalized propeller performance plots and a summarized performance
tables are automatically generated and archived by this program.
8
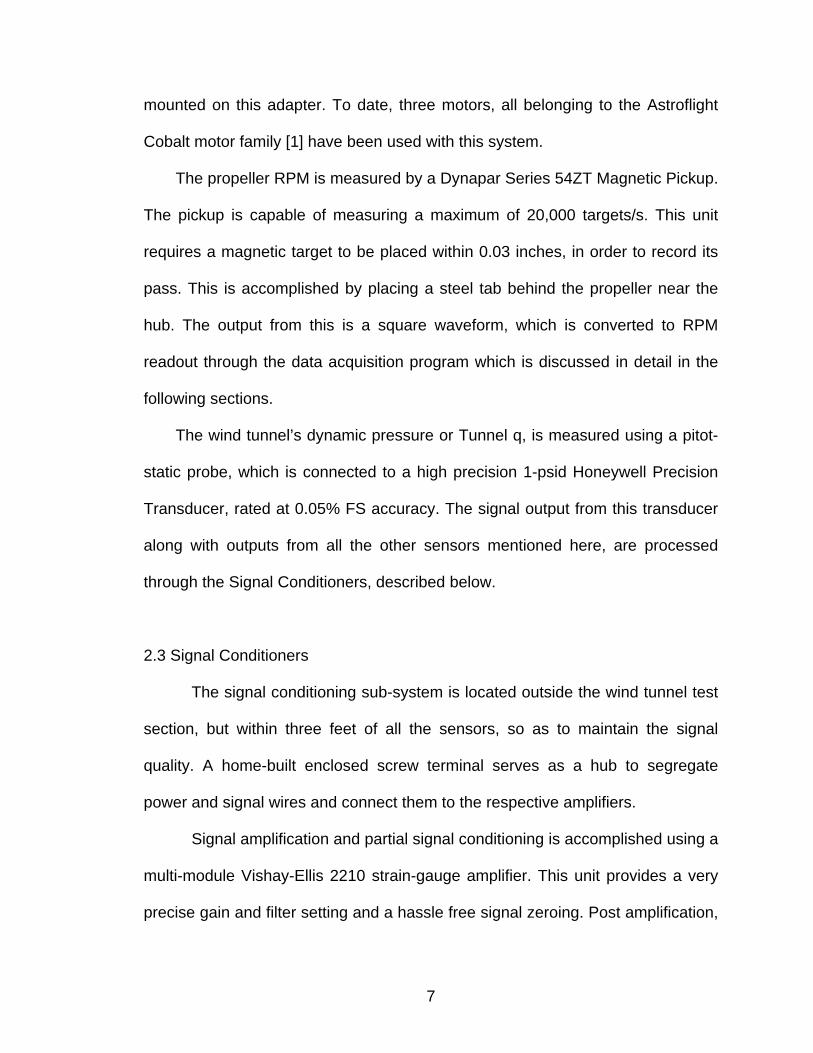
2.5 The Facility
The 3 ft x 4 ft Low Speed Wind Tunnel (Figure 2) at Wichita State University
is an open return wind tunnel with a 3 ft x 4 ft test section. The tunnel is equipped
for force and pressure measurements and is capable of achieving speeds up to
180 ft/s.
Figure 2: The 3’x4’ Low Speed Wind Tunnel, WSU
9

2.6 Propeller Selection
The ability of this system to accommodate multiple motors, allows a large
diameter range of propellers that can be tested. To date the propellers selection
has been based on specific test requirements, described in the following
sections, and to encompass the general range of diameters, for demonstration
purposes.
Although any propellers within the diameter range from 6 inches to 22 inches
can be tested, the propellers that have been tested (Figure 3) so far were
selected to cover a wide range of diameter, pitch and type. The selection and
classification is described in the following sections.
Figure 3: Sample propellers
10

2.6.1 A Brief Note on Propeller Nomenclature
The nomenclature for propellers used in this thesis is consistent with the
standard nomenclature [10] as used by model airplane propeller manufacturers.
The propeller name generally has a string of number with a dash or an x
separating it from another number. The first number after the propeller company
name indicates the propeller diameter in inches. The second number that follows
is separated by either a ‘– ‘or ‘x ‘indicates the propeller pitch in inches [11].
The pitch, here, is defined as the distance in inches a propeller would travel
in one revolution. Any letters that follows this string of numbers is a code
signifying the particular propellers specialty. For example,
Zinger 22 – 8 describes the propeller to have a 22 inch diameter and 8 inch
pitch. And APC12 – 12 E describes the propeller to have a 12 inch diameter with
a 12 inch pitch, and the letter E is a code classifying the propeller specially
designed to be used with electric motors [3].
It is recommended that the user refer to the manufacturer’s documentation
to interpret this last letter.
11

CHAPTER 3
3.0 EXPERIMENTAL PROCEDURE
3.1 Test Procedure
During the design phase of the experiment, it was found that either the RPM
or the forward velocity, or both needed to be varied, to vary the advance ratio in
order to map the complete performance curves. Although various combinations
of RPM and velocity were tried, varying the tunnel-q was found most effective
and this procedure was also similar to the flight settings on a typical R/C airplane,
i.e. most R/C airplanes are generally flown at full throttle settings. Thus, it was
deemed important to select the tunnel-q step sizes in a manner that not only
covered primarily the propeller efficiency curves entire regime for the entire range
of propellers considered here, but also ensured that the resolution was varied in
an appropriate manner. A program based on Combined Blade Element and
Momentum Theory [2] was written for this purpose and used to select the
required tunnel-q step sizes.
In the above process, the motor is operated at constant power (maximum
power) at various tunnel speeds. This power is limited by the maximum
continuous operation current and voltage specified by the motor manufacturer
[1]. This limit is easily enforced by setting the ‘never exceed’ limits on current and
voltage outputs on the power supply.
WOZ readings are taken during the start and end of each run and the
average WOZ values are tared from the collected data.
12
The procedure for collecting data begins with executing the data acquisition
and reduction program. The signal conditioning equipment is zeroed and WOZ
readings taken. This is followed by powering the motor to conditions mentioned
above and collecting data for each pre-determined ‘q’ step. Once the data is
collected, the data reduction sub-routine is executed. The collected data is then
systematically reduced, recorded, plotted and archived.
Due to complete automation of this process, the overall time required for an
entire run is just the physical tunnel run time.
3.2 Uncertainty and Sensitivity Analysis
Sensitivity and uncertainty analysis [12], [13] were performed prior to the
experimental setup and throughout the apparatus development. The
Kline-McClintok [12] method has been used to perform uncertainty analysis on all
variables.
The Kline-McClintok method is based on careful specification of
uncertainties in various primary experimental measurements. Uncertainties of the
measured variables are taken and used to compute the uncertainties in the
calculated result using Equation 3.2.1 [13], where R is the result, wR is the
uncertainty in the result, xn are the dependant variables and wn are the
uncertainties associated to those dependant variables.
2/122
22
2
11
...⎥⎥⎦
⎤
⎢⎢⎣
⎡⎟⎟⎠
⎞⎜⎜⎝
⎛∂∂
++⎟⎟⎠
⎞⎜⎜⎝
⎛∂∂
+⎟⎟⎠
⎞⎜⎜⎝
⎛∂∂
= nn
R wxRw
xRw
xRw (3.2.1)
13

The instrument accuracy, as stated in the documents provided by the
respective manufacturers is given in Table 1. For all the other non-dimensional
performance parameters, since their quantified accuracy depends on each
individual data point, their typical values have been provided in the following
section.
TABLE 1: INSTRUMENTATION ACCURACIES AT A GLANCE
Instrument Measured Quantity Unit Accuracy (Rated Output)
Load Cell Thrust lb ±0.05% Torque In-lb ±0.05% Pressure Transducer Test section Dynamic
Pressure lb/ft2 ±0.05%
Magnetic Pickup RPM RPM ±0.001% (Based on Algorithm)
Experimental apparatus sensitivity has also been tested by performing α and
β sweep of ±3°. This helped determine the apparatus sensitivity to the propeller
disc plane orientation. These results are further discussed in the results and
discussion section.
3.3 System Calibration
Before using the IPTS for any tests, each measuring instrument has been
calibrated.
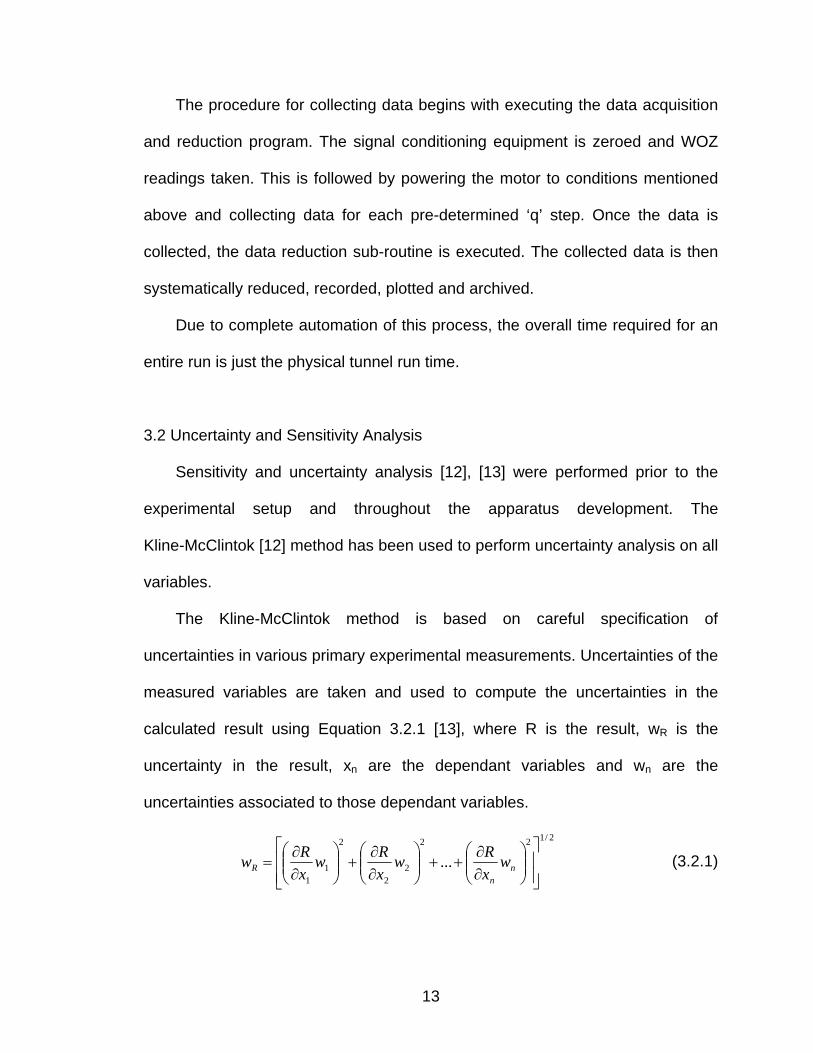
The Load cell is calibrated insitu, using calibrated weights. A special
calibration apparatus, shown in Figure 4, that applies pure thrust and torque
loads, was specially designed for this purpose.
14
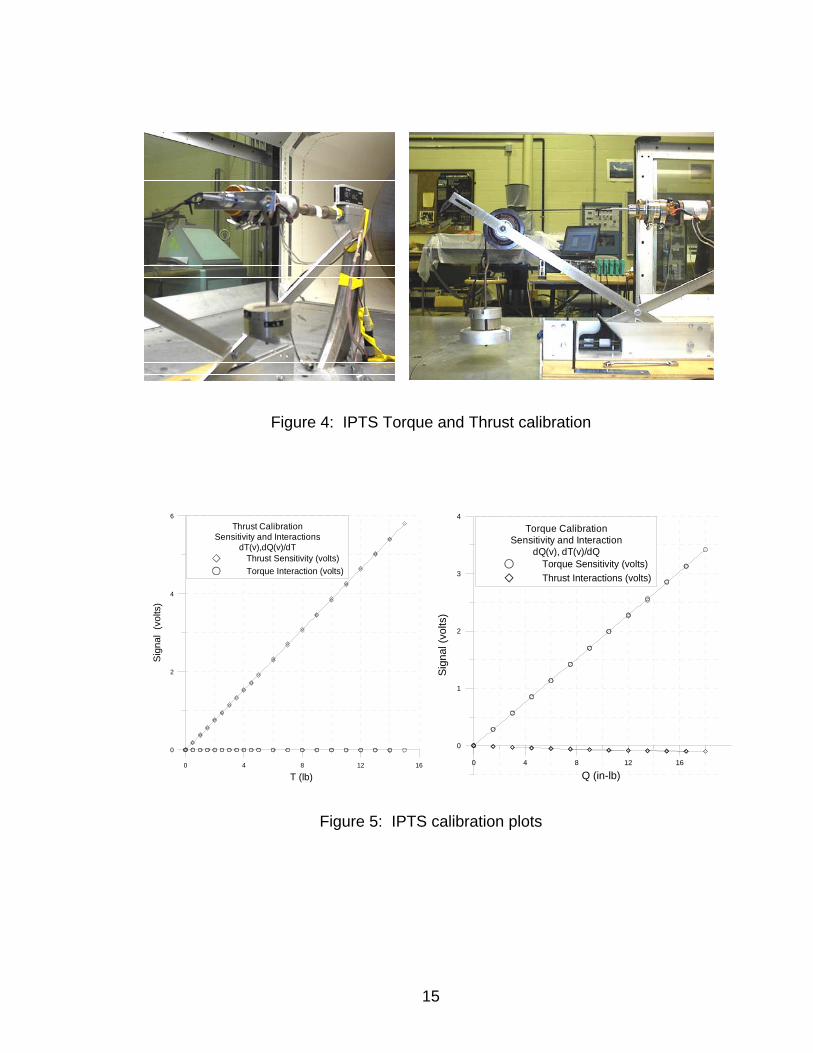
Figure 4: IPTS Torque and Thrust calibration
0 4 8 12 16
T (lb)
0
2
4
6
Sig
nal
(vol
ts)
Thrust CalibrationSensitivity and Interactions
dT(v),dQ(v)/dTThrust Sensitivity (volts)Torque Interaction (volts)
0 4 8 12 16
Q (in-lb)
0
1
2
3
4
Sign
al (v
olts
)
Torque CalibrationSensitivity and Interaction
dQ(v), dT(v)/dQTorque Sensitivity (volts)Thrust Interactions (volts)
Figure 5: IPTS calibration plots
15
Calibration is later verified using check-loads. Pure and combined check
loads are repeatedly applied to verify balance calibration. The balance behavior
is found to be very linear in sensitivities and minimal interactions are observed
due to each channel, as can be seen in Figure 5. These are accounted for in the
final balance behavior matrix [14].
Although the RPM indicator does not need any calibration, its readings are
verified using a calibrated strobe light and are further examined by measuring the
frequency using a multimeter. The algorithm developed for the purpose of
measuring the magnetic pickups signal and converting them to RPM, has also
been checked against the multimeter for flawless operation.
The algorithm, described in the following section, is a simple formulation that
counts the number of positive slopes that occur in the magnetic pickup signal
over the sample period, average them over a second and convert them to RPM.
The tunnel’s dynamic pressure measurement transducer has been
calibrated using a manometer. The calibration constant obtained matched the
previous values used in the tunnel constants.
3.4 Variables and Performance Parameters
As mentioned previously, variables were divided into two categories,
namely measured variables and calculated variables. The measured variables,
are the dimensionalized variables that are directly measured from the various
instruments. For calculating the non-dimensionalized performance parameters
[15], more variables, dependant on the measured variables have been
16
calculated, and have thus been classified here as calculated variables. The
measured variables along with their units have been shown in Table 2 below.
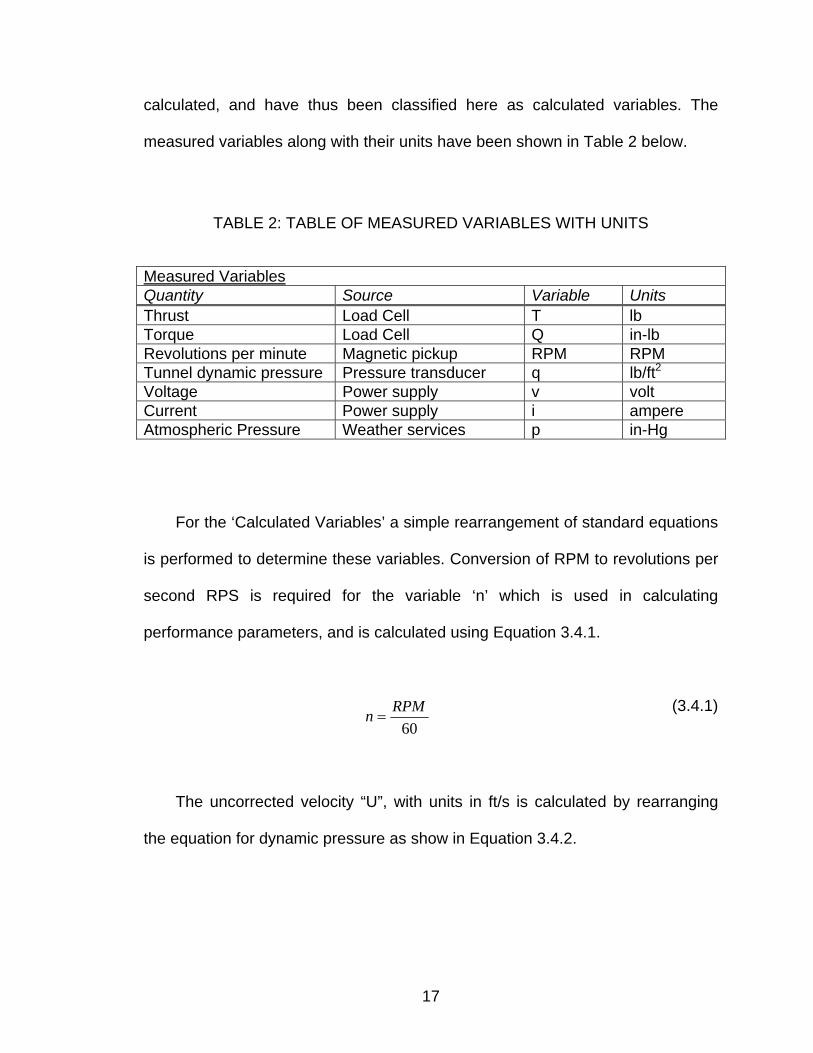
TABLE 2: TABLE OF MEASURED VARIABLES WITH UNITS
Measured VariablesQuantity Source Variable Units Thrust Load Cell T lb Torque Load Cell Q in-lb Revolutions per minute Magnetic pickup RPM RPM Tunnel dynamic pressure Pressure transducer q lb/ft2Voltage Power supply v volt Current Power supply i ampere Atmospheric Pressure Weather services p in-Hg
For the ‘Calculated Variables’ a simple rearrangement of standard equations
is performed to determine these variables. Conversion of RPM to revolutions per
second RPS is required for the variable ‘n’ which is used in calculating
performance parameters, and is calculated using Equation 3.4.1.
60RPMn = (3.4.1)
The uncorrected velocity “U”, with units in ft/s is calculated by rearranging
the equation for dynamic pressure as show in Equation 3.4.2.
17
ρqU ⋅
=2
(3.4.2)
The method and equation used to determine the corrected velocity “U” is
given by Equation 3.5.1 and the method is described in the following section.
The power produced by the propeller Pp, with units in watts (Equation 3.4.3),
is calculated using the equation given by Seddon [2], where Ω is in radians per
second.
QPp ⋅Ω= or ⎟⎠⎞
⎜⎝⎛⋅⎟
⎠⎞
⎜⎝⎛ ⋅=
12602 QRPMPpπ
(3.4.3)
And finally, the last variable belonging to the ‘Calculated Variables’ class,
density ‘ρ’, with units in slugs/ft3, has been calculated by rearranging the
standard pressure equality as shown in Equation 3.4.4, where pressure is in
lb/ft2, R is the gas constant and temperature ‘Tt’ is in degree-Rankin.
tTRp⋅
=ρ (3.4.4)
Standard propulsion equations have been used to calculate non-
dimensionalized performance parameters. Amongst these are coefficients for
thrust (3.4.5), torque (3.4.6), power (3.4.7) and the propeller efficiency (3.4.8).
Forward velocity, propeller RPM and diameter were combined into Advance
18
Ratio parameter (3.4.9). And, due to the nature of experiments, the Reynolds
number (3.4.10) at 3/4th radius location was also calculated for each datapoint.
42 DnTCT ⋅⋅
=ρ
(3.4.5)
52 DnQCQ ⋅⋅
=ρ
(3.4.6)
53 DnP
C pP ⋅⋅
=ρ
(3.4.7)
P
Tp C
CJ ⋅=η or p
p PU ′⋅
=τη
(3.4.8)
DnUJ⋅
′= (3.4.9)
µρ 75.0
75.0ReCUt ⋅⋅
= (3.4.10)
3.5 Data Acquisition and Reduction System
The data acquisition and reduction program are written in Visual Basic for
Applications (VBA) language, and embedded into MS Excel. The data acquisition
program conFigures the A2D card and directly writes the output, as raw voltages,
to the opened excel sheet.
19
The A2D card configuration, although optional, is preset for a sample rate of
5,000 Hz per channel with a sample period of 8 s. These values are based on the
sensitivity studies performed for magnetic pickup and the load cell. The program
uses these pre-set values, but also provides the user the option for changing
them before initiating data acquisition.
The data reduction routine calculates the averages for all the signals, and
converts them into respective engineering units. A special algorithm has been
developed and is used to calculate propeller RPM form the magnetic pickup
voltage readouts.
The program requires the user to input some basic information with
regards to the propeller geometry, ambient temperature and temperature data,
and the necessary file paths.
Other corrections that are required due to testing in the wind tunnel
environment, such as solid blockage [14] and, especially for this experiment,
propeller blockage corrections [14], [16] have been considered. Since uncertainty
due to solid blockage is less than 0.3% for all cases, it has been ignored. On the
other hand, since we are testing propellers in a closed-throat wind tunnel,
propeller blockage corrections, or corrections due to the continuity effect, as
described by Glauert [16], have been incorporated into the program. The
correction for velocity is as given by Equation 3.5.1.
⎟⎟⎠
⎞⎜⎜⎝
⎛
⋅+⋅⋅
−⋅=′4
14
2121
τατUU
(3.5.1)
20

where,
24 UAT
P ⋅⋅=
ρτ (3.5.2)
CAP=1α
(3.5.3)
Although the change in velocities, due to this effect is still less than 3%, the
corrections, nonetheless have been incorporated in order to increase the overall
accuracy.
21

CHAPTER 4
4.0 RESULTS AND DISCUSSION
A wide range of propellers, spanning the diameter range stated in the goals
have been tested to date, and a number of runs have been completed with more
propellers being constantly added to the inventory. Since all the results cannot be
shown here, only a few representative results have been shown for the purpose
of illustration. A website is currently being developed, and will host propeller
performance data for propellers being tested at this facility using IPTS. Follow-on
publications are also planed for future.
4.1 System and Procedure Validation
The first few test runs were aimed towards testing the measurement
systems accuracy, verifying its repeatability and checking the overall data quality.
To establish confidence in procedure, first few experiments were designed
similar to those conducted by Asson [6], [7]. Information needed for this purpose,
such as tunnel-q, and data points collected, were backed out from performance
plots in Asson’s thesis [7]. Asson conducted his test runs at fairly low tunnel-q’s
and the RPM was also limited to 3,000, as his apparatus had vibrational issues.
The propellers used here were the 14-4, 14-6 and the 16-6 propellers belonging
to the Zinger family.
The comparative results with Asson’s run for the Zinger 16-6 propeller are
shown in Figure 6 below.
22

0 0.2 0.4 0.6 0.8 1
J
0
0.2
0.4
0.6
0.8
1
η PGeneral Data Comparison
Zinger 16-6 Performance Plots3'x4' Wind Tunnel - Wichita State University ©
M2
EfficiencyAsson's Run - EfficiencyCTAsson's Run - CTCQAsson's Run - CQ
0
0.04
0.08
0.12
0.16
0.2
CT
0
0.004
0.008
0.012
0.016
0.02
CQ
Figure 6: IPTS result comparison with Asson’s data [7]
As can be observed in Figure 6, data collected by the Integrated Propulsion
Test System matches that of Asson’s experiment [7]. Similar results were
observed for the other propellers.
One important point that should be noted here is that all these runs were
conducted at very low RPM, forward velocities (or low q’s) and Reynolds
numbers range around 100,000 in order to match Asson’s run conditions [6]. The
flow in the test section at speeds around 40 ft/s (Tunnel q approximately 1.9
23
lb/ft2), is relatively unsteady, not to mention the propeller being operated at less
than half of its expected RPM, decreases the applied loads considerably, thereby
increasing the variation in data.
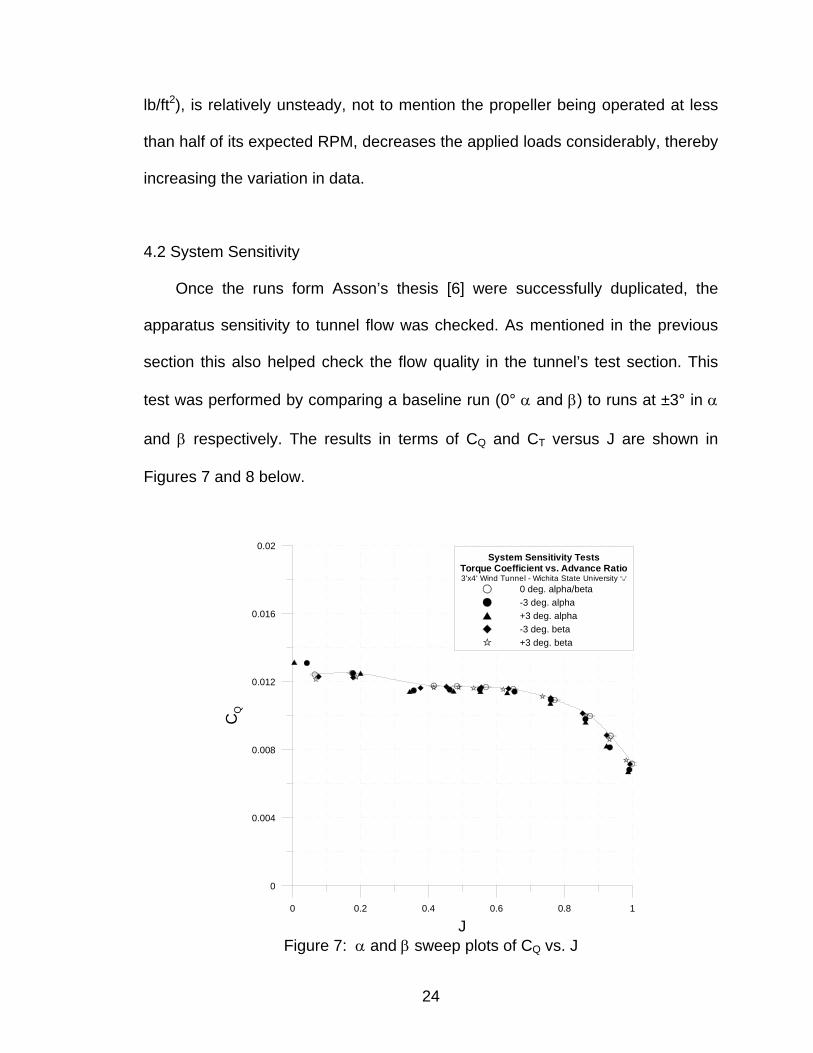
4.2 System Sensitivity
Once the runs form Asson’s thesis [6] were successfully duplicated, the
apparatus sensitivity to tunnel flow was checked. As mentioned in the previous
section this also helped check the flow quality in the tunnel’s test section. This
test was performed by comparing a baseline run (0° α and β) to runs at ±3° in α
and β respectively. The results in terms of CQ and CT versus J are shown in
Figures 7 and 8 below.
0 0.2 0.4 0.6 0.8 1
J
0
0.004
0.008
0.012
0.016
0.02
CQ
System Sensitivity TestsTorque Coefficient vs. Advance Ratio3'x4' Wind Tunnel - Wichita State University ©
M2
0 deg. alpha/beta-3 deg. alpha+3 deg. alpha-3 deg. beta+3 deg. beta
Figure 7: α and β sweep plots of CQ vs. J
24
0 0.2 0.4 0.6 0.8 1
J
0
0.04
0.08
0.12
0.16
0.2
CT
System Sensitivity TestsThrust Coefficient vs. Advance Ratio3'x4' Wind Tunnel - Wichita State University ©
M2
0 deg. alpha/beta (Baseline)-3 deg. alpha+3 deg. alpha-3 deg. beta+3 deg. beta
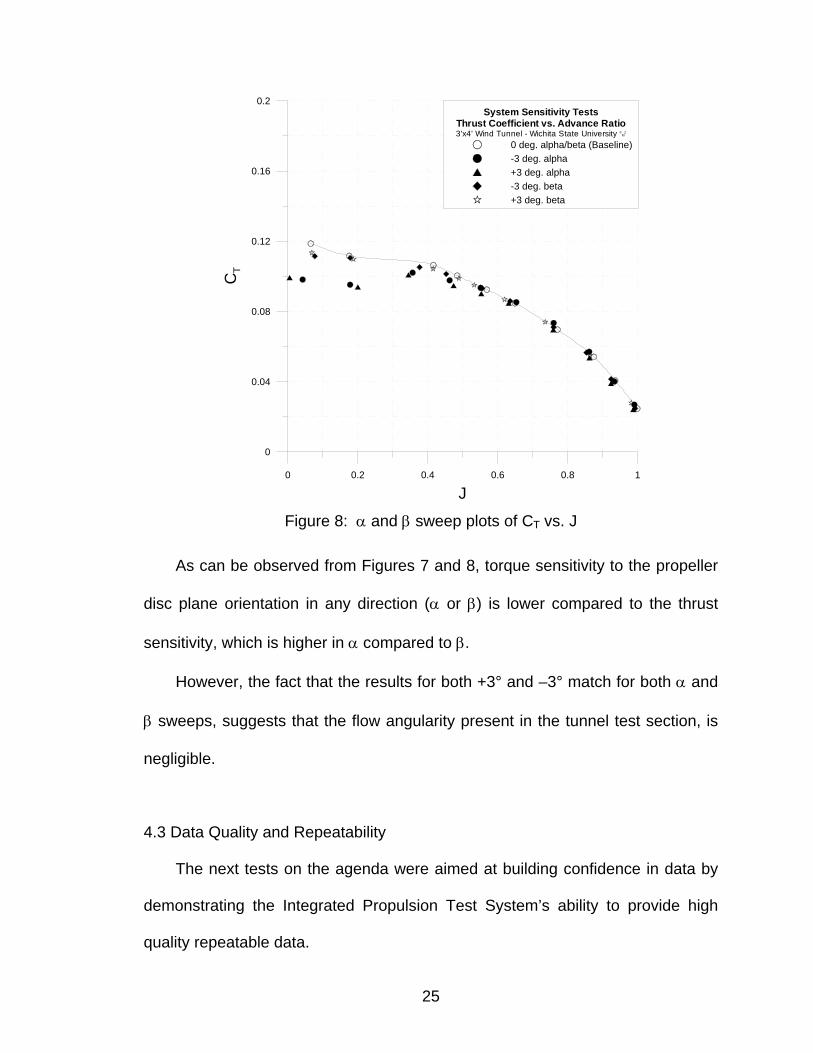
Figure 8: α and β sweep plots of CT vs. J
As can be observed from Figures 7 and 8, torque sensitivity to the propeller
disc plane orientation in any direction (α or β) is lower compared to the thrust
sensitivity, which is higher in α compared to β.
However, the fact that the results for both +3° and –3° match for both α and
β sweeps, suggests that the flow angularity present in the tunnel test section, is
negligible.
4.3 Data Quality and Repeatability
The next tests on the agenda were aimed at building confidence in data by
demonstrating the Integrated Propulsion Test System’s ability to provide high
quality repeatable data.
25
It should be noted here that repeat runs are performed for all propellers that
are tested here, and are conducted on different days.
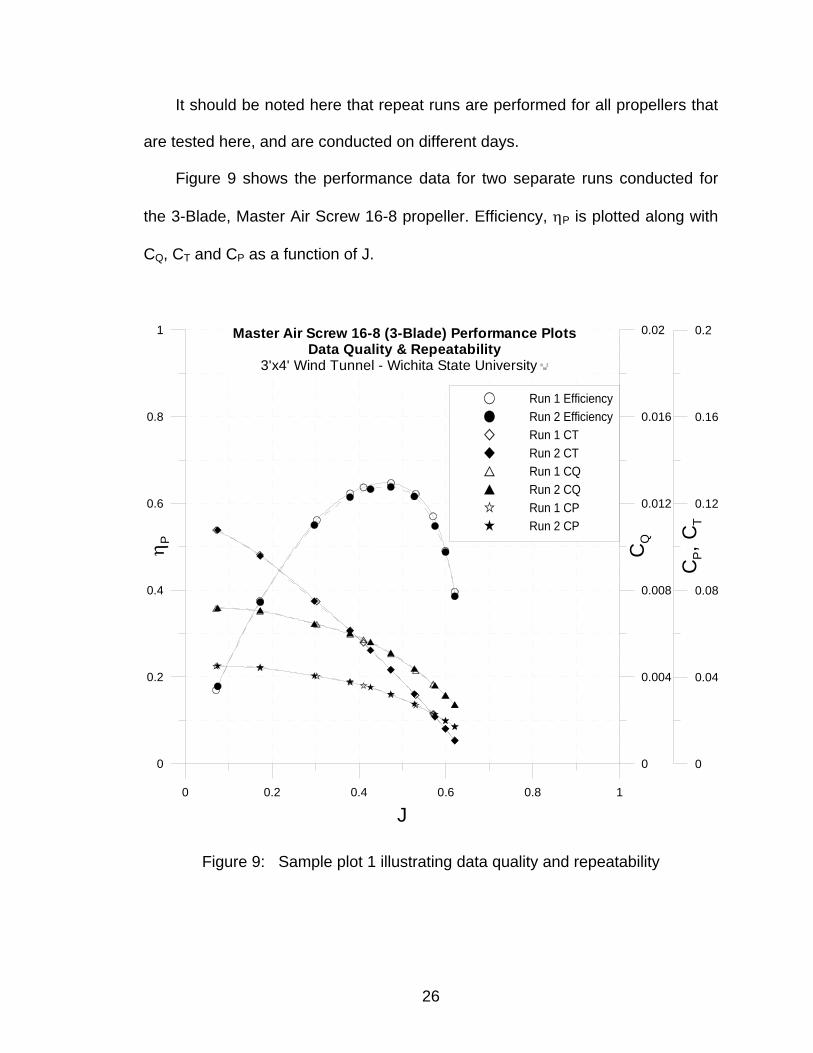
Figure 9 shows the performance data for two separate runs conducted for
the 3-Blade, Master Air Screw 16-8 propeller. Efficiency, ηP is plotted along with
CQ, CT and CP as a function of J.
0 0.2 0.4 0.6 0.8 1
J
0
0.2
0.4
0.6
0.8
1
η P
Run 1 EfficiencyRun 2 EfficiencyRun 1 CTRun 2 CTRun 1 CQRun 2 CQRun 1 CPRun 2 CP
0
0.004
0.008
0.012
0.016
0.02
CQ
0
0.04
0.08
0.12
0.16
0.2
CP, C
T
Master Air Screw 16-8 (3-Blade) Performance PlotsData Quality & Repeatability
3'x4' Wind Tunnel - Wichita State University ©M
2
Figure 9: Sample plot 1 illustrating data quality and repeatability
26
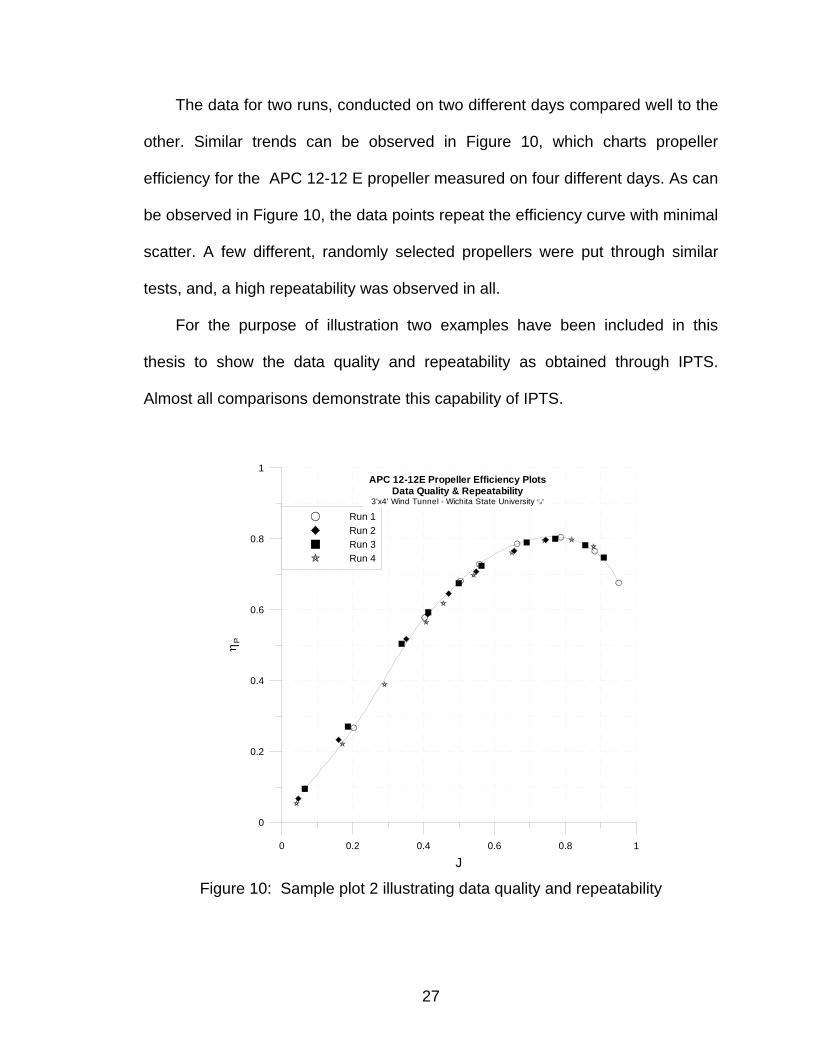
The data for two runs, conducted on two different days compared well to the
other. Similar trends can be observed in Figure 10, which charts propeller
efficiency for the APC 12-12 E propeller measured on four different days. As can
be observed in Figure 10, the data points repeat the efficiency curve with minimal
scatter. A few different, randomly selected propellers were put through similar
tests, and, a high repeatability was observed in all.
For the purpose of illustration two examples have been included in this
thesis to show the data quality and repeatability as obtained through IPTS.
Almost all comparisons demonstrate this capability of IPTS.
0 0.2 0.4 0.6 0.8 1
J
0
0.2
0.4
0.6
0.8
1
ηP
Run 1Run 2Run 3Run 4
APC 12-12E Propeller Efficiency PlotsData Quality & Repeatability
3'x4' Wind Tunnel - Wichita State University ©M
2
Figure 10: Sample plot 2 illustrating data quality and repeatability
27
0 0.2 0.4 0.6 0.8
J
0
0.2
0.4
0.6
0.8
η P
Asson's Data ScatterEfficiency Run-1Efficiency Run-2
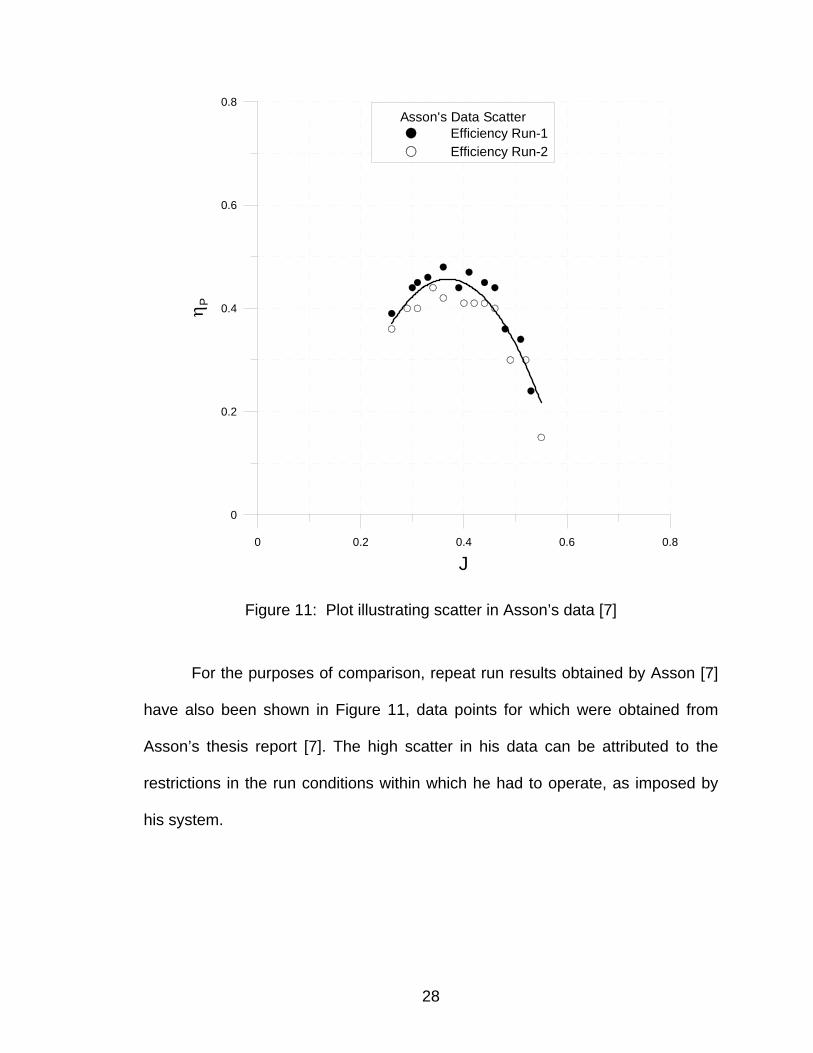
Figure 11: Plot illustrating scatter in Asson’s data [7]
For the purposes of comparison, repeat run results obtained by Asson [7]
have also been shown in Figure 11, data points for which were obtained from
Asson’s thesis report [7]. The high scatter in his data can be attributed to the
restrictions in the run conditions within which he had to operate, as imposed by
his system.
28

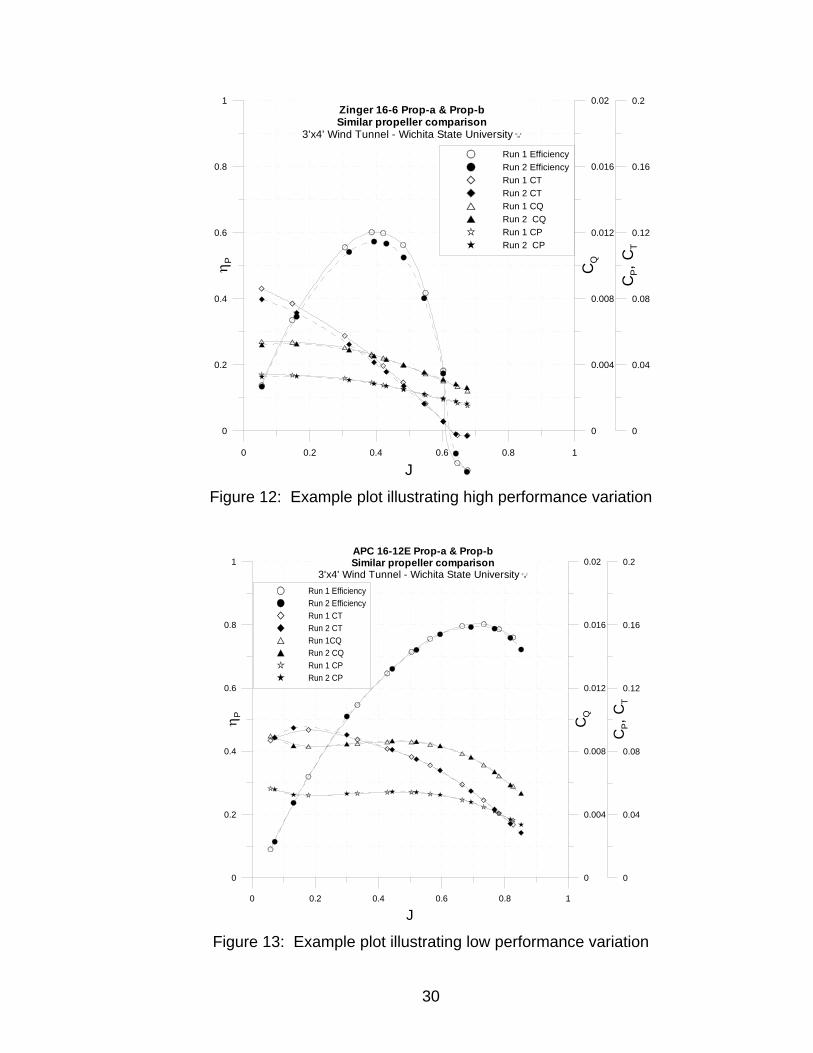
4.4 Observations – Issues with propeller manufacturability
Certain limitation issues arising due to propeller manufacture quality were
observed and have been demonstrated through the investigational test results
described in this section. The limitation of IPTS as mentioned in the previous
sections has only been the propeller diameter, which is only restricted due to the
dimensions of test section. This section demonstrates some limitations, in terms
of repeatability as imposed due to the propellers manufacturability.
It should be noted here that the Integrated Propulsion Test System is
intended to measure performance of a given propeller. The accuracy of this
system has also been demonstrated in as many ways as possible. Therefore,
deviations in propeller performance plots are only attributed to physical variations
in similar propellers due to poor manufacturability.
Comparison runs have been performed between two propellers made by the
same manufacturer. This test has been designed with the point of exploring the
manufacturer’s product reliability and the variance in manufacturability. For the
purpose of comparison, contrasting results have been shown in Figures 12 and
13, where two propeller sets, each set having the same geometry, from two
different manufacturers, are compared.
As can be observed that form Figures 12 and 13, there is a distinct variation
in propeller performance in Figure 12, especially in the efficiency and thrust
coefficient, compared to a very minor variation in propeller data as in Figure 13.
29
0 0.2 0.4 0.6 0.8 1
J
0
0.2
0.4
0.6
0.8
1
η P
Run 1 EfficiencyRun 2 EfficiencyRun 1 CTRun 2 CTRun 1 CQRun 2 CQRun 1 CPRun 2 CP
0
0.004
0.008
0.012
0.016
0.02
CQ
0
0.04
0.08
0.12
0.16
0.2
CP,
CT
Zinger 16-6 Prop-a & Prop-bSimilar propeller comparison
3'x4' Wind Tunnel - Wichita State University ©M
2
Figure 12: Example plot illustrating high performance variation
0 0.2 0.4 0.6 0.8 1
J
0
0.2
0.4
0.6
0.8
1
η P
Run 1 EfficiencyRun 2 EfficiencyRun 1 CTRun 2 CTRun 1CQRun 2 CQRun 1 CPRun 2 CP
0
0.004
0.008
0.012
0.016
0.02
CQ
0
0.04
0.08
0.12
0.16
0.2
CP,
CT
APC 16-12E Prop-a & Prop-bSimilar propeller comparison
3'x4' Wind Tunnel - Wichita State University ©M
2
Figure 13: Example plot illustrating low performance variation
30
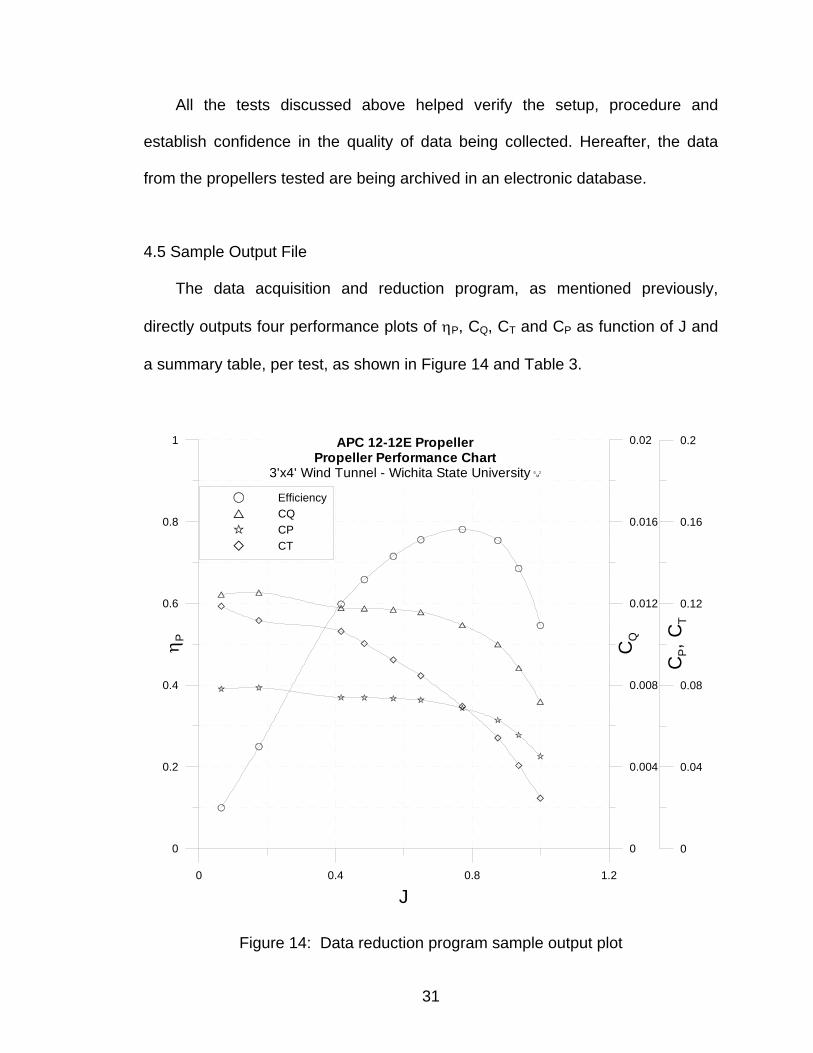
All the tests discussed above helped verify the setup, procedure and
establish confidence in the quality of data being collected. Hereafter, the data
from the propellers tested are being archived in an electronic database.
4.5 Sample Output File
The data acquisition and reduction program, as mentioned previously,
directly outputs four performance plots of ηP, CQ, CT and CP as function of J and
a summary table, per test, as shown in Figure 14 and Table 3.
0 0.4 0.8 1.2
J
0
0.2
0.4
0.6
0.8
1
η P
EfficiencyCQCPCT
0
0.004
0.008
0.012
0.016
0.02
CQ
0
0.04
0.08
0.12
0.16
0.2
CP, C
T
APC 12-12E PropellerPropeller Performance Chart
3'x4' Wind Tunnel - Wichita State University ©M
2
Figure 14: Data reduction program sample output plot
31
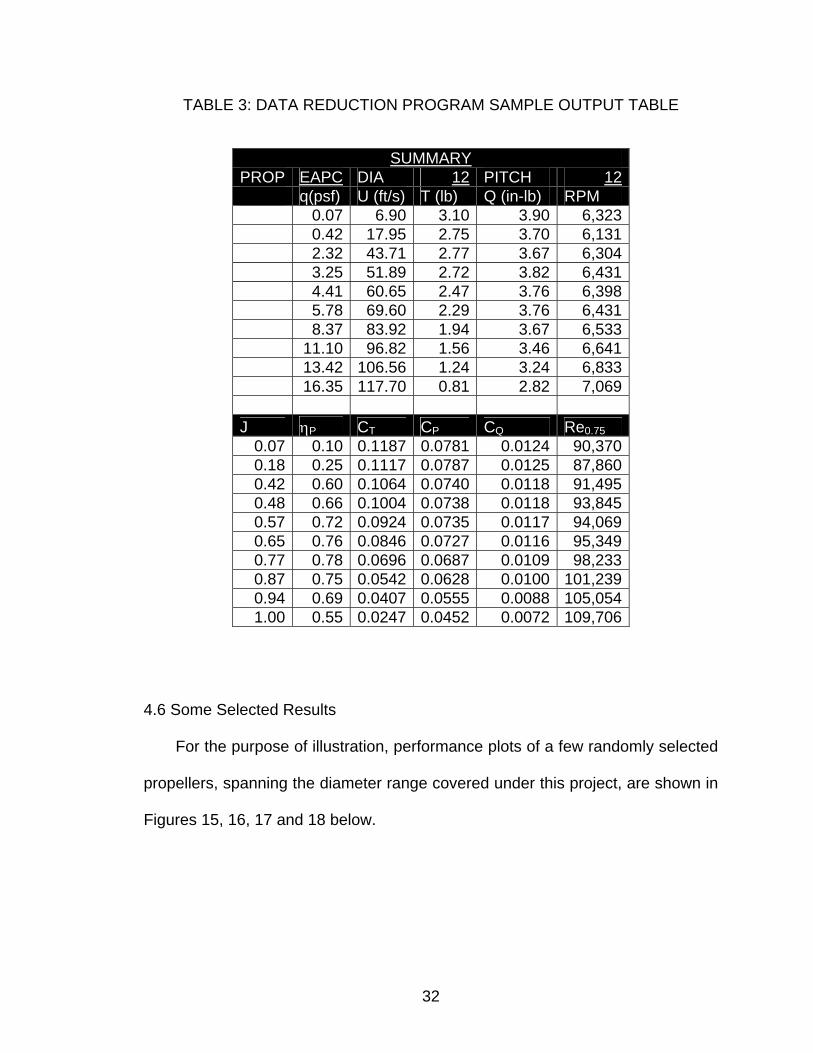
TABLE 3: DATA REDUCTION PROGRAM SAMPLE OUTPUT TABLE
SUMMARYPROP EAPC DIA 12 PITCH 12 q(psf) U (ft/s) T (lb) Q (in-lb) RPM 0.07 6.90 3.10 3.90 6,323 0.42 17.95 2.75 3.70 6,131 2.32 43.71 2.77 3.67 6,304 3.25 51.89 2.72 3.82 6,431 4.41 60.65 2.47 3.76 6,398 5.78 69.60 2.29 3.76 6,431 8.37 83.92 1.94 3.67 6,533 11.10 96.82 1.56 3.46 6,641 13.42 106.56 1.24 3.24 6,833 16.35 117.70 0.81 2.82 7,069 J ηP CT CP CQ Re0.75
0.07 0.10 0.1187 0.0781 0.0124 90,370 0.18 0.25 0.1117 0.0787 0.0125 87,860 0.42 0.60 0.1064 0.0740 0.0118 91,495 0.48 0.66 0.1004 0.0738 0.0118 93,845 0.57 0.72 0.0924 0.0735 0.0117 94,069 0.65 0.76 0.0846 0.0727 0.0116 95,349 0.77 0.78 0.0696 0.0687 0.0109 98,233 0.87 0.75 0.0542 0.0628 0.0100 101,239 0.94 0.69 0.0407 0.0555 0.0088 105,054 1.00 0.55 0.0247 0.0452 0.0072 109,706
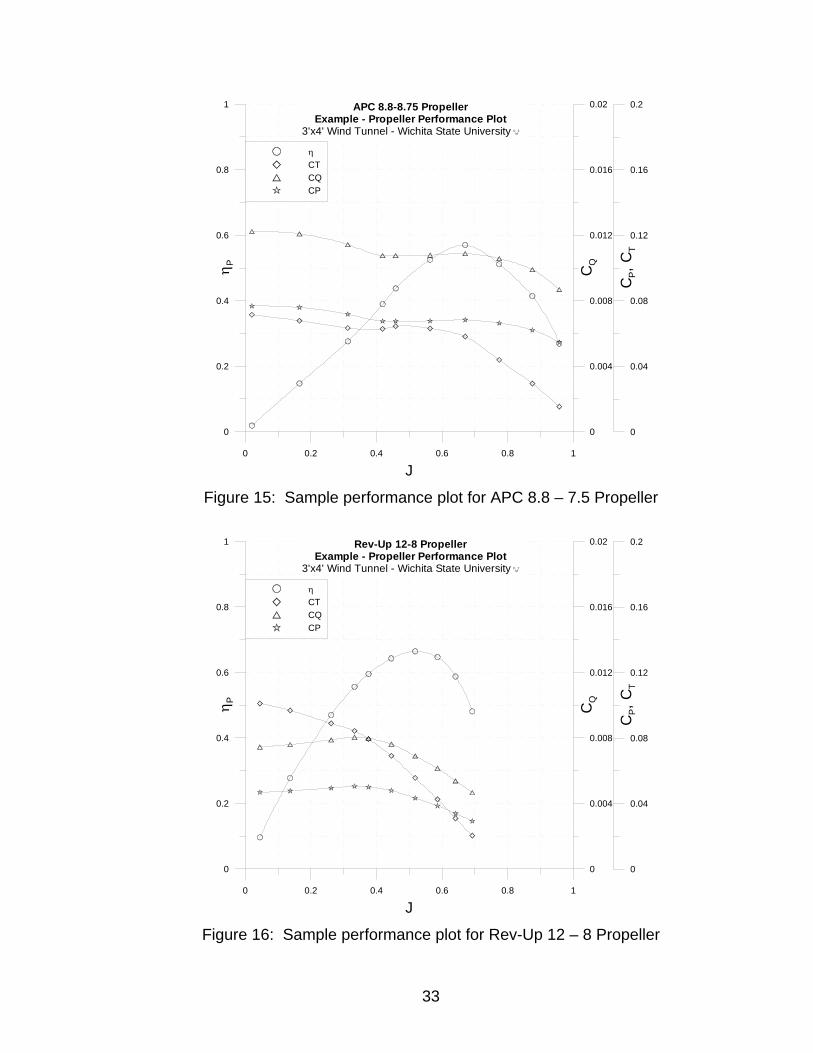
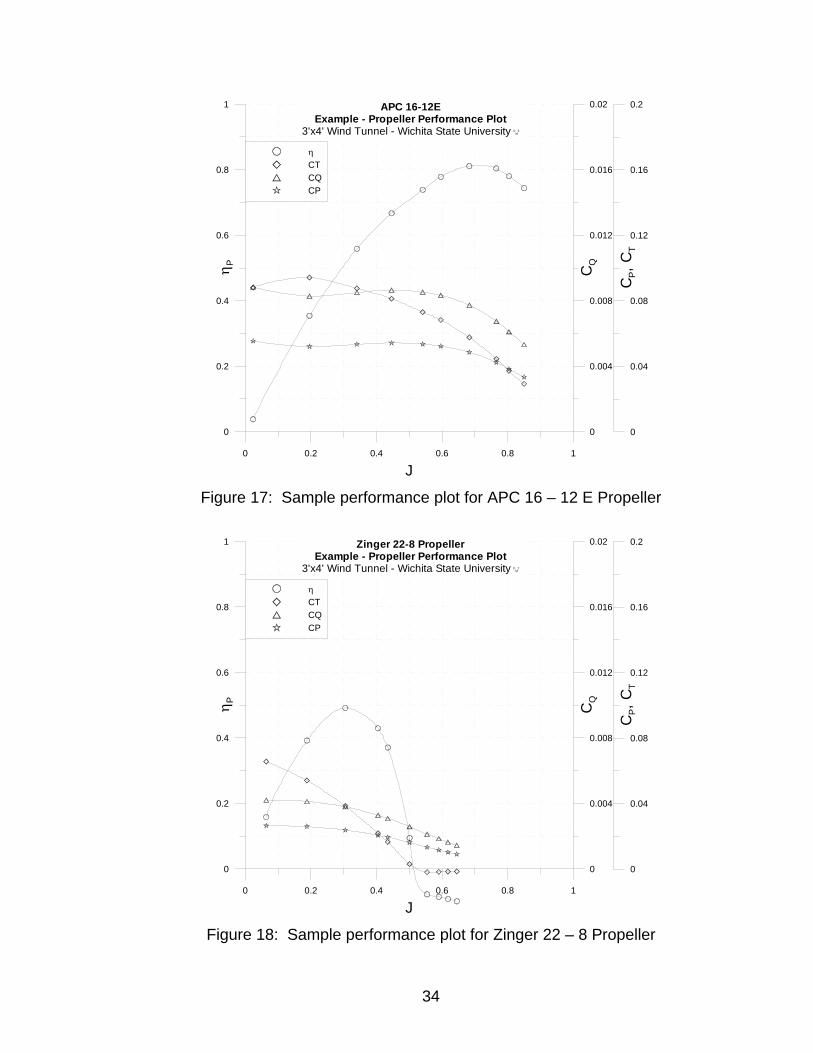
4.6 Some Selected Results
For the purpose of illustration, performance plots of a few randomly selected
propellers, spanning the diameter range covered under this project, are shown in
Figures 15, 16, 17 and 18 below.
32
0 0.2 0.4 0.6 0.8 1
J
0
0.2
0.4
0.6
0.8
1
η P
ηCTCQCP
0
0.004
0.008
0.012
0.016
0.02
CQ
0
0.04
0.08
0.12
0.16
0.2
CP, C
T
APC 8.8-8.75 PropellerExample - Propeller Performance Plot
3'x4' Wind Tunnel - Wichita State University ©M
2
Figure 15: Sample performance plot for APC 8.8 – 7.5 Propeller
0 0.2 0.4 0.6 0.8 1
J
0
0.2
0.4
0.6
0.8
1
η P
ηCTCQCP
0
0.004
0.008
0.012
0.016
0.02
CQ
0
0.04
0.08
0.12
0.16
0.2
CP, C
T
Rev-Up 12-8 PropellerExample - Propeller Performance Plot
3'x4' Wind Tunnel - Wichita State University ©M
2
Figure 16: Sample performance plot for Rev-Up 12 – 8 Propeller
33
0 0.2 0.4 0.6 0.8 1
J
0
0.2
0.4
0.6
0.8
1
η P
ηCTCQCP
0
0.004
0.008
0.012
0.016
0.02
CQ
0
0.04
0.08
0.12
0.16
0.2
CP, C
T
APC 16-12EExample - Propeller Performance Plot
3'x4' Wind Tunnel - Wichita State University ©M
2
Figure 17: Sample performance plot for APC 16 – 12 E Propeller
0 0.2 0.4 0.6 0.8 1
J
0
0.2
0.4
0.6
0.8
1
η P
ηCTCQCP
0
0.004
0.008
0.012
0.016
0.02
CQ
0
0.04
0.08
0.12
0.16
0.2
CP, C
T
Zinger 22-8 PropellerExample - Propeller Performance Plot
3'x4' Wind Tunnel - Wichita State University ©M
2
Figure 18: Sample performance plot for Zinger 22 – 8 Propeller
34
0 0.2 0.4 0.6 0.8 1
J
0
0.2
0.4
0.6
0.8
1
ηP
Run 1 - Re at max. efficiency 112,000Asson's Test PointsRun 2 - Re at max. efficiency 219,000
Zinger 16-6 PropellerExample - Reynolds Number Effect
3'x4' Wind Tunnel - Wichita State University ©M
2
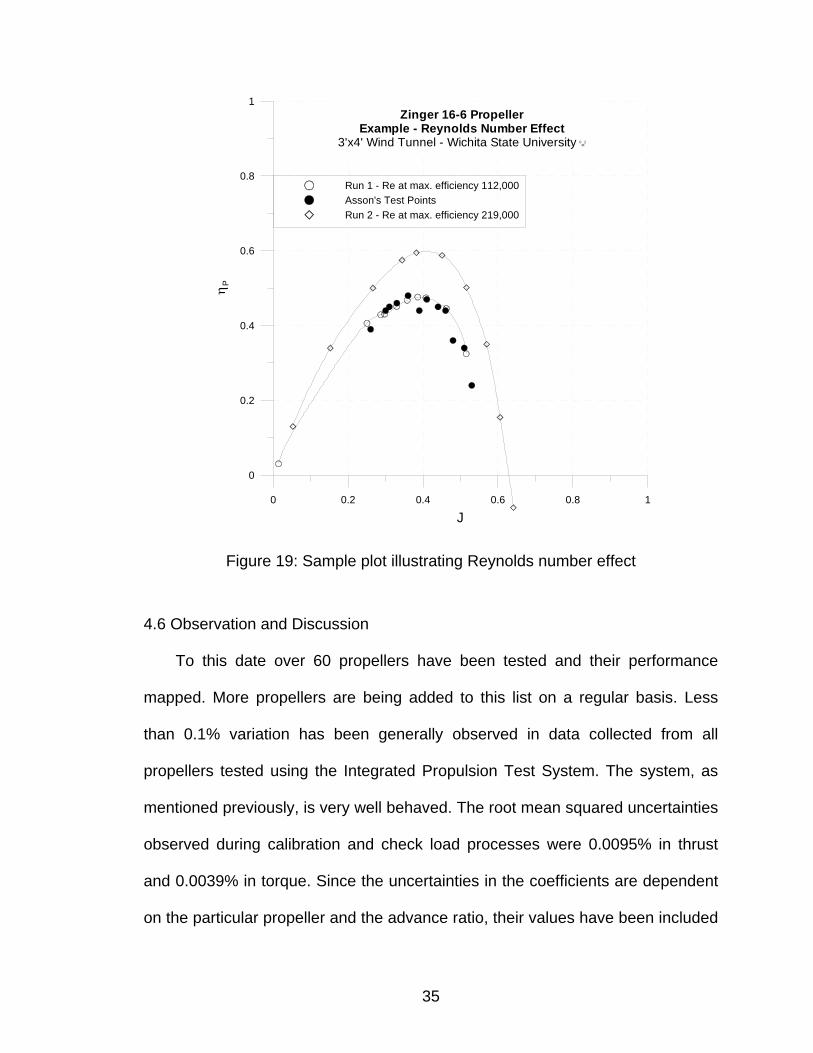
Figure 19: Sample plot illustrating Reynolds number effect
4.6 Observation and Discussion
To this date over 60 propellers have been tested and their performance
mapped. More propellers are being added to this list on a regular basis. Less
than 0.1% variation has been generally observed in data collected from all
propellers tested using the Integrated Propulsion Test System. The system, as
mentioned previously, is very well behaved. The root mean squared uncertainties
observed during calibration and check load processes were 0.0095% in thrust
and 0.0039% in torque. Since the uncertainties in the coefficients are dependent
on the particular propeller and the advance ratio, their values have been included
35
in the table provided along with the propeller performance charts. These however
were 0.2% in CT and CP and, 0.15% in CQ for the worst case scenario. Since
these values depended on the measurement taken from each instrument, they
varied for each propeller and each data point recorded. Typical values for these
uncertainties, as observed, were 0.05% in CT and CQ and 0.003% in CP.
Also, as mentioned earlier, the other important observation made was that
the scatter in repeat run data increased as Reynolds number were decreased by
spinning the propellers below 3000 RPM at tunnel speeds of less than 50 ft/s. As
an interesting note, Low Reynolds number effects on propeller performance
curves have been observed (Figure 19). Since the Reynolds number at any given
point during a run would differ due to increasing tunnel speeds, the low Reynolds
number effect was studied by comparing the Reynolds number (chord length at
3/4th radius location) that occurred at maximum efficiency for a particular
propeller.
Although, examples for only a few representative propellers have been
shown in this thesis, a website is currently being setup where data for more
propellers will be made available to public.
4.6.1 A brief note on Performance calculators
The experimental results were also compared to results from performance
calculator programs available in the public domain, such as PropSelector [17].
The results, as expected, did not match and neither did it show any consistent
trends. The reason for this could not be verified since, no source code or the
36

information on the analytical method used by PropSelector [17], is available.
Thus, since the credibility of this program is questionable, results obtained from
this have been ignored.
Program based on the Combined Blade Element and Momentum Theory [2],
although fairly accurate, could not be used here. This program requires users to
input airfoil data and propeller geometry information such as twist distribution.
Such information is generally not made available to the end user by the propeller
manufacturer. Furthermore, propellers such as those tested here, do not use
standard airfoils. Most of the time, the airfoils used herein are flat bottomed or
modified airfoils, and obtaining lift curve slope for such airfoils becomes very
difficult. Hence, experimental results could not be compared to this program
either.
37
CHAPTER 5
5.0 CONCLUSIONS
The results from all the tests performed so far have been very encouraging.
All expectations from this exercise have been surpassed and the following
conclusions have been drawn based on the results obtained and the
observations made herein.
• The results of Propeller performance experiments conducted by
Asson in his thesis [6] have been successfully repeated and matched,
as described in the System and Procedure Validation section.
• The sensitivity and repeatability studies and tests show that the
system is highly repeatable with minimal scatter in data.
• The apparatus has remained structurally sturdy at high motor RPM
and high Tunnel-q, not affecting the data quality and repeatability, a
common problem faced by previous investigators.
• Typical uncertainties in the non-dimensional performance coefficients,
CT and CQ are 0.05% and 0.003% for CP.
• Low uncertainty in all measured variables in all tests increases the
confidence in data and demonstrates high measurement system and
tunnel flow quality.
Thus it can be concluded that the primary goal of this effort has been
successfully accomplished and expectations been exceeded.
38
With over 30 unique propellers tested and over 150 runs logged, a reliable
propeller performance database has been created, with more propellers being
tested and data being added on a regular basis.
A website is currently being setup for the public to access the propeller
performance database.
The tests conducted so far have also demonstrated the systems design time
efficiency. Entire experiment can be completed within ten to fifteen minutes and,
the ability to quickly change propellers, greatly reduces the wind tunnel
occupancy time, which can prove very valuable.
Moreover, this system will be a valuable experimental tool for investigators
to not only measure and determine propeller experimentally, but will also help
designers gain an insight needed to further improve or optimize an existing
propeller or a new propeller.
39
CHAPTER 6
6.0 RECOMMENDATIONS
Substantial amount of time and effort has been spent in the development of
this apparatus and the experimental procedure. Extensive work has been
performed to fine tune the system as much as possible to increase its data output
accuracy. However, a few recommendations that can further improve this system
are:
• Incorporate power measurement and control into the data acquisition
and reduction routine. This would help further automate the process
and eliminate the manual task of logging current and voltage data
associated with this experiment. Although, it should be noted here
that power being supplied to the motor is in no way associated with
any propeller performance parameters, but can be helpful in future if
motor and system performance too, were to be calculated.
• Design and build a ‘universal’ motor adapter with a smaller frontal
area. This would help accommodate a smaller diameter couling,
reducing the overall frontal area.
As far as the experiments are concerned, this system can be used with little
or no modifications to investigate a wide range of subjects relating to rotary
wings. However, since Low Reynolds number effects have been observed here,
40

further investigation of this effect is recommended, since this may lead to
correction charts or tables to compensate for such effects.
The Integrated Propulsion Test System is a valuable asset and addition to
the 3’ x 4’ Low Speed Wind Tunnel’s already present high quality force and
pressure measurement systems, increasing the bandwidth of experiments that
can be reliably performed.
41

LIST OF REFERENCES
42

LIST OF REFERENCES
[1] Boucher, B., Electric Motor Handbook, 3rd Print, 2001, Chaps. 1, 2, 9. [2] Seddon, J. and Newman, S., Basic Helicopter Aerodynamics, 2nd ed.,
AIAA Education Series, VA, 2001, Chaps. 2, 3. [3] APC Propellers, URL:
http://www.apcprop.com/Engineering/engineering_design.html [cited 6 May 2005].
[4] Bass, R. M., ‘Techniques of Model Propeller Testing,” SAE Paper 83-
0750, April 1983. [5] Stefko, G. L., Bober, L. J. and Neumann, H. E., “New Test Techniques
and Analytical Procedures for Understanding the Behavior of Advanced Propellers,” SAE Paper 83-0729, April 1983.
[6] Asson, K. M. and Dunn, P. F., “Compact Dynamometer System that can
Accurately Determine Propeller Performance,” Journal of Aircraft, Vol. 29, No. 1, 1992, pp. 8-9.
[7] Asson, K. M., “The Development of an Advanced Dynamometer System to
Experimentally Determine Propeller Performance,” M.S. Thesis, University of Notre Dame, Notre Dame, IN, 1990.
[8] Bass, R. M., “Small Scale Wind Tunnel Testing of Model Propellers,” 24th
Aerospace Sciences Meeting, AIAA-86-0392, January 1986. [9] Molland, A. F. and Turnock, S. R., “A Propeller Thrust and Torque
Dynamometer for Wind Tunnel Models,” Strain, Blackwell Sciences Ltd., Vol. 38, 2002, pp. 3-10.
[10] MH-Aerotools, URL:
http://www.mh-aerotools.de/airfoils/pylonprops_1.htm [cited 7 November, 2005].
[11] Wikipedia – Online Encyclopedia, URL: http://en.wikipedia.org/wiki/Model_aircraft [cited 7 November, 2005].
[12] Kline, S. J. and McClintok, F. A., “Describing Uncertainties in Single
Sample Experiment,” Mechanical Engineering, Vol. 75, No. 1, 1953, pp. 3-9.
43
[13] Holman, J. P., Experimental Methods for Engineers, 6th ed., McGraw Hill, New York, 1994, Chaps. 3.
[14] Pope A., Wind Tunnel Testing, 2nd ed., John Wiley, New York, 1954,
Chaps. 6. [15] Raymer, D. P., Aircraft Design: A Conceptual Approach, 3rd ed., AIAA
Education Series, VA, 2001, Chap. 13. [16] Glauert, H., Wind Tunnel Interference on Wings, Bodies, and Air-screws,
R&M 1566, 1933. [17] Propeller Selector program (freeware) PropSelector, URL:
http://www.gylesaero.com/freeware/propcalc.shtml [cited 7 November, 2005].
[18] Henry V. Borst,” Aerodynamic Design and Analysis of Propellers for Mini-Remotely Piloted Air Vehicles”, USAAMRDL-TR-77-45A, Volume-I, January 1978.
[19] Henry V. Borst,” Summary of Propeller Design Procedures and Data”,
USAAMRDL-TR-73-34A, Volume-I, January 1973.
44