Embed Size (px)
Citation preview

0
2016-2020 Countywide Strategic Plan for
Economic Development
Propel L.A. 2020 Targets

www.propel.la
1
Propel L.A. 2020 Targets 2016-2020 Countywide Strategic Plan for Economic Development
March 2019
Propel L.A., Countywide Strategic Plan for Economic Development
Los Angeles Economic Development Corporation (LAEDC)
444 S. Flower Street, 37th Floor, Los Angeles CA 90071
Tel: (213) 622-4300 | Fax: (213) 622-7100
Web 1: propel.la | Web 2: laedc.org | Email: [email protected]
www.propel.la
2
2020 TARGETS
PREPARED & RESEARCHED BY
Pisacha Wichianchan, Data Analyst
EDITED AND REVISED BY
Marianne Haver Hill, Executive Director Collette Hanna, Communications Manager Samuel Marquez, Program Manager
ABOUT PROPEL L.A.
Propel L.A. is the 2016-2020 Countywide Strategic Plan for Economic Development.
Developed by over 500 regional stakeholders throughout Los Angeles County, the
Strategic Plan is centered around seven aspirational goals and with one purpose: to
capture the power of many to propel economic impact and equity.
WHY DO WE NEED TARGETS?
Propel L.A.’s 2020 targets are a regional call to action to raise the standards of living in
Los Angeles County through work related to and in the furtherance of the implementation
of the seven goals.
The pursuit of these targets aims to empower our stakeholders to close the gap between
where we started in 2016, year one of the Strategic Plan, and our proposed 2020 targets,
which represent the minimum standards given the local cost of living, inflation and other
considerations. Propel L.A.’s targets are interconnected and aspirational. They do not
serve as a forecast, but rather as a guiding set of target “guideposts” that align with the
successful implementation of the current Strategic Plan. Through our partnership with
over 500 regional stakeholders, we aspire to see LA County advance further towards the
2020 targets outlined in the report.
We invite you to review the research that informed the development of these targets.
FORMAT
There are six 2020 target sections in this report. The format of each section is as follows:
• Issue area
• Methodology
• Target (in blue)
0
TARGET 1: MEDIAN HOUSEHOLD INCOME
Issue area
Household income is the aggregate income of all the people who occupy a housing unit.1
Median household income2 refers to the "middle" value (i.e., 50 percent below / 50
percent above) in the list of households. Traditionally, this economic measure provides
information about whether an average household can afford the cost of living, dominated
primarily by housing costs, in a region.
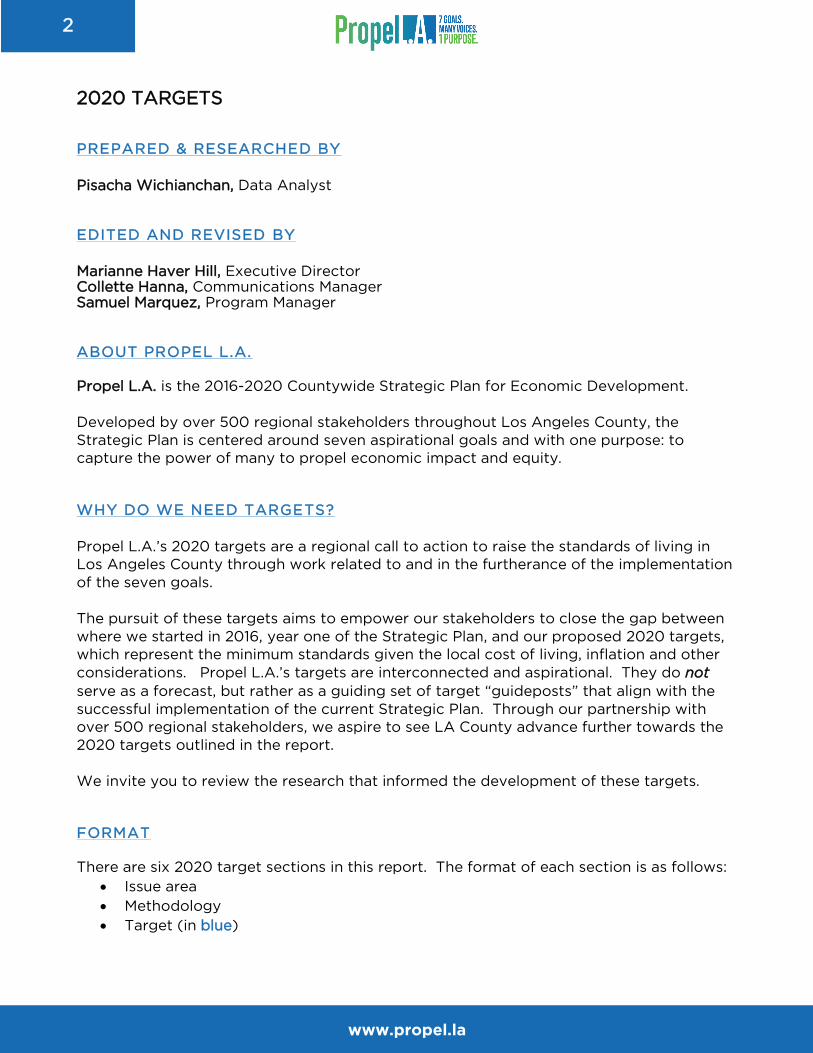
Methodology
To set a target for median household income, we first used the U.S. Census data to
identify the most common household composition in LA County and its employment
characteristics. Here, the “most common” value refers to the statistical mode.
Household Composition3
Category per Census Population Estimate
Percentage Average Size
Total households 3,295,198 100% 3.01
Married-couple family 1,477,624 45% 3.80
Male head-of-household family 224,702 7% 3.90
Female head-of-household family 501,596 15% 3.88
Nonfamily household 1,091,276 33% 1.37
(Figure 1) Married couple is the most common household type in LA County.
Since the average size of a married couple household is 3.80, Propel L.A. rounded the value to the nearest integer (i.e., 4)
and assumed that the married couple household is composed of two parents and two children.
Employment Characteristics of Married-Couple Families4
Category per Census Population Estimate
Percentage
Married-couple families 1,477,624 100%
Both husband and wife in labor force 743,436 50%
Husband in labor force, wife not in labor force 394,700 27%
Wife in labor force, husband not in labor force 109,104 7%
Both husband and wife not in labor force 220,692 15%
(Figure 2) Two working parents is the most common employment characteristic of married-couple families in LA County.
Since “married-couple family with two working parents and two children” is the most
common household composition and respective employment characteristics in LA County,
we then identified the total income required cover their basic needs. For this, we used the
California Budget & Policy Center’s estimated family budget, taken from Making Ends
Meet: How Much Does It Cost to Support a Family in California? (December 2017).
1 A house, an apartment or other group of rooms, or a single room, is regarded as a housing unit when it is occupied or intended for occupancy as separate living quarters; that is, when the occupants do not live with any other persons in the structure and there is direct access from the outside or through a common hall. (https://www.census.gov/programs-surveys/cps/technical-documentation/subject-definitions.html#household) 2 Median income is the amount which divides the income distribution into two equal groups, half having incomes above the median, half having incomes below the median. The medians for households, families, and unrelated individuals are based on all households, families, and unrelated individuals, respectively. (https://www.census.gov/programs-surveys/cps/technical-documentation/subject-definitions.html#medianincome). 3 Table S1101, 2013-2017 American Community Survey 5-Year Estimates 4 Table S2302, 2013-2017 American Community Survey 5-Year Estimates
www.propel.la
1
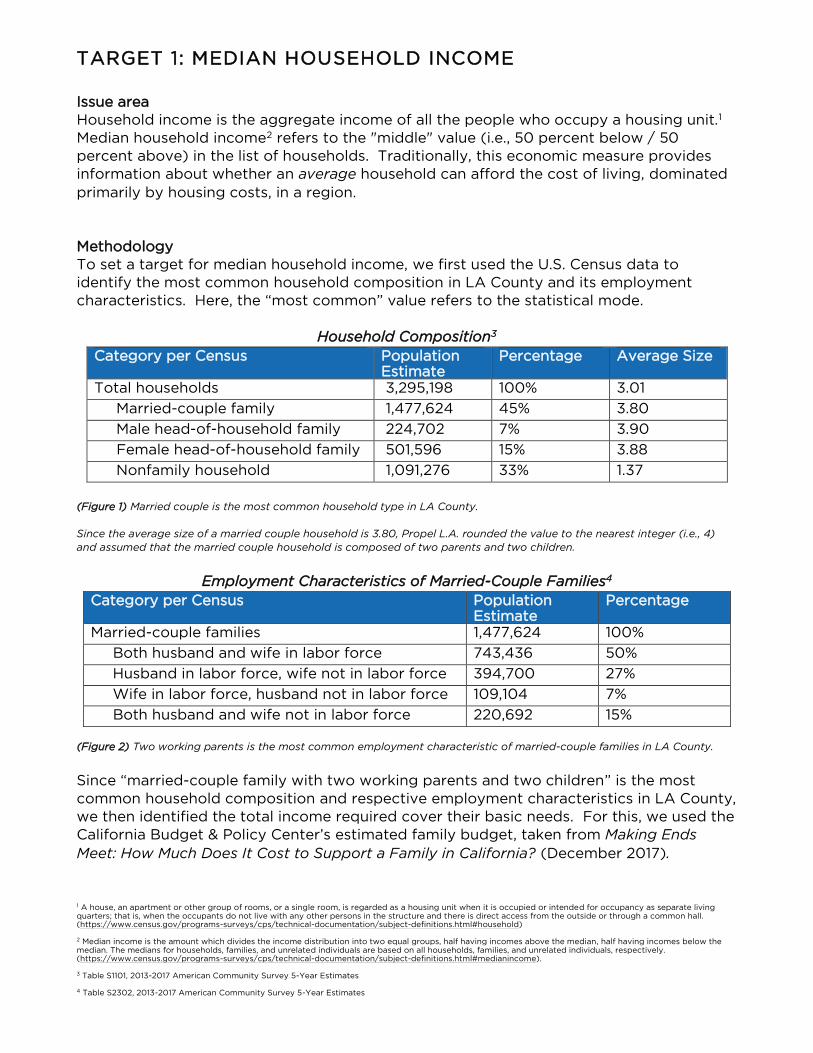
Family Budget to Make Ends Meet5
(Figure 3) Propel L.A. used the two-working-parent family’s budget of $74,679 to identify the amount of money required to
cover a common household’s basic needs in LA County.
5 http://www.calbudgetcenter.org/wp-content/uploads/Fact-Sheet_Making-Ends-Meet-2017_Los-AngelesCty.pdf
www.propel.la
2
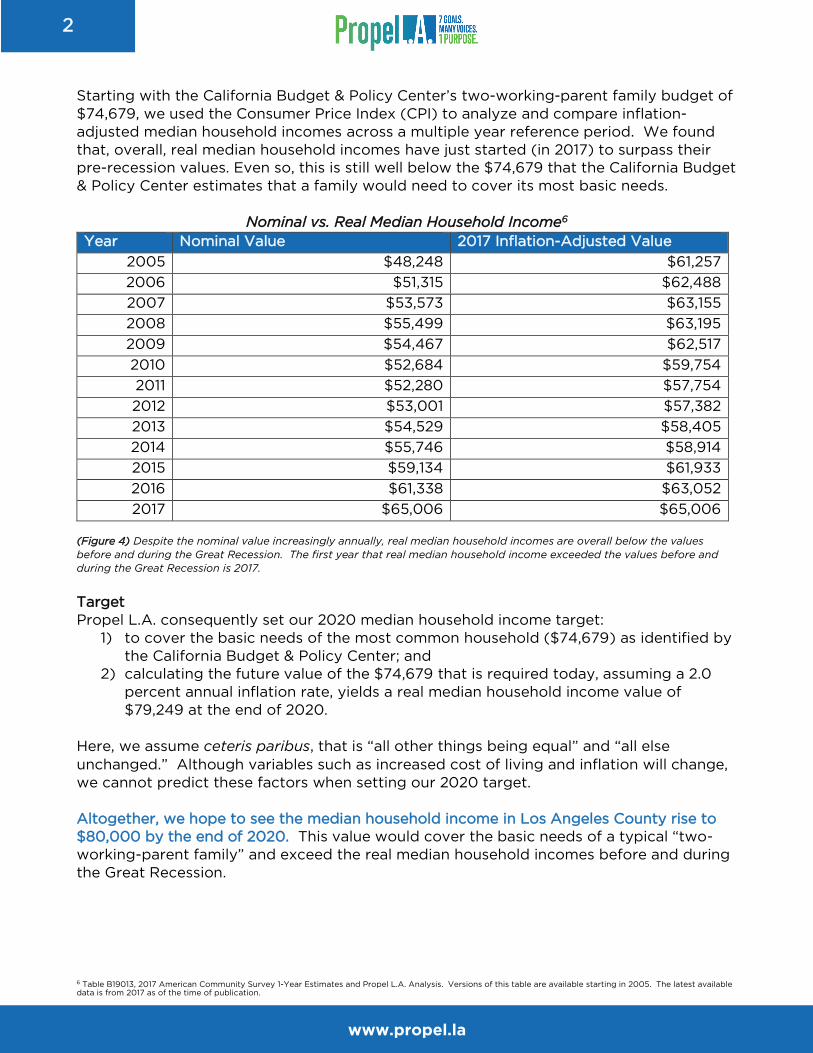
Starting with the California Budget & Policy Center’s two-working-parent family budget of
$74,679, we used the Consumer Price Index (CPI) to analyze and compare inflation-
adjusted median household incomes across a multiple year reference period. We found
that, overall, real median household incomes have just started (in 2017) to surpass their
pre-recession values. Even so, this is still well below the $74,679 that the California Budget
& Policy Center estimates that a family would need to cover its most basic needs.
Nominal vs. Real Median Household Income6
Year Nominal Value 2017 Inflation-Adjusted Value
2005 $48,248 $61,257
2006 $51,315 $62,488
2007 $53,573 $63,155
2008 $55,499 $63,195
2009 $54,467 $62,517
2010 $52,684 $59,754
2011 $52,280 $57,754
2012 $53,001 $57,382
2013 $54,529 $58,405
2014 $55,746 $58,914
2015 $59,134 $61,933
2016 $61,338 $63,052
2017 $65,006 $65,006
(Figure 4) Despite the nominal value increasingly annually, real median household incomes are overall below the values
before and during the Great Recession. The first year that real median household income exceeded the values before and
during the Great Recession is 2017.
Target
Propel L.A. consequently set our 2020 median household income target:
1) to cover the basic needs of the most common household ($74,679) as identified by
the California Budget & Policy Center; and
2) calculating the future value of the $74,679 that is required today, assuming a 2.0
percent annual inflation rate, yields a real median household income value of
$79,249 at the end of 2020.
Here, we assume ceteris paribus, that is “all other things being equal” and “all else
unchanged.” Although variables such as increased cost of living and inflation will change,
we cannot predict these factors when setting our 2020 target.
Altogether, we hope to see the median household income in Los Angeles County rise to
$80,000 by the end of 2020. This value would cover the basic needs of a typical “two-
working-parent family” and exceed the real median household incomes before and during
the Great Recession.
6 Table B19013, 2017 American Community Survey 1-Year Estimates and Propel L.A. Analysis. Versions of this table are available starting in 2005. The latest available data is from 2017 as of the time of publication.

www.propel.la
3
TARGET 2: MEDIAN PERSONAL INCOME
Issue area
For our purpose, personal income refers to the income of a working person age 15 and
over. Traditionally, median personal income provides information about whether the
median wage earner can afford the costs of living within a region without family or
external support.
Methodology
To set a target for median personal income, we first identified the budget required today
(2017) for a single adult to cover basic needs in LA County, using the California Budget &
Policy Center’s analysis (see Figure 3), which is $29,217.
We then analyzed the adjusted median personal incomes, using the CPI. Like real median
household income, real median personal income has just recently (2017) surpassed its pre-
recession levels.
Nominal vs. Real Median Personal Income7
Year Nominal Value 2017 Inflation-Adjusted Value
2005 $23,302 $29,585
2006 $23,132 $28,168
2007 $24,259 $28,598
2008 $25,049 $28,523
2009 $23,833 $27,355
2010 $23,582 $26,747
2011 $23,273 $25,710
2012 $23,855 $25,827
2013 $23,876 $25,573
2014 $24,706 $26,110
2015 $26,010 $27,241
2016 $26,661 $27,406
2017 $28,608 $28,608
(Figure 5) Like real median household incomes, real median personal incomes are overall below the values before and during
the Great Recession of 2007-09. Real median personal income has not exceeded the 2005 value of $29,585.
Target
Propel L.A. consequently set our 2020 median personal income target:
1) to cover the basic needs of a single adult ($29,217) as identified by the California
Budget & Policy Center; and
2) calculating the future value of the $29,217 that is required today, assuming a 2.0
percent annual inflation rate, yields a real median household income value of
$31,005 at the end of 2020.
7 Table B06011, 2017 American Community Survey 1-Year Estimates and Propel L.A. Analysis. Versions of this table are available starting in 2005. The latest available data is from 2017 as of the time of publication.
www.propel.la
4
Again, we assume ceteris paribus, that is “all other things being equal” and “all else
unchanged.” Although variables such as increased cost of living and inflation will change,
we cannot predict these factors when setting our 2020 target.
Taken together, we hope to see the median personal income in Los Angeles County rise to
at least $31,000 by the end of 2020, which would cover the basic needs of a typical
“single adult”.
TARGET 3: POVERTY RATE
Issue area
There are multiple ways to measure poverty.
The official poverty measure, while updated for inflation using the CPI,8 does not take
geographical variation into consideration. Therefore, it does not account for LA County’s
high housing and transportation costs, along with other critical living expense differentials
between regions. In other words, the official poverty measure underestimates the severity
of poverty in our region.
For this reason, we used the California Poverty Measure (CPM). Jointly produced by the
Public Policy Institute of California and the Stanford Center on Poverty and Inequality, the
CPM is a comprehensive index that improves upon conventional poverty measures and
accounts for geographic variation in the costs of living. Accordingly, the CPM is a more
accurate reflection of poverty in LA County than the official poverty measure.
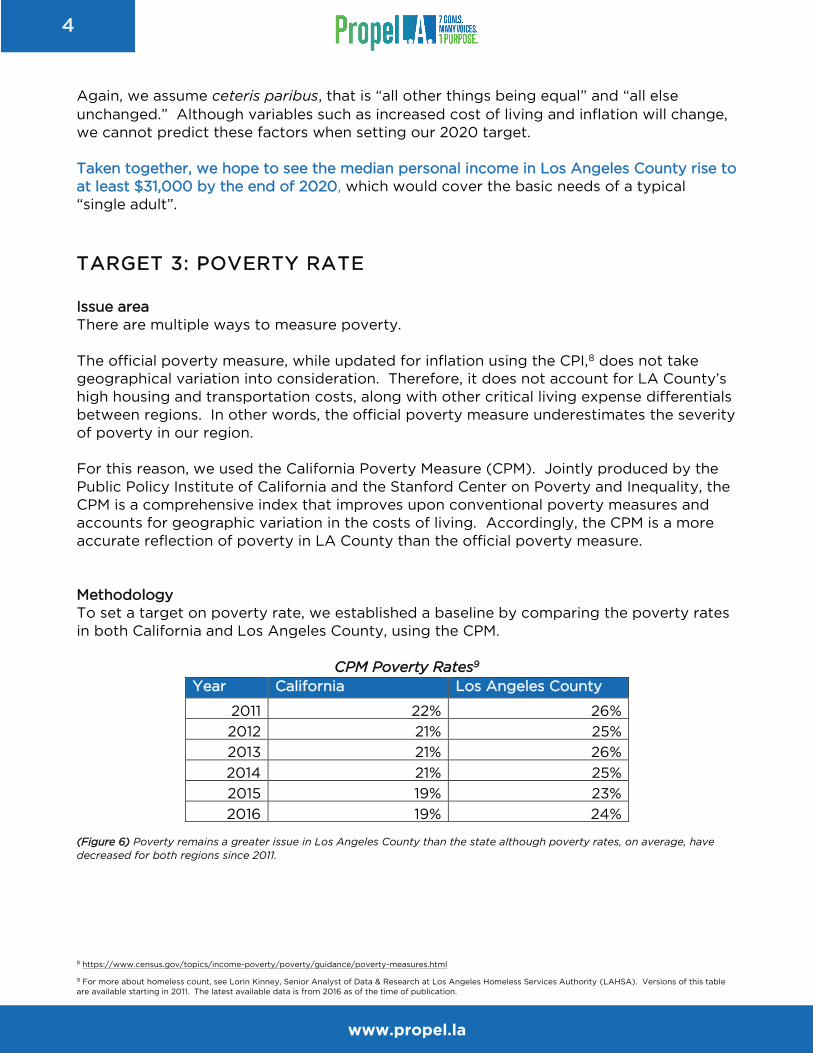
Methodology
To set a target on poverty rate, we established a baseline by comparing the poverty rates
in both California and Los Angeles County, using the CPM.
CPM Poverty Rates9
Year California Los Angeles County
2011 22% 26%
2012 21% 25%
2013 21% 26%
2014 21% 25%
2015 19% 23%
2016 19% 24%
(Figure 6) Poverty remains a greater issue in Los Angeles County than the state although poverty rates, on average, have
decreased for both regions since 2011.
8 https://www.census.gov/topics/income-poverty/poverty/guidance/poverty-measures.html 9 For more about homeless count, see Lorin Kinney, Senior Analyst of Data & Research at Los Angeles Homeless Services Authority (LAHSA). Versions of this table
are available starting in 2011. The latest available data is from 2016 as of the time of publication.
www.propel.la
5
Target
Between 2011 and 2016, the average percentages of residents living in poverty in California
and Los Angeles County are 21 percent and 25 percent, respectively. Using the state’s
average as our longer-term target, which is currently four points below the county’s rate,
we hope to see our poverty rate in Los Angeles County decrease by at least two points to
23 percent or less by the end of 2020.
TARGET 4: HOMELESSNESS
Issue area
Homelessness is a chronic and salient issue that impacts all 88 cities and 100+
unincorporated areas within LA County. While sustainable solutions may seem
inaccessible given the severity of homelessness in the county, recent public policy and
objective data show signs of hope.
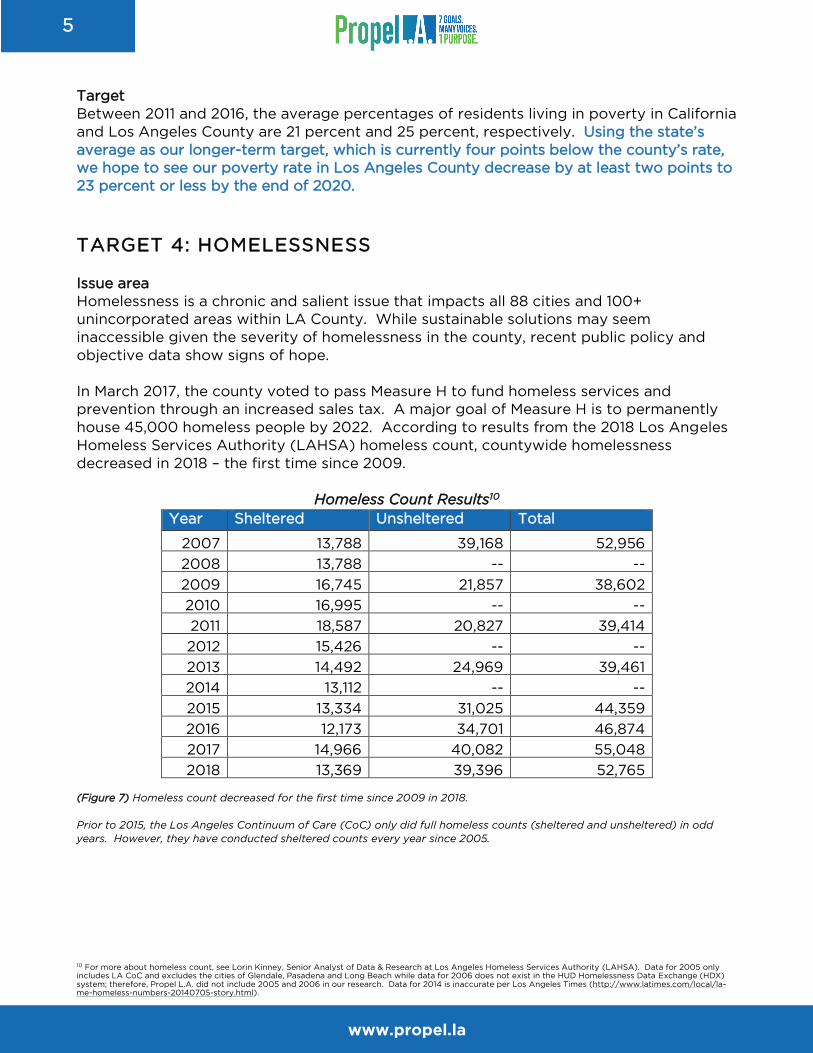
In March 2017, the county voted to pass Measure H to fund homeless services and
prevention through an increased sales tax. A major goal of Measure H is to permanently
house 45,000 homeless people by 2022. According to results from the 2018 Los Angeles
Homeless Services Authority (LAHSA) homeless count, countywide homelessness
decreased in 2018 – the first time since 2009.
Homeless Count Results10
Year Sheltered Unsheltered Total
2007 13,788 39,168 52,956
2008 13,788 -- --
2009 16,745 21,857 38,602
2010 16,995 -- --
2011 18,587 20,827 39,414
2012 15,426 -- --
2013 14,492 24,969 39,461
2014 13,112 -- --
2015 13,334 31,025 44,359
2016 12,173 34,701 46,874
2017 14,966 40,082 55,048
2018 13,369 39,396 52,765
(Figure 7) Homeless count decreased for the first time since 2009 in 2018.
Prior to 2015, the Los Angeles Continuum of Care (CoC) only did full homeless counts (sheltered and unsheltered) in odd
years. However, they have conducted sheltered counts every year since 2005.
10 For more about homeless count, see Lorin Kinney, Senior Analyst of Data & Research at Los Angeles Homeless Services Authority (LAHSA). Data for 2005 only includes LA CoC and excludes the cities of Glendale, Pasadena and Long Beach while data for 2006 does not exist in the HUD Homelessness Data Exchange (HDX) system; therefore, Propel L.A. did not include 2005 and 2006 in our research. Data for 2014 is inaccurate per Los Angeles Times (http://www.latimes.com/local/la-me-homeless-numbers-20140705-story.html).
www.propel.la
6
Methodology
Los Angeles County’s Homeless Initiative and United Way of Greater Los Angeles, Propel
L.A.’s lead partners on the homelessness issue, used July 1, 2017 as the time of reference
for measuring progress under Measure H.11 Given the 4.5 years between July 1, 2017 and
January 1, 2022, Propel L.A. has determined that LA County must move 10,000 homeless
people to permanent homes per year to stay on track for Measure H.
Target
Based on Measure H, we hope to see at least 35,000 homeless people housed
permanently by the end of 2020.
HOUSING AFFORDABILITY (RENTING AND HOMEBUYING)
Affordable housing is important to both residents and businesses. Not only does it fulfill a
basic human need for shelter, but it also contributes to the well-being of families and
individuals as well as to the economic vitality of communities, including:
• Competitive advantage for employers to attract and retain employees in the region
• Reduced traffic, pollution, and expenditures on roads resulting from shorter
commutes
• More time for activities that support overall wellness
Despite the importance of affordable housing, renting and homebuying in California and
especially in Los Angeles County remain unaffordable for most local households. We hope
to see more homes being built to meet the market demand. A healthy mix of housing
options, from affordable to market-rate, renting to owning, single-family homes to
duplexes to mixed-use development, as well as senior homes, will ensure opportunities for
our residents to improve their vitality and contribute to their communities.
TARGET 5: RENTING
Issue area
In Los Angeles County, 54 percent of residents12 rent the homes in which they live. Data
reveals that more than half of renters in the region are rent-burdened, which means they
spend 30 percent or more of their household income on rent.
There are two levels, ranking the severity of rent burden. Moderately burdened
households are those that spend 30 to 50 percent of household income on rent, while
severely burdened households are those that spend more than 50 percent of household
income on rent.
Methodology
To set a rent target, we compare the percentages of households that are severely rent-
burdened in California and Los Angeles County.
11 http://everyoneinla.org/progress/ 12 Table S2502, 2013-2017 American Community Survey 5-Year Estimates

www.propel.la
7
Severely Rent-Burdened Households13
Year California Los Angeles County
2005 26% 28%
2006 26% 28%
2007 25% 27%
2008 27% 28%
2009 27% 29%
2010 28% 30%
2011 29% 32%
2012 29% 31%
2013 28% 31%
2014 28% 31%
2015 27% 30%
2016 27% 30%
2017 27% 29%
(Figure 8) Los Angeles County has a higher percentage of severely rent-burdened households than the state.
Target
Between 2005 and 2017, the average percentages of severely rent-burdened households
in California and Los Angeles County are 27 percent and 30 percent, respectively. Using
the state’s average as our target, we hope to see the number of severely rent-burdened
households in Los Angeles County decrease to 27 percent or less by the end of 2020.
TARGET 6: HOMEBUYING
Issue area
Homeowners utilize about 46 percent of occupied housing units in Los Angeles County.14
Buying a home anywhere in California may be expensive, but affordability remains an even
more acute problem in Los Angeles County.
Methodology
Homebuying affordability is measured by the Traditional Housing Affordability Index. To
set homebuying affordability target, we compare the housing affordability indexes in
California and Los Angeles County.
13 Table B25070, 2017 American Community Survey 1-Year Estimates and Propel L.A. Analysis. Versions of this table are available starting in 2005. The latest available data is from 2017 as of the time of publication. 14 Table S2502, 2013-2017 American Community Survey 5-Year Estimates

www.propel.la
8
Traditional Housing Affordability Index15
Year California Los Angeles County 2006 12% 10%
2007 13% 11% 2008 33% 24% 2009 51% 38% 2010 48% 42%
2011 53% 46% 2012 51% 46% 2013 36% 34% 2014 31% 29%
2015 30% 28% 2016 31% 28% 2017 29% 26% 2018 28% 25%
(Figure 9) The percentages refer to the proportions of local households that can afford to purchase the median priced home
in the respective region.
Target
Using the data above, the average percentages of households that can afford to purchase
the median priced home in California and Los Angeles County from 2006 to 2018 are 35
percent and 30 percent, respectively. Using the state’s average as our target, we hope to
see at least 35 percent Los Angeles County households able to afford the median priced
home within the county by the end of 2020.
15 California Association of Realtors' Traditional Housing Affordability Index (HAI) and Propel L.A. Analysis. Versions of this table are available starting in the first quarter of 2006. The latest available data is from the fourth quarter of 2018 as of the time of publication.
www.propel.la
9
CONCLUSION
Propel L.A. is calling our stakeholders to collectively work towards raising the standards of
living in Los Angeles County through their support and commitment to the
implementation of the seven aspirational goals and related strategies in the 2016-2020
Countywide Strategic Plan for Economic Development.
Propel L.A. and our partners are working towards the fulfillment of the above targets. Here
are some examples:
• Through the Citi Foundation’s Community Progress Makers Grant, Propel L.A. has
partnered with local community colleges and nonprofits to recruit historically
underserved residents into a short-term job training program to advance their
economic opportunities and incomes.
• With community college Strong Workforce support, Propel L.A. developed an
original video series – called HireEd – to introduce middle and high school students
to good-paying and high-demand career pathways that align with the future
workforce research of the Center for a Competitive Workforce
(https://ccworkforce.org).
• We also understand that economic disparity begins at early childhood and have
supported the work of our friends at First 5 LA to improve outcomes for children
from age 0 to 5 and their families.
• Along with our partners at the County’s Homeless Initiative and United Way of
Greater Los Angeles, Propel L.A. has recognized LA County’s 50,000+ homeless
residents as part of our community and supported Measure H initiatives and the
“Everyone In” campaign.
• Finally, Propel L.A. has acknowledged that much of the county’s housing woes
stemmed from the lack of supply amidst high demand. Therefore, we support our
partners at Metro and Los Angeles Housing + Community Investment Department
to develop more housing units, including affordable options and transit-oriented
development throughout the County.
If programs such as these are successfully implemented, along with the collective progress
of our partners, we will surely see a more sustainable and widely prosperous Los Angeles
County for all residents.