Embed Size (px)
Citation preview

Journal of CellularBiochemistry
ARTICLEJournal of Cellular Biochemistry 111:1575–1585 (2010)
Prolonged Nrf1 Overexpression Triggers AdipocyteInflammation and Insulin Resistance
A
G
*M
R
P
Florence H. van Tienen,1,2 Patrick J. Lindsey,1,2,3,4 Carla J. van der Kallen,3,5 andHubert J. Smeets1,2,3,4*1Department of Genetics and Cell Biology, Maastricht University, Maastricht, The Netherlands2Research Institute Nutrition and Toxicology Research Institute Maastricht (NUTRIM), Maastricht University,Maastricht, The Netherlands
3Cardiovasculair Research Institute Maastricht (CARIM), Maastricht University, Maastricht, The Netherlands4GROW-School of Oncology & Developmental Biology, Maastricht University, Maastricht, The Netherlands5Laboratory of Molecular Metabolism and Endocrinology, Department of Internal Medicine, Maastricht University,Maastricht, The Netherlands
ABSTRACTAdipose tissue is currently being recognized as an important endocrine organ, carrying defects in a number of metabolic diseases.
Mitochondria play a key role in normal adipose tissue function and mitochondrial alterations can result in pathology, like lipodystrophy or
type 2 diabetes. Although Pgc1a is regarded as the main regulator of mitochondrial function, downstream Nrf1 is the key regulator of
mitochondrial biogenesis. Nrf1 is also involved in a wide range of other processes, including proliferation, innate immune response, and
apoptosis. To determine transcriptional targets of Nrf1, 3T3-L1 preadipocytes were transfected with either pNrf1 or a control vector. Two days
post-confluence, 3T3-L1 preadipocytes were allowed to differentiate. At day 8 of differentiation, Nrf1 overexpressing cells had an increased
mtDNA copy number and reduced lipid content. This was not associated with an increased ATP production rate per cell. Using global gene
expression analysis, we observed that Nrf1 overexpression stimulated cell proliferation, apoptosis, and cytokine expression. In addition,
prolonged Nrf1 induced an adipokine expression profile of insulin resistant adipocytes. Nrf1 has a wide range of transcriptional targets,
stimulators as well as inhibitors of adipose tissue functioning. Therefore, post-transcriptional regulation of Nrf1, or stimulating specific Nrf1
targets may be a more suitable approach for stimulating mitochondrial biogenesis and treating adipose tissue defects, instead of directly
stimulating Nrf1 expression. In addition, our results show that short-term effects can drastically differ from long-term effects. J. Cell.
Biochem. 111: 1575–1585, 2010. � 2010 Wiley-Liss, Inc.
KEY WORDS: ADIPOCYTES; GENE EXPRESSION; MITOCHONDRIA; NRF1
T he incidence of obesity and obesity-associated diseases, like
cardiovascular diseases, hypertension, dyslipidemia, and
Type 2 diabetes mellitus (T2DM) is rapidly increasing throughout
the world [Wild et al., 2004]. Obesity and T2DM are currently being
considered world-wide epidemics [Smyth and Heron, 2006].
Adipose tissue is together with skeletal muscle, a key organ in
development of both obesity and T2DM. Obesity is characterized by
excessive caloric intake that requires increased adipocyte prolifera-
tion and adipocyte enlargement. Prolonged excessive adipocyte
overload can lead to adipocyte dysfunction, which is characterized
dditional Supporting Information may be found in the online version o
rant sponsor: Dutch Diabetes Foundation; Grant number: DFN 2004.00.0
Correspondence to: Hubert J. Smeets, Department of Genetics and Cellaastricht, The Netherlands. E-mail: [email protected]
eceived 27 July 2010; Accepted 15 September 2010 � DOI 10.1002/jcb.2
ublished online 4 November 2010 in Wiley Online Library (wileyonlinel
by increased macrophage content, inflammation, lipolysis, altered
adipokine secretion profile, insulin resistance, and decreased
adipocyte differentiation capacity [Guilherme et al., 2008].
Central in normal lipid metabolism are the mitochondria.
Mitochondria are responsible for the majority of ATP production
in a cell and accomplish a number of important cellular processes,
like regulating the balance between fatty acid synthesis, b-
oxidation, and lipolysis. These processes are impaired in both
skeletal muscle and adipose tissue from T2DM subjects [Mootha
et al., 2003; Lowell and Shulman, 2005; Dahlman et al., 2006]. The
1575
f this article.
40; Grant sponsor: Kerry Foundation.
biology, Universiteitssingel 50, 6229 ER
2889 � � 2010 Wiley-Liss, Inc.
ibrary.com).

relation between mitochondrial aberrations and abnormal lipid
metabolism is also exemplified by observations that m.8344A>G,
m.8363G>A, and m.3271T>C mutation carriers, and persons
having a mtDNA depletion due to anti-retroviral therapy, may
develop lipodystrophy and T2DM as part of the clinical spectrum
[Munoz-Malaga et al., 2000; Mallon et al., 2005]. In addition,
decreased mitochondrial density and activity, as well as decreased
expression of key regulators of mitochondrial biogenesis have been
observed in muscle and adipose tissue of T2DM patients [Mootha
et al., 2003; Patti et al., 2003; Lowell and Shulman, 2005; Choo et al.,
2006]. One of those regulators is peroxisome-proliferator activated
receptor g co-activator 1a (Pgc1a). Pgc1a is a transcriptional co-
activator that is involved in regulation of a number of transcription
factors involved in energy metabolism, for example, PPARg, Nrf1,
ERRa, and CREB. As a result, Pgc1a provides a direct link between
external physiological stimuli and the regulation of mitochondrial
biogenesis [Arany, 2008]. Thiazolidinediones (TZDs), for example,
pioglitazone and rosiglitazone, are anti-diabetic agents that activate
the adipogenic transcription factor PPARg, resulting in improved
adipose tissue mitochondrial function, insulin sensitivity, and
adipokine expression [Bogacka et al., 2005; Choo et al., 2006; Lv
et al., 2009; Sugii et al., 2009]. Like pioglitazone, 2 days of Nrf1
overexpression results in increased adiponectin secretion, which
regulates energy homeostasis and glucose and lipid metabolism in
adipocytes [Koh et al., 2007].
Although Nrf1 is mainly regarded as a Pgc1a target, which
controls Tfam expression and mitochondrial biogenesis, altered
Pgc1a expression does not necessarily influence Nrf1. For example,
inactivity resulted in decreased Pgc1a expression whereas Nrf1
expression was increased [Timmons et al., 2006], and Nrf1 is not
influenced by Sirt1, which is an upstream activator of Pgc1a
[Gerhart-Hines et al., 2007]. Nrf1 encodes a phosphorylated nuclear
protein with a bZIP binding domain and plays, besides stimulating
mitochondrial biogenesis, a crucial role in multiple other processes.
Immunoprecipitation assays have shown that Nrf1 targets �700
promoters of genes involved in a number of functions, for example,
DNA replication and repair, cell proliferation, migration, and
Fig. 1. Experimental setup 3T3-L1 cells were seeded at day-5 and 70% confluent at
construct or control pEGFP vector. Two days postconfluence, at day 0, transfection was
refreshing mediumþ insulin every other day. IBMX, 3-isobutyl-1-methylxanthine; dex
1576 PROCESSES TRIGGERED BY NRF1 OVEREXPRESSION
apoptosis [Cam et al., 2004]. Taken together, current data indicates
thatNrf1 is more than a Pgc1a target andmitochondrial dysfunction
in adipose tissue and reduced Nrf1 are key aspects of T2DM
development. In this study we aim to identify the genes that are
directly regulated byNrf1 in adipocytes, whichmay help identifying
new more specific downstream therapeutic targets for T2DM, or
other diseases associated with mitochondrial dysfunction.
MATERIALS AND METHODS
CELL CULTURE
Mouse 3T3-L1 preadipocytes (ATCC) were grown in Dulbecco’s
modified Eagle’s medium (DMEM) (Gibco) containing 10% FCS
(Gibco) and penicillin/streptavidin (Gibco). As shown in Figure 1,
3T3-L1 preadipocytes were transfected at 70% confluence with
pSPORT-Nrf1 (Openbiosystems) or pEGFP control vector with
Fugene HD transfection reagents (Roche) according to the
manufacturers’ protocol. Transfection was repeated at days 0 and
4 of differentiation. Differentiation was induced 2 days post-
confluence by changing medium with DMEM containing 0.5mM 3-
isobutyl-1-methylxantine (IBMX) (Sigma), 10mg/ml insulin (Sigma)
and 1mM dexamethasone (Sigma). After 2 days, medium was
replaced with DMEM containing 10% FCS and 10mg/ml insulin, and
changed every 2 days till day 8.
MTDNA COPY NUMBER DETERMINATION
DNA was isolated using the Qiagen DNA isolation kit according to
the manufacturers’ protocol (Qiagen, Hilden, Germany). The mtDNA
content was determined by comparing the ratio of mtDNA (ND1) to
nDNA (18S rRNA) in triplo by real-time quantitative PCR. DNA was
amplified in a 12.5ml reaction containing 5 ng DNA, 1.25 pmol of
forward and reverse primer, and ABI SYBR Green PCR master mix
(Applied Biosystems, Carlsbad, CA). The cycling conditions were: an
initial step for 20 at 508C, activation of the Hot Goldstar enzyme at
958C for 100, 40 cycles of 1500 at 958C followed by 10 at 608C(denaturation, annealing, and elongation).
day-4 when 3T3-L1 cells were transfected with either pSPORT-Nrf1 overexpression
repeated and differentiation mix was added. Cells were differentiated for 8 days with
a, dexamethasone.
JOURNAL OF CELLULAR BIOCHEMISTRY

GENE EXPRESSION ANALYSIS
RNA isolation and DNAse treatment were performed with the high
pure RNA isolation kit (Roche) according to the manufacturers’
protocol. RNA quantity and purity were determined spectro-
photometrically using the Nanodrop ND-1000 (Nanodrop Technol-
ogies, Wilmington, DE) and RNA integrity was assessed by
determining the RNA 28S/18S ratio using the Bioanalyzer 2100
(Agilent Technologies, Santa Clara, CA). Mouse adipocyte RNA
spiked with four bacterial RNA transcripts was reverse transcribed
into cDNA and amplified in a two-round amplification reaction
according to the manufacturer’s protocol (Affymetrix, Santa Clara,
CA). A mixture of cDNA and added hybridization controls was
hybridized on Affymetrix Mouse Genome 430 2.0 arrays, followed
by staining and washing steps in the GeneChip fluidics station 400
(Affymetrix) according to the manufacturer’s procedures. To assess
the raw probe signal intensities, chips were scanned using the
GeneChip scanner 3000 (Affymetrix).
DETECTION OF OVER-REPRESENTED TRANSCRIPTION FACTOR
BINDING SITES
The online tool oPOSSUM V2.0 was used to identify over-
represented transcription factor binding sites in the promoters of
differentially expressed genes [Ho Sui et al., 2005]. All genes with
>20% up- and down-regulated expression in NRF1-overexpressing
3T3-L1 cells at day 8 of differentiation were uploaded in oPossum.
Settings were as followed: Taxonomic supergroup: vertebrates, top
10 level of conserved regions (min. conservation >70%), matrix
match threshold 80%, 2,000 bp up- and downstream sequence, z-
score� 10.
STATISTICAL ANALYSIS
Statistical analysis was performed using the freely available
program R [Ihaka and Gentleman, 1996] and the publicly available
library ‘‘growth’’ [Lindsey, 1999]. The chip description file (CDF)
used for the analysis was an update [Dai et al., 2005; http://
brainarray.mbni.med.umich.edu] based on Ensembl (version 10).
This resulted in the analysis of 15768 gene-transcripts. All genes
were analyzed using a Gaussian linear regression N(m, s2), where m
is the mean and s2 is the variance, including the chip’s log mean
intensity and the best hybridization spike. The inference criterion
used for comparing the models is their ability to predict the observed
data, that is, models are compared directly through their minimized
minus log-likelihood. When the numbers of parameters in models
differ, they are penalized by adding the number of estimated
parameters, a form of the Akaike information criterion (AIC)
[Akaike, 1973]. The transcript under consideration was found to be
differentially expressed, if the AIC decreased compared to the model
not containing the group effect, the confidence interval did not
include a fold change of 1, there was at least a 20% fold change
increase or decrease, and each group had a mean signal intensity
>200 or >300 in one group. Visualization and analysis of
microarray data on biological pathways was performed using the
Gene Map Annotator and Pathway Profiler (GenMAPP, version 2.0)
[Salomonis et al., 2007]. Gene database Mm-std_20070817 and
MAPPs version Mm_contributed_20080619 were used. Signifi-
cantly changed pathways were identified using the MAPPFinder
JOURNAL OF CELLULAR BIOCHEMISTRY
program, which expresses a ‘‘z-score’’ for each pathway using
Fisher’s exact test. z-scores >1.96 and permute P� 0.05 were
considered to be significant [Doniger et al., 2003]. In addition, gene
ontology (GO) based analysis of biological processes of level 5 were
analyzed in DAVID [Dennis et al., 2003].
QUANTITATIVE REAL-TIME PCR
cDNA was generated from 1mg RNA in a standard reverse
transcriptase reaction using M-MulV reverse transcriptase (Finn-
zymes, Espoo, Finland). Primers were designed using Primer
Express1 software version 3.0 (Applied Biosystems; for primer
sequences, see Electronic Supplementary Material, ESM 4).
Quantification of transcripts was carried out using the ABI 7900
HT Real-Time PCR detection system using Eurogentec qPCR
Mastermix Plus for SYBR Green1 I (Eurogentec, Seraing, Belgium).
The cycling conditions were: an initial step for 20 at 508C, activationof the Hot Goldstar enzyme at 958C for 100, 40 cycles of 1500 at 958Cfollowed by 10 at 608C. The mRNA levels of each gene were
normalized to those of the housekeeping gene encoding the
Cyclophilin. Primer sequences for the analyzed genes can be found
in the Electronic Supplementary Material (ESM 4).
ATP PRODUCTION AND CASPASE 3/7 ASSAYS
ATP production in 3T3-L1 cells transfected with pSPORT-Nrf1 or
pEGFP (control) was measured at day 8 using the CellTiter-Glo
luminescent Cell viability assay (Promega, Madison, WI) according
manufacturer’s protocol. ATP production was corrected for cell
density by quantification of dsDNA determined with the Quant-iT
PicoGreen dsDNA kit (Invitrogen, Carlsbad, CA). Caspase 3/7
activity was measured at day 8, after trypsinization, cell were
counted and an equal amount of cells per well were used for
quantification of caspase 3/7 activity using the Caspase-Glo13/7
assay (Promega) according to manufacturer’s protocol.
CRYSTAL VIOLET STAINING
Cell numbers were assessed by the crystal violet assay. Cells were
fixed for 1 h in 3.7% paraformaldehyde in PBS. They were stained
for 30min with a 0.1% solution of crystal violet, and destained five
times in demineralized water. The dye was released with 10% acetic
acid at RT for 30min, and the A590 signal was then read using the
Multiskan Spectrum microplate spectrophotometer (Thermo Fisher
Scientific).
ELECTRON MICROSCOPY
Cells were fixed overnight in 2.5% glutaraldehyde (Merck,
Darmstadt, Germany), post-fixed in 1% osmium tetroxide solution,
dehydrated, and embedded in epoxy resin. Semi-thin (1mm) serial
sections were stained with toluidine blue. Ultra-thin sections (70–
90 nm) were mounted on Formvar-coated 75mesh copper grids
(1595 E, Merck, Amsterdam, The Netherlands), and counterstained
with uranyl acetate and lead citrate before analysis on a Philips
CM100 transmission electron microscope (Philips, Eindhoven, The
Netherlands). Quantitative analysis of mitochondrial size was
carried out using freely available Image J software (version 1.42q).
PROCESSES TRIGGERED BY NRF1 OVEREXPRESSION 1577

RESULTS
Mouse 3T3-L1 preadipocytes were transfected with either a vector
containing Nrf1 or a control vector without Nrf1 (pEGFP), and
were allowed to differentiate for 8 days (Fig. 1). Mitochondrial
DNA copy number and gene expression of Nrf1 and adipogenic
regulators were determined at several time points after transfection
and during differentiation to test if the transfection showed the
expected result. On day 8 of differentiation, analysis of mitochon-
drial function, density, and morphology were analyzed together
with global gene expression levels to determine transcriptional
targets of Nrf1.
EFFECT OF NRF1 OVEREXPRESSION ON MITOCHONDRIAL
PARAMETERS IN DIFFERENTIATING PREADIPOCYTES
MtDNA copy number was quantified by the ratio between
mitochondrial encoded ND1 and nuclear encoded 18S rRNA. The
mitochondrial DNA copy number in 3T3-L1 adipocytes was
significantly increased (P¼ 0.01; n¼ 4) in pNrf1 overexpressing
cells (1.53� 0.3-fold) compared with control pEGFP transfected
cells. To identify if the mtDNA was continuously increased during
differentiation, we analyzed the mtDNA content at days 0, 3, 6, and
8, and observed only a significantly higher mtDNA content in
pNRF1-transfected cells at days 6 and 8, but not earlier (data not
shown). To evaluate if Nrf1 overexpression resulted in increased
ATP production, we measured ATP production at day 8 of
differentiation in Nrf1 overexpressing and control pEGFP-trans-
fected 3T3-L1 adipocytes. As shown in Figure 2, increased ATP
production was observed in Nrf1-overexpressing cells. However,
after correcting for number of cells, no difference was observed in
ATP production. Since cells were seeded at same density, increased
cell number in Nrf1-overexpressing cells suggests increased
proliferation due to Nrf1 overexpression. Crystal violet staining
Fig. 2. ATP production is similar in pNrf1-transfected and empty vector transfected ad
with pNrf1 or pEGFP and differentiation was induced 2 days post-confluence. ATP me
1578 PROCESSES TRIGGERED BY NRF1 OVEREXPRESSION
at days 0 and 8 showed indeed a 13% (P¼ 0.07) and 36% (P< 0.01)
increased cell number during differentiation in Nrf1 transfected
wells. Furthermore, electron microscopic analysis of mitochondrial
morphology showed that Nrf1-overexpressing cells had enlarged
(Figs. 5 and 6) and more electron dense mitochondria than pEGFP-
transfected cells at day 8 of differentiation (Fig. 5).
DIFFERENTIALLY EXPRESSED GENES DUE TO NRF1
OVEREXPRESSION IN PREADIPOCYTES
The effect of Nrf1 overexpression on gene expression was assessed
by comparing four replicates of 3T3-L1 cells transfected with pNrf1
overexpression construct with four replicates transfected with
pEGFP as controls on day 8 of differentiation. Gene expression
analysis was performed using Affymetrix Mouse Genome 430 2.0
arrays, and after correction for probe set annotation, 15,768
transcripts were analyzed. Using normal regressionmodeling, a total
of 1,926 transcripts were found differentially expressed between
control cells and Nrf1 overexpressing cells with a fold-change of
minimal 20%. From these 1,926 transcripts, 920 transcripts were
increased, and 1,006 transcripts were decreased in Nrf1 over-
expressing 3T3-L1 cells. The majority of the differentially expressed
genes had a fold change of less than twofold up or down. From the
1,006 transcripts with decreased expression, 51 (5.1%) had a fold
change <0.5, and the most extreme down-regulated probe had a
fold change of 0.22. Of the 920 up-regulated transcripts, 76
transcripts (8.3%) were more than two times higher. A few of the
increased genes had an extreme fold change with a maximum of 57-
fold. The distribution of the fold changes is depicted in electronic
supplementary material (ESM) 1, and a list of the 10 most severely
up- and down-regulated genes is presented in Table I.
We used a process-based approach to identify differentially
expressed pathways in adipocytes due to overexpression of Nrf1. The
1,926 differently expressed genes that could be annotated were used
ipocytes 3T3-L1 cells were seeded at the same density, transfected at 70% confluence
asurements were performed at day 8 of differentiation. n¼ 4, �P< 0.05.
JOURNAL OF CELLULAR BIOCHEMISTRY

TABLE I. Top 10 Most Up- and Down-regulated Transcripts in Nrf1-overexpresing Cells
Name SymbolFold change
Nrf1-overexpressing cells
Down-regulated in NRF1 overexpressing cellsAdiponectin Adipoq 0.22 (0.11–0.43)Naþ/Kþ transporting ATPase subunit beta-1 Atp1b1 0.22 (0.21–0.24)Leucine-rich repeat-containing protein 17 precursor Lrrc17 0.24 (0.21–0.28)Type-2 angiotensin II receptor Agtr2 0.25 (0.24–0.27)Matrix Gla protein Mgp 0.26 (0.25–0.27)Fatty acid-binding protein 4 Fabp4 0.27 (0.24–0.32)ATP-binding cassette sub-family A member 8-A Abca8a 0.28 (0.27–0.29)Dermatopontin Dpt 0.31 (0.29–0.33)DNA-binding protein inhibitor ID-2 Id2 0.31 (0.29–0.33)Small proline-rich protein 1A Sprr1a 0.31 (0.30–0.32)
Up-regulated in NRF1 overexpressing cellsCd74 antigen Cd74 5.06 (4.22–6.08)Chitinase 3-like 1 Chi3l1 5.17 (4.96–5.39)Chemokine (C-X-C motif) ligand 11 Cxcl11 5.34 (5.15–5.53)Complement factor B Cfb 6.99 (6.67–7.33)Prolactin family 2, subfamily c, member 4 Prl2c4 7.20 (6.13–8.47)Lipopolysaccharide binding protein Lbp 10.4 (10.2–10.7)Chemokine (C-X-C motif) ligand 5 Cxcl5 10.5 (9.22–12.0)Haptoglobin Hp 21.8 (20.8–22.8)Serum amyloid A3 protein Saa3 35.4 (33.0–37.8)Lipocalin 2 Lcn2 56.8 (53.0–60.8)
TABLE II. qPCR Analysis Supported the Gene Expression Changes Identified by Microarray Analysis
Gene SymbolFold change
microarray (�CI)Fold changeqPCR (�CI)
Fatty acid-binding protein 4 Fabp4 0.27 (0.24–0.32) 0.31 (0.26–0.39)Superoxide dismutase 2 Sod2 3.35 (3.19–3.52) 1.82 (1.65–2.00)Ceruloplasmin Cp 4.22 (4.12–4.34) 4.00 (3.36–4.75)Haptoglobin Hp 21.8 (20.8–22.8) 215 (179–257)Serum amyloid A-3 protein Saa3 35.4 (33.0–37.8) 369 (312–437)Adiponectin Adipoq 0.22 (0.11–0.43) 0.22 (0.18–0.26)Matrix Gla protein Mgp 0.26 (0.25–0.27) 0.31 (0.27–0.35)
for gene ontology based analysis using the GenMAPP/MAPPFinder
program, which performs global analysis of expression data in the
context of hundreds of pathway MAPPs and thousands of Gene
Ontology (GO) terms, calculates the cumulative total of genes changed
for a local MAPP or term, and provides a statistical z-score to assess
significance (Table II, ESM 2). Eight pathways (Table IV) were
found significantly changed with MAPPFinder analysis with a z-score
>1.96 and permute P� 0.05. In addition, 10 GO biological processes at
level 5 were found significantly changed (P� 0.05) in pNrf1
transfected cells, and comprised cell-cycle regulation, inflammation
and apoptosis related genes, as seen in the Mappfinder analysis
(ESM 3).
TABLE III. Overrepresented Transcription-Factor Binding Sites in Nrf1
Transcription factor (TF)
Up-regulated genesHepatic leukemia factor (HLF)
Down-regulated genesSerum response factor (SRF)Sex-determining region Y (SRY)Forkhead box q1 (Foxq1)Aryl hydrocarbon receptor nuclear translocator/receptor (Arnt-Ahr)SRY-related HMG-box (Sox5)
JOURNAL OF CELLULAR BIOCHEMISTRY
DETECTION OF POTENTIAL NRF1 OVERREPRESENTED
TRANSCRIPTION FACTOR BINDING SITES
Nrf1 contains a bZIP domain and oPOSSUM analysis of the up-
regulated genes in Nrf1 overexpressed cells at day 8 of adipogenesis
showed that the hepatic leukemia factor (HLF), which belongs to the
bZIP class of transcription factors, was solely enriched (Table III).
Subsequent GO biological process analysis of all 203 up-regulated
genes containing the bZIP domain showed they were involved in
proliferation and cell-cycle regulation, apoptosis and chemokine/
cytokine signaling (ESM 5). Within the group of down-regulated
genes, a more heterogeneous group of five transcription factor
binding sites were overrepresented (Table III).
-induced Genes
TF class No. target gene hits z-score
bZIP 203 12.3
MADS 57 20.1HMG 579 12.1
FORKHEAD 273 11.6bHLH 625 11.3HMG 586 11.1
PROCESSES TRIGGERED BY NRF1 OVEREXPRESSION 1579
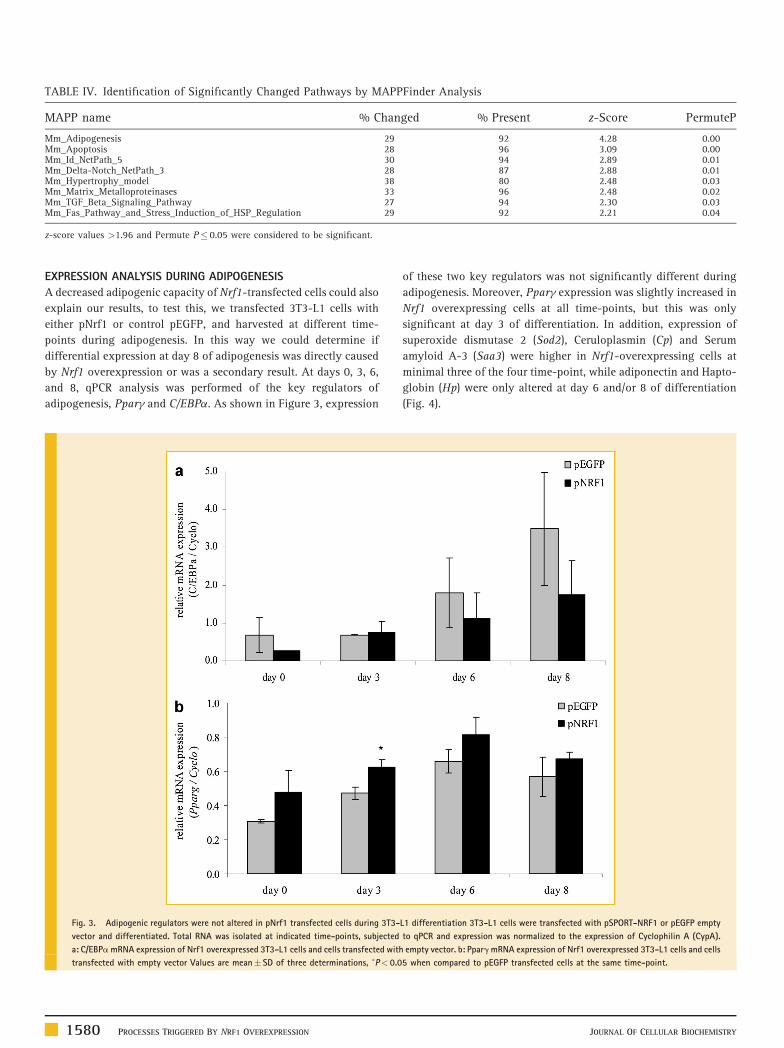
TABLE IV. Identification of Significantly Changed Pathways by MAPPFinder Analysis
MAPP name % Changed % Present z-Score PermuteP
Mm_Adipogenesis 29 92 4.28 0.00Mm_Apoptosis 28 96 3.09 0.00Mm_Id_NetPath_5 30 94 2.89 0.01Mm_Delta-Notch_NetPath_3 28 87 2.88 0.01Mm_Hypertrophy_model 38 80 2.48 0.03Mm_Matrix_Metalloproteinases 33 96 2.48 0.02Mm_TGF_Beta_Signaling_Pathway 27 94 2.30 0.03Mm_Fas_Pathway_and_Stress_Induction_of_HSP_Regulation 29 92 2.21 0.04
z-score values >1.96 and Permute P� 0.05 were considered to be significant.
EXPRESSION ANALYSIS DURING ADIPOGENESIS
A decreased adipogenic capacity of Nrf1-transfected cells could also
explain our results, to test this, we transfected 3T3-L1 cells with
either pNrf1 or control pEGFP, and harvested at different time-
points during adipogenesis. In this way we could determine if
differential expression at day 8 of adipogenesis was directly caused
by Nrf1 overexpression or was a secondary result. At days 0, 3, 6,
and 8, qPCR analysis was performed of the key regulators of
adipogenesis, Pparg and C/EBPa. As shown in Figure 3, expression
Fig. 3. Adipogenic regulators were not altered in pNrf1 transfected cells during 3T3-
vector and differentiated. Total RNA was isolated at indicated time-points, subjected
a: C/EBPamRNA expression of Nrf1 overexpressed 3T3-L1 cells and cells transfected with
transfected with empty vector Values are mean� SD of three determinations, �P< 0.0
1580 PROCESSES TRIGGERED BY NRF1 OVEREXPRESSION
of these two key regulators was not significantly different during
adipogenesis. Moreover, Pparg expression was slightly increased in
Nrf1 overexpressing cells at all time-points, but this was only
significant at day 3 of differentiation. In addition, expression of
superoxide dismutase 2 (Sod2), Ceruloplasmin (Cp) and Serum
amyloid A-3 (Saa3) were higher in Nrf1-overexpressing cells at
minimal three of the four time-point, while adiponectin and Hapto-
globin (Hp) were only altered at day 6 and/or 8 of differentiation
(Fig. 4).
L1 differentiation 3T3-L1 cells were transfected with pSPORT-NRF1 or pEGFP empty
to qPCR and expression was normalized to the expression of Cyclophilin A (CypA).
empty vector. b: PpargmRNA expression of Nrf1 overexpressed 3T3-L1 cells and cells
5 when compared to pEGFP transfected cells at the same time-point.
JOURNAL OF CELLULAR BIOCHEMISTRY

APOPTOSIS
Gene expression analysis indicated increased apoptosis in Nrf1
overexpressing cells. The activity of caspase 3/7 was measured,
which are themain executors of apoptosis, to functionally test this at
day 8 of differentiation. Caspase 3/7 activity was found significantly
increased (P< 0.05; n¼ 3) in pNrf1 overexpressing cells
(1.40� 0.13-fold) compared with pEGFP transfected cells
(1.00� 0.05).
DISCUSSION
In this study we identified the gene repertoire directly regulated by
Nrf1 and showed that continuous overexpression of Nrf1 during
adipogenesis mainly stimulates cell proliferation, chemokine
activation, and apoptosis (Fig. 7). With regard to metabolism-
related processes, besides increased mitochondrial density, no
effects on energy metabolism were seen. We demonstrated that
long-term changes can drastically differ from short-term effects.
Long-term Nrf1 overexpression mimics insulin-resistant adipocytes
in contrast to the short-term insulin-sensitizing effect.
MITOCHONDRIAL DENSITY, ATP PRODUCTION, AND LIPID
HANDLING CAPACITY IN NRF1-OVEREXPRESSING 3T3-L1
ADIPOCYTES
Adipogenesis is characterized by increased lipid deposition and
triglyceride synthesis, but, Nrf1-overexpressing 3T3-L1 cells
displayed less and smaller lipid droplets than control pEGFP-
transfected cells at day 8 of differentiation. Reduced mitochondrial
function results in increased lipid droplet size [Vankoningsloo et al.,
2005], whereas, in contrast, Nrf1 overexpression has been
implicated to enhance mitochondrial function [Koh et al., 2007].
Therefore, we hypothesized that increased lipid oxidation might be
responsible for the reduced lipid deposition in pNrf1 overexpressing
3T3-L1 cells. Our results also indicated that increased mtDNA
content was not accompanied by higher ATP production. The
expression of mitochondrial assembly factors was not increased,
indicating that Nrf1-overexpression was not sufficient to assemble
functional mitochondria and stimulate mitochondrial function,
which was also observed by Baar et al. [2003]. The number of intact
mitochondria remains the same and, therefore, ROS production
capacity per mitochondrion will not change. In line with this, no
changes on gene expression level were observed in pathways related
to energy metabolism, indicating that the reduced lipid content was
not a result of increased lipid oxidation. Expression of a number of
genes involved in triglyceride synthesis, lipid transport and
packaging were decreased inNrf1 overexpressing cells, for example,
fat specific protein 27 (Fsp27), stearoyl-Coenzyme A desaturase 1
(Scd1), Fatty acid binding protein 4 (Fabp4) and cluster of
differentiation 36 (Cd36). Therefore, reduced lipid deposition is
most likely the result of reduced fatty acid synthesis [Rossmeisl et al.,
2000], and/or increased lipolysis, as seen with knock-out of genes
involved in lipid packaging, for example, perilipin (Plin) or Fsp27
[Nishino et al., 2008; Toh et al., 2008].
Since lipid accumulation is a key feature of late adipogenesis and
a frequently used parameter to analyze adipogenic capacity, we
JOURNAL OF CELLULAR BIOCHEMISTRY
wanted to test if the reduced lipid content seen in Nrf1-
overexpressing cells could be the result of reduced differentiation
capacity. Gene expression analysis of two key adipogenic
transcription factors, PPARg and C/EBPa, during differentiation
(Fig. 3) indicated that Nrf1 overexpression had no significant effect
on early adipogenesis. In addition, expression of Adipophilin (Adfp),
which is a constituent of the globule surface and a characteristic of
late differentiation and was increased as well in Nrf1-over-
expressing cells, and inhibitors of adipogenesis, like Delta like
kinase (Dlk) and GATA binding protein 2 (Gata2), were decreased in
Nrf1-overexpressing cells. This excludes reduced differentiation as a
possible explanation.
NRF1 INDUCED CELL PROLIFERATION
A number of genes up-regulated by Nrf1 contained a bZIP
transcription factor binding site and were involved in a variety
of processes, including proliferation and cell-cycle regulation,
apoptosis and chemokine/cytokine signaling. These results are
supported by increased expression of a number of genes involved in
cell-cycle regulation, including cMyc, Cyclin D1 (Ccnd1), and Ccnd3,
which are important regulators of cell proliferation and adipogen-
esis [Morrish et al., 2003; Fox et al., 2008]. In addition, C/EBPb and
C/EBPd, two bZIP containing transcription factors involved in
clonal expansion [Tang et al., 2003; Narayanan et al., 2004], were
also increased at day 8 by Nrf1 overexpression. As indicate above,
the ability to proliferate is unlikely the consequence of ‘‘slowing of
differentiation,’’ which would result in a relative increase of
preadipocytes capable of proliferation. We demonstrated that
expression of the early adipogenic regulators, adipocyte markers
and preadipocyte specific genes was not increased in Nrf1-
overexpressing cells. This data demonstrates that the pronounced
increase in cell proliferation can not be explained by the presence of
an increased number of preadipocytes in Nrf1-overexpressing wells.
Mitochondria induced cell-cycle regulation has previously been
shown in mouse embryonic fibroblast treated with mitochondrial
inhibitors, which resulted in either cell-cycle arrest, repair or cell-
death [Kulawiec et al., 2009]. Furthermore, the role of Nrf1 in cell-
cycle progression has previously been established by Cam et al.
[2004], and may explain the embryonic lethality in Nrf1�/� mice
[Huo and Scarpulla, 2001]. Overexpression of Nrf1 may cause
inappropriate proliferation, which is also a hallmark of cancer cells.
In line with this, Nrf1 has been previously associated as one of the
transcription factors involved in breast cancer malignant progres-
sion [Niida et al., 2008].
NRF1 INDUCES APOPTOSIS
Gene expression profiling showed that a number of pathways
involved in apoptosis were significantly changed in Nrf1-over-
expressing adipocytes. This was confirmed by an increased caspase
3/7 activity. Apoptosis in Nrf1-overexpressing adipocytes appeared
to be a result of Nrf1 induced expression of Fas, which has a bZIP
binding domain, and was possibly further stimulated by chemokine
activation and altered adipokine expression after prolonged Nrf1
overexpression. The observed increase in apoptosis does not
contradict an increase in cell number. Increased apoptosis is likely
only apparent in the final stages of differentiation, whereas there is
PROCESSES TRIGGERED BY NRF1 OVEREXPRESSION 1581

Fig. 4. Identification of direct and indirect Nrf1 targets during 3T3-L1 differentiation 3T3-L1 cells were transfected with pSPORT-Nrf1 or pEGFP empty vector and
differentiated. Total RNA was isolated at indicated time-points, subjected to qPCR and expression was normalized to the expression of Cyclophilin A (CypA). Sod2 (a), Cp (b) and
Saa3 (c) were considered as direct targets of Nrf1 (sign. altered�3 time-points). Hp (d) and Adipoq (e) were considered indirect targets of Nrf1. Error bars indicate SD (n¼ 3),�P� 0.05.
1582 PROCESSES TRIGGERED BY NRF1 OVEREXPRESSION JOURNAL OF CELLULAR BIOCHEMISTRY

Fig. 5. Representative electron microscopy pictures of pNrf1 transfected (a) and control pEGFP transfected (b) 3T3-L1 cells at day 8 of differentiation. Arrows indicate
mitochondria. Nrf1-transfected cells (a) have more electron dense and larger mitochondria than pEGFP transfected cells (b).
already a trend for increased proliferation from day 0 of
differentiation. Furthermore, Nrf1 also induced a number of genes
involved in anti-oxidant defense, for example, superoxide dis-
mutase 2 (Sod2). Although this feature was not clearly represented in
the pathway analysis, some key anti-oxidant genes were strongly
increased in Nrf1 overexpressing cells, for example, Sod2,
Ceruloplasmin (Cp), and Nuclear factor erythroid 2-related factor
1 (Nfe2l1). Excessive Sod2 expression could result in oxidative stress
hypersensitivity and stimulate apoptosis [Kowald et al., 2006], but
the relation between Nrf1 and oxidative stress response requires
further studying. Despite increased cMyc expression, Bcl2 expres-
sion was unchanged and mitochondria were not irregularly shaped
in Nrf1-overexpressing cells, therefore we do not expect mitochon-
dria dependent induction of apoptosis, as seen by Morrish et al.
[2003]. Although we can only speculate, since we did not measure
cytochrome c or mitochondrial membrane potential. Possibly, we
did not observe a similar effect in our Nrf1-overexpressing
adipocytes because our cells were not serum-depleted. In line with
Fig. 6. Size distribution mitochondria of pNrf1 and pEGFP transfected 3T3-L1 adipoc
images. pNrf1-transfected cells contained larger mitochondria than pEGFP-transfecte
JOURNAL OF CELLULAR BIOCHEMISTRY
their results, Nrf1-overexpression in 3T3-L1 cells showed a trend of
enlarged andmore electron densemitochondria (Fig. 5), likely due to
increased import of mitochondrial proteins.
LONG-TERM NRF1 OVEREXPRESSION INDUCES INFLAMMATION
AND INSULIN-RESISTANT ADIPOKINE EXPRESSION PROFILE
Our data indicate that inflammation in Nrf1-overexpressing cells is
the result of both primary Nrf1 targets, as well as triggers of
inflammation induced secondary to Nrf1 overexpression. Nrf1
increased a number of cytokines, for example, cluster of
differentiation 47 and 74 (Cd47 and Cd74), which attract
macrophages [Leng et al., 2003], and chemokines like C-X-C motif
chemokine (Cxcl) 2 and 5, chemokine ligand (Ccl) 2 and 7. In
addition, a number of adipokines, were amongst the strongest Nrf1
induced genes at day 8, but some were also increased at earlier time-
points (Fig. 4). Strong and immediate induction of, for example,
Saa3 and Cp indicate that they are direct targets of Nrf1, and that
their induction is not a consequence of increased cell density and/or
ytes. Mitochondrial size was quantified using Image J analysis of electron microscopy
d cells.
PROCESSES TRIGGERED BY NRF1 OVEREXPRESSION 1583

Fig. 7. Processes altered as a result of Nrf1 overexpression in 3T3-L1
adipocytes. Solid lines indicate directly stimulated processes, and dashed lines
indicate secondary effects of NRF1 Gene symbols represent genes involved in
the implicated processes. The change in gene expression induced by Nrf1-
overexpressing is indicated with arrows; increased expression ("), decreasedexpression (#), or no change (¼).
altered adipokine expression pattern later in differentiation, as seen
with, for example, Hp and Adipoq. In our study, adiponectin was
strongly reduced at days 6 and 8 of differentiation, despite increased
mtDNA copy number and normal ATP production in Nrf1-
overexpressing cells. These results oppose an earlier study which
showed that 2 days overexpression of Nrf1 resulted in increased
mtDNA content and increased adiponectin expression in 3T3-L1
adipocytes [Koh et al., 2007]. Based on these findings we
hypothesize that reduced adiponectin expression is probably not
solely a result of reduced mitochondrial content and/or functioning,
but from altered adipokine signaling, for example, increased TNFa
and IL6 expression. Taken together, our results indicate that Nrf1
can induce inflammation in adipocytes directly, which likely affects
lipid handling in adipocytes [Gustafson and Smith, 2006]. Nrf1-
overexpression probably triggers a pro-survival mechanism, which
is also seen after exposure of cells to the endotoxin lipopolysac-
charide (LPS) [Suliman et al., 2003]. We do not expect that our
results are an artifact from transfection induced LPS-contamination,
since inflammation is predominantly present in late adipogenesis
and key adipogenic transcription factors are not decreased, and
early adipogenesis is not inhibited [Chung et al., 2006]. Insulin
resistance is reflected by altered adipokine expression profile,
inflammation and increased lipolysis. All these parameters were
observed in Nrf1-overexpressing cells at day 8 of differentiation.
Therefore, we concluded that insulin resistance is a (secondary)
result of Nrf1-overexpression. Exploring the exact mechanism by
which Nrf1 triggers insulin resistance falls outside the scope of this
study.
In summary, our results demonstrate that Nrf1 is a key regulator
of a broad variety of processes (Fig. 7). Some properties of Nrf1 are
beneficial to combat T2DM and lipodystrophy, like stimulation
mitochondrial biogenesis, anti-oxidant, and cell proliferation, while
others, for example, stimulation of inflammation and apoptosis,
1584 PROCESSES TRIGGERED BY NRF1 OVEREXPRESSION
worsen insulin resistance. These data indicate that direct Nrf1
overexpression is not recommended, but specific post-transcrip-
tional regulation, or specific activation of Nrf1 downstream targets
could be beneficial for increasing adipocyte tissue mass thereby
reducing lipid deposition in peripheral tissues [Gugneja and
Scarpulla, 1997; Wang et al., 2006]. In addition, our results show
that despite promising short-term Nrf1 overexpression, long-term
secondary effects can drastically differ.
ACKNOWLEDGMENTS
We would like to thank H. Duimel for his assistance in the electronmicroscopy studies. This research was funded by the Dutch diabetesfoundation (DFN 2004.00.040) and the Kerry foundation.
REFERENCES
Akaike H. 1973. Information theory and an extension of the maximumlikelihood principle. In: Petrov BN, Csaki F, editors. Second internationalsymposium on inference theory. Budapest: Akademiai Kiad. pp 267–281.
Arany Z. 2008. PGC-1 coactivators and skeletal muscle adaptations in healthand disease. Curr Opin Genet Dev 18:426–434.
Baar K, Song Z, Semenkovich CF, Jones TE, Han DH, Nolte LA, Ojuka EO,Chen M, Holloszy JO. 2003. Skeletal muscle overexpression of nuclearrespiratory factor 1 increases glucose transport capacity. FASEB J17:1666–1673.
Bogacka I, Xie H, Bray GA, Smith SR. 2005. Pioglitazone induces mitochon-drial biogenesis in human subcutaneous adipose tissue in vivo. Diabetes54:1392–1399.
Cam H, Balciunaite E, Blais A, Spektor A, Scarpulla RC, Young R, Kluger Y,Dynlacht BD. 2004. A common set of gene regulatory networks linksmetabolism and growth inhibition. Mol Cell 16:399–411.
Choo HJ, Kim JH, Kwon OB, Lee CS, Mun JY, Han SS, Yoon YS, Yoon G, ChoiKM, Ko YG. 2006. Mitochondria are impaired in the adipocytes of type 2diabetic mice. Diabetologia 49:784–791.
Chung S, Lapoint K, Martinez K, Kennedy A, Boysen Sandberg M, McIntoshMK. 2006. Preadipocytes mediate lipopolysaccharide-induced inflammationand insulin resistance in primary cultures of newly differentiated humanadipocytes. Endocrinology 147:5340–5351.
Dahlman I, Forsgren M, Sjogren A, Nordstrom EA, Kaaman M, Naslund E,Attersand A, Arner P. 2006. Downregulation of electron transport chaingenes in visceral adipose tissue in type 2 diabetes independent of obesity andpossibly involving tumor necrosis factor-alpha. Diabetes 55:1792–1799.
Dai M, Wang P, Boyd AD, Kostov G, Athey B, Jones EG, Bunney WE, MyersRM, Speed TP, Akil H, Watson SJ, Meng F. 2005. Evolving gene/transcriptdefinitions significantly alter the interpretation of GeneChip data. NucleicAcids Res 33:e175.
Dennis G, Jr., Sherman BT, Hosack DA, Yang J, Gao W, Lane HC, LempickiRA. 2003. DAVID: Database for annotation, visualization, and integrateddiscovery. Genome Biol 4:P3.
Doniger SW, Salomonis N, Dahlquist KD, Vranizan K, Lawlor SC, Conklin BR.2003. MAPPFinder: Using gene ontology and GenMAPP to create a globalgene-expression profile from microarray data. Genome Biol 4:R7.
Fox KE, Colton LA, Erickson PF, Friedman JE, Cha HC, Keller P, MacDougaldOA, Klemm DJ. 2008. Regulation of cyclin D1 and Wnt10b gene expressionby cAMP-responsive element-binding protein during early adipogenesisinvolves differential promoter methylation. J Biol Chem 283:35096–35105.
Gerhart-Hines Z, Rodgers JT, Bare O, Lerin C, Kim SH, Mostoslavsky R, AltFW, Wu Z, Puigserver P. 2007. Metabolic control of muscle mitochondrial
JOURNAL OF CELLULAR BIOCHEMISTRY

function and fatty acid oxidation through SIRT1/PGC-1alpha. EMBO J26:1913–1923.
Gugneja S, Scarpulla RC. 1997. Serine phosphorylation within a conciseamino-terminal domain in nuclear respiratory factor 1 enhances DNAbinding. J Biol Chem 272:18732–18739.
Guilherme A, Virbasius JV, Puri V, Czech MP. 2008. Adipocyte dysfunctionslinking obesity to insulin resistance and type 2 diabetes. Nat RevMol Cell Biol9:367–377.
Gustafson B, Smith U. 2006. Cytokines promote Wnt signaling and inflam-mation and impair the normal differentiation and lipid accumulation in 3T3-L1 preadipocytes. J Biol Chem 281:9507–9516.
Ho Sui SJ, Mortimer JR, Arenillas DJ, Brumm J, Walsh CJ, Kennedy BP,Wasserman WW. 2005. oPOSSUM: Identification of over-represented tran-scription factor binding sites in co-expressed genes. Nucleic Acids Res33:3154–3164. http://brainarray.mbni.med.umich.edu, pp chip descriptionfile.
Huo L, Scarpulla RC. 2001. Mitochondrial DNA instability and peri-implan-tation lethality associated with targeted disruption of nuclear respiratoryfactor 1 in mice. Mol Cell Biol 21:644–654.
Ihaka R, Gentleman R. 1996. R: A language for data analysis and graphics.J Comput Graph Stat 5:299–314.
Koh EH, Park JY, Park HS, Jeon MJ, Ryu JW, Kim M, Kim SY, Kim MS, KimSW, Park IS, Youn JH, Lee KU. 2007. Essential role of mitochondrial functionin adiponectin synthesis in adipocytes. Diabetes 56:2973–2981.
Kowald A, Lehrach H, Klipp E. 2006. Alternative pathways as mechanism forthe negative effects associated with overexpression of superoxide dismutase.J Theor Biol 238:828–840.
Kulawiec M, Ayyasamy V, Singh KK. 2009. p53 regulates mtDNA copynumber and mitocheckpoint pathway. J Carcinog 8:8.
Leng L, Metz CN, Fang Y, Xu J, Donnelly S, Baugh J, Delohery T, Chen Y,Mitchell RA, Bucala R. 2003. MIF signal transduction initiated by binding toCD74. J Exp Med 197:1467–1476.
Lindsey J. 1999. Models for repeated measurements. 2nd edition. Oxford:Oxford University Press.
Lowell BB, Shulman GI. 2005. Mitochondrial dysfunction and type 2 dia-betes. Science 307:384–387.
Lv Q, Wang Y, Wang W, Wang L, Zhou X. 2009. Effect of pioglitazone onvisfatin expression in 3T3-L1 adipocytes and SD rats. Endocr Res 34:130–141.
Mallon PW, Unemori P, Sedwell R, Morey A, Rafferty M, Williams K,Chisholm D, Samaras K, Emery S, Kelleher A, Cooper DA, Carr A. 2005.In vivo, nucleoside reverse-transcriptase inhibitors alter expression of bothmitochondrial and lipid metabolism genes in the absence of depletion ofmitochondrial DNA. J Infect Dis 191:1686–1696.
Mootha VK, Lindgren CM, Eriksson KF, Subramanian A, Sihag S, Lehar J,Puigserver P, Carlsson E, Ridderstrale M, Laurila E, Houstis N, Daly MJ,Patterson N, Mesirov JP, Golub TR, Tamayo P, Spiegelman B, Lander ES,Hirschhorn JN, Altshuler D, Groop LC. 2003. PGC-1alpha-responsive genesinvolved in oxidative phosphorylation are coordinately downregulated inhuman diabetes. Nat Genet 34:267–273.
Morrish F, Giedt C, Hockenbery D. 2003. c-MYC apoptotic function ismediated by NRF-1 target genes. Genes Dev 17:240–255.
Munoz-Malaga A, Bautista J, Salazar JA, Aguilera I, Garcia R, Chinchon I,SeguraMD, Campos Y, Arenas J. 2000. Lipomatosis, proximal myopathy, andthe mitochondrial 8344 mutation. A lipid storage myopathy? Muscle Nerve23:538–542.
JOURNAL OF CELLULAR BIOCHEMISTRY
Narayanan K, Ramachandran A, Peterson MC, Hao J, Kolsto AB, FriedmanAD, George A. 2004. The CCAAT enhancer-binding protein (C/EBP)beta andNrf1 interact to regulate dentin sialophosphoprotein (DSPP) gene expressionduring odontoblast differentiation. J Biol Chem 279:45423–45432.
Niida A, Smith AD, Imoto S, Tsutsumi S, Aburatani H, ZhangMQ, Akiyama T.2008. Integrative bioinformatics analysis of transcriptional regulatory pro-grams in breast cancer cells. BMC Bioinform 9:404.
Nishino N, Tamori Y, Tateya S, Kawaguchi T, Shibakusa T, Mizunoya W,Inoue K, Kitazawa R, Kitazawa S, Matsuki Y, Hiramatsu R, Masubuchi S,Omachi A, Kimura K, Saito M, Amo T, Ohta S, Yamaguchi T, Osumi T, ChengJ, Fujimoto T, Nakao H, Nakao K, Aiba A, Okamura H, Fushiki T, Kasuga M.2008. FSP27 contributes to efficient energy storage in murine white adipo-cytes by promoting the formation of unilocular lipid droplets. J Clin Invest118:2808–2821.
Patti ME, Butte AJ, Crunkhorn S, Cusi K, Berria R, Kashyap S, Miyazaki Y,Kohane I, Costello M, Saccone R, Landaker EJ, Goldfine AB, Mun E, DeFronzoR, Finlayson J, Kahn CR,Mandarino LJ. 2003. Coordinated reduction of genesof oxidative metabolism in humans with insulin resistance and diabetes:Potential role of PGC1 and NRF1. Proc Natl Acad Sci USA 100:8466–8471.
Rossmeisl M, Syrovy I, Baumruk F, Flachs P, Janovska P, Kopecky J. 2000.Decreased fatty acid synthesis due to mitochondrial uncoupling in adiposetissue. FASEB J 14:1793–1800.
Salomonis N, Hanspers K, Zambon AC, Vranizan K, Lawlor SC, Dahlquist KD,Doniger SW, Stuart J, Conklin BR, Pico AR. 2007. GenMAPP2: New featuresand resources for pathway analysis. BMC Bioinform 8:217.
Smyth S, Heron A. 2006. Diabetes and obesity: The twin epidemics. Nat Med12:75–780.
Sugii S, Olson P, Sears DD, Saberi M, Atkins AR, Barish GD, Hong SH, CastroGL, Yin YQ, Nelson MC, Hsiao G, Greaves DR, Downes M, Yu RT, Olefsky JM,Evans RM. 2009. PPARgamma activation in adipocytes is sufficientfor systemic insulin sensitization. Proc Natl Acad Sci USA 106:22504–22509.
Suliman HB, Carraway MS, Welty-Wolf KE, Whorton AR, Piantadosi CA.2003. Lipopolysaccharide stimulates mitochondrial biogenesis via activationof nuclear respiratory factor-1. J Biol Chem 278:41510–41518.
Tang QQ, Otto TC, Lane MD. 2003. CCAAT/enhancer-binding protein beta isrequired for mitotic clonal expansion during adipogenesis. Proc Natl AcadSci USA 100:850–855.
Timmons JA, Norrbom J, Scheele C, Thonberg H, Wahlestedt C, Tesch P.2006. Expression profiling following local muscle inactivity in humansprovides new perspective on diabetes-related genes. Genomics 87:165–172.
Toh SY, Gong J, Du G, Li JZ, Yang S, Ye J, Yao H, Zhang Y, Xue B, Li Q, YangH, Wen Z, Li P. 2008. Up-regulation of mitochondrial activity and acquire-ment of brown adipose tissue-like property in the white adipose tissue offsp27 deficient mice. PLoS One 3:e2890.
Vankoningsloo S, PiensM, Lecocq C, Gilson A, De PauwA, Renard P, DemazyC, Houbion A, Raes M, Arnould T. 2005. Mitochondrial dysfunction inducestriglyceride accumulation in 3T3-L1 cells: Role of fatty acid beta-oxidationand glucose. J Lipid Res 46:1133–1149.
Wang C, Li Z, Lu Y, Du R, Katiyar S, Yang J, Fu M, Leader JE, Quong A,Novikoff PM, Pestell RG. 2006. Cyclin D1 repression of nuclear respiratoryfactor 1 integrates nuclear DNA synthesis and mitochondrial function. ProcNatl Acad Sci USA 103:11567–11572.
Wild S, Roglic G, Green A, Sicree R, King H. 2004. Global prevalence ofdiabetes: estimates for the year 2000 and projections for 2030. Diabetes Care27:1047–1053.
PROCESSES TRIGGERED BY NRF1 OVEREXPRESSION 1585