Embed Size (px)
Citation preview

1
Prokaryotic Single-Cell RNA Sequencing by In Situ Combinatorial Indexing
Sydney B. Blattman1,2,3,4, Wenyan Jiang1,2,3,4, Panos Oikonomou1,2,3, Saeed Tavazoie1,2,3*
1Department of Biological Sciences, Columbia University, New York City, New York, United States 2Department of Systems Biology, Columbia University, New York City, New York, United States 3Department of Biochemistry and Molecular Biophysics, Columbia University, New York City, New York, United States 4These authors contributed equally to this work * E-mail: [email protected]
.CC-BY-NC-ND 4.0 International licensenot certified by peer review) is the author/funder. It is made available under aThe copyright holder for this preprint (which wasthis version posted December 6, 2019. . https://doi.org/10.1101/866244doi: bioRxiv preprint

2
Abstract Despite longstanding appreciation of gene expression heterogeneity in isogenic bacterial populations, affordable and scalable technologies for studying single bacterial cells have been limited. While single-cell RNA sequencing (scRNA-seq) has revolutionized studies of transcriptional heterogeneity in diverse eukaryotic systems, application of scRNA-seq to prokaryotic cells has been hindered by their low levels of mRNA, lack of mRNA polyadenylation, and thick cell walls. Here, we present Prokaryotic Expression-profiling by Tagging RNA In Situ and sequencing (PETRI-seq), a high-throughput prokaryotic scRNA-seq pipeline that overcomes these obstacles. PETRI-seq uses in situ combinatorial indexing to barcode transcripts from tens of thousands of cells in a single experiment. We have demonstrated that PETRI-seq effectively captures single cell transcriptomes of Gram-negative and Gram-positive bacteria with high purity and little bias. Although bacteria express only thousands of mRNAs per cell, captured mRNA levels were sufficient to distinguish between the transcriptional states of single cells within isogenic populations. In E. coli, we were able to identify single cells in either stationary or exponential phase and define consensus transcriptomes for these sub-populations. In wild type S. aureus, we detected a rare population of cells undergoing prophage induction. We anticipate that PETRI-seq will be widely useful for studying transcriptional heterogeneity in microbial communities. Background
Bacterial communities, including genetically homogenous populations, are typically composed of cells in non-identical gene expression states [1, 2]. Gene expression heterogeneity underlies many fundamental bacterial phenomena including communication [3], pathogenicity [4], competence [2], biofilm formation [5, 6] and antibiotic persistence [7]. Elucidation of these processes at a single-cell level could substantially improve our understanding of bacterial evolution and community structures and guide rational development of anti-microbial strategies. However, conventional bacterial single-cell methodologies, such as in situ hybridization [8, 9] and fluorescent reporters [10], allow only a few genes to be monitored at a time. There is a pressing need to develop methods capable of profiling global molecular signatures of single bacterial cells.
Recent developments in high-throughput single-cell RNA sequencing (scRNA-seq)
technology have enabled rapid characterization of cellular diversity within complex eukaryotic tissues [11-22]. Despite these advances, comparable tools to study the transcriptomes of individual bacterial cells remain limited (Figure S1). Existing bacterial techniques are low throughput, involving manual isolation of single cells followed by reverse transcription (RT) and amplification reactions for one cell at a time. In 2011, the first single-cell microarray study was described for a few Burkholderia thailandensis cells [23], each containing 2 pg of RNA, orders of magnitude more than many bacterial species of interest [24]. More recent reports described sequencing of six Synechocystis sp. PCC6803 cells [25] and three Porphyromonas somerae cells [26], each of which contains 1-5 fg of RNA. These methods comprehensively characterized the transcriptomes of a few single cells. However, they are prone to contamination and not equipped to study highly heterogeneous bacterial communities and rare populations like persisters [27] across thousands of cells.
Development of high-throughput bacterial scRNA-seq has lagged behind due to numerous technical challenges. Current massively parallel eukaryotic scRNA-seq methods typically require custom microfluidics to co-encapsulate a single cell with a uniquely barcoded bead in a compartment, often a droplet [15, 16, 18] or microwell [14, 17]. These approaches rely on two key properties of many eukaryotic cells, specifically that they are easily lysed with detergent to release their RNA and that their poly-adenylated mRNAs can be effectively
.CC-BY-NC-ND 4.0 International licensenot certified by peer review) is the author/funder. It is made available under aThe copyright holder for this preprint (which wasthis version posted December 6, 2019. . https://doi.org/10.1101/866244doi: bioRxiv preprint

3
captured by beads coated with poly(T) primers. Adaptation of these approaches for bacteria is thwarted by the presence of thick prokaryotic cell wall [28], which makes lysis challenging, and the lack of poly-adenylated mRNAs for effective capture.
Given these considerations, we identified in situ combinatorial indexing [29] as an alternative basis upon which to develop a method for high-throughput prokaryotic scRNA-seq. Two conceptually similar eukaryotic methods, single-cell combinatorial indexing RNA sequencing (sci-RNA-seq) [19, 20] and split-pool ligation-based transcriptome sequencing (SPLiT-seq) [21], rely on cells themselves as compartments for barcoding, which abrogates the need for cell lysis in droplets or microwells. These methods are also amenable to RT with random hexamers instead of poly(T) primers [21]. With just pipetting steps and no complex instruments, individual transcriptomes of hundreds of thousands of fixed cells are uniquely labeled by multiple rounds of splitting, barcoding, and pooling in microplates.
Here, we present Prokaryotic Expression-profiling by Tagging RNA In situ and
sequencing (PETRI-seq), a high-throughput, affordable, and easy-to-perform scRNA-seq method capable of distinguishing the transcriptional states of tens of thousands of wild type Gram-positive (S. aureus USA300) and Gram-negative (E. coli MG1655) cells. Our approach captures mRNA with little bias, approaching bulk expression levels when cell transcriptomes are aggregated. Although bacteria only express thousands of mRNAs per cell [1, 30, 31] in contrast to hundreds of thousands in mammalian cells [32], our results show that captured transcript levels are sufficient to distinguish sub-populations at different growth stages and gain novel insights into rare cell sub-populations. PETRI-seq has the potential to elucidate various bacterial phenotypes, including persistence, biofilm formation, and host-pathogen interactions. PETRI-seq could also ultimately enable high-resolution capture of transcriptional dynamics in microbial communities, including unculturable components, a major current challenge in microbiology [33].
Results A Method for Single-Cell RNA Sequencing of Prokaryotic Cells PETRI-seq (Figure 1) consists of three experimental components: cell preparation, split-pool barcoding, and library preparation, which are detailed in Figure S2 and Methods. Cell preparation includes fixation to maintain cell integrity, cell wall permeabilization to allow reagent diffusion into cells, and DNase treatment to remove genomic background. As cell preparation is critical to the success of PETRI-seq, we had to optimize key parameters to establish a working protocol for E. coli. Cells were briefly pelleted before fixation with 4% formaldehyde, as adding formaldehyde directly to the cell culture without pelleting reduced RT efficiency (Figure S3A), possibly due to excess cross-linking with media components. We confirmed that fixation did not alter the bulk transcriptome (Figure S3B). Cells were next resuspended in 50% ethanol, which has been used previously for prokaryotic in situ PCR as a storage solution [34], though we have yet to test cellular and RNA integrity after long-term storage. Ethanol did not significantly change the cDNA yield from in situ RT (Figure S3C). Lysozyme was subsequently added to permeabilize cells for in situ RT (Figure S3D). Cells were next treated with DNase to remove background genomic DNA, and DNase was inactivated by mild heat treatment. We confirmed in situ DNase activity by qPCR (Figure S3E) and verified DNase inactivation (Figure S3F,G). Before proceeding to RT, cells were imaged to confirm they were intact (Figure S3H) and counted.
.CC-BY-NC-ND 4.0 International licensenot certified by peer review) is the author/funder. It is made available under aThe copyright holder for this preprint (which wasthis version posted December 6, 2019. . https://doi.org/10.1101/866244doi: bioRxiv preprint
4
In the next stage, we performed split-pool barcoding. Cells were distributed across a microplate for RT, with different short DNA barcodes in each well. After RT, cells were pooled and redistributed across new microplates for two rounds of barcoding by ligation to the cDNA. We reduced the length of the overhang for each ligation relative to the eukaryotic protocol [21], which made it possible to use only 75 cycles of sequencing instead of 150 cycles and decrease the sequencing cost by almost 50% (Table S1B). We demonstrated effective barcode ligation with this modification (Figure S3I). After three rounds of barcoding, cells contained cDNA labeled with one of nearly one million possible three-barcode combinations (BCs). We counted the cells and lysed roughly 10,000 cells for library preparation. The number of cells was chosen to ensure a low multiplet frequency, which is the percent of non-empty BCs containing more than one cell [35]. For a library of 10,000 cells, the expected multiplet frequency based on a Poisson distribution is 0.56%.
Finally, cDNA was prepared for Illumina sequencing. We used AMPure XP beads to purify cDNA from cell lysates (Figure S3J). AMPure purification is faster and less expensive than streptavidin purification used previously in eukaryotic SPLiT-seq [21]. Importantly, primer biotinylation is a significant initial expense, which is avoided by AMPure purification (Table S1C). To make double-stranded cDNA, we compared second-strand synthesis [36] and limited-cycle PCR after template switching [12]. We found that the former had a significantly higher yield (Figure S3K,L). We then performed tagmentation followed by PCR using the transposon-inserted sequence and the overhang upstream of the third barcode as primer sequences, thereby preventing amplification of any undigested genomic DNA. The libraries were sequenced and analyzed using the pipeline detailed in Figure S4 and Methods. BCs with at least 40 total transcripts, or unique molecular identifiers (UMIs) [37], were considered for further analysis (Figure S4E,F,G). PETRI-Seq Captures Transcriptomes of Single Cells To demonstrate the ability of PETRI-seq to capture transcriptomes of single cells, we performed a species-mixing experiment involving three populations of cells: GFP- and RFP-expressing E. coli and wild type S. aureus (Figure 2A). From 9,642 sequenced BCs, we observed that BCs were highly species-specific with 99.6% clearly assigned to one species (Figure 2B). We calculated an overall multiplet frequency of 1.8% after accounting for multiplets of the same species and non-equal representation of the two species [35]. Though this frequency exceeds the Poisson expectation of 0.56%, it is comparable to existing eukaryotic methods [18, 20]. Within the E. coli population, we included a population of cells constitutively expressing GFP [10] and another population expressing RFP induced by anhydrotetracycline (aTc) [38]. E. coli BCs were highly strain-specific with 98.6% assigned to a single population (Figure S5A). With this confirmation that PETRI-seq successfully captured single-cell transcriptomes, we were able to quantify the number of transcripts per cell. We captured a mean of 52.6 and median of 41 mRNAs per GFP-containing E. coli cell (Figure 2C). From these same cells, we captured a mean of 384 and median of 292 total RNAs per cell (Figure S5B). We captured fewer mRNA transcripts per RFP-expressing E. coli cell (Figure S5C), likely due to their reduced growth rate during aTc induction (Figure S5D). There were also 204 ambiguous cells, which could not be assigned to the RFP or GFP population because they did not contain any plasmid transcripts. By excluding these ambiguous cells, we risked over-estimating the true levels of mRNA captured per cell in each population. We thus considered the extreme cases where all ambiguous cells were part of one population or the other (Figures 2C,S5C). The broader population of 875 ambiguous and GFP-expressing cells contained a mean of 44.5 and median of 33 mRNAs per cell. Based on estimates that single E. coli cells contain 2000-8000 mRNAs [1, 30, 31], we estimate our capture rate to be roughly 0.5-2%. In the S. aureus
.CC-BY-NC-ND 4.0 International licensenot certified by peer review) is the author/funder. It is made available under aThe copyright holder for this preprint (which wasthis version posted December 6, 2019. . https://doi.org/10.1101/866244doi: bioRxiv preprint

5
population, we captured a mean of 20.6 and median of 18 mRNAs per cell (Figure 2D). S. aureus cells may contain fewer mRNAs than E. coli cells because of their smaller cell size and genome [39], though there may also be technical differences affecting capture. Performing molecular reactions inside of cells raises the possibility that RNA capture could be biased by specific cellular contexts. Prior results in eukaryotic cells revealed a bias against rRNA transcripts during in situ RT [21], which is mildly recapitulated in our data (Figure S5E). 87% of sense E. coli transcripts were mapped to rRNA, while previous reports [40] and our own bulk data (not shown) found closer to 96% rRNA. Importantly, we observed strong correlations between combined single-cell transcriptomes from PETRI-seq and cDNA libraries prepared by standard RT for both E. coli and S. aureus (Figure 2E,F), despite the capture bias against rRNA. Our single-cell transcriptomes were reproducible, as shown by the strong correlation between the aggregated transcriptomes of GFP-expressing E. coli cells from two independent libraries (Figure 2G). PETRI-Seq Classifies Single Cells by Growth Stage
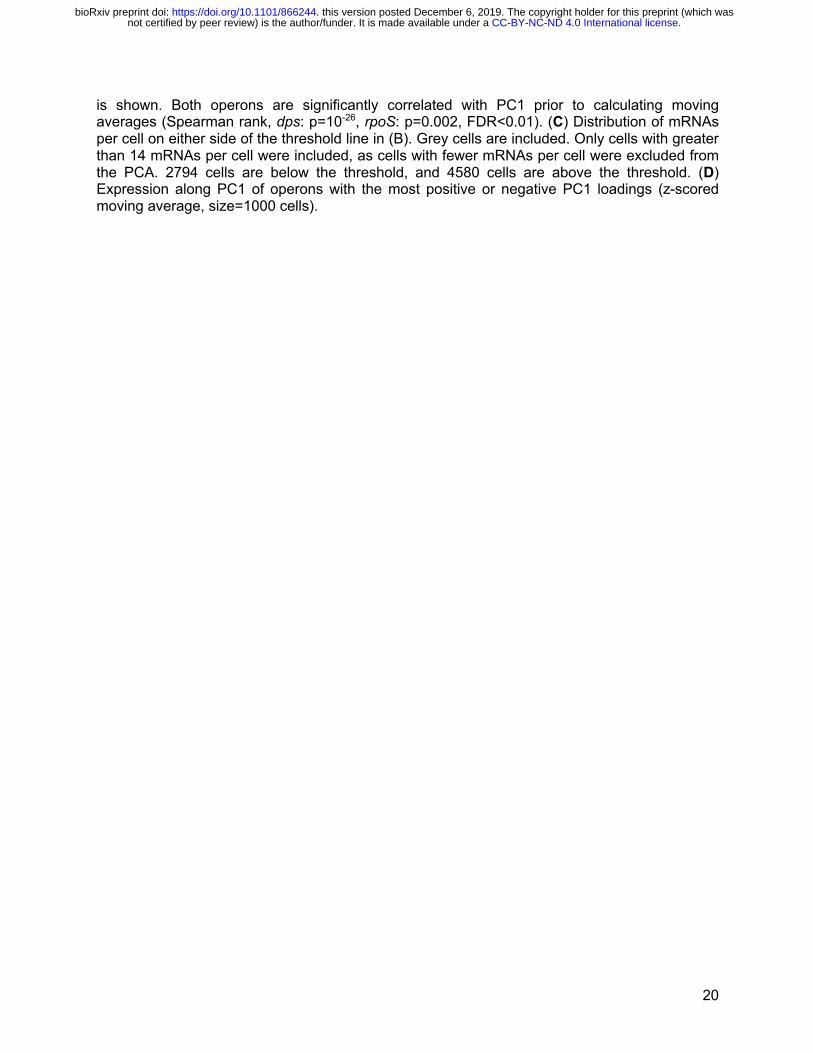
We next sought to determine the capacity of PETRI-seq to distinguish between cells in different growth states. As a proof-of-concept, we mixed E. coli cells in two well-characterized growth phases to create a population resembling naturally arising transcriptional heterogeneity. Specifically, we implemented PETRI-seq on a combined population of GFP-expressing exponential and aTc-induced RFP-expressing stationary E. coli (Figure 3A). We applied unsupervised dimensionality reduction (Principal Component Analysis—PCA [41]) to visualize the low-dimensional structure underlying the diversity of transcriptional states. For the PCA calculation, we considered only cells containing at least 15 mRNAs to avoid spurious effects from cells with extremely low mRNA content. Without considering plasmid genes, we observed robust separation of two populations along principal component 1 (PC1). We used the plasmid genes to classify these populations as RFP-containing stationary and GFP-containing exponential cells (Figure 3B, bottom). We assigned a threshold value for PC1 to distinguish between the two populations and found that 99% of plasmid-containing cells below the threshold expressed the GFP plasmid, and 95% of plasmid-containing cells above the threshold expressed the RFP plasmid. Overall, 98% of all plasmid-containing cells were on the expected side of the threshold line. Of the 7374 cells analyzed, 61% did not contain any plasmid transcripts, so their growth state was at first ambiguous (grey points in PCA). However, we used the PC1 threshold to predict the states of the ambiguous cells and found that 89% were stationary cells. Over-representation of stationary cells in the ambiguous population was not surprising as plasmid expression in stationary cells was generally lower than in exponential cells. Further analysis of the populations determined by the PC1 threshold revealed a mean of 69.2 and median of 51.0 mRNAs per exponential cell, while each stationary cell contained a mean of 34.9 and median of 29.0 mRNAs (Figure 3C). Previous reports have found that stationary cells express fewer mRNAs than exponential cells [42]. The discrepancy in our data also may be due to reduced mRNA levels upon RFP induction by aTc. Lastly, we showed that separation of the two transcriptional states was similarly robust in another biological replicate (Figure S6A) or when operon counts were normalized using sctransform [43], an alternative method (Figure S6B). We investigated expression patterns for operons and gene ontology (GO) terms for the two biologically distinct populations. We confirmed that rpoS, the stationary phase sigma-factor [44], and dps, a DNA-binding protein essential for cellular transition into stationary phase [45], were upregulated along PC1, as expected in the direction of stationary cells (Figure 3B, middle). Consistent with induction of the stringent response [46], stationary cells showed a large-scale
.CC-BY-NC-ND 4.0 International licensenot certified by peer review) is the author/funder. It is made available under aThe copyright holder for this preprint (which wasthis version posted December 6, 2019. . https://doi.org/10.1101/866244doi: bioRxiv preprint

6
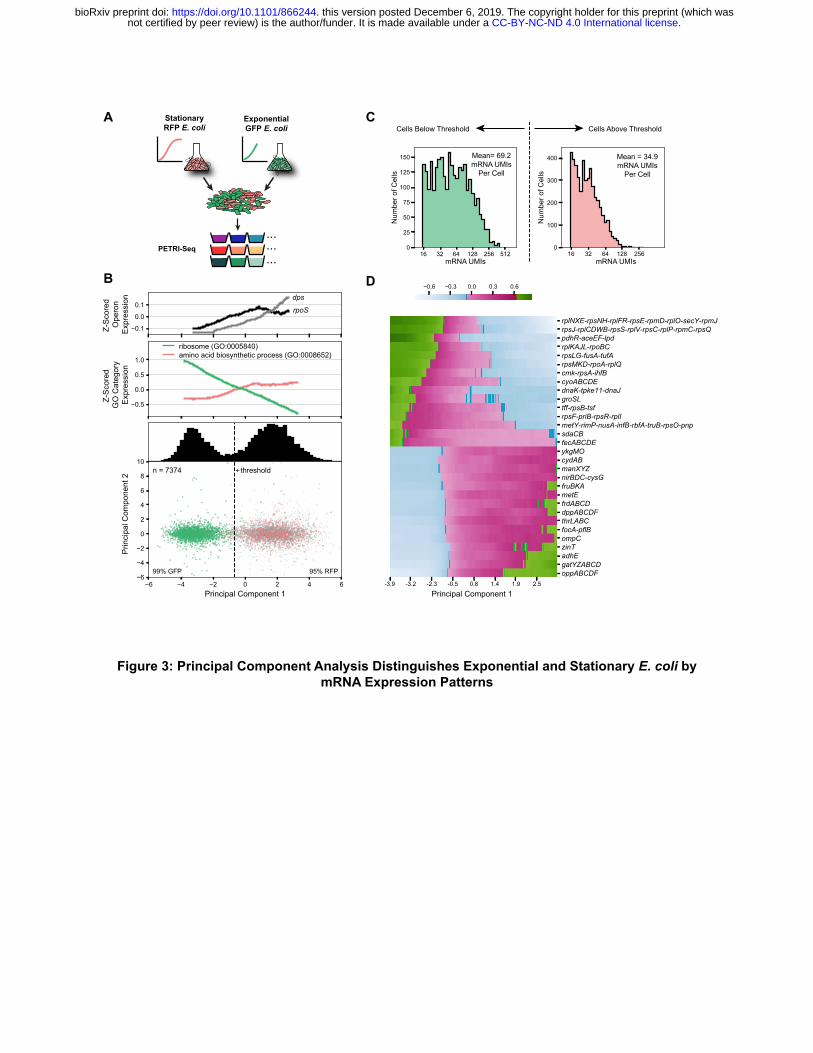
reduction in ribosomal protein expression as well as an increase in expression of amino acid biosynthetic operons (Figure 3B, Top; Figure 3D). oppABCDF, a highly expressed operon encoding the oligopeptide permease, was most strongly correlated with the transition to stationary phase, based on its PC1 loading (Figure 3D), and has been previously shown to be induced during phosphate starvation [47]. Cytochrome oxidase expression also informed the identification of exponential and stationary phase cells. While stationary E. coli cells expressed higher levels of cytochrome D (cydAB), exponential cells expressed more cytochrome O (cyoABCDE). This shift in cytochrome oxidase expression based on growth phase has been well-characterized [48]. Though PETRI-seq captured ~50 mRNAs per bacterial cell, it was sufficient to identify groups of single cells in the same gene expression state. We hypothesized that transcriptomes from similar cells could be combined to define a consensus state for a particular sub-population and that this characterization could be continuously improved by increasing the number of cells in the library. To test this hypothesis, we generated exponential or stationary phase transcriptomes by aggregating the expression counts for single cells of either type as determined by the first principal component of our PCA (Figure 3B, Bottom) and determined the correlations between these aggregated transcriptomes and independently prepared bulk libraries (Figure S7A,B). We repeated this calculation 1,000 times after sampling different numbers of cells ranging from 50 to 7374 cells (Figure S7C,D). Our analysis confirmed the expectation that as more cells were included in the library, the correlation with an independently prepared bulk library from cells in the same growth state increased. It also appeared that the correlations would continue to increase if more cells were sequenced. Notably, the correlation of either single cell type with both bulk libraries increased as cells were added, but the correlations were stronger and increasing at a greater rate for single-cell/bulk libraries of cells in the same state (colored curves in Figure S7C,D), indicating that the aggregated single cells were approaching a transcriptome reflecting their growth state. This analysis demonstrated that by aggregating many cells with similar expression profiles, PETRI-seq could be used to characterize the transcriptomes of sub-populations that might be otherwise difficult to isolate from bulk RNA-seq. PETRI-Seq Discovers A Rare Sub-Population Undergoing Prophage Induction in S. aureus scRNA-seq enables characterization of rare populations exhibiting distinct gene expression programs and phenotypes. We applied PCA to 5,604 S. aureus single-cell transcriptomes generated by PETRI-seq (Figure S8A) and found that the eight operons most highly correlated with PC1 (Figure S8B) were lytic genes of prophage ϕSA3usa (Figure S8C, red arrows) [49, 50]. Cells expressing these operons diverged from the rest of the population along PC1 (Figure S8A, red points), indicating that PC1 might be capturing rare prophage induction in the S. aureus culture. Within the small population, 3 cells exhibited dramatic upregulation of phage lytic transcripts reaching roughly 80% of these single-cell transcriptomes (Figure S8D). The remaining 18 cells contained fewer than 10% phage transcripts. In further analysis of the heterogeneity in gene expression across the entire S. aureus population, we found that for most operons, transcriptional noise (!"/$") [1] inversely scaled with mean expression ($) and followed a Poisson distribution ($ = !"), which has been described in other single cell studies [51, 52]. SAUSA300_1933-1925, a phage lytic operon encoding putative phage tail and structural genes, clearly diverged and exhibited higher noise than expected from the mean (Figure S8E), which recapitulated its hypervariability in expression as found by PCA. As such, we have demonstrated that PETRI-seq can detect rare cells occupying distinct transcriptional states like prophage induction.
.CC-BY-NC-ND 4.0 International licensenot certified by peer review) is the author/funder. It is made available under aThe copyright holder for this preprint (which wasthis version posted December 6, 2019. . https://doi.org/10.1101/866244doi: bioRxiv preprint

7
Discussion In this work, we developed PETRI-seq, an affordable method for high-throughput in situ combinatorial indexing and scRNA-seq of bacterial cells. Prokaryotic scRNA-seq tools have lagged behind eukaryotic methods because of the low mRNA content per cell and technical barriers including the thick cell wall and lack of mRNA poly-adenylation. Using PETRI-seq, we characterized single-cell transcriptional states of both Gram-positive and Gram-negative bacterial species. We cost-effectively (Table S1) sequenced ~20,000 single cells, a dramatic improvement in throughput over existing methods, which typically sequence fewer than ten cells. PETRI-seq captured 30-70 mRNAs per average E. coli cell, corresponding to 0.5-2% of total mRNAs. Aggregated transcriptomes from single cells were highly correlated with bulk RNA-seq libraries. Using fluorescently labeled cells, we showed that PETRI-seq assigned >98% of single cells to the correct growth phase (i.e. stationary or exponential) and defined consensus transcriptomes for these growth phases. PETRI-seq also detected rare prophage-induced cells that were present in 0.4% of the S. aureus population. The introduction of PETRI-seq represents a major advance in high-throughput single-cell microbiology. Further optimization has the potential to increase the capture rate of PETRI-Seq and improve its sensitivity. During the library preparation step of PETRI-seq, double-stranded cDNA was subjected to conventional tagmentation with both N5 and N7 adaptors (Illumina Nextera XT). However, only one of the adaptors (N7 in our case) could be subsequently amplified. Modified tagmentation using a commercially available and customizable Tn5 (Lucigen) could increase capture by 2-fold [20]. Capture might be further improved by increasing primer and enzyme concentrations during the RT and ligation steps and/or using a hairpin ligation [20] instead of an inter-molecular linker. Given that rRNAs comprise >95% of total RNA species in many bacteria, we reason that mRNA capture might be additionally improved by designing RT primers with sequences biased against rRNA [53], thereby directing reagents preferentially toward mRNA. Alternatively, in situ 5’-phosphate-dependent exonuclease treatment could be used to preferentially degrade processed RNAs, the majority of these being rRNAs [54], prior to RT. If successful, these modifications would reduce the fraction of sequencing reads mapped to rRNA. Although sequencing depth is not limiting at the current capture rate, it may be necessary to deplete rRNA if overall capture is improved so that libraries can be comprehensively sequenced. For this purpose, abundance-based normalization by melting and rehybridization of double-stranded cDNA followed by duplex-specific nuclease treatment [55] may also be considered.
PETRI-seq detected a rare sub-population undergoing prophage induction in S. aureus,
which has important clinical implications, as prophage induction is intimately linked to bacterial pathogenesis. Mobile genetic elements such as temperate phages routinely carry virulence factors, and it has been shown that prophage induction can lead to co-expression of these factors [56, 57]. The high throughput capacity of PETRI-seq was vital for identifying such a rare event, and the dominance of phage lytic transcripts in cells undergoing prophage induction made these cells readily detectable. Future studies could use PETRI-seq to further probe the dynamics of prophage induction and lytic phage infection. It will additionally be of interest to gauge the sensitivity of PETRI-seq to characterize other rare, clinically important populations, such as persisters. Persisters are antibiotic-tolerant cells that typically comprise <1% of an otherwise susceptible bacterial population [58]. The underlying transcriptional state of persisters remains poorly understood. More generally, PETRI-seq could be used to study a wide range of bacterial phenotypes far beyond the examples shown here. We hope that widespread
.CC-BY-NC-ND 4.0 International licensenot certified by peer review) is the author/funder. It is made available under aThe copyright holder for this preprint (which wasthis version posted December 6, 2019. . https://doi.org/10.1101/866244doi: bioRxiv preprint
8
implementation of PETRI-seq to study diverse bacterial species and phenotypes will facilitate greater understanding of single-cell phenomena within bacterial populations. Methods Experimental Methods Bacterial Strains and Growth Conditions
E. coli MG1655 was routinely grown in MOPS EZ Rich defined medium (M2105, Teknova, Hollister, CA). pBbE2A-RFP was a gift from Jay Keasling [38] (Addgene plasmid # 35322). RFP was induced with 20 nM anhydrotetracycline hydrochloride (233131000, Acros Organics, Geel, Belgium). GFP was expressed from prplN-GFP [10]. Plasmid-containing cells were grown in appropriate antibiotics (50 μg/mL kanamycin, 100 μg/mL carbenicillin). S. aureus USA300 [49] was routinely grown in trypticase soy broth (TSB) medium (211825, BD, Franklin Lakes, NJ). All bacterial strains were grown at 37°C and shaken at 300 rpm. Custom Primers Used in this Study
All single-tube primers are shown in Table S2. All primer sequences for 96-well split-pool barcoding are shown in Table S3. Primers were purchased from Integrated DNA Technologies (IDT, Coralville, IA).
Preparation of Ligation Primers
Round 2 and Round 3 ligation primers (Table S3) were diluted to 20 μM. Linkers SB80 and SB83 were also diluted to 20 μM. To anneal barcodes to linkers, 96-well PCR plates (AB0600, Thermo Scientific) were prepared with 4.4 μL of 20 μM linker, 0.8 μL water, and 4.8 μL of each barcode. Primers were annealed by heating the plate to 95°C for 3 minutes then decreasing the temperature to 20°C at a ramp speed of -0.1°C/second.
Primers SB84 and SB81 were also annealed (to form an intramolecular hairpin) prior to blocking by heating 50 μL or 80 μL, respectively, of each 100 μM primer to 94°C and slowly reducing the temperature to 25°C.
Cell Preparation for PETRI-Seq
For sequencing and qPCR measurements, cells were grown overnight then diluted into fresh media (1:100 for S. aureus and prplN-GFP E. coli, 1:50 for pBbE2A-RFP E. coli) with inducer and antibiotics when applicable. For exponential cells, E. coli and S. aureus cultures were grown for approximately 2 hours until reaching an OD600 of 0.4 or 0.9, respectively. Exponential E. coli cells were used for all qPCR optimization experiments. For stationary cells, pBbE2A-RFP E. coli cells were grown an additional 3 hours until the culture reached an OD600 of 4. For the combined exponential E. coli library, 3.5 mL of exponential GFP E. coli was combined with 3.5 mL of exponential RFP E. coli. The S. aureus library was prepared separately from 7 mL of exponential cells. For the 2 libraries of exponential GFP E. coli combined with stationary RFP E. coli, 3 mL of exponential GFP cells was added to ~300 μL of stationary RFP cells. Before fixation, cells were pelleted at 5,525xg for 2 minutes at 4°C. Spent media was removed, and cells were resuspended in 7 mL of ice-cold 4% formaldehyde (F8775, Millipore Sigma, St. Louis, MO) in PBS (P0195, Teknova). This suspension was rotated at 4°C for 16 hours on a Labquake Shaker (415110, Thermo Scientific)
Fixed cells were centrifuged at 5525xg for 10 minutes at 4°C. The supernatant was
removed, and the pellet was resuspended in 7 mL PBS supplemented with 0.01 U/μL SUPERase In RNase Inhibitor (AM2696, Invitrogen, Carlsbad, CA), hereafter referred to as PBS-RI. Cells were centrifuged again at 5525xg for 10 minutes at 4°C then resuspended in 700
.CC-BY-NC-ND 4.0 International licensenot certified by peer review) is the author/funder. It is made available under aThe copyright holder for this preprint (which wasthis version posted December 6, 2019. . https://doi.org/10.1101/866244doi: bioRxiv preprint

9
μL PBS-RI. Subsequent centrifugations for cell preparation were all carried out at 7000xg for 8-10 minutes at 4°C. Cells were centrifuged, then resuspended in 700 μL 50% ethanol (2716, Decon Labs, King of Prussia, PA) in PBS-RI. Cells were next washed twice with 700 μL PBS-RI, then resuspended in 105 μL of 100 μg/mL lysozyme (90082, Thermo Scientific, Waltham, MA) or 40 μg/mL lysostaphin (LSPN-50, AMBI, Lawrence, NY) in TEL-RI (100 mM Tris pH 8.0 [AM9856, Invitrogen], 50 mM EDTA [AM9261, Invitrogen], 0.1 U/μL SUPERase In RNase inhibitor [10x more than in PBS-RI]). Cells were permeabilized for 15 minutes at room temperature (~23°C). After permeabilization, cells were washed with 175 μL PBS-RI then resuspended in 175 μL PBS-RI. 100 μL was taken for subsequent steps and centrifuged, while the remaining 75 μL was discarded. Cells were resuspended in 40 μL DNase-RI buffer (4.4 μL 10x reaction buffer, 0.2 μL SUPERase In RNase inhibitor, 35.4 μL water). 4 μL of DNase I (AMPD1, Millipore Sigma) was added, and cells were incubated at room temperature for 30 minutes. To inactivate the DNase I, 4 μL of Stop Solution was added, and cells were heated to 50°C for 10 minutes with shaking at 500 rpm (Multi-Therm, Benchmark Scientific, Sayreville, NJ). After DNase inactivation, cells were pelleted, washed twice with 100 μL PBS-RI, then resuspended in 100 μL 0.5x PBS-RI. Cells were counted using a hemocytometer (DHC-S02 or DHC-N01, INCYTO, Chungnam-do, Korea).
Split-Pool Barcoding for PETRI-Seq
For RT, Round 1 primers (Table S3) were diluted to 10 μM then 2 μL of each primer was aliquoted across a 96-well PCR plate. A mix was prepared for RT with 240 μL 5x RT buffer, 24 μL dNTPs (N0447L, NEB, Ipswich, MA), 12 μL SUPERase In RNase Inhibitor, and 24 μL Maxima H Minus Reverse Transcriptase (EP0753, Thermo Scientific). 3 * 107 cells were added to this mix. For species-mixed libraries, E. coli and S. aureus cells were combined at this point. Water was added to bring the volume of the reaction mix to 960 μL. 8 μL of the reaction mix was added to each well of the 96-well plate already containing RT primers. The plate was sealed and incubated as follows: 50°C for 10 minutes, 8°C for 12 seconds, 15°C for 45 seconds, 20°C for 45 seconds, 30°C for 30 seconds, 42°C for 6 minutes, 50°C for 16 minutes, 4°C hold. After RT, the 96 reactions were pooled into one tube and centrifuged at 10,000xg for 20 minutes at 4°C. The supernatant was removed.
For the first ligation, cells were then resuspended in 600 μL 1x T4 ligase buffer (M0202L,
NEB). The following additional reagents were added to make a master mix: 7.5 μL water, 37.5 μL 10x T4 ligase buffer, 16.7 μL SUPERase In RNase Inhibitor, 5.6 μL BSA (B14, Thermo Scientific), and 27.9 μL T4 ligase. 5.76 μL of this mix was added to each well of a 96-well plate containing 2.24 μL of annealed Round 2 ligation primers. Ligations were carried out for 30 minutes at 37°C. After this incubation, 2 μL of blocking mix (37.5 μL 100 μM SB84, 37.5 μL 100 μM SB85, 25 μL 10x T4 ligase buffer, 150 μL water) was added to each well, and reactions were incubated for an additional 30 minutes at 37°C. Cells were then pooled into a single tube.
The following reagents were added to the pooled cells for the third round of barcoding:
15.6 μL water, 48 μL 10x T4 ligase buffer, and 13.2 μL T4 ligase. 8.64 μL of this mix was added to each well of a 96-well plate containing 3.36 μL of annealed round 3 ligation primers. The plate was incubated for 30 minutes at 37°C. 10 μL of round 3 blocking mix (72 μL 100 μM SB81, 72 μL 100 μM SB82, 120 μL 10x T4 ligase buffer, 336 μL water, 600 μL 0.5 M EDTA) was added to each well. Cells were then pooled into a single tube and centrifuged at 7000xg for 10 minutes at 4°C. The supernatant was removed, and the pellet was resuspended in 50 μL TEL-RI to wash the pellet. This suspension was centrifuged at 7000xg for an additional 10 minutes at 4°C, the supernatant was removed, and the cells were resuspended in 30 μL TEL-RI. Cells were counted using a hemocytometer. Aliquots of 10,000 cells were taken and diluted in 50 μL lysis buffer (50 mM Tris pH 8.0, 25 mM EDTA, 200 mM NaCl [AM9759, Invitrogen]). 5 μL of
.CC-BY-NC-ND 4.0 International licensenot certified by peer review) is the author/funder. It is made available under aThe copyright holder for this preprint (which wasthis version posted December 6, 2019. . https://doi.org/10.1101/866244doi: bioRxiv preprint

10
proteinase K (AM2548, Invitrogen) was added to the cells in lysis buffer. Cells were lysed for 1 hour at 55°C with shaking at 750 rpm (Multi-Therm). Lysates were stored at -80°C.
Library Preparation for PETRI-Seq
Lysates were purified with AMPure XP beads (A63881, Beckman Coulter, Brea, CA) at a 1.8x ratio (~99 μL). cDNA was eluted in 20 μL water. 14 μL water, 4 μL NEBNext Second Strand Synthesis Reaction Buffer, and 2 μL NEBNext Second Strand Synthesis Enzyme Mix (E6111S, NEB) were added to the purified cDNA. This reaction was incubated at 16°C for 2.5 hours. The resulting double-stranded cDNA was purified with AMPure XP beads at a 1.8x ratio (~72 μL). cDNA was eluted in 20 μL water and used immediately for tagmentation or stored at -20°C.
cDNA was tagmented and amplified using the Nextera XT DNA Library Preparation Kit (FC-131-1096, Illumina, San Diego, CA). The manufacturer’s protocol was followed with the following modified reagent volumes and primers: 25 μL TD, 20 μL cDNA, 5 μL ATM, 12.5 μL NT, 2.5 μL N70x (Nextera Index Kit v2 Set A, TG-131-2001, Illumina), 2.5 μL i50x (E7600S, NEB), 20 μL water, 37.5 μL NPM. Libraries were amplified for 8 cycles according to the manufacturer’s protocol. After 8 cycles, 5 μL was removed, added to a qPCR mix (0.275 μL EvaGreen [31000, Biotium, Fremont, CA], 0.11 μL ROX Low Reference Dye [KK4602, Kapa Biosystems, Wilmington, MA], 0.115 μL water), and further cycled on a qPCR machine. qPCR amplification was used to determine the exponential phase of amplification, which occurred after 11 cycles for all libraries presented here. The remaining PCR reaction (not removed for qPCR) was thermocycled an additional 11 cycles, resulting in a total of 19 PCR cycles. Products were purified with AMPure XP beads at a 1x ratio and eluted in 30 μL water. The concentration of the library was measured using the Qubit dsDNA HS Assay Kit (Q32854, Invitrogen) and the Agilent Bioanalyzer High Sensitivity DNA kit (5067-4626, Agilent, Santa Clara, CA). Libraries were sequenced for 75 cycles with the NextSeq 500/550 High Output Kit v2.5 (20024906, Illumina). Cycles were allocated as follows: 58 cycles read 1 (UMI and barcodes), 17 cycles read 2 (cDNA), 8 cycles index 1, 8 cycles index 2. Modifications Tested to Optimize PETRI-Seq To test fixing cells immediately from cultures without centrifugation, ice-cold 5% formaldehyde in PBS was added directly to cells in spent media to bring the final concentration of formaldehyde to 4%. Cell preparation with no lysozyme or no DNase was carried out by simply omitting the enzyme and using water to replace that volume. Template switching was carried out by adding 2.5 μL 100 μM SB14, 20 μL Maxima H Minus 5x Buffer, 10 μL dNTPs, 2.5 μL SUPERase In RNase Inhibitor, 2 μL Maxima H Minus Reverse Transcriptase, 3 μL water, and 20 μL betaine (J77507VCR, Thermo Scientific) to 40 μL of AMPure purified lysate. SB14 was heated to 72°C for 5 minutes prior to combining the above reagents. The reaction was incubated at 42°C for 90 minutes then heat inactivated at 85°C for 5 minutes. The reaction was purified with AMPure XP beads at a 1.8x ratio and eluted in 30 μL. The purified cDNA was then amplified by setting up the following PCR: 10 μL 5x PrimeSTAR GXL Buffer, 0.1 μL 10 μM SB86, 0.1 μL 10 μM SB15, 1 μL PrimeSTAR GXL Polymerase (R050B, Takara Bio, Kusatsu, Japan), 1 μL dNTPs, and 8 μL water. The reaction was heated to 98°C for 1 minute and then thermocycled 10 times (98°C 10 seconds, 60°C 15 seconds, 68°C 6 minutes). The products were purified by AMPure XP beads at a 1.8x ratio and eluted in 30 μL. The DNA concentration was measured using the Qubit dsDNA HS Assay Kit, and tagmentation was performed according to the manufacturer’s protocol using the appropriate primers (described above for standard PETRI-seq).
.CC-BY-NC-ND 4.0 International licensenot certified by peer review) is the author/funder. It is made available under aThe copyright holder for this preprint (which wasthis version posted December 6, 2019. . https://doi.org/10.1101/866244doi: bioRxiv preprint

11
qPCR Quantification After In Situ DNase or In Situ RT
For qPCR quantification after in situ RT, cells were counted prior to RT, and then the in situ RT reaction described above (scaled to one 50 μL reaction) was set up with equal cell numbers for each condition and technical replicate. A random hexamer (SB94) or a gene-specific primer (SB10) was used as an RT primer. After RT, cells were centrifuged at 7,000xg for 10 minutes then washed in 50 μL PBS-RI. After one wash, cells were resuspended in 50 μL lysis buffer, and 5 μL of proteinase K was added. Cells were lysed for 1 hour at 55°C with shaking at 750rpm. For qPCR quantification after in situ DNase treatment, cells were washed twice after DNase treatment, as described for PETRI-seq cell preparation, then lysed.
Unpurified lysates were diluted 50x (except for ethanol vs. no ethanol, which were diluted 10x) in water and heated to 95°C for 10 minutes to inactivate proteinase K. Diluted lysates were then used directly in qPCR with either Kapa 2x MasterMix Universal (KK4602, Kapa Biosystems) or Power SYBR Green Master Mix (4368706, Applied Biosystems, Foster City, CA). For quantification of genomic DNA after DNase treatment or quantification of cDNA after RT with random hexamers, qPCR primers SB5 and SB6 were used, and relative abundances were calculated based on an experimentally determined amplification efficiency of 88%, which corresponded to an amplification factor of 1.88. Relative abundance thus referred to 1.88-ΔCt, where ΔCt was the difference between the Ct value of each sample and a calibrator Ct. For RT with the gene-specific primer, qPCR primers SB12 and SB13 were used, as SB12 anneals to the gene-specific primer (SB10). The experimentally determined amplification factor for these primers was 1.73. To quantify cDNA yield, the abundance of a matched sample with no RT (processed equivalently but RT enzyme omitted) was subtracted from each measurement. All replicates were technical replicates, which were treated independently during and after the condition tested. qPCR Quantification of Ligation Efficiency To test barcode ligation with a 16-base linker relative to a 30-base linker, approximately 1 μg of purified RNA (bulk) was used for RT with either SB110 or SB114 (used as a positive control). RT was carried out as described for in situ RT, scaled to 50 μL. cDNA was then purified with AMPure XP beads. SB113, the primer to be ligated, was annealed either to SB111 (30 bases) or SB83 (16 bases). 2.24 μL of the annealed primers was then used in a 10 μL ligation reaction. The products were purified with AMPure XP beads. To quantify the proportion of ligated product, qPCR was performed with SB86 and SB13, which amplifies only the ligated product, as SB86 anneals to the ligated overhang, or SB115 and SB13, which amplifies all RT product, as SB115 anneals to the RT primer overhang. ΔΔCt was calculated for the two primer sets with RT product from SB114 as a reference [ΔΔCt = ΔCt(experimental, ligated) - ΔCt(control, SB114 RT), ΔCt = Ct(SB86,SB13) - Ct(SB115,SB13)]. SB114 includes primer sites for both SB86 and SB115, so it mimics ligation with 100% efficiency. Test of DNase Inactivation by Incubating Cells with Exogenous DNA After DNase treatment, inactivation, and two PBS-RI washes (described above), cells were resuspended in 20 μL PBS-RI. 6 μL was removed and added to 1 μL DNase reaction buffer, 1 μL water, and 2 μL of a 775 bp PCR product (800 ng). As a control, 1 μL DNase I was added instead of 1 μL water. The reactions were incubated for 1 hour, after which 1 μL of stop solution was added. The cells were centrifuged for 10 minutes at 7,000xg. The supernatants were then heated to 70C for 10 minutes to inactivate DNase. 5 μL of each reaction was run on a gel. Bulk Library Preparation
.CC-BY-NC-ND 4.0 International licensenot certified by peer review) is the author/funder. It is made available under aThe copyright holder for this preprint (which wasthis version posted December 6, 2019. . https://doi.org/10.1101/866244doi: bioRxiv preprint

12
For preparation of bulk samples from fixed cells, 25 μL of cells was taken after PETRI-seq cell preparation and just prior to in situ RT. These cells were centrifuged and resuspended in 50 μL lysis buffer supplemented with 5 μL proteinase K. Cells were lysed at 55°C for 1 hour with shaking at 750 rpm (Multi-Therm). RNA was then purified from lysates with the Norgen Total RNA Purification Plus Kit (48300, Norgen Biotek, Ontario, Canada). 300 μL buffer RL was added to the lysate before proceeding to the total RNA purification protocol. Alternatively, the standard bulk RNA sample (shown in Figure S3B) was prepared by centrifuging a cell culture at 5525xg for 2 minutes at 4°C then resuspending cells in 1mL of PBS-RNAprotect (333 μL RNAprotect Bacteria Reagent [76506, Qiagen, Hilden, Germany], 666 μL PBS). Resuspended cells were then pelleted, and RNA was prepared with the Norgen Total RNA Purification Plus Kit according to the manufacturer’s instructions for Gram-negative bacteria. Purified RNA from either protocol was treated with DNase I in a 50 μL reaction consisting of 2-5 μg RNA, 5 μL DNase Reaction Buffer, 5 μL DNase, and water. Reactions were incubated at room temperature for 30-40 minutes. Reactions were purified by adding 300 μL buffer RL and proceeding according to the Norgen total RNA purification protocol. Total RNA was depleted of rRNA using the Gram-Negative Ribo-Zero rRNA Removal Kit (MRZGN126, Illumina), purified by ethanol precipitation, and resuspended in 10 μL water. For RT, 6 μL RNA was combined with 4 μL Maxima H Minus 5x Buffer, 2 μL dNTPs, 0.5 μL SUPERase In RNase Inhibitor, 1 μL SB94, 0.5 μL Maxima H Minus Reverse Transcriptase, 4 μL betaine, and 2 μL water. The reaction was thermocycled as follows: 50°C for 10 minutes, 8°C for 12 seconds, 15°C for 45 seconds, 20°C for 45 seconds, 30°C for 30 seconds, 42°C for 6 minutes, 50°C for 16 minutes, 85°C 5 minutes, 4°C hold. For second strand synthesis, 14 μL water, 4 μL NEBNext Second Strand Synthesis Reaction Buffer, and 2 μL NEBNext Second Strand Synthesis Enzyme Mix were added directly to the RT mix. This reaction was incubated at 16°C for 2.5 hours. Double-stranded cDNA was purified with AMPure XP beads at a 1.8x ratio (~72 μL beads) and eluted in 30 μL water. Purified cDNA was used for tagmentation with the Nextera XT kit according to the manufacturer’s protocol. Bulk libraries were purified twice with AMPure XP beads at a 0.9x ratio. The resulting libraries were quantified and sequenced as described for PETRI-seq libraries above. Growth Curves Overnight cultures were grown as described above and then diluted 1:100 into 1 mL EZ Rich Defined Media with or without 20 nM aTc. Antibiotics were added for plasmid-containing strains. For each condition, 100 μL of diluted cells were aliquoted into 4 wells of a 96-well plate. The plate was incubated at 37°C with shaking on the plate reader (Synergy Mx, Biotek, Winooski, VT). OD600, GFP, and RFP were measured every 10 minutes. Computational Methods Barcode Demultiplexing, Cell Selection and Alignment
Cutadapt [59] was used to trim low-quality read 1 and read 2 sequences with phred score below ten. Surviving read pairs of sufficient length were grouped based on their three barcode sequences using the cutadapt demultiplex feature. FASTQ files were first demultiplexed by barcode 1, requiring that matching sequences were anchored at the end of the read, overlapped at 8 positions (--overlap 8), and had no more than 1 mismatch relative to the barcode assignment (-e 0.2). For barcode 2 and then barcode 3, cutadapt was used to locate barcode sequences with the expected downstream linker, allowing no more than 2 mismatches (-e 0.2 --overlap 20/21). The final output after demultiplexing was a set of read 1 and read 2 FASTQ files where each file corresponded to a three-barcode combination (BC). The “knee” method [15] was used to identify BCs for further processing. Briefly, each BC was sorted by
.CC-BY-NC-ND 4.0 International licensenot certified by peer review) is the author/funder. It is made available under aThe copyright holder for this preprint (which wasthis version posted December 6, 2019. . https://doi.org/10.1101/866244doi: bioRxiv preprint

13
descending total number of reads, and then the cumulative fraction of reads for each BC was plotted. Because the yield per BC could be better assessed later after collapsing reads to UMIs, an inclusive threshold was used at this stage to select BCs for downstream processing, which allowed for more precise cell selection after downstream processing (Figure S4C). For selected BCs, umi_tools [60] was used in paired-end mode to extract the seven base UMI sequence from the beginning of read 1. Cutadapt was then used to trim and discard read 2 sequences containing barcode 1 or the linker sequence. Note that at this point all necessary information was contained in the read 2 FASTQ files, so further processing did not consider the read 1 files. Next, cDNA sequences were aligned to reference genomes using the backtrack algorithm in the Burrows-Wheeler Alignment tool, bwa [61], allowing a maximum edit distance of 1 for assigned alignments.
Annotating Features and Grouping PCR Duplicates by Shared UMI
FeatureCounts [62] was used to annotate operons based on the alignment position. Operon sequences were obtained from RegulonDB [63] and ProOpDB [64] for E. coli and S. aureus, respectively. Because featureCounts uses an “XT” sam file tag for annotation, the bwa “XT” tag was first removed from all sam files using a python script. The resulting bam files after featureCounts were used as input for the group function of umi_tools with the “--per-gene” option in directional mode [60]. The directional algorithm is a network-based method that identifies clusters of connected UMI sequences to group as single UMIs. The result was a set of bam files with UMI sequences corrected based on probable errors from sequencing or amplification. A python script was used to collapse reads to UMIs. Reads with the same BC, error corrected UMI, and operon assignment were grouped into a single count. Reads mapping to multiple optimal positions were omitted except rRNA alignments for which multiple alignments were expected. The distribution of number of reads per UMI for all UMI-BC-operon combinations was plotted to establish a threshold below which UMIs were excluded (Figure S4C). Filtered UMIs were used to generate an operon by BC count matrix. Anti-sense transcripts were removed. BCs with fewer than 40 total UMIs were then removed (Figure S4E). Bulk Sequencing Libraries
For bulk sequencing libraries, only read 2 was used for alignment in order to mimic single-cell methods. Bulk sequencing libraries were pre-processed to remove adapters using cutadapt [59]. Trimmomatic [65] was then used to remove leading or trailing bases below quality phred33 quality 3 and discard reads shorter than 14 bases. Surviving reads were aligned using the backtrack algorithm in bwa [61] with a maximum edit distance of 1. Reads with more than one optimal alignment position were removed. FeatureCounts [62] was used to generate a matrix of operon counts for the bulk libraries. To compare single-cell libraries generated by PETRI-seq to bulk samples, the UMI counts for a given set of BCs (e.g. GFP-expressing E. coli) were summed for all operons. A count matrix was then generated as described for bulk libraries. To calculate TPM, raw counts were divided by the length of the operon in kilobases. Then, each length-adjusted count was divided by the sum of all adjusted counts divided by 1 million.
Calculating Multiplet Frequency The multiplet frequency was defined as the fraction of non-empty BCs corresponding to more than one cell. To calculate the predicted multiplet frequency, the proportion of predicted BCs with 0 cells was calculated based on a Poisson process: '(0) = +,
-!∗ 01+, the proportion of
BCs with 1 cell was calculated: '(1) = +3
4!∗ 01+, and the proportion with greater than 1 cell was
calculated: '(≥ 2) = 1 − '(1) − '(0). Finally, the multiplet frequency was calculated: 8(9"):(4)
. ;
.CC-BY-NC-ND 4.0 International licensenot certified by peer review) is the author/funder. It is made available under aThe copyright holder for this preprint (which wasthis version posted December 6, 2019. . https://doi.org/10.1101/866244doi: bioRxiv preprint

14
was the fraction of cells relative to total possible BCs – for example, 4-,---=>??@
AB∗AB∗ABCDE=FG>@=
0.011 = ;. The experimental multiplet frequency was computed from the species-mixing experiment as described for populations with unequal representation of two species [35]. Principal Component Analysis (PCA) rRNA and all plasmid genes (RFP, GFP, AmpR, KanR, tetR) were first removed from the count matrix. Operons with 5 or fewer total counts in the library were also removed (except for Figure S7 in which all operons with >0 counts were included). Cells with fewer than 15 mRNAs were removed. Total operon counts for each cell were normalized by dividing each count by the total number of counts for that cell then multiplying the resulting value by the geometric mean [20] of the total mRNA counts for each cell. The scaled values were then log transformed after adding a pseudocount to each. For each operon, expression values were scaled to z-scores [66]. Principal components were computed using scikit-learn in python. To normalize counts using sctransform in Seurat [43], first rRNA and all plasmid genes were removed from the count matrix. Operons with 10 or fewer total counts, and cells with fewer than 15 mRNAs were also removed. A Seurat object was created in R from the resulting matrix, and sctransform was applied. The resulting scaled counts were used as input for PCA. Computing Moving Averages of Gene Expression Along PC1
Using a custom Python script, the cells in the normalized, log-transformed, z-scored gene matrix were sorted by PC1. The rolling function in the pandas package was then used to compute rolling averages of the size indicated for each figure. Win_type was set to “None”. The corresponding PC1 coordinate was the moving average of the PC1 values. Moving averages for GO terms were computed as described, except the z-scored sum of z-scored counts for all operons in the GO term was used to calculate the moving average instead of expression from a single operon. In cases where multiple genes from the same operon were included in a GO term, only one gene was included. Significance of expression trends was determined by the Spearman rank correlation between the operon or GO term expression and PC1, prior to calculating a moving average. FDR was determined by the Benjamini-Hochberg procedure [67]. Computing Operon Noise Noise was defined as !"/$", where ! is standard deviation and $ is mean. Noise and mean were calculated for all operons with at least 5 raw counts (UMIs) in the dataset (either S. aureus or E. coli). Count matrices were normalized by cell (but not log-transformed) before computing noise and mean. To calculate a p-value for the divergence of SAUSA300_1933-1925, a line was fit to the log-scaled noise vs log-scaled mean of the data. The residuals of the experimental data to the best-fit line were calculated and z-scored. The p-value was determined based on a normal distribution of the z-scored residuals. Authors’ contributions SB, WJ, and ST conceived the study. SB, WJ performed experiments and data analysis. PO assisted with computational analysis. SB, WJ, and ST wrote the paper. Acknowledgements We thank the Tavazoie laboratory for helpful discussions and comments on early drafts of the manuscript. ST is supported by award 5R01AI077562 from NIH. SB is supported by NSF award DGE - 1644869. WJ is supported by a fellowship from the Jane Coffin Childs Fund.
.CC-BY-NC-ND 4.0 International licensenot certified by peer review) is the author/funder. It is made available under aThe copyright holder for this preprint (which wasthis version posted December 6, 2019. . https://doi.org/10.1101/866244doi: bioRxiv preprint

15
References 1. Taniguchi Y, Choi PJ, Li GW, Chen H, Babu M, Hearn J, et al. Quantifying E. coli proteome and transcriptome with single-molecule sensitivity in single cells. Science. 2010;329(5991):533-8. 2. Dubnau D, Losick R. Bistability in bacteria. Mol Microbiol. 2006;61(3):564-72. 3. Papenfort K, Bassler BL. Quorum sensing signal–response systems in Gram-negative bacteria. Nat Rev Microbiol. 2016;14:576-88. 4. Saliba AE, Li L, Westermann AJ, Appenzeller S, Stapels DAC, Schulte LN, et al. Single-cell RNA-seq ties macrophage polarization to growth rate of intracellular Salmonella. Nat Microbiol. 2016;2. 5. Chai Y, Chu F, Kolter R, Losick R. Bistability and biofilm formation in Bacillus subtilis. Molecular Microbiology. 2008;67:254-63. 6. Pérez-Osorio AC, Williamson KS, Franklin MJ. Heterogeneous rpoS and rhlR mRNA Levels and 16S rRNA/rDNA (rRNA Gene) Ratios within Pseudomonas aeruginosa Biofilms, Sampled by Laser Capture Microdissection. Journal of Bacteriology. 2010;192:2991-3000. 7. Keren I, Shah D, Spoering A, Kaldalu N, Lewis K. Specialized persister cells and the mechanism of multidrug tolerance in Escherichia coli. J Bacteriol. 2004;186(24):8172-80. 8. Singer RH, Ward DC. Actin gene expression visualized in chicken muscle tissue culture by using in situ hybridization with a biotinated nucleotide analog. Proc National Acad Sci. 1982;79:7331-5. 9. Golding I, Paulsson J, Zawilski SM, Cox EC. Real-Time Kinetics of Gene Activity in Individual Bacteria. Cell. 2005;123:1025-36. 10. Zaslaver A, Bren A, Ronen M, Itzkovitz S, Kikoin I, Shavit S, et al. A comprehensive library of fluorescent transcriptional reporters for Escherichia coli. Nat Methods. 2006;3(8):623-8. 11. Tang F, Barbacioru C, Wang Y, Nordman E, Lee C, Xu N, et al. mRNA-Seq whole-transcriptome analysis of a single cell. Nat Methods. 2009;6(5):377-82. 12. Ramsköld D, Luo S, Wang YC, Li R, Deng Q, Faridani OR, et al. Full-length mRNA-Seq from single-cell levels of RNA and individual circulating tumor cells. Nat Biotechnol. 2012;30(8):777-82. 13. Picelli S, Björklund ÅK, Faridani OR, Sagasser S, Winberg G, Sandberg R. Smart-seq2 for sensitive full-length transcriptome profiling in single cells. Nat Methods. 2013;10(11):1096-8. 14. Fan HC, Fu GK, Fodor SP. Expression profiling. Combinatorial labeling of single cells for gene expression cytometry. Science. 2015;347(6222):1258367. 15. Macosko EZ, Basu A, Satija R, Nemesh J, Shekhar K, Goldman M, et al. Highly Parallel Genome-wide Expression Profiling of Individual Cells Using Nanoliter Droplets. Cell. 2015;161(5):1202-14. 16. Klein AM, Mazutis L, Akartuna I, Tallapragada N, Veres A, Li V, et al. Droplet barcoding for single-cell transcriptomics applied to embryonic stem cells. Cell. 2015;161(5):1187-201. 17. Bose S, Wan Z, Carr A, Rizvi AH, Vieira G, Pe'er D, et al. Scalable microfluidics for single-cell RNA printing and sequencing. Genome Biol. 2015;16:120. 18. Zheng GX, Terry JM, Belgrader P, Ryvkin P, Bent ZW, Wilson R, et al. Massively parallel digital transcriptional profiling of single cells. Nat Commun. 2017;8:14049. 19. Cao J, Packer JS, Ramani V, Cusanovich DA, Huynh C, Daza R, et al. Comprehensive single-cell transcriptional profiling of a multicellular organism. Science. 2017;357(6352):661-7.
.CC-BY-NC-ND 4.0 International licensenot certified by peer review) is the author/funder. It is made available under aThe copyright holder for this preprint (which wasthis version posted December 6, 2019. . https://doi.org/10.1101/866244doi: bioRxiv preprint

16
20. Cao J, Spielmann M, Qiu X, Huang X, Ibrahim DM, Hill AJ, et al. The single-cell transcriptional landscape of mammalian organogenesis. Nature. 2019;566(7745):496-502. 21. Rosenberg AB, Roco CM, Muscat RA, Kuchina A, Sample P, Yao Z, et al. Single-cell profiling of the developing mouse brain and spinal cord with split-pool barcoding. Science. 2018;360(6385):176-82. 22. Picelli S. Single-cell RNA-sequencing: The future of genome biology is now. Rna Biol. 2016;14:1-14. 23. Kang Y, Norris MH, Zarzycki-Siek J, Nierman WC, Donachie SP, Hoang TT. Transcript amplification from single bacterium for transcriptome analysis. Genome Res. 2011;21(6):925-35. 24. Schmid A, Kortmann H, Dittrich PS, Blank LM. Chemical and biological single cell analysis. Curr Opin Biotech. 2010;21:12-20. 25. Wang J, Chen L, Chen Z, Zhang W. RNA-seq based transcriptomic analysis of single bacterial cells. Integr Biol (Camb). 2015;7(11):1466-76. 26. Liu Y, Jeraldo P, Jang JS, Eckloff B, Jen J, Walther-Antonio M. Bacterial Single Cell Whole Transcriptome Amplification in Microfluidic Platform Shows Putative Gene Expression Heterogeneity. Anal Chem. 2019;91(13):8036-44. 27. Balaban NQ, Merrin J, Chait R, Kowalik L, Leibler S. Bacterial Persistence as a Phenotypic Switch. Science. 2004;305:1622-5. 28. de Lange N, Tran TM, Abate AR. Electrical lysis of cells for detergent-free droplet assays. Biomicrofluidics. 2016;10(2):024114. 29. Amini S, Pushkarev D, Christiansen L, Kostem E, Royce T, Turk C, et al. Haplotype-resolved whole-genome sequencing by contiguity-preserving transposition and combinatorial indexing. Nat Genetics. 2014;46:1343-9. 30. Bartholomäus A, Fedyunin I, Feist P, Sin CL, Zhang G, Valleriani A, et al. Bacteria differently regulate mRNA abundance to specifically respond to various stresses. Philos T R Soc A. 2016;374(2063). 31. Moran MA, Satinsky B, Gifford SM, Luo H, Rivers A, Chan LK, et al. Sizing up metatranscriptomics. Isme J. 2013;7:237-43. 32. Islam S, Zeisel A, Joost S, La Manno G, Zajac P, Kasper M, et al. Quantitative single-cell RNA-seq with unique molecular identifiers. Nat Methods. 2014;11(2):163-6. 33. Franzosa EA, Hsu T, Sirota-Madi A, Shafquat A, Abu-Ali G, Morgan XC, et al. Sequencing and beyond: integrating molecular 'omics' for microbial community profiling. Nat Rev Microbiol. 2015;13:360-72. 34. Hodson RE, Dustman WA, Garg RP, Moran MA. In situ PCR for visualization of microscale distribution of specific genes and gene products in prokaryotic communities. Appl Environ Microbiol. 1995;61(11):4074-82. 35. Bloom JD. Estimating the frequency of multiplets in single-cell RNA sequencing from cell-mixing experiments. PeerJ. 2018;6:e5578. 36. Okayama H, Berg P. High-efficiency cloning of full-length cDNA. Mol Cell Biol. 1982;2(2):161-70. 37. Kivioja T, Vähärautio A, Karlsson K, Bonke M, Linnarsson S, Taipale J. Counting absolute number of molecules using unique molecular identifiers. Nat Précéd. 2011.
.CC-BY-NC-ND 4.0 International licensenot certified by peer review) is the author/funder. It is made available under aThe copyright holder for this preprint (which wasthis version posted December 6, 2019. . https://doi.org/10.1101/866244doi: bioRxiv preprint

17
38. Lee TS, Krupa RA, Zhang F, Hajimorad M, Holtz WJ, Prasad N, et al. BglBrick vectors and datasheets: A synthetic biology platform for gene expression. J Biol Eng. 2011;5. 39. Vargas-Garcia CA, Ghusinga KJ, Singh A. Cell size control and gene expression homeostasis in single-cells. Curr Opin Syst Biol. 2018;8:109-16. 40. Kennel D. Titration of the Gene Sites on DNA by DNA-RNA Hybridization. J Mol Biol. 1968;34:85-103. 41. Hotelling H. Analysis of a complex of statistical variables into principal components. J Educ Psychol. 1933;24(6):417-41. 42. Chen H, Shiroguchi K, Ge H, Xie XS. Genome-wide study of mRNA degradation and transcript elongation in Escherichia coli. Mol Syst Biol. 2015;11:781. 43. Hafemeister C, Satija R. Normalization and variance stabilization of single-cell RNA-seq data using regularized negative binomial regression. Biorxiv. 2019:576827. 44. Gentry DR, Hernandez VJ, Nguyen LH, Jensen DB, Cashel M. Synthesis of the stationary-phase sigma factor sigma s is positively regulated by ppGpp. J Bacteriol. 1993;175(24):7982-9. 45. Almirón M, Link AJ, Furlong D, Kolter R. A novel DNA-binding protein with regulatory and protective roles in starved Escherichia coli Genes & Development. 1992;6:2646-54. 46. Traxler MF, Summers SM, Nguyen HT, Zacharia VM, Hightower GA, Smith JT, et al. The global, ppGpp-mediated stringent response to amino acid starvation in Escherichia coli. Mol Microbiol. 2008;68(5):1128-48. 47. Chuang S, Daniels DL, Blattner FR. Global Regulation of Gene Expression in Escherichia coli. J Bacteriol. 1993;175(7):2026-36. 48. Gennis R. The cytochromes of Escherichia coli. FEMS Microbiology Reviews. 1987;46:387-99. 49. Diep BA, Gill SR, Chang RF, Phan TH, Chen JH, Davidson MG, et al. Complete genome sequence of USA300, an epidemic clone of community-acquired meticillin-resistant Staphylococcus aureus. Lancet. 2006;367(9512):731-9. 50. Benson DA, Karsch-Mizrachi I, Lipman DJ, Ostell J, Wheeler DL. GenBank. Nucleic Acids Res. 2007;35:D21-D5. 51. Saint M, Bertaux F, Tang W, Sun X, Game L, Köferle A, et al. Single-cell imaging and RNA sequencing reveal patterns of gene expression heterogeneity during fission yeast growth and adaptation. Nature Microbiology. 2019;4(3):480-91. 52. Grün L, Kester L, Oudenaarden A. Validation of noise models for single-cell transcriptomics. Nature Methods. 2014;11(6):637-40. 53. Armour CD, Castle JC, Chen RH, Babak T, Loerch P, Jackson S, et al. Digital transcriptome profiling using selective hexamer priming for cDNA synthesis. Nature Methods. 2009;6(9):647-U35. 54. He S, Wurtzel O, Singh K, Froula JL, Yilmaz S, Tringe SG, et al. Validation of two ribosomal RNA removal methods for microbial metatranscriptomics. Nature Methods. 2010;7:807. 55. Zhulidov PA, Bogdanova EA, Shcheglov AS, Vagner LL, Khaspekov GL, Kozhemyako VB, et al. Simple cDNA normalization using kamchatka crab duplex-specific nuclease. Nucleic Acids Res.32:e37-e. 56. Deutsch DR, Utter B, Verratti KJ, Sichtig H, Tallon LJ, Fischetti VA. Extra-Chromosomal DNA Sequencing Reveals Episomal Prophages Capable of Impacting Virulence Factor Expression in Staphylococcus aureus. Front Microbiol. 2018;9:1406.
.CC-BY-NC-ND 4.0 International licensenot certified by peer review) is the author/funder. It is made available under aThe copyright holder for this preprint (which wasthis version posted December 6, 2019. . https://doi.org/10.1101/866244doi: bioRxiv preprint

18
57. Balasubramanian S, Osburne MS, BrinJones H, Tai AK, Leong JM. Prophage induction, but not production of phage particles, is required for lethal disease in a microbiome-replete murine model of enterohemorrhagic E. coli infection. Plos Pathog. 2019;15(1):e1007494. 58. Brauner A, Fridman O, Gefen O, Balaban NQ. Distinguishing between resistance, tolerance and persistence to antibiotic treatment. Nature Reviews Microbiology. 2016;14(5):320-30. 59. Martin M. Cutadapt removes adapter sequences from high-throughput sequencing reads. EMBNet. 2011;17:10-2. 60. Smith T, Heger A, Sudbery I. UMI-tools: Modelling sequencing errors in Unique Molecular Identifiers to improve quantification accuracy. 2017. 61. Li H, Durbin R. Fast and accurate short read alignment with Burrows-Wheeler transform. Bioinformatics. 2009;25(14):1754-60. 62. Liao Y, Smyth GK, Shi W. featureCounts: an efficient general purpose program for assigning sequence reads to genomic features. Bioinformatics. 2014;30(7):923-30. 63. Santos-Zavaleta A, Salgado H, Gama-Castro S, Sanchez-Perez M, Gomez-Romero L, Ledezma-Tejeida D, et al. RegulonDB v 10.5: tackling challenges to unify classic and high throughput knowledge of gene regulation in E. coli K-12. Nucleic Acids Res. 2019;47(D1):D212-D20. 64. Taboada B, Ciria R, Martinez-Guerrero CE, Merino E. ProOpDB: Prokaryotic Operon DataBase. Nucleic Acids Res. 2012;40(Database issue):D627-31. 65. Bolger AM, Lohse M, Usadel B. Trimmomatic: a flexible trimmer for Illumina sequence data. Bioinformatics. 2014;30(15):2114-20. 66. Butler A, Hoffman P, Smibert P, Papalexi E, Satija R. Integrating single-cell transcriptomic data across different conditions, technologies, and species. Nature Biotechnology. 2018;36:411. 67. Benjamini Y, Hochberg Y. Controlling the False Discovery Rate: A Practical and Powerful Approach to Multiple Testing. J Royal Statistical Soc Ser B Methodol. 1995;57(1):289-300.
.CC-BY-NC-ND 4.0 International licensenot certified by peer review) is the author/funder. It is made available under aThe copyright holder for this preprint (which wasthis version posted December 6, 2019. . https://doi.org/10.1101/866244doi: bioRxiv preprint

19
Figure Legends Figure 1: Overview of PETRI-seq PETRI-seq includes three parts: cell preparation, split-pool barcoding, and library preparation. In cell preparation, cells are prepared for in situ reactions by fixation and permeabilization. During split-pool barcoding, cells are split across 96-well plates three times for three rounds of barcoding by reverse transcription and two ligations. After barcoding, cells are lysed to release cDNA, which is subsequently prepared for paired-end Illumina sequencing. Each cDNA fragment in the library includes a unique molecular identifier (UMI) and 3 barcodes, which are all sequenced in Read 1. The UMI is a sequence of 7 degenerate nucleotides that can distinguish unique transcripts from PCR duplicates. The 3 barcodes comprise a barcode combination (BC), which allows reads to be grouped by their cell of origin. In Read 2, the cDNA is sequenced. Figure 2: PETRI-Seq Captures Transcriptomes of Single E. coli and S. aureus Cells (A) Schematic of species-mixing experiment. S. aureus and E. coli cells were grown separately then mixed for PETRI-seq. E. coli cells included two populations, grown separately, containing either an RFP plasmid or a GFP plasmid. (B) Species mixing plot for E. coli and S. aureus based on total UMIs per BC, including rRNA. BCs were assigned to a single species if more than 90% of UMIs mapped to that species. Histograms (top, right), show the number of S. aureus or E. coli cells (respectively) with the corresponding number of total UMIs. BCs with fewer than 40 total UMIs are omitted. (C) Distributions of mRNAs (left) and operons (right) per E. coli cell in three sub-populations: GFP cells (contain GFP plasmid transcripts, top), ambiguous cells (contain no plasmid transcripts, bottom), and both GFP cells and ambiguous cells (middle). (D) Distribution of mRNAs (left) and operons (right) per S. aureus cell. 8380 cells are included. (E) Correlation between mRNA abundances from PETRI-seq vs. a bulk library prepared from fixed E. coli cells. The Pearson correlation coefficient (r) was calculated for 1851 out of 2617 total operons, excluding those with zero counts in either library (grey points). If all operons are included, r = 0.77. (F) Correlation between mRNA abundances from PETRI-seq vs. a bulk library prepared from fixed S. aureus cells. R was calculated for 1361 out of 1510 total operons, excluding those with zero counts in either library (grey points). If all operons are included, r = 0.88. (G) Correlation between two biological replicate libraries of exponential GFP-expressing E. coli prepared by PETRI-seq. R was calculated for 1682 out of 2617 total operons, excluding those with zero counts in either library (grey points). If all operons are included, r = 0.77. For all correlations (E,F,G), PETRI-seq TPM was calculated from UMIs, and bulk TPM was calculated from reads. Figure 3: Principal Component Analysis Distinguishes Exponential and Stationary E. coli by mRNA Expression Patterns (A) Schematic of experiment. Stationary RFP-expressing E. coli were mixed with exponential GFP-expressing E. coli for barcoding and sequencing by PETRI-seq. (B) Bottom: Cells containing UMIs from either the GFP plasmid or the RFP plasmid plotted on PC1 and PC2. The two populations are distinguishable along PC1. Grey points indicate ambiguous cells (no plasmid UMIs). 99% and 95% refer to the percent of plasmid-containing cells on either side of the threshold line expressing the correct plasmid (GFP on left, RFP on right). Distribution of all cells across PC1, including cells without any plasmid UMIs, is shown above. 7374 cells are included. Middle: Expression of GO terms associated with exponential to stationary transition. The moving average (size=1200 cells) of the z-scored expression of operons within the GO term is shown. Expression was z-score transformed for each gene and then for each GO term. Both GO terms are significantly correlated with PC1 prior to calculating moving averages (Spearman rank, p<10-90). Top: Expression of genes involved in exponential to stationary transition along PC1. The moving average (size=2400 cells) of the z-scored operon expression
.CC-BY-NC-ND 4.0 International licensenot certified by peer review) is the author/funder. It is made available under aThe copyright holder for this preprint (which wasthis version posted December 6, 2019. . https://doi.org/10.1101/866244doi: bioRxiv preprint
20
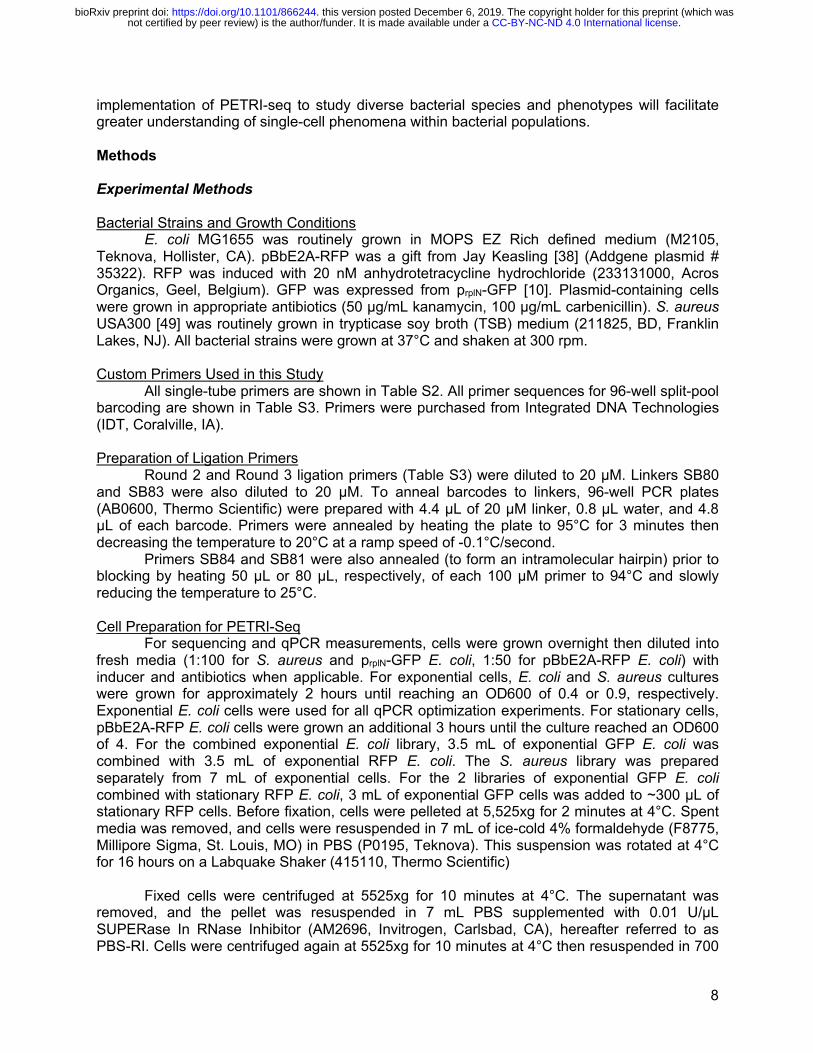
is shown. Both operons are significantly correlated with PC1 prior to calculating moving averages (Spearman rank, dps: p=10-26, rpoS: p=0.002, FDR<0.01). (C) Distribution of mRNAs per cell on either side of the threshold line in (B). Grey cells are included. Only cells with greater than 14 mRNAs per cell were included, as cells with fewer mRNAs per cell were excluded from the PCA. 2794 cells are below the threshold, and 4580 cells are above the threshold. (D) Expression along PC1 of operons with the most positive or negative PC1 loadings (z-scored moving average, size=1000 cells).
.CC-BY-NC-ND 4.0 International licensenot certified by peer review) is the author/funder. It is made available under aThe copyright holder for this preprint (which wasthis version posted December 6, 2019. . https://doi.org/10.1101/866244doi: bioRxiv preprint

Barcode 1:Reverse
Transcription
Barcode 2:Ligation
Cell Preparation
Split-Pool Barcoding
Library Preparation,Sequence
. . .
Barcode 3:Ligation
. . .
. . .
. . .
Barcode 3 Barcode 2Linker Linker Barcode 1UMI
Read 1Primer
Hexamer
Read 2Primer
cDNA
Figure 1: Overview of PETRI-seq
.CC-BY-NC-ND 4.0 International licensenot certified by peer review) is the author/funder. It is made available under aThe copyright holder for this preprint (which wasthis version posted December 6, 2019. . https://doi.org/10.1101/866244doi: bioRxiv preprint

...
...
ExponentialS. aureus
ExponentialRFP E. coli
ExponentialGFP E. coli
...
A B
C D
E
PETRI-Seq
Bulk E. coli, log10(TPM+1)
PE
TRI-S
eq E
. col
i , lo
g 10(T
PM
+1)
r = 0.89
G
PE
TRI-S
eq S
. aur
eus,
log 10
(TP
M+1
)
Bulk S. aureus, log10(TPM+1)
r = 0.90
PETRI-Seq Library 1, log10(TPM+1)
PE
TRI-S
eq L
ibra
ry 2
, log
10(T
PM
+1)
r = 0.91
Num
ber o
f E. c
oli U
MIs
Number of S. aureus UMIs
S. aureus (8380 BCs)E. coli (1222 BCs)Mixed (40 BCs)
F
All S. aureus All S. aureus
mR
NA
UM
Is P
er C
ell
Ope
rons
Per
Cel
l
mRNA UMIs Per Cell Operons Per Cell
0 2 4 8 16 32 64 128256
5120 2 4 8 16 32 64 128
256512
0
2
8
4
16
32
64
128
256
0
2
8
4
16
32
64
128
256
Figure 2: PETRI-Seq Captures Transcriptomes of Single E. coli and S. aureus Cells
.CC-BY-NC-ND 4.0 International licensenot certified by peer review) is the author/funder. It is made available under aThe copyright holder for this preprint (which wasthis version posted December 6, 2019. . https://doi.org/10.1101/866244doi: bioRxiv preprint
ExponentialGFP E. coli
StationaryRFP E. coli
...
...
...PETRI-Seq
A
B
Cells Below Threshold Cells Above ThresholdC
D
Mean = 34.9mRNA UMIs
Per Cell
Mean= 69.2mRNA UMIs
Per Cell
mRNA UMIs mRNA UMIs
Num
ber o
f Cel
ls
Num
ber o
f Cel
ls
rpoS
dps
16 32 64 128 256 512 16 64 25632 128
thresholdn = 7374
Figure 3: Principal Component Analysis Distinguishes Exponential and Stationary E. coli by mRNA Expression Patterns
amino acid biosynthetic process (GO:0008652)ribosome (GO:0005840)
Z-S
core
d G
O C
ateg
ory
Exp
ress
ion
Z-S
core
d O
pero
nE
xpre
ssio
nP
rinci
pal C
ompo
nent
2
Principal Component 1 Principal Component 1
.CC-BY-NC-ND 4.0 International licensenot certified by peer review) is the author/funder. It is made available under aThe copyright holder for this preprint (which wasthis version posted December 6, 2019. . https://doi.org/10.1101/866244doi: bioRxiv preprint

Supplementary Materials
.CC-BY-NC-ND 4.0 International licensenot certified by peer review) is the author/funder. It is made available under aThe copyright holder for this preprint (which wasthis version posted December 6, 2019. . https://doi.org/10.1101/866244doi: bioRxiv preprint

Number of CellsProfiled
ProkaryoticEukaryotic
STRT-seq CEL-Seq
SMART-Seq
Fluidigm C1SMART-seq2
MARS-seq
Drop-Seq
CytoSeq InDrop
BarcodedBeads
Introduced
10x Genomics
SPLiT-seq
sci-RNA-seq
Seq-Well
DroNC-Seq
Tang et al
Kang et al(Burkholderia thailandensis)
Wang et al(Synechocystis sp. PCC6803) Liu et al
(Porphyromonas somerae)
2009 2010 2011 2012 2013 2014 2015 2016 2017 2018 2019
Study Publication Date
CombinatorialIndexing
Introduced
PETRI-seq(E. coli, S. aureus)
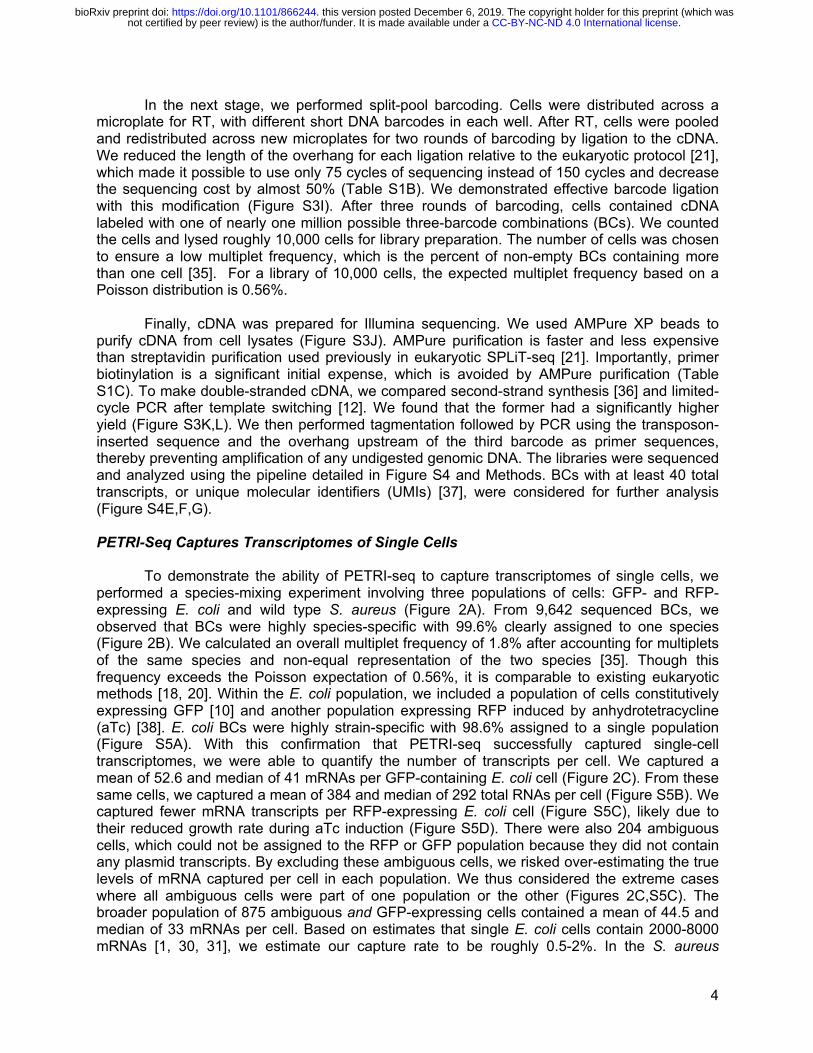
Figure S1: Timeline of scRNA-seq Method DevelopmentTimeline of key developments in eukaryotic and prokaryotic scRNA-seq detailing the number of cells sequenced in each experiment. Prokaryotic scRNA-seq has lagged significantly behind eukaryotic scRNA-seq due to technical challenges. The eukaryotic timeline is adapted from [1]. The timeline includes references [2-20].
.CC-BY-NC-ND 4.0 International licensenot certified by peer review) is the author/funder. It is made available under aThe copyright holder for this preprint (which wasthis version posted December 6, 2019. . https://doi.org/10.1101/866244doi: bioRxiv preprint

16 HourFormaldehyde
Fixation
50% EthanolWash
Lysozyme or Lysostaphin
Permeabilization
DNase Treatment
CountCells
2 MinuteCentrifugation
A
B
Cell Preparation
Split-Pool BarcodingPool Cells,
Pellet,Split
Ligation 1 Pool Cells, Split
CountCells
ReverseTranscription Ligation 2
LyseCells
C Library PreparationSecondStrand
SynthesisTagmentation Sequence = Buffer Wash = AMPure
Figure S2: Detailed Schematic of PETRI-Seq. (A) Detailed schematic of steps for cell preparation. (B) Detailed schematic of steps for split-pool barcod-ing. (C) Detailed schematic of steps for library preparation.
.CC-BY-NC-ND 4.0 International licensenot certified by peer review) is the author/funder. It is made available under aThe copyright holder for this preprint (which wasthis version posted December 6, 2019. . https://doi.org/10.1101/866244doi: bioRxiv preprint

H
K
Sample 1 Sample 2
G
1 kb
+ +
0.5 kb
+ +- - -AddedInactivated + + + -
L
A
Fixe
d B
ulk
E. c
oli R
NA
,Lo
g 10(T
PM
+1)
Standard Bulk E. coli RNA,Log10(TPM+1)
0 1 2 3 4 50
1
2
3
4
5
B C D E
I J
p<10-300 p<10-300
Rel
ativ
e A
bund
ance
rp
sB c
DN
A
Rel
ativ
e A
bund
ance
rp
sB c
DN
A
Rel
ativ
e A
bund
ance
rp
sB c
DN
A
Rel
ativ
e A
bund
ance
rpsB
G
enom
ic D
NA
Rel
ativ
e A
bund
ance
rp
sB c
DN
A
FDNase
RT AfterDNase
Inactivation
RT AfterNo
DNase
AMPurePurified
Figure S3: Development and Optimization of PETRI-Seq(A) Fixation without media resulted in a higher yield (n=3, p=0.012, 2-sided t-test) of rpsB cDNA than fixation with media (formaldehyde added directly to culture). qPCR was done after in situ RT with random hexamers. (B) Fixation did not alter the E. coli transcriptome. Correlation is shown between RNA purified from fixed E. coli cells (“Fixed Bulk”) and RNA purified directly from growing cells (“Standard Bulk”). For both libraries, reverse transcription was done after purifying the RNA. 2617 operons are included. (C) We did not detect a significant change in yield of rpsB cDNA when cells were resuspended in 50% ethanol as part of cell preparation (n=2, p=0.35, 2-sided t-test). qPCR was done after cell preparation and in situ RT with gene-specific RT primer. (n=2) (D) Lysozyme treatment significantly improved the yield of rpsB cDNA (n=3, p=0.001, 2-sided t-test). qPCR was done after cell preparation and in situ RT with random hexamers. (E) qPCR after DNase treatment or incubation with DNase buffer only (“No DNase”) confirmed the efficacy of in situ DNase treatment (n=8, p=0.035, 2-sided t-test). (F) qPCR after cell preparation and RT with gene-specific rpsB RT primer confirmed that DNase was inactivated, as we did not detect a signficant change in the yield of rpsB cDNA with or without DNase treatment (n=2, p=0.84, 2-sided t-test). (G) Gel of 775 bp PCR fragment after 1-hour incubation with cells prepared for in situ RT confirmed inactivation of DNase. For the lane that was not inactivated, DNase was directly added to the incubation of cells with the PCR product. (H) Microscope images after cell preparation of E. coli. (I) qPCR after bulk RT and ligation with a 16-base or 30-base linker confirmed that ligation was effective with a 16-base linker. We detected a mild increase in ligation efficiency with the 16-base linker (p=0.001, n=3, 2-sided t-test), though the fold-change between the conditions was minor (1.5x). ΔΔCt was calculated for ligated product relative to total RT product and normalized to cDNA prepared with an RT primer including the ligated sequence. (J) qPCR after cell preparation and in situ RT showed that cDNA was retained after AMPure purification (n=4, p=0.69, 2-sided t-test). (K, L) Number of mRNA UMIs (K) or operons (J) per BC after PETRI-seq with second strand synthesis or template switch used for library preparation. Second-strand synthesis resulted in significantly more mRNAs per cell (p < 10-300, 2-sided Mann-Whitney U) and operons per cell (p < 10-300, 2-sided Mann-Whitney U). Libraries contained ~10,000 BCs and are shown here before further down-stream filtering for likely single cells. These were prepared using an unoptimized protocol.
100
101
102
103
Unpurified
.CC-BY-NC-ND 4.0 International licensenot certified by peer review) is the author/funder. It is made available under aThe copyright holder for this preprint (which wasthis version posted December 6, 2019. . https://doi.org/10.1101/866244doi: bioRxiv preprint

Demultiplex by barcode 1, barcode 2 then barcode 3 using cutadapt (Figure S4B)
Plot reads per BC as histogram and “knee” plot (Figure S4C), choose
BCs for downstream processing
Extract UMIs from beginning of read 1 (umi_tools extract)
Align read 2 to genomes (bwa)
Annotate features on bam file (featureCounts)
Find consensus UMI sequences and label on bam file (umi_tools group)
Collapse reads based on UMI
Plot reads per UMI histogram and determine threshold number of reads to include a UMI (Figure S4D)
Filter UMIs based on threshold number of reads
Generate gene count matrix from filtered UMIs
Remove read 2 sequences containingbarcodes (cutadapt)
A
B
C
E
S. aureus UMIs Per BC
E. c
oli U
MIs
Per
BC
S. aureusE. coliMixed
F G
Filter BCs based on minimum total number of UMIs per cell (Figure S4E,F,G)
NNNNNNNNNNNNNWGGTCCTTGGCTTCGCNNNNNNWCCTCCTACGCCAGASNNNNNN
UMI Linker Barcode2
Linker Barcode1
Barcode3
D
Figure S4: Computational Pipeline for PETRI-Seq(A) Schematic of computational steps, which are further detailed in Methods. (B) Structure of contig elements in read 1 after Illumina sequencing of PETRI-seq. To reduce the length of the sequence, barcodes overlap by one base with the adjacent linker sequence. (C) Representative “knee plot” used to select BCs for further analysis. The threshold line at 40,000 BCs is very inclusive to facilitate additional filtering down-stream. (D) Representative histogram of reads per UMI. A threshold line was set for each library. For this library, only UMIs with more than 3 reads were kept for downstream analysis. Threshold line at log10(3). (E) Species mixing plot without filtering. BCs with fewer than 40 UMIs per cell were removed from further analy-sis. Line segments at x=40 and y=40. (F) Distribution of E. coli BCs from species mixing plot in (D). BCs above the threshold line were used for further analysis and considered single E. coli cells. Threshold line at log2(40). (G) Distribution of S. aureus BCs from species mixing plot in (D). BCs above the threshold line were used for further analysis and considered single S. aureus cells. Threshold line at log2(40).
BC, Ordered byNumber of Reads
Cum
ulat
ive
Frac
tion
of R
eads
Log2(E. coli UMIs Per BC)
Num
ber o
f BC
s
Log2(S. aureus UMIs Per BC)
Num
ber o
f BC
s
Log10(Number of Reads)
Num
ber o
f UM
Is
.CC-BY-NC-ND 4.0 International licensenot certified by peer review) is the author/funder. It is made available under aThe copyright holder for this preprint (which wasthis version posted December 6, 2019. . https://doi.org/10.1101/866244doi: bioRxiv preprint

A B C
E. coli S. aureus
E
Ptet
- RFP MG1655
PrplN-GFP - aTcPrplN-GFP + aTcMG1655 - aTcMG1655 + aTcPtet-RFP - aTcPtet-RFP + aTc
PrplN
- GFP
D
mRNA UMIs Per Cell
OperonsPer Cell
Nu
mb
er
of
GF
P C
ells
0 2 4 8 16 32 64 1280 2 4 8 16 32 64 12864 256 1024
Total UMIs
Figure S5: Further Evaluation of PETRI-Seq for E. coli and S. aureus. (A) Quantification of BC collisions within the E. coli population by plasmid mRNAs. Cells without plasmid genes are omitted. BCs were assigned to a single cell type when greater than 90% of plasmid UMIs matched a single plasmid. Histograms (top, right) show the number of GFP BCs or RFP BCs, respectively, with the corresponding number of plasmid UMIs. (B) Distribution of total RNAs per GFP-containing expo-nential E. coli cell. 671 cells are included. (C) Distributions of mRNAs (left) and operons (right) per E. coli cell in three sub-populations, including RFP cells (contain RFP plasmid transcripts, top), ambiguous cells (contain no plasmid transcripts, bottom), both RFP cells and ambiguous cells (middle). (D) Left, growth curves for P
rplN-GFP, P
tet-RFP, and MG1655 (no plasmid) cells with and without aTc. Right, doubling times
calculated from the growth curves. Ptet
-RFP had a significantly longer doubling time than all other strains/conditions when induced with aTc (n=4, p<10-4, 2-sided t-test). (E) Breakdown of total aligned UMIs per cell for exponential E. coli and S. aureus PETRI-seq libraries.
RFP (333 BCs)GFP (671 BCs)Mixed (14 BCs)Neither (204 BCs)
.CC-BY-NC-ND 4.0 International licensenot certified by peer review) is the author/funder. It is made available under aThe copyright holder for this preprint (which wasthis version posted December 6, 2019. . https://doi.org/10.1101/866244doi: bioRxiv preprint

A B
C
D
log 10
(σ2 /μ
2 )
log10(μ)
log 10
(σ2 /μ
2 )
log10(μ)
32 181 16 64mRNA UMIsmRNA UMIs
Figure S6: Further Evaluation of Growth Phase Characterization by PETRI-Seq. (A) Biological replicate library shows that PETRI-seq can reproducibly distinguish between stationary and exponential cells by projecting cells onto the principal components calculated from the first library (bottom). 2424 cells are included. 1208 cells are below the threshold, and 1216 cells are above the threshold. mRNAs captured per cell on either side of the threshold line are shown (top). (B) PCA as in Figure 3B, but UMI counts were normalized using sctransform [21]. (C,D) Noise (σ2/μ2) versus mean (μ) for operon expres-sion in either exponential (D) or stationary (E) cells. Lines at y = -x indicates Poisson noise where σ2 = μ. Operon counts were normalized for each cell before plotting. Operons with fewer than 5 counts in the library were excluded, resulting in 1869 operons in (C) and 1898 operons in (D).
n = 2424
.CC-BY-NC-ND 4.0 International licensenot certified by peer review) is the author/funder. It is made available under aThe copyright holder for this preprint (which wasthis version posted December 6, 2019. . https://doi.org/10.1101/866244doi: bioRxiv preprint
C D
Exponential Bulk vs Aggregated Cells
Stationary Bulk vs Aggregated Cells
Stationary Bulk vs Aggregated Cells
Exponential Bulk vs Aggregated Cells
Δ Correlation
Δ C
orre
latio
n
Δ C
orre
latio
n
Exponential Single Cells Stationary Single Cells
Bulk Exponential
E. coli, log10
(TPM+1)
PE
TR
I-S
eq E
xponential
E. c
oli,
log
10(T
PM
+1)
all: r = 0.78non-zero: r = 0.89
Bulk Stationary
E. coli, log10
(TPM+1)
PE
TR
I-S
eq S
tationary
E. c
oli,
log
10(T
PM
+1)
all: r = 0.76non-zero: r = 0.82
A B
Figure S7: Defining Consensus Transcriptional States of Sub-Populations Using PETRI-Seq. (A) Correlation between mRNA abundances from 2794 aggregated exponential cells (PETRI-seq, predict-
ed by PCA) vs. bulk preparation from fixed exponential E. coli cells. The Pearson correlation coefficient (r)
was calculated for 2195 out of 2617 total operons, excluding plasmid operons and operons with zero counts
in either library (grey points), or r was calculated for 2612 operons, including operons with zero counts. (B)
Correlation between RNA abundances from 4597 aggregated stationary cells (PETRI-seq, predicted by
PCA) vs. bulk preparation from fixed stationary E. coli cells. The Pearson correlation coefficient (r) was
calculated for 2272 out of 2617 total operons, excluding plasmid operons and operons with zero counts in
either library (grey points), or r was calculated for 2612 operons, including those with zero counts. Bulk
libraries in (a,b) were prepared from different cultures (on different days) than PETRI-seq libraries. (C)
Bottom: The correlation between the aggregated mRNA counts of single exponential cells (PETRI-seq) and
an independently prepared bulk exponential population increases as more single cells are included.
Correlations were calculated from log10
(TPM+1) for each sample. Single cell transcriptomes were prepared
by PETRI-seq, and cell states were predicted by PCA. Best fit line is shown behind original data points (y =
ln(x) + b). Top: Difference between the y-values of the best-fit lines for the top curve and bottom curve in
plot below. (D) Bottom: The correlation between the aggregated mRNA counts of single stationary cells
(PETRI-seq) and an independently prepared bulk stationary population increases as more single cells are
included. Correlations were calculated from log10
(TPM+1) for each sample. Single cell transcriptomes were
prepared by PETRI-Seq, and cell states were predicted by PCA. Best fit line is shown behind original data
points (y = ln(x) + b). Top: Difference between the y-values of the best-fit lines for the top curve and bottom
curve in plot below.
Pe
ars
on
Co
rre
latio
n w
ith
Bu
lk
(all o
pe
ron
s in
clu
de
d)
Pe
ars
on
Co
rre
latio
n w
ith
Bu
lk
(all o
pe
ron
s in
clu
de
d)
Number of Exponential Cells Number of Stationary Cells
.CC-BY-NC-ND 4.0 International licensenot certified by peer review) is the author/funder. It is made available under aThe copyright holder for this preprint (which wasthis version posted December 6, 2019. . https://doi.org/10.1101/866244doi: bioRxiv preprint

log 10
(σ2 /μ
2 )
log10(μ)
C
B
D E
Putative PhageTranscriptional Regulator
SAUSA300_1968
2,130,0002,080,000 2,090,000 2,100,000 2,110,000 2,120,000
ϕSA3usa
Putative PhageRepressor
SAUSA300_1969
A
Figure S8: PETRI-Seq Reveals Rare Prophage Induction in Sub-Population of S. aureus Cells(A) S. aureus cells plotted on PC1 and PC2. 5,604 cells are included. A small population of 21 cells (red) expressed operons from the ϕSA3usa phage. (B) Distribution of PC1 loadings for all operons included in the S. aureus analysis. Eight operons from the ϕSA3usa phage have the highest PC1 loadings. (C) Map of genomic region surrounding ϕSA3usa in the genome of S. aureus strain USA300. Red arrows indicate phage operons upregulated along PC1. (D) Percent of mRNA UMIs mapping to the ϕSA3usa phage for the 18 cells containing phage UMIs. Three cells are composed of >79% phage transcripts. (E) Noise (σ2/μ2) versus mean (μ) for operon expression within an S. aureus population of 5,604 cells. 959 operons are included, as operons with fewer than 6 total UMIs in the library were excluded. The circled operon (red) is SAUSA300_1933-1925, which deviated significantly from the rest of the distribution (z-score = 17.3, p = 10-67).
.CC-BY-NC-ND 4.0 International licensenot certified by peer review) is the author/funder. It is made available under aThe copyright holder for this preprint (which wasthis version posted December 6, 2019. . https://doi.org/10.1101/866244doi: bioRxiv preprint

A
Item Supplier Approximate Cost Per Experiment (USD)
Primers IDT 22 Maxima H Minus Reverse
Transcriptase Fisher Scientific 80
TipOne Filter Tips USA Scientific 64
T4 DNA Ligase NEB 42
SUPERase·In RNase Inhibitor Fisher Scientific 35 INCYTO C-Chip Hemocytometer,
Semen Test Fisher Scientific 19
dNTPs NEB 2
DNase I Sigma 0.4
BSA Fisher Scientific 0.3
Lysozyme Fisher Scientific 0.1 NEBNext mRNA Second Strand
Synthesis Module NEB 7
Nextera XT DNA Library Preparation Illumina 6
Agencourt Ampure XP Beckman Coulter 27
Total: $305.80
Per Cell (10,000 Cells): $0.03
B
Sequencing Kit Supplier Cost (USD)
NextSeq 500/550 High Output Kit v2.5 (75 Cycles)
Illumina 1570
NextSeq 500/550 High Output Kit v2.5 (150 Cycles)
Illumina 3010
C
Item Supplier Approximate Initial Cost (USD)
Barcodes Round 1 IDT 1121
Barcodes Round 2 IDT 1158
Barcodes Round 3 IDT 606
Alternative:
Barcodes Round 3, Biotinylated
IDT 2314
Table S1: Cost Breakdown for PETRI-Seq (A) Approximate reagent costs for a single PETRI-seq experiment (2 cell preparations, 1 split-pool barcoding, 1 library preparation). (B) Sequencing costs for NextSeq 75 cycles vs 150 cycles. One PETRI-seq library only needs ~40 million reads, or one tenth of a sequencing kit. (C) Startup costs for PETRI-seq. Barcoding primers are the most significant initial expense, but cost is significantly reduced by using non-biotinylated round 3 barcodes.
.CC-BY-NC-ND 4.0 International licensenot certified by peer review) is the author/funder. It is made available under aThe copyright holder for this preprint (which wasthis version posted December 6, 2019. . https://doi.org/10.1101/866244doi: bioRxiv preprint

Primer Name
Description Sequence
SB5 rpsB qPCR primer (with SB5)
AAACCGTTCGTCAGTCCATC
SB6 rpsB qPCR primer (with SB6)
ATGTCTTTGATACCGCCCAG
SB10 rspB-specific RT primer /5Biosg/ACAGACATGTGCTCTTCCAGCTGAGAACGGCCTTCAC
SB12 SB10-binding rpsB qPCR primer (with SB13)
ACAGACATGTGCTCTTCCAG
SB13 rpsB qPCR primer (with SB12 or SB86 or SB115)
ATACCAACTCTGATCCGGAC
SB14 Template Switch Oligo AAGCAGTGGTATCAACGCAGAGTGAATrGrGrG
SB15 PCR Primer for After Template Switch (with
SB86)
AAGCAGTGGTATCAACGCAG
SB80 Round 3 Linker GCGAAGCCAAGGACCW
SB81 Round 3 Blocking 1 GCTTCGCTGCAATCGGACCTCGATTGCA
SB82 Round 3 Blocking 2 WGGTCCTTGGCTTCGC
SB83 Round 2 Linker STCTGGCGTAGGAGGW
SB84 Round 2 Blocking 1 GCCAGASACGTTAGGCAGGACCTAACGT
SB85 Round 2 Blocking 2 WCCTCCTACGCCAGAS
SB86 PCR Primer for After Template Switch (with
SB15 or SB13)
AGAATACACGACGCTCTTCC
SB94 Hexamer for RT Without Barcoding
AGAATACACGACGCTCTTCCGATCTNNNNNN
SB110 rpsB-specific RT Primer for Ligation Test
/5Phos/GCCAGAGGCCAGGAATGAGAACGGCCTTCAC
SB111 Linker for Ligation Test TTCCTGGCCTCTGGCGTAGGAGGTGGAAGA
SB113 Ligated Primer for Ligation Test
AGAATACACGACGCTCTTCCACCTCCTAC
SB114 rpsB-specific RT Primer for Ligation Test, Positive
Control
AGAATACACGACGCTCTTCCACCTCCTACGCCAGAGGCCAGGAATGAGAACGGCCTTCAC
SB115 qPCR Primer for Ligation Test (with SB13)
AGAGGCCAGGAATGAGAAC
Table S2: Oligonucleotides Used In This Study Name, description, and sequence of all single-tube (excluding 96-well barcode plates) oligonucleotides used in the study. Table S3: 96-Well Oligonucleotides Used for PETRI-Seq Barcoding (Separate File) Sequences of 96 round 1 RT primers, 96 round 2 ligation primers, and 96 round 3 ligation primers.
.CC-BY-NC-ND 4.0 International licensenot certified by peer review) is the author/funder. It is made available under aThe copyright holder for this preprint (which wasthis version posted December 6, 2019. . https://doi.org/10.1101/866244doi: bioRxiv preprint

Supplementary References 1. Svensson V, Vento-Tormo V, Teichmann SA. Exponential scaling of single-cell RNA-seq in the past decade. Nat Protoc. 2018;13(4):599-604. 2. Kang Y, Norris MH, Zarzycki-Siek J, Nierman WC, Donachie SP, Hoang TT. Transcript amplification from single bacterium for transcriptome analysis. Genome Res. 2011;21(6):925-35. 3. Wang J, Chen L, Chen Z, Zhang W. RNA-seq based transcriptomic analysis of single bacterial cells. Integr Biol (Camb). 2015;7(11):1466-76. 4. Liu Y, Jeraldo P, Jang JS, Eckloff B, Jen J, Walther-Antonio M. Bacterial Single Cell Whole Transcriptome Amplification in Microfluidic Platform Shows Putative Gene Expression Heterogeneity. Anal Chem. 2019;91(13):8036-44. 5. Tang F, Barbacioru C, Wang Y, Nordman E, Lee C, Xu N, et al. mRNA-Seq whole-transcriptome analysis of a single cell. Nat Methods. 2009;6(5):377-82. 6. Islam S, Kjällquist U, Moliner A, Zajac P, Fan J, Lönnerberg P, et al. Characterization of the single-cell transcriptional landscape by highly multiplex RNA-seq. Genome Research. 2011;21(7):1160-7. 7. Hashimshony T, Wagner F, Sher N, Yanai I. CEL-Seq: Single-Cell RNA-Seq by Multiplexed Linear Amplification. Cell Reports. 2012;2(3):666-73. 8. Ramsköld D, Luo S, Wang YC, Li R, Deng Q, Faridani OR, et al. Full-length mRNA-Seq from single-cell levels of RNA and individual circulating tumor cells. Nat Biotechnol. 2012;30(8):777-82. 9. Brennecke P, Anders S, Kyoung K, J.K., Kołodziejczyk AA, Zhang X, Proserpio V, et al. Accounting for technical noise in single-cell RNA-seq experiments. Nature Methods. 2013;10(11):1093-5. 10. Picelli S, Björklund ÅK, Faridani OR, Sagasser S, Winberg G, Sandberg R. Smart-seq2 for sensitive full-length transcriptome profiling in single cells. Nat Methods. 2013;10(11):1096-8. 11. Paul F, Arkin Y, Giladi A, Jaitin DA, Kenigsberg E, Keren-Shaul H, et al. Transcriptional Heterogeneity and Lineage Commitment in Myeloid Progenitors. Cell. 2015;163(7):1663-77. 12. Jaitin DA, Kenigsberg E, Keren-Shaul H, Elefant N, Paul F, Zaretsky I, et al. Massively Parallel Single-Cell RNA-Seq for Marker-Free Decomposition of Tissues into Cell Types. Science. 2014;343(6172):776-9. 13. Fan HC, Fu GK, Fodor SP. Expression profiling. Combinatorial labeling of single cells for gene expression cytometry. Science. 2015;347(6222):1258367. 14. Macosko EZ, Basu A, Satija R, Nemesh J, Shekhar K, Goldman M, et al. Highly Parallel Genome-wide Expression Profiling of Individual Cells Using Nanoliter Droplets. Cell. 2015;161(5):1202-14. 15. Klein AM, Mazutis L, Akartuna I, Tallapragada N, Veres A, Li V, et al. Droplet barcoding for single-cell transcriptomics applied to embryonic stem cells. Cell. 2015;161(5):1187-201. 16. Zheng GX, Terry JM, Belgrader P, Ryvkin P, Bent ZW, Wilson R, et al. Massively parallel digital transcriptional profiling of single cells. Nat Commun. 2017;8:14049. 17. Gierahn TM, Wadsworth I, M.H., Hughes TK, Bryson BD, Butler A, Satija R, et al. Seq-Well: portable, low-cost RNA sequencing of single cells at high throughput. Nature Methods. 2017;14(4):395. 18. Cao J, Packer JS, Ramani V, Cusanovich DA, Huynh C, Daza R, et al. Comprehensive single-cell transcriptional profiling of a multicellular organism. Science. 2017;357(6352):661-7. 19. Rosenberg AB, Roco CM, Muscat RA, Kuchina A, Sample P, Yao Z, et al. Single-cell profiling of the developing mouse brain and spinal cord with split-pool barcoding. Science. 2018;360(6385):176-82. 20. Habib N, Avraham-Davidi I, Basu A, Burks T, Shekhar K, Hofree M, et al. Massively parallel single-nucleus RNA-seq with DroNc-seq. Nature Methods. 2017;14(10):955-8.
.CC-BY-NC-ND 4.0 International licensenot certified by peer review) is the author/funder. It is made available under aThe copyright holder for this preprint (which wasthis version posted December 6, 2019. . https://doi.org/10.1101/866244doi: bioRxiv preprint

21. Hafemeister C, Satija R. Normalization and variance stabilization of single-cell RNA-seq data using regularized negative binomial regression. Biorxiv. 2019:576827.
.CC-BY-NC-ND 4.0 International licensenot certified by peer review) is the author/funder. It is made available under aThe copyright holder for this preprint (which wasthis version posted December 6, 2019. . https://doi.org/10.1101/866244doi: bioRxiv preprint