Embed Size (px)
Citation preview

Project Title: BIO_SOS Biodiversity Multisource Monitoring System: from Space TO Species
Contract No: FP7-SPA-2010-1-263435
Instrument:
Thematic Priority:
Start of project: 1 December 2010
Duration: 36 months
Deliverable No: D6.6
Selected bio-indicators
Due date of deliverable:
30 November 2011
Actual submission date:
1 December 2011
Version: 1st version
Main Authors: Anna Bonardi (P10), Panayotis Dimopoulos (P2), Francesco Ficetola (P10), Athanasios S. Kallimanis (P2), Rocco Labadessa (P8), Paola Mairota (P8), Emilio Padoa-Schioppa (P10)

Project ref. number 263435
Project title BIO_SOS: Biodiversity Multisource Monitoring System: from Space to Species
Deliverable title Selected bio-indicators
Deliverable number D6.6
Deliverable version <Version, e.g. Version 1>
Previous version(s) <List of previous versions, if any>
Contractual date of delivery
30 November 2011
Actual date of delivery 1 December 2011
Deliverable filename BIO_SOS_6_6_selection-bio-indicators_v2.doc
Nature of deliverable R
Dissemination level PU = Public
Number of pages 32
Workpackage WP 6 Task 6.4
Partner responsible Partner 10 (UNIMIB)
Author(s) Anna Bonardi (P10), Panayotis Dimopoulos (P2), Francesco Ficetola (P10), Athanasios S. Kallimanis (P2), Rocco Labadessa (P8), Paola Mairota (P8) Emilio Padoa-Schioppa (P10)
Editor Emilio Padoa-Schioppa
EC Project Officer Florence Beroud
Abstract To identify appropriate bio-indicators species for BIO_SOS we have used existing datasets (as indicated in D4.1) and we have checked a recent scientific literature in order to provide a scientific consistent selection of bio-indicator species. Our choice is based on (i) the possibility to compare niche models with and without GHCs; (ii) the usefulness for stakeholders; (iii) the possibility to carry out comparison among different sites; and (iv) the actual availability of the distributional data.
Keywords Bio-indicator, surrogate taxa, focal species

D6.6 Selected bio-indicators
BIO_SOS FP7-SPACE-2010-1 GA 263435 Page 3 of 31
Signatures
Written by Responsibility- Company Date Signature
Emilio Padoa-Schioppa UNIMIB
Verified by
Harini Nagendra WP6 Leader (P5)
Approved by
Rob Jongman QAP Member (P4)
Palma Blonda Coordinator (P1)

D6.6 Selected bio-indicators
BIO_SOS FP7-SPACE-2010-1 GA 263435 Page 4 of 31
Table of Contents
1. Executive summary .......................................................................................................................... 5
2. Introduction ....................................................................................................................................... 6
3. Bio-indicators: terminology and state of the art ................................................................................. 7
3.1 Terminology ........................................................................................................................... 7
3.2 State of the art ........................................................................................................................ 9
3.2.1 Plants .............................................................................................................................. 13
3.2.2 Vertebrates ...................................................................................................................... 14
3.2.3 Invertebrates .................................................................................................................... 14
4. Selection of bio-indicators for BIO_SOS program ........................................................................... 16
4.1 Introduction: existing information .......................................................................................... 16
4.2 Criteria for selection of bio-indicators.................................................................................... 16
4.3 Selected bio-indicators ......................................................................................................... 18
5. Appendix......................................................................................................................................... 20
5.1 Appendix 1: Parameters for bibliographic research in the ISI Web of Science ...................... 20
5.1.1 Plants .............................................................................................................................. 20
5.1.2 Vertebrates ...................................................................................................................... 20
5.1.3 Invertebrates .................................................................................................................... 21
5.2 Appendix 2: Available information on biodiversity in the study sites ...................................... 22
5.3 Appendix 3: Acronym list ...................................................................................................... 27
6. References ..................................................................................................................................... 28

D6.6 Selected bio-indicators
BIO_SOS FP7-SPACE-2010-1 GA 263435 Page 5 of 31
1. Executive summary
In task 6.4 the relationship between the GHCs and abundance and composition of some species, both animals and plants, will be investigated by ecological niche modelling. GHCs were selected in D2.1 as surrogate biodiversity measure, whereas D6.6 aims to identify the taxa, or functional groups of species, that are most suitable to investigate the relationships with the GHCs, with the pressures and landscape features, and (possibly) with other indicators detected from EO data and selected in D2.1.
Main criteria for this selection are (i) the possibility to compare niche models with and without GHCs; (ii) the usefulness for stakeholders; (iii) the possibility to carry out comparison among different sites; and (iv) the actual availability of the distributional data.
The selected bio-indicators are available in existing datasets or, according with deadline of next deliverables, will be collected during spring 2012.

D6.6 Selected bio-indicators
BIO_SOS FP7-SPACE-2010-1 GA 263435 Page 6 of 31
2. Introduction
The main aim of the BIO_SOS project is the development of an operational ecological modelling system suitable for effective and timely multi-annual monitoring of Natura 2000 sites and their surroundings in areas exposed to different and combined type of pressures. The project will:
1. adopt and develop novel operational automatic High spatial Resolution (HR), Very High spatial Resolution (VHR) and hyper-spectral resolution Earth Observation (EO) data pre-processing and understanding techniques for Land Cover (LC) map and LC Change (LCC) map generation eligible for use in biodiversity monitoring. This is tantamount to saying that BIO_SOS is expected to provide improved operational core service products with respect to state-of-the-art satellite-based LC and LCC mapping systems.
2. Develop a modelling framework (scenario analysis) to combine EO and in-situ data in support to the automatic provision of biodiversity indicators and provide a deeper understanding, assessment and prediction of the impacts that human induced pressures may have on biodiversity. This means BIO_SOS aims at developing and integrating new and existing models able to evaluate and predict trends in biodiversity issues. This will lead to the development of new downstream services production.
In order to achieve this, the BIO_SOS project will test the integration of existing and new automatic EO data processing techniques to enable better use of observations over different scales and link that with in situ information. Focus is on the use of VHR EO data to detect changes to be embedded in innovative ecological modelling.
General Habitat Categories (GHCs; Bunce et al. 2008 and 2011) were selected as surrogate measure of biodiversity (D2.1). GHCs are gathered from Remote Sensing (RS) EO data as well as in situ data , therefore they represent the link between detailed site-based level measures and habitat assessments from remote sensing. Nevertheless, there is a growing need to assess the relationship between the indicators and the entities they are assumed to indicate, e.g. biodiversity (Wiens et al., 2008; Cushman et al., 2010; Lindenmayer and Likens, 2011).
Moreover, the Habitats Directive (92/43/EEC) requires the monitoring of some species of European importance. Linking these target species (of interest for the end users of BIO_SOS, i.e. Natura 2000 managers) to RS data will help to identify areas where the presence of those species is most likely, and will allow a prompt assessment of the impact of different pressures.
In task 6.4 we will investigate the relationship between the GHCs and the abundance and composition of some taxa, both animals and plants. The aim of this deliverable is to identify the taxa, or the functional groups of species, that are most suitable to investigate the relationship with the GHCs, with the pressures and landscape features, and (possibly) with other indicators detected from EO data and selected in D2.1.
Taxa will be selected following criteria reported in D2.1, chapter 3. In particular, animal and plant species will be selected on the basis of their policy and biodiversity relevance. In addition, their response to different pressures, both anthropic and natural, will be considered, like the abundance, the conservation status and distribution of a candidate species. Unfortunately, availability of suitable data on species distribution is limited. This is a challenge for the development and use of indicators for biodiversity assessments, as pointed out in D2.1 about the SEBI final choice of indicators. Therefore, the choice of taxa to use have to be necessarily highly data constrained.

D6.6 Selected bio-indicators
BIO_SOS FP7-SPACE-2010-1 GA 263435 Page 7 of 31
3. Bio-indicators: terminology and state of the art
3.1 Terminology
In the literature of biological indicators, different definitions have often been applied to the same object, therefore it is essential defining the technical terms. In the next paragraphs we define the terminology we will employ in the full text.
Indicator species. Landres (1988) defines indicator species as “an organism whose characteristics (e.g. presence or absence, population density, dispersion, reproductive success) are used as an index of attributes too difficult, inconvenient, or expensive to measure for other species or environmental conditions of interest”.
Bio-indicators, or “biological indicators”, concern with the identification and monitoring of changes in biota, reflecting environmental changes. They can be categorized in “environmental”, “ecological” and “biodiversity indicators”, corresponding to their main applications (McGeoch, 1998). The first ones respond predictably to a changes in environmental state or to environmental disturbances; ecological indicators demonstrate the effects of environmental changes on biotic systems; and biodiversity indicators are well known taxa which number of species can act as proxy for richness in poorly known, but sympatric taxonomic groups (McGeoch, 1998; Caro and O'Doherty, 1999). Nevertheless, in literature, non-biotic components of ecosystem have also been used as biodiversity surrogates: environmental information has been used as a proxy for species distributions, either by itself or in conjunction with species distribution data (Ferrier, 2002).
Surrogate, umbrella and flagship species. Bio-indicators are surrogate taxa, i.e., one or a small number of taxa used in conservation biology as short-cut to help managers and biologist tackle conservation problems. Surrogate species include also “umbrella” and “flagship species” (Caro and O'Doherty, 1999). Umbrella species may be used as surrogates to define size and habitat characteristics of the areas to be preserved, being these species more sensitive than the rest of community in term of area and habitat requirements. Umbrella species are often employed in conservation biology, but their real effectiveness is controversial (e.g., Andelman and Fagan, 2000; Roberge and Angelstam, 2004). Flagship species are employed to attract public attention, in order to raise funding and favour people acceptance of conservation measures. Flagship species do not need to be ecologically relevant, but only popular and charismatic, like as the giant panda or the tiger (Caro and O'Doherty, 1999).
Focal species. Starting from the concept of umbrella species, Lambeck (1997) proposed “a multi-species approach for defining the attributes required to meet the needs of the biota in a landscape and the management regimes that should be applied”, calling such species “focal”. Nevertheless the term “focal species” does not assume an univocal meaning across the literature, being often used to indicate umbrella, indicators or flagship species (Caro, 2000). Furthermore there are issues in the practical procedure to identify focal species, which is much more labour and data intensive than the identification of umbrella and flagship species (see Lindenmayer et al., 2002; see Ficetola et al., 2007). Actually Heink and Kowarik (2010) included the focal species among the “normative or prescriptive indicators”.
Normative indicators. According to Heink and Kowarik (2010) “Normative or prescriptive indicators relate to attributes that are directly affected by management (e.g fire regime, fragmentation) […] They can be used to stipulate the future condition of habitats”.
Indicators in ecology and environmental planning. In their review Heink and Kowarik (2010) provided the following definition of a such indicators: “a component or a measure of environmentally relevant phenomena used to depict or evaluate environmental conditions or changes or to set environmental goals. Environmentally relevant phenomena are pressures, states, and responses as defined by the
OECD (2003)”. Indeed, “indicators can be applied in descriptive, evaluative, and prescriptive contexts” (Heink and Kowarik, 2010). The need for establishment of a causal relationship or a correlation between indicator and a phenomenon of interest (indicandum) have been stressed by several authors in the last years (Wiens et al., 2008; Cushman et al., 2010; Lindenmayer and Likens, 2011), but a correlation

D6.6 Selected bio-indicators
BIO_SOS FP7-SPACE-2010-1 GA 263435 Page 8 of 31
between indicator and indicandum should be necessarily proved only for descriptive indicators (Heink and Kowarik, 2010).
In order to avoid misunderstanding, Heink and Kowarik suggest to distinguish between “ecological indicators” and “environmental policy indicators”, the former being used in scientific framework, and the latest in decision-making processes. Many authors underline the role of the biodiversity indicators as bridge between science and policy (Gregory et al., 2005; van Strien et al., 2009).
Keystone species and ecosystem engineers. Keystone species are species that have a disproportionately large effect on their environment relative to their abundance (Mills et al., 1993); such species play a critical role in maintaining the structure of an ecological community. Furthermore, a species is considered as an ecosystem engineer if it creates or modifies habitats (Jones et al., 1994). For example, species, like beavers, can modify the environment by mechanically changing materials from one form to another. Keystone species do not represent a shortcut to describe processes and patterns in conservation biology, nevertheless they may be suitable as surrogates, e.g. umbrella species; furthermore, multiple species are affected by their distribution pattern (Caro and O'Doherty, 1999).
Figure 3-1 summarizes relationships and definitions for surrogate types used in conservation biology.

D6.6 Selected bio-indicators
BIO_SOS FP7-SPACE-2010-1 GA 263435 Page 9 of 31
Figure 3-1 Surrogate used in conservation biology: conceptual relationships and definitions.
3.2 State of the art
Although surrogate species are increasingly employed in many management and conservation fields (e.g., see Lindenmayer and Likens, 2011), several papers criticized and discussed limitations of that approach (Andelman and Fagan, 2000; Lindenmayer et al., 2002; Wiens et al., 2008; Lindenmayer and Likens, 2011). The main advantage of this approach is that measuring surrogate species is faster and

D6.6 Selected bio-indicators
BIO_SOS FP7-SPACE-2010-1 GA 263435 Page 10 of 31
cheaper than measuring the original environmental quantity. That is why this approach has been used for the study of many environmental attributes ranging from biodiversity to pollution. And it found many applications in conservation from reserve site selection and management to monitoring freshwater quality. The main criticism deals with their efficacy, seldom rigorously investigated and often only assumed. Lindenmayer and Likens (2011), in particular, compare the surrogate and the direct measurement approaches in monitoring environmental and/or biodiversity changes. The focus of the direct measurement approach is on one entity or on a small group of entities in a target ecosystem, without to assume any surrogacy relationship with unmeasured entities. This characteristic makes it simpler and faster to prove a causal relationship between the key attributes of the ecosystem of interest and the entity to be measured, rather than using the surrogate approach, because the step concerning the demonstration of the surrogacy relationship is missing. However, in many cases it is difficult and often even impossible to characterize the functioning of a complex system, such as an ecosystem, or to measure a complicated multifaceted attribute, such as biodiversity, even by means of direct measurements. The size of the system, the complexity of the interactions involved, or the difficulty and cost of the measurements needed are often prohibitive. In the case of biodiversity, furthermore, which encompasses the variation of life forms from genes to species to ecosystems, it is not specified what constitutes a direct measurement. The focus on a small group of species is therefore a necessity.
Nevertheless, the debate of what is the most efficient biodiversity indicator is still going on and many different approaches have been proposed in the literature. Trying to categorize these approaches we could distinguish them to cross-taxon and within-taxon approaches. Cross-taxon approaches use the biodiversity of one taxon to infer the biodiversity of other taxa in the same area (among others Wolters et al., 2006; among others Billeter et al., 2008; Cushman et al., 2010). Within-taxon approaches try to substitute full species inventories with simpler measures of biodiversity. Several proposed indicators fall within this approach including the higher taxon surrogacy, the diversity of common or rare species, the diversity of endemic or threatened species.
The higher taxon surrogacy proposes predicting species richness based on the richness of a limited number of families, genera or orders (Gaston and Williams, 1993; Williams and Gaston, 1994; Mazaris et al., 2008b). Studies performed at various regions, habitat types and scales placing emphasis to different taxa demonstrated that this surrogacy method performed adequately well, providing a reliable estimation of species richness (Cardoso et al., 2004; Larsen and Rahbek, 2005; Villasenor et al., 2005). It has also been tested in both aquatic and terrestrial ecosystems and for various taxa like plants, algae, invertebrates, mammals, birds, amphibian and reptiles. This approach has also been proposed for monitoring trends in biodiversity and not only the spatial pattern of biodiversity (Kallimanis et al., 2012). Even though several studies support the reliability of this surrogacy there are few caveats raised in the literature. The surrogacy is more reliable as the taxonomic distance between indicator and indicatum is smaller, i.e. genera outperform families, while families outperform classes, etc. And after a point it does not work, for example there are many document cases that order richness is a poor indicator for species richness. A second caveat is that this approach works best for taxa that have a well-established taxonomy.
Several studies provide empirical support regarding the concurrence between the distribution of rare species and patterns of overall species richness (Lawler et al., 2003; Warman et al., 2004). Recently, more attention has been drawn to the contribution of common species in determining spatial patterns of species richness, suggesting that spatial patterns of biodiversity are mainly defined by the more widespread species, and thus common species are better biodiversity indicators than rare ones (Jetz and Rahbek, 2002; Lennon et al., 2004; Mazaris et al., 2008a). A major limitation of this approach is the definition of commonness and rarity, with many species being classified as common in one case and rare in another.
Rare and common may be defined either based on abundance estimates or on the size of their geographic range. One special case in the later is endemism. Endemism originally referred to being restricted to a particular area irrespective of its size, but following an influential paper by Terborgh and Winter (1983), the term was extended to species restricted to a small area (so-called narrow endemics). Endemism has been used as a biodiversity indicator. In a seminal and often cited paper Myers et al. (2000) used endemism as a main criterion to define global biodiversity hotspots. This approach performs
D6.6 Selected bio-indicators
BIO_SOS FP7-SPACE-2010-1 GA 263435 Page 11 of 31
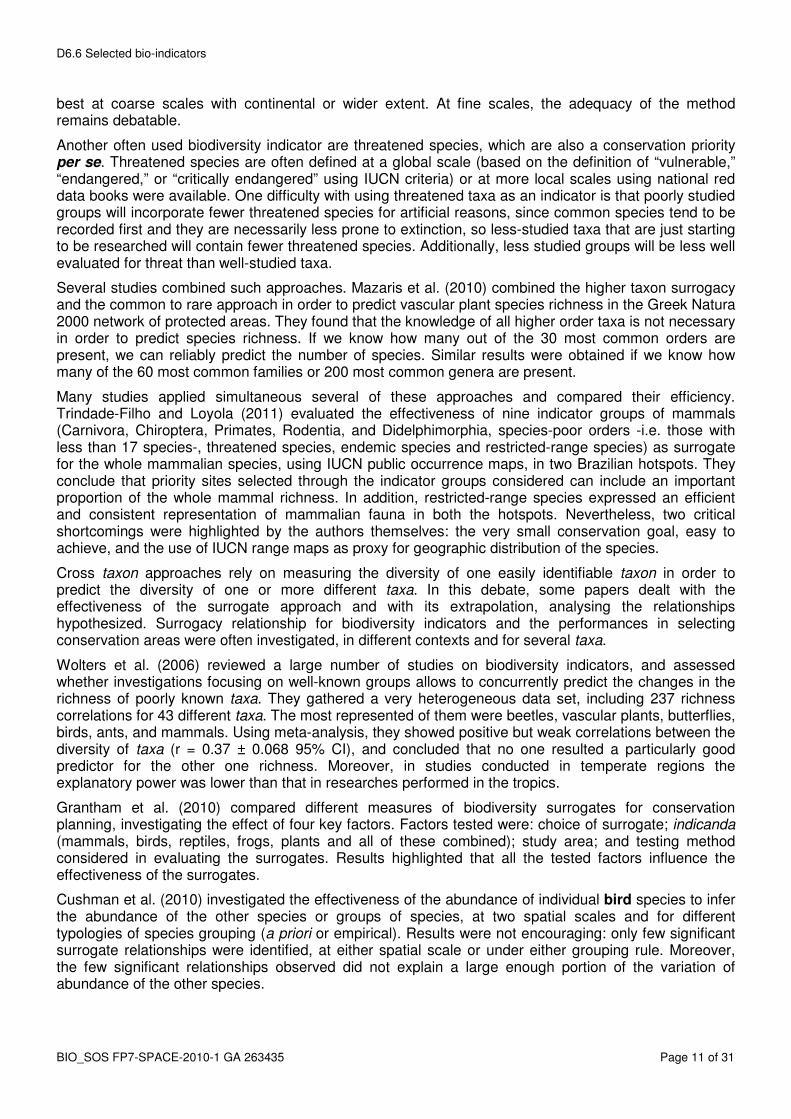
best at coarse scales with continental or wider extent. At fine scales, the adequacy of the method remains debatable.
Another often used biodiversity indicator are threatened species, which are also a conservation priority per se. Threatened species are often defined at a global scale (based on the definition of “vulnerable,” “endangered,” or “critically endangered” using IUCN criteria) or at more local scales using national red data books were available. One difficulty with using threatened taxa as an indicator is that poorly studied groups will incorporate fewer threatened species for artificial reasons, since common species tend to be recorded first and they are necessarily less prone to extinction, so less-studied taxa that are just starting to be researched will contain fewer threatened species. Additionally, less studied groups will be less well evaluated for threat than well-studied taxa.
Several studies combined such approaches. Mazaris et al. (2010) combined the higher taxon surrogacy and the common to rare approach in order to predict vascular plant species richness in the Greek Natura 2000 network of protected areas. They found that the knowledge of all higher order taxa is not necessary in order to predict species richness. If we know how many out of the 30 most common orders are present, we can reliably predict the number of species. Similar results were obtained if we know how many of the 60 most common families or 200 most common genera are present.
Many studies applied simultaneous several of these approaches and compared their efficiency. Trindade-Filho and Loyola (2011) evaluated the effectiveness of nine indicator groups of mammals (Carnivora, Chiroptera, Primates, Rodentia, and Didelphimorphia, species-poor orders -i.e. those with less than 17 species-, threatened species, endemic species and restricted-range species) as surrogate for the whole mammalian species, using IUCN public occurrence maps, in two Brazilian hotspots. They conclude that priority sites selected through the indicator groups considered can include an important proportion of the whole mammal richness. In addition, restricted-range species expressed an efficient and consistent representation of mammalian fauna in both the hotspots. Nevertheless, two critical shortcomings were highlighted by the authors themselves: the very small conservation goal, easy to achieve, and the use of IUCN range maps as proxy for geographic distribution of the species.
Cross taxon approaches rely on measuring the diversity of one easily identifiable taxon in order to predict the diversity of one or more different taxa. In this debate, some papers dealt with the effectiveness of the surrogate approach and with its extrapolation, analysing the relationships hypothesized. Surrogacy relationship for biodiversity indicators and the performances in selecting conservation areas were often investigated, in different contexts and for several taxa.
Wolters et al. (2006) reviewed a large number of studies on biodiversity indicators, and assessed whether investigations focusing on well-known groups allows to concurrently predict the changes in the richness of poorly known taxa. They gathered a very heterogeneous data set, including 237 richness correlations for 43 different taxa. The most represented of them were beetles, vascular plants, butterflies, birds, ants, and mammals. Using meta-analysis, they showed positive but weak correlations between the diversity of taxa (r = 0.37 ± 0.068 95% CI), and concluded that no one resulted a particularly good predictor for the other one richness. Moreover, in studies conducted in temperate regions the explanatory power was lower than that in researches performed in the tropics.
Grantham et al. (2010) compared different measures of biodiversity surrogates for conservation planning, investigating the effect of four key factors. Factors tested were: choice of surrogate; indicanda (mammals, birds, reptiles, frogs, plants and all of these combined); study area; and testing method considered in evaluating the surrogates. Results highlighted that all the tested factors influence the effectiveness of the surrogates.
Cushman et al. (2010) investigated the effectiveness of the abundance of individual bird species to infer the abundance of the other species or groups of species, at two spatial scales and for different typologies of species grouping (a priori or empirical). Results were not encouraging: only few significant surrogate relationships were identified, at either spatial scale or under either grouping rule. Moreover, the few significant relationships observed did not explain a large enough portion of the variation of abundance of the other species.
D6.6 Selected bio-indicators
BIO_SOS FP7-SPACE-2010-1 GA 263435 Page 12 of 31
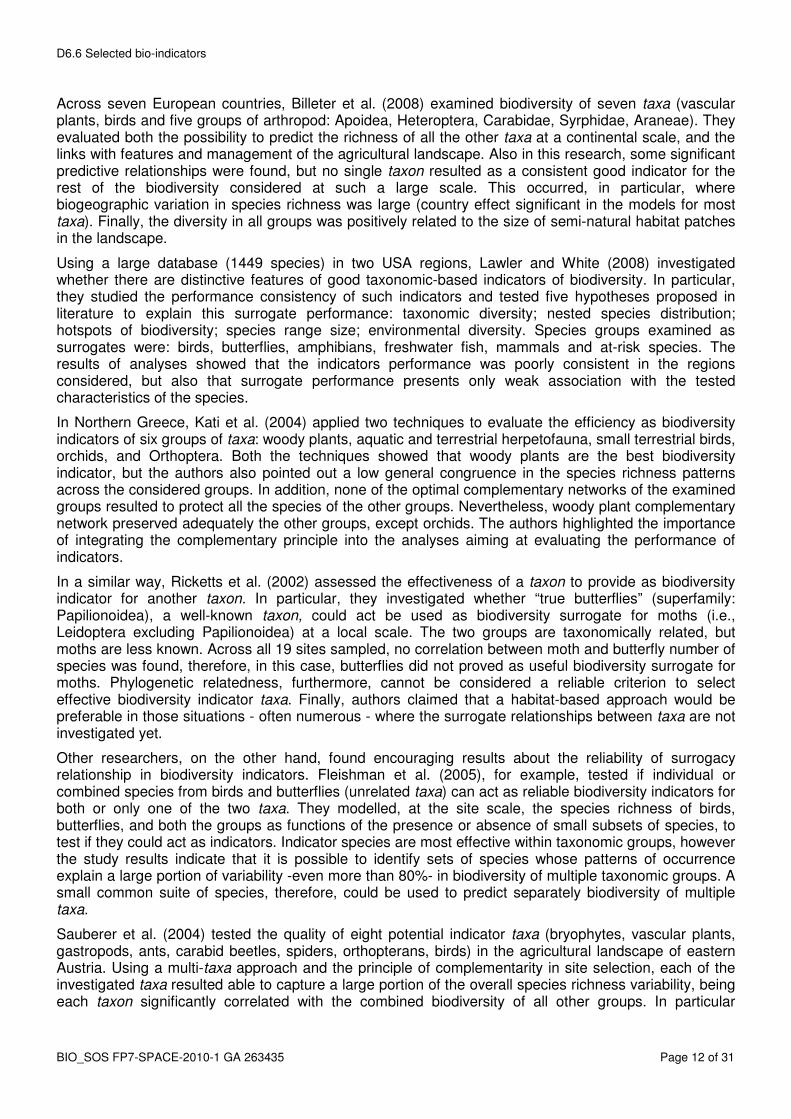
Across seven European countries, Billeter et al. (2008) examined biodiversity of seven taxa (vascular plants, birds and five groups of arthropod: Apoidea, Heteroptera, Carabidae, Syrphidae, Araneae). They evaluated both the possibility to predict the richness of all the other taxa at a continental scale, and the links with features and management of the agricultural landscape. Also in this research, some significant predictive relationships were found, but no single taxon resulted as a consistent good indicator for the rest of the biodiversity considered at such a large scale. This occurred, in particular, where biogeographic variation in species richness was large (country effect significant in the models for most taxa). Finally, the diversity in all groups was positively related to the size of semi-natural habitat patches in the landscape.
Using a large database (1449 species) in two USA regions, Lawler and White (2008) investigated whether there are distinctive features of good taxonomic-based indicators of biodiversity. In particular, they studied the performance consistency of such indicators and tested five hypotheses proposed in literature to explain this surrogate performance: taxonomic diversity; nested species distribution; hotspots of biodiversity; species range size; environmental diversity. Species groups examined as surrogates were: birds, butterflies, amphibians, freshwater fish, mammals and at-risk species. The results of analyses showed that the indicators performance was poorly consistent in the regions considered, but also that surrogate performance presents only weak association with the tested characteristics of the species.
In Northern Greece, Kati et al. (2004) applied two techniques to evaluate the efficiency as biodiversity indicators of six groups of taxa: woody plants, aquatic and terrestrial herpetofauna, small terrestrial birds, orchids, and Orthoptera. Both the techniques showed that woody plants are the best biodiversity indicator, but the authors also pointed out a low general congruence in the species richness patterns across the considered groups. In addition, none of the optimal complementary networks of the examined groups resulted to protect all the species of the other groups. Nevertheless, woody plant complementary network preserved adequately the other groups, except orchids. The authors highlighted the importance of integrating the complementary principle into the analyses aiming at evaluating the performance of indicators.
In a similar way, Ricketts et al. (2002) assessed the effectiveness of a taxon to provide as biodiversity indicator for another taxon. In particular, they investigated whether “true butterflies” (superfamily: Papilionoidea), a well-known taxon, could act be used as biodiversity surrogate for moths (i.e., Leidoptera excluding Papilionoidea) at a local scale. The two groups are taxonomically related, but moths are less known. Across all 19 sites sampled, no correlation between moth and butterfly number of species was found, therefore, in this case, butterflies did not proved as useful biodiversity surrogate for moths. Phylogenetic relatedness, furthermore, cannot be considered a reliable criterion to select effective biodiversity indicator taxa. Finally, authors claimed that a habitat-based approach would be preferable in those situations - often numerous - where the surrogate relationships between taxa are not investigated yet.
Other researchers, on the other hand, found encouraging results about the reliability of surrogacy relationship in biodiversity indicators. Fleishman et al. (2005), for example, tested if individual or combined species from birds and butterflies (unrelated taxa) can act as reliable biodiversity indicators for both or only one of the two taxa. They modelled, at the site scale, the species richness of birds, butterflies, and both the groups as functions of the presence or absence of small subsets of species, to test if they could act as indicators. Indicator species are most effective within taxonomic groups, however the study results indicate that it is possible to identify sets of species whose patterns of occurrence explain a large portion of variability -even more than 80%- in biodiversity of multiple taxonomic groups. A small common suite of species, therefore, could be used to predict separately biodiversity of multiple taxa.
Sauberer et al. (2004) tested the quality of eight potential indicator taxa (bryophytes, vascular plants, gastropods, ants, carabid beetles, spiders, orthopterans, birds) in the agricultural landscape of eastern Austria. Using a multi-taxa approach and the principle of complementarity in site selection, each of the investigated taxa resulted able to capture a large portion of the overall species richness variability, being each taxon significantly correlated with the combined biodiversity of all other groups. In particular

D6.6 Selected bio-indicators
BIO_SOS FP7-SPACE-2010-1 GA 263435 Page 13 of 31
vascular plant and bird diversity showed the highest correlations with the rest of the species richness, whereas carabid beetles and the gastropods were the most idiosyncratic groups.
Lund and Rahbek (2002) tested whether a single taxon can effectively drive the setting of conservation priority areas in Denmark, a temperate region, so that biodiversity in other groups is likewise represented. Data employed came from species distribution atlas of six taxa: elateridae, butterflies, large moths, chiroptera, birds, herpetofauna, for 434 species overall. Some of these groups represented effectively the other taxa; furthermore there was a high cross-taxon congruence in priority sets derived by complementarity analysis. In particular, in representing biodiversity of the other taxa, butterflies showed to perform rather better than the other tested groups. The relationship between birds and biodiversity was significant, but not excellent, while, bats predicted relatively well biodiversity.
Overall, results of the above examined papers suggest that any generalization of surrogacy tests needs caution, both in regions, taxa, temporal and spatial scales, ecosystems.
As pointed out by Lindenmayer and Likens (2011), across the literature almost all components of biotic systems have been proposed as indicators. They reported a long list of these taxa, including viruses, unicellular organisms, lichens, fungi, algae, ferns, vascular plants, and many groups of invertebrate and vertebrate. In order to provide a measure of the use of different biodiversity indicators in the scientific literature, in the following paragraphs we will report graphically the number of the papers published for each taxon. In all the cases, the last five years are the period with the highest number of scientific papers on the topic Researches were made among papers available in Web of Science (ISI) database. Terms and categories imposed for each search are reported in Appendix 1.
At this point we should also point out the use of non-biotic components of the ecosystems as biodiversity indicators. Given the fact that species’ distributional survey data are often restricted to small regions along with the onerous task of collecting data on surrogate taxon species distributions over extended areas, there is a strong argument for using environmental information as a proxy for species distributions, either by itself or in conjunction with species data (Ferrier, 2002). In this sense several environmental variables have been studies including: Climatic attributes (such as temperature and precipitation) Physicochemical variables (such as soil quality and water chemistry), Habitat types (obtained from ground-based or sometimes aerial surveys and include landform-vegetation classes such as coastal vegetation, wetlands, or subalpine vegetation), Landscape structure variables (such as fragmentation or connectivity).
Environmental diversity has been shown to perform adequately well for the selection of reserve sites (Faith and Walker, 1996; Lobo et al., 2001). Another abiotic environmental surrogate for the distribution of biodiversity used for conservation planning is landscape heterogeneity (Lombard et al., 2003). Oliver et al. (2004) showed that each type of land system supported components of biodiversity either not found, or found infrequently, on other land systems. And they suggested that land systems function as surrogates for biodiversity, and that conservation-area networks representing land-system diversity will also represent biological diversity.
3.2.1 Plants
Plants are the organisms the most employed as biodiversity indicators: 988 overall records (Figure 3-2).

D6.6 Selected bio-indicators
BIO_SOS FP7-SPACE-2010-1 GA 263435 Page 14 of 31
1992 1993 1994 1995 1996 1997 1998 1999 2000 2001 2002 2003 2004 2005 2006 2007 2008 2009 2010 2011
0
20
40
60
80
100
120
140
Plants
Plants Vascular plants Woody plants
years
num
ber
of
pa
pe
rs
Figure 3-2. Number of papers published about the plants and two categories of them: vascular and woody.
3.2.2 Vertebrates
Among the vertebrates, birds are the class the most instigated, with 402 overall records, reptiles are the less studied taxon, 46 records only (Figure 3-3).
1992 1993 1994 1995 1996 1997 1998 1999 2000 2001 2002 2003 2004 2005 2006 2007 2008 2009 2010 2011
0
10
20
30
40
50
60
Vertebrates
mammals birds reptiles amphibians
years
num
ber
of
pa
pers
Figure 3-3. Number of papers published about the classes of vertebrates, but fishes.
3.2.3 Invertebrates
Among the invertebrates, insect are the most employed taxon in biodiversity indicator context (277 records), and butterflies are the most used insects (Figures 3-4 and 3-5).

D6.6 Selected bio-indicators
BIO_SOS FP7-SPACE-2010-1 GA 263435 Page 15 of 31
1992 1993 1994 1995 1996 1997 1998 1999 2000 2001 2002 2003 2004 2005 2006 2007 2008 2009 2010 2011
0
5
10
15
20
25
30
35
40
Invertebrates
Insects Spiders Gastropods
years
num
ber
of
papers
Figure 3-4. Papers published about biodiversity indicators and three groups of invertebrates: insects, spiders, and gastropods.
1992 1993 1994 1995 1996 1997 1998 1999 2000 2001 2002 2003 2004 2005 2006 2007 2008 2009 2010 2011
0
5
10
15
20
25
30
35
40
Insects
Insects Butterflies Carabidae Orthoptera
years
num
ber
of
papers
Figure 3-5. Papers published about the insects and three taxa of them: butterflies, Carabidae, and Orthoptera.

D6.6 Selected bio-indicators
BIO_SOS FP7-SPACE-2010-1 GA 263435 Page 16 of 31
4. Selection of bio-indicators for the BIO_SOS project
4.1 Introduction: existing information
The deliverable 4.1 is the starting point to select bio-indicator species for BIO_SOS program. Each study site of the program (see Table 4-1) has some pre-existing data set and in D4.1 all data sets are listed.
Table 4-1 Test sites.
BIO_SOS CODE N2KCode N2K Name
(SCIs/SACs, Habitats Directive)
(SPAs, Birds Directive)
IT1 IT9110008 IT9110039 Valloni e steppe pedegarganiche
IT2 IT9110005 IT9110038 Zone umide della Capitanata-Paludi presso il Golfo di Manfredonia
IT3 IT9120007 IT9120007 Murgia Alta
IT4 IT9150032 IT9150014 Le Cesine
GR1 GR2120001 GR2120005 Ekvoles Kalama
GR2 GR2120002 GR2120006 Elos Kalodiki
GR3 GR2120004 Stena Kalama
NL NL9801023 NL3009017 Veluwe. Dutch case study concentrates on part N2K, namely Ginkelse and Ederheide, a heathland area and Weekeromse Zand an inland sand dune area
PT1 PTCON0021 PTZPE0037 Rios Sabor e Maçãs
PT2 PTCON0001 PTZPE0002 Peneda-Gerês
UK Cors Fochno
BR Brazilian site in the Amazon
For each site we summarize here the available information on biodiversity, according with the information described in D4.1.
Tables reported in Appendix 2 describe the details for the study sites. Description of the resource, temporary extension, property of data are particularly important.
4.2 Criteria for selection of bio-indicators
On the basis of previous pages we can follow different ways to select bio-indicators. We need to select a group of bio-indicators following 4 criteria:
� possibility to compare niche models with and without GHCs

D6.6 Selected bio-indicators
BIO_SOS FP7-SPACE-2010-1 GA 263435 Page 17 of 31
� usefulness for stakeholders
� possibility to carry out comparison among different sites
� availability of data
Comparison of Niche Models with / without GHCs. The possibility to compare niche models with and without GHCs will depend mostly on the real availability of different maps with and without GHCs. On the basis of previous reports (D4.1, D5.1, and D6.1) we suppose that this kind of analysis can be carried out in a few sites only. The possibility to build a Niche Model can be carried out using presence only data (with the help of programs like MaxEnt – Elith et al., 2011). MaxEnt is considered one of the most efficient approaches to ecological niche modelling using presence-only data (Elith et al., 2006; Elith et al., 2011). The program assesses the probability of presence in a given cell on the basis of environmental features in that cell; MaxEnt establishes flexible relationships between the dependent and independent variables, and is therefore well suited to evaluate the potential distribution of species also in presence of complex or non-linear relationships. Furthermore, it is possible to identify the relationships between GHCs and the species richness of specific target groups. They may be both taxonomic groups (e.g., birds, insects) and functional groups (e.g., species affected by fragmentation, woody plants). These relationships will be assessed through spatially-explicit generalized linear models (Beale et al., 2010).
These analyses do not require time series, but just accurate georeferenced presence records of the species of interest. It will be therefore straightforward performing the analyses when presence records are available.
Usefulness for stakeholders. One of the aims of this project is to have a link with stakeholders, and both in previous pages and in D2.1 usefulness for stakeholders was underlined as a key criterion for the selection of bio-indicators.
According to SEBI report (EEA, 2007), in D2.1 the key criteria to select an indicator were:
� Policy relevant and meaningful
� Biodiversity relevant
� Progress towards 2010 target
� Well founded methodology
� Acceptance and intelligibility
� Routinely collected data
� Cause-effect relationship
� Spatial coverage
� Temporal trend
� Country comparison
� Sensitivity towards changes
In this project, we want to build niche models using species that have a conservation value. Considering that the test areas are Natura 2000 sites, we will probably choose species that are inserted into Habitats and Birds Directive Annexes or in international red lists.
Invasive alien species are one other group of species that can be useful for stakeholders. In this case we get an indicator of pressure over the environment.

D6.6 Selected bio-indicators
BIO_SOS FP7-SPACE-2010-1 GA 263435 Page 18 of 31
Comparison among different sites. If the list of species (not yet available, see later) shows some overlap on species distribution among different sites, we will choose some of those species (assuming they have the same quality of data).
Availability of data. The real availability of data is an essential condition. We operate our selection choosing among the existing data set described in D4.1 and reported in Appendix 2. In particular we will mostly focus on use data that not require any further license.
4.3 Selected bio-indicators
We propose to use the distribution of species richness and the distribution of ecological groups to investigate if GHC can be useful to predict their distribution. This approach will be used for the Italian sites that have both GHC and non-GHC maps. Data on both species distribution and species richness are based on species in Annex I of the Birds Directive (2009/147/EC) and Annexes II and IV of Habitats Directive (92/43/EEC), therefore our analyses will be useful also for the stakeholders.
From Portugal sites there is a species of high conservation value: Geomaculus maculosus, declared present in both sites. We propose to use this species to work with a species relevant for stakeholders and with the possibility to carry out a comparison among those sites.
Birds and insects can have a very relevant value for biodiversity, as our analysis of the literature (PAR. 3.2) showed that birds and insects are the most often used bio-indicators in biodiversity studies. If data are available, birds and insects will be the taxa of choice for our analyses.
We must consider that at 20 November 2011 no data set (although declared available) has been provided for data inspection, so we cannot provide complete details on the taxa and areas on which focusing analyses. Nevertheless, when the data will be available, it will be easy identifying the most appropriate species, on the basis of guidelines identified in this deliverable.
Considering that no revised dataset has been provided for Italian sites, the selection of bio-indicators in IT3 could be supported by data derived from the field activity planned in task 6.2 for 2012. Two animal classes (Aves and Hexapoda) will be considered, namely, breeding birds, butterflies (Lepidoptera) and grasshoppers (Orthoptera). Field surveys will be carried out in areas of the IT3 site covered by both GHC and non GHC maps, according to the protocols defined in D4.3. These groups are well known to be useful environmental and diversity indicators (see chapter 3.2) especially in managed grasslands, which are the most important habitats in IT3 site (D6.3). Grasshoppers are even more associated with grass communities. Many species can be considered as “keystones” as they represent the majority of insect biomass of herbaceous layer and are very important for the preservation of grassland food web structure (Ryszkowski et al., 1993). These data will allow to build diversity and evenness profiles (Hill, 1973; 1997) for the considered communities and therefore provide indicators useful to make comparisons across space and/or time. Diversity and evenness profiling are gaining momentum in ecology. Evenness profiling in particular, seems very promising to provide deeper insights into community structure, revealing the contributions of both rare and common species to biodiversity trends (Studeny et al., 2011). Multivariate analyses, in connection with landscape pattern analysis at landscape-class-patch levels, will be applied to identify those species capable of indicating changes in land use/land cover related to human pressures.
According to D4.1 and D4.3 invasive species (e.g. Lantana camara and Chromolaena odorata in India, or wild boar –Sus scrofa – in IT3) can be important, and we will consider the possibility to build models using the known distribution of invasive species (both animals or plants) in test sites, and linking those species with GHC and LCC. In the Netherlands Campylopus introflexus is an invasive species in the Wekeromse Zand and purple moor grass (Molinia caerulea), brambles (Rubus fruticosus spp.) and tree encroachment (Pinus sylvestris and Betula pendula) are invasive on the Ginkelse and Eder heath
Any other additional field data collected during the field activity, or now available (i.e., additional data from Indian sites) may be taken into account, considering deliverables deadlines (D 6.7 deadline is month 18).

D6.6 Selected bio-indicators
BIO_SOS FP7-SPACE-2010-1 GA 263435 Page 19 of 31
Biodiversity indicators (according to D2.2) Despite the wide range of biodiversity indicators identified by CBD and by SEBI2010, consistently with the indicators selected for BIO_SOS (D2.1), in almost all test sites of the BIO_SOS project there is a core of three key biodiversity indicators identified as appropriate and critical to monitor. More specifically, these key indicators will be related to the state and trend of: (i) habitats of European interest (extent and change), (ii) abundance and distribution of selected species, and (iii) fragmentation of natural and semi-natural areas. These indicators are valuable to address the effects of processes and drivers such as land use change (e.g., agricultural extensification or abandonment, urban sprawl, vegetation dynamics) and natural disturbance regimes (e.g., wildfires, floods). Even though the pressures and threats are not identical in all sites, and consequently all the processes and drivers are not applicable in all sites, the same key indicators seem to be effective in almost all cases.
On a secondary basis, other indicators will be considered in specific sites when developing specific studies. These include: (i) state and trends of ecosystem function (e.g., productivity, phenology), of landscape diversity and spatial structure and function, and of species diversity (e.g., species richness); (ii) intensity of pressures and threats e.g., land use and land use change, fire regimes, invasive species distribution/coverage; (iii) response/adaptation (indicators related to e.g., land use planning, nature protection inside and outside protected areas, allocation of conservation resources/funding and environmental compensatory measures).
These indicators can contribute to build more informative models of ecological niche for the selected taxa.

D6.6 Selected bio-indicators
BIO_SOS FP7-SPACE-2010-1 GA 263435 Page 20 of 31
5. Appendix
5.1 Appendix 1: Parameters for bibliographic research in the ISI Web of Science
Parameters used for a bibliographic research carried out in November 2011 and total number of obtained records.
5.1.1 Plants
TS=( biodiversity and bio-indicator* and plant*) or TS=(biodiversity and indicator* and plant*) Refined by: Web of Science Categories=( ECOLOGY OR ENVIRONMENTAL SCIENCES OR BIODIVERSITY CONSERVATION OR REMOTE SENSING OR FORESTRY OR ORNITHOLOGY OR PLANT SCIENCES OR AGRICULTURE MULTIDISCIPLINARY OR ENTOMOLOGY OR ENVIRONMENTAL STUDIES OR SOIL SCIENCE OR MARINE FRESHWATER BIOLOGY OR BIOLOGY OR AGRONOMY OR ZOOLOGY OR GEOGRAPHY OR MULTIDISCIPLINARY SCIENCES OR URBAN STUDIES ) Timespan=All Years. Databases=SCI-EXPANDED, SSCI, A&HCI. Lemmatization=On Total records: 988
VASCULAR PLANTS TS=( biodiversity and bio-indicator* and vascular plant*) or TS=(biodiversity and indicator* and vascular plant*) Refined by: Web of Science Categories=( ECOLOGY OR BIOLOGY OR ENVIRONMENTAL SCIENCES OR GEOGRAPHY OR BIODIVERSITY CONSERVATION OR FORESTRY OR MARINE FRESHWATER BIOLOGY OR PLANT SCIENCES OR MULTIDISCIPLINARY SCIENCES OR REMOTE SENSING OR MYCOLOGY OR AGRICULTURE MULTIDISCIPLINARY OR URBAN STUDIES OR ENVIRONMENTAL STUDIES OR ZOOLOGY ) Timespan=All Years. Databases=SCI-EXPANDED, SSCI, A&HCI. Lemmatization=On Total records:169
WOODY PLANTS TS=( biodiversity and bio-indicator* and woody plant*) or TS=(biodiversity and indicator* and woody plant*) Refined by: Web of Science Categories=( ECOLOGY OR GEOGRAPHY PHYSICAL OR MULTIDISCIPLINARY SCIENCES OR ENVIRONMENTAL SCIENCES OR AGRONOMY OR FORESTRY OR BIODIVERSITY CONSERVATION OR ENTOMOLOGY OR URBAN STUDIES OR PLANT SCIENCES OR WATER RESOURCES OR AGRICULTURE MULTIDISCIPLINARY OR GEOGRAPHY OR ZOOLOGY OR ENVIRONMENTAL STUDIES OR MARINE FRESHWATER BIOLOGY ) Timespan=All Years. Databases=SCI-EXPANDED, SSCI, A&HCI. Lemmatization=On Total records: 61
5.1.2 Vertebrates
MAMMALS TS=( biodiversity and bio-indicator* and mammal*) or TS=(biodiversity and indicator* and mammal*) Timespan=All Years. Databases=SCI-EXPANDED, SSCI, A&HCI. Lemmatization=On Total records: 142
BIRDS TS=( biodiversity and bio-indicator* and bird*) or TS=(biodiversity and indicator* and bird*)

D6.6 Selected bio-indicators
BIO_SOS FP7-SPACE-2010-1 GA 263435 Page 21 of 31
Refined by: Web of Science Categories=( ECOLOGY OR PLANT SCIENCES OR ENVIRONMENTAL SCIENCES OR WATER RESOURCES OR BIODIVERSITY CONSERVATION OR ENTOMOLOGY OR FORESTRY OR BIOLOGY OR GEOGRAPHY PHYSICAL OR ENGINEERING ENVIRONMENTAL OR ENVIRONMENTAL STUDIES OR ORNITHOLOGY OR AGRICULTURE MULTIDISCIPLINARY OR REMOTE SENSING OR MULTIDISCIPLINARY SCIENCES OR GEOGRAPHY OR ZOOLOGY OR URBAN STUDIES OR LIMNOLOGY OR MARINE FRESHWATER BIOLOGY OR AGRONOMY ) Timespan=All Years. Databases=SCI-EXPANDED, SSCI, A&HCI. Lemmatization=On Total records: 402
REPTILES TS=( biodiversity and bio-indicator* and reptile*) or TS=(biodiversity and indicator* and reptile*) Databases=SCI-EXPANDED, SSCI, A&HCI Timespan=All Years Lemmatization=On Total records: 46
AMPHIBIANS TS=( biodiversity and bio-indicator* and amphibian*) or TS=(biodiversity and indicator* and amphibian*) Databases=SCI-EXPANDED, SSCI, A&HCI Timespan=All Years Lemmatization=On Total records: 74
5.1.3 Invertebrates
INSECTS TS=( biodiversity and bio-indicator* and insect*) or TS=(biodiversity and indicator* and insect*) Refined by: Web of Science Categories=( ECOLOGY OR ENVIRONMENTAL STUDIES OR ENVIRONMENTAL SCIENCES OR BIODIVERSITY CONSERVATION OR ENTOMOLOGY OR FORESTRY OR URBAN STUDIES OR MARINE FRESHWATER BIOLOGY OR GEOGRAPHY PHYSICAL OR GEOGRAPHY OR BIOLOGY OR MULTIDISCIPLINARY SCIENCES OR AGRICULTURE MULTIDISCIPLINARY OR ORNITHOLOGY OR ZOOLOGY OR PLANT SCIENCES OR AGRONOMY ) Timespan=All Years. Databases=SCI-EXPANDED, SSCI, A&HCI. Lemmatization=On Total records: 277
BUTTERFLIES TS=( biodiversity and bio-indicator* and butterfl*) or TS=(biodiversity and indicator* and butterfl*) Refined by: Web of Science Categories=( ECOLOGY OR ZOOLOGY OR BIODIVERSITY CONSERVATION OR ENVIRONMENTAL STUDIES OR ENVIRONMENTAL SCIENCES OR MULTIDISCIPLINARY SCIENCES OR ENTOMOLOGY OR FORESTRY OR BIOLOGY OR GEOGRAPHY OR MARINE FRESHWATER BIOLOGY OR ORNITHOLOGY OR URBAN STUDIES OR REMOTE SENSING OR AGRICULTURE MULTIDISCIPLINARY ) Timespan=All Years. Databases=SCI-EXPANDED, SSCI, A&HCI. Lemmatization=On Total records: 194
CARABIDAE TS=( biodiversity and bio-indicator* and carabid*) or TS=(biodiversity and indicator* and carabid*) Refined by: Web of Science Categories=( ECOLOGY OR ZOOLOGY OR ENVIRONMENTAL SCIENCES OR BIOLOGY OR BIODIVERSITY CONSERVATION OR ENTOMOLOGY OR ENVIRONMENTAL STUDIES OR FORESTRY OR GEOGRAPHY OR AGRICULTURE MULTIDISCIPLINARY OR URBAN STUDIES OR MARINE FRESHWATER BIOLOGY ) Timespan=All Years. Databases=SCI-EXPANDED, SSCI, A&HCI. Lemmatization=On Total records: 106

D6.6 Selected bio-indicators
BIO_SOS FP7-SPACE-2010-1 GA 263435 Page 22 of 31
ORTHOPTERA TS=( biodiversity and bio-indicator* and orthopter*) or TS=(biodiversity and indicator* and orthopter*) Databases=SCI-EXPANDED, SSCI, A&HCI Timespan=All Years Lemmatization=On Total records: 22
SPIDERS TS=( biodiversity and bio-indicator* and spider*) or TS=(biodiversity and indicator* and spider*) Refined by: Web of Science Categories=( ECOLOGY OR BIOLOGY OR ENVIRONMENTAL SCIENCES OR BIODIVERSITY CONSERVATION OR AGRONOMY OR ENTOMOLOGY OR GEOSCIENCES MULTIDISCIPLINARY OR MARINE FRESHWATER BIOLOGY OR AGRICULTURE MULTIDISCIPLINARY OR ZOOLOGY OR FORESTRY ) Timespan=All Years. Databases=SCI-EXPANDED, SSCI, A&HCI. Lemmatization=On Total records: 77
GASTROPODS TS=( biodiversity and bio-indicator* and gastropod*) or TS=(biodiversity and indicator* and gastropod*) Refined by: Web of Science Categories=( ENVIRONMENTAL SCIENCES OR BIOLOGY OR ECOLOGY OR FORESTRY OR BIODIVERSITY CONSERVATION OR ZOOLOGY OR GEOSCIENCES MULTIDISCIPLINARY OR MARINE FRESHWATER BIOLOGY OR AGRICULTURE MULTIDISCIPLINARY OR MULTIDISCIPLINARY SCIENCES OR WATER RESOURCES ) Timespan=All Years. Databases=SCI-EXPANDED, SSCI, A&HCI. Lemmatization=On Total records: 29
5.2 Appendix 2: Available information on biodiversity in the study sites
ITALIAN SITES (IT1, IT2, IT3, IT4)
Resource title
Resource abstract Resolution Spatial scale
Temp. ext.
Date of pub.
File type
Author Property
Species richness
Map of the species richness in Puglia based on the composite of known breeding areas of Annex II and IV of The 93/42/CE Directive and of Annex I of the 79/409/CE Directive
2006 2009 RP need to request licensing
Ecological group
Map of the distribution of ecological groups in Puglia based on the composite of both known breeding areas of Annex II and IV of The 93/42/CE Directive and of Annex I of the 79/409/CE Directive and niche their niche requirements
2006 2009 RP need to request licensing
Greek Sites (GR1, GR2, GR3)
Resource title
Resource abstract Resolution Spatial scale
Temp. ext.
Date of pub.
File type Author Property
Species of Annex II of Directive 92/43/CE distribution maps
Map of species distributions based on the composite of known breeding areas of Annex II and IV of the 93/42/CE Directive and of Annex I of the 79/409/CE Directive
100k 2000 ESRI Shapefile
Ministry of Environment, Energy and Climate change
need to request licensing
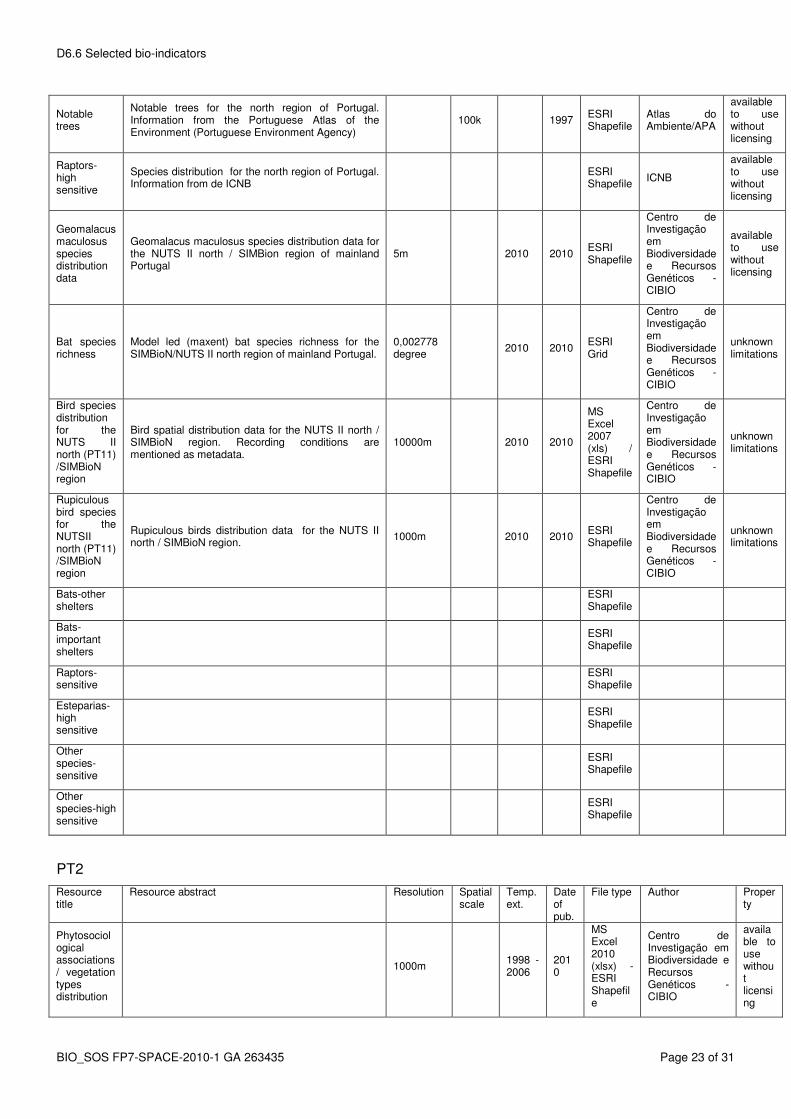
Portuguese sites (PT1 & PT2)
Resource title
Resource abstract Resolution Spatial scale
Temp. ext.
Date of pub.
File type Author Property
D6.6 Selected bio-indicators
BIO_SOS FP7-SPACE-2010-1 GA 263435 Page 23 of 31
Notable trees
Notable trees for the north region of Portugal. Information from the Portuguese Atlas of the Environment (Portuguese Environment Agency)
100k 1997 ESRI Shapefile
Atlas do Ambiente/APA
available to use without licensing
Raptors-high sensitive
Species distribution for the north region of Portugal. Information from de ICNB
ESRI Shapefile
ICNB
available to use without licensing
Geomalacus maculosus species distribution data
Geomalacus maculosus species distribution data for the NUTS II north / SIMBion region of mainland Portugal
5m 2010 2010 ESRI Shapefile
Centro de Investigação em Biodiversidade e Recursos Genéticos - CIBIO
available to use without licensing
Bat species richness
Model led (maxent) bat species richness for the SIMBioN/NUTS II north region of mainland Portugal.
0,002778 degree
2010 2010 ESRI Grid
Centro de Investigação em Biodiversidade e Recursos Genéticos - CIBIO
unknown limitations
Bird species distribution for the NUTS II north (PT11) /SIMBioN region
Bird spatial distribution data for the NUTS II north / SIMBioN region. Recording conditions are mentioned as metadata.
10000m 2010 2010
MS Excel 2007 (xls) / ESRI Shapefile
Centro de Investigação em Biodiversidade e Recursos Genéticos - CIBIO
unknown limitations
Rupiculous bird species for the NUTSII north (PT11) /SIMBioN region
Rupiculous birds distribution data for the NUTS II north / SIMBioN region.
1000m 2010 2010 ESRI Shapefile
Centro de Investigação em Biodiversidade e Recursos Genéticos - CIBIO
unknown limitations
Bats-other shelters
ESRI Shapefile
Bats-important shelters
ESRI Shapefile
Raptors-sensitive
ESRI Shapefile
Esteparias-high sensitive
ESRI Shapefile
Other species-sensitive
ESRI Shapefile
Other species-high sensitive
ESRI Shapefile
PT2
Resource title
Resource abstract Resolution Spatial scale
Temp. ext.
Date of pub.
File type Author Property
Phytosociological associations / vegetation types distribution
1000m 1998 - 2006
2010
MS Excel 2010 (xlsx) - ESRI Shapefile
Centro de Investigação em Biodiversidade e Recursos Genéticos - CIBIO
available to use without licensing

D6.6 Selected bio-indicators
BIO_SOS FP7-SPACE-2010-1 GA 263435 Page 24 of 31
Flora distribution data - Minho
Flora distribution data for the Minho valley. The dataset contains several prioritary species concerning the habitats and birds directive.
25k 2007 2007
ESRI Shapefile
Centro de Investigação em Biodiversidade e Recursos Genéticos - CIBIO
available to use without licensing
Geomalacus maculosus species distribution data
Geomalacus maculosus species distribution data for the NUTS II north / SIMBion region of mainland Portugal
5m 2010 2010
ESRI Shapefile
Centro de Investigação em Biodiversidade e Recursos Genéticos - CIBIO
available to use without licensing
Invertebrate species distribution data I
Invertebrate species distribution data from UTAD - SIMBioN data collection task
5m 2010 2010
ESRI Shapefile
Centro de Investigação em Biodiversidade e Recursos Genéticos - CIBIO
available to use without licensing
Micromammals distribution data - 2010 SIMBioN campaign
Micromammals distribution data recorded in the 2010 SIMBioN campaign coordinated by UTAD
5m 2010 2010
ESRI Shapefile
Centro de Investigação em Biodiversidade e Recursos Genéticos - CIBIO
available to use without licensing
Odonata species distribution data 2010 SIMBioN campaign
Odonata species distribution data recorded/collected in the 2010 SIMBioN campaign coordinated by UTAD. Records are reported at 10km ED50/UTM grid.
5m 2010 2010
ESRI Shapefile
Centro de Investigação em Biodiversidade e Recursos Genéticos - CIBIO
available to use without licensing
Plant species records / distribution data for mainland Portugal
1000m 2000-2010
2010
MS Excel 2007 (xls)
Centro de Investigação em Biodiversidade e Recursos Genéticos - CIBIO
available to use without licensing
Plant species records / distribution data for mainland Portugal from phytosociological inventories
1000m 1998-2006
2010
MS Excel 2010 (xlsx) - ESRI Shapefile
Centro de Investigação em Biodiversidade e Recursos Genéticos - CIBIO
Notable trees
Notable trees for the north region of Portugal. Information from the Portuguese Atlas of the Environment (Portuguese Environment Agency)
1000k 1997
ESRI Shapefile
Atlas do Ambiente/APA
Raptors-high sensitive
Species distribution for the north region of Portugal. Information from de ICNB
1000k ESRI Shapefile
ICNB
Bryophyte species distribution data
Bryophyte species distribution data reported at 1/10 km ED50/UTM grids.
1000m 2000-2010
2010
MS Excel 2007 (xls)
Centro de Investigação em Biodiversidade e Recursos Genéticos - CIBIO
need to request licensing
Fish species distribution
Fish species/ ichtyofauna distribution data from the Article 17 Habitats directive dataset reported at 1/10 km ED50/UTM grids.
1000m 2000-2010
2010
MS Excel 2007
ICNB need to reque

D6.6 Selected bio-indicators
BIO_SOS FP7-SPACE-2010-1 GA 263435 Page 25 of 31
data (xls) st licensing
Invertebrate species distribution data
Invertebrate species distribution data from the Article 17 Habitats directive dataset reported at 1/10 km ED50/UTM grids.
1000m 2000-2010
2010
MS Excel 2007 (xls)
ICNB
need to request licensing
Mammalian species distribution data
Mammalian species distribution data from the Article 17 Habitats directive dataset reported at 1/10 km ED50/UTM grids.
1000m 2000-2010
2010
MS Excel 2007 (xls)
ICNB
need to request licensing
Reptile and amphibian atlas for mainland Portugal
Reptile species distribution data from the "Atlas de répteis e anfíbios" reported at 1/10 km grid
1000m 2000-2010
2010
MS Excel 2010 (xlsx)
ICNB
need to request licensing
Bat species records / distribution data
Bats species chorological records / distribution data 1000m 1873 - 2009
2010
MS Excel 2007 (xls)
Centro de Investigação em Biodiversidade e Recursos Genéticos - CIBIO
Bat species richness
Modelled (maxent) bat species richness for the SIMBioN/NUTS II north region of mainland Portugal.
0,002778˚ 2010 2010
ESRI grid
Centro de Investigação em Biodiversidade e Recursos Genéticos - CIBIO
Bird species distribution for the NUTS II north (PT11) /SIMBioN region
Bird spatial distribution data for the NUTS II north / SIMBioN region. Recording conditions are mentioned as metadata.
10000m 2010 2010
MS Excel 2007 (xls) - ESRI
Shapefile
Centro de Investigação em Biodiversidade e Recursos Genéticos - CIBIO
Fauna distribution data - Minho
Fauna distribution data for the Minho valley. The dataset contains several prioritary species concerning the habitats and birds directive.
25k 2007 2007
ESRI Shapefil
e
Centro de Investigação em Biodiversidade e Recursos Genéticos - CIBIO
Rupiculous bird species for the NUTS II north (PT11) /SIMBioN region
Rupiculous birds distribution data for the NUTS II north / SIMBioN region.
1000m 2010 2010
ESRI Shapefil
e
Centro de Investigação em Biodiversidade e Recursos Genéticos - CIBIO
Trees and shrubs distribution data
This dataset contains trees and shrubs distribution data compiled from the Porto Herbarium
10000m 1853-2004
2007
MS Excel 2007 (xls)
Centro de Investigação em Biodiversidade e Recursos Genéticos - CIBIO
Veronica micrantha maxent distribution model
Maxent spatial distribution model for the rare plant species Veronica micrantha for the SIMBioN / NUTS II north region of mainland Portugal.
1000m 2010 2010
Centro de Investigação em Biodiversidade e Recursos Genéticos - CIBIO

D6.6 Selected bio-indicators
BIO_SOS FP7-SPACE-2010-1 GA 263435 Page 26 of 31
Bats-other shelters
ESRI
Shapefile
Bats-important shelters
ESRI
Shapefile
Raptors-sensitive
ESRI
Shapefile
Esteparias-high sensitive
ESRI
Shapefile
Other species-sensitive
ESRI
Shapefile
Other species-high sensitive
ESRI Shapefile
Netherlands site
No data available from this site
UK site
Resource title
Resource abstract Resolution Spatial scale
Temp. ext.
Date of pub.
File type
Author Property
BAP Invertebrate Species
Point data of key BAP invertebrate species 10k MapInfo .TAB
Recorder need to request licensing
BAP marsh fritilary
Point data for marsh fritillary butterflies with latest year recorded and maximum abundance (1990-2002) for adult and larval stages
10k MapInfo .TAB
Recorder need to request licensing
Distribution data for Great Crested Newts
Great Crested Newts 2,5k 2007 MapInfo .TAB
CCW need to request licensing
HEP Sensitive Bryophytes & Lichens
Bryophytes and Lichens sensitive to HEP schemes 10k 2010 MapInfo .TAB
CCW need to request licensing
Distribution data for Lichens
Rare Lichens 1 2010 MapInfo .TAB
CCW need to request licensing
LRC - Priority and Protected Species
Priority and Protected Species 2,5k 2010 MapInfo .TAB
CCW need to request licensing
Distribution data for Stoneworts
Rare Stoneworts 10k MapInfo .TAB
CCW need to request licensing

D6.6 Selected bio-indicators
BIO_SOS FP7-SPACE-2010-1 GA 263435 Page 27 of 31
Priority and Protected Species
Priority and Protected Species supplied from the LRCs.
10k 2010 MapInfo .TAB
LRC need to request licensing
Brazil site
Resource title
Resource abstract Resolution Spatial scale
Temp. ext.
Date of pub.
Geog. File type
Author Property
BR_extinction_species
List of species endangered of extinction in Brazil 2011 2011 Brazil website
ICMBio
available to use without licensing
5.3 Appendix 3: Acronym list
CI Confidence Interval
EO Earth Observation
GHC General Habitat Category
HR High Resolution
IUCN International Union for Conservation of Nature
LC Land Cover
LCC Land Cover Change
RS Remote Sensing
SEBI Streamlining European 2010 Biodiversity Indicators
VHR Very High spatial Resolution

D6.6 Selected bio-indicators
BIO_SOS FP7-SPACE-2010-1 GA 263435 Page 28 of 31
6. References
Andelman, S.J., Fagan, W.F., 2000. Umbrellas and flagships: Efficient conservation surrogates or expensive mistakes? Proceedings of the National Academy of Sciences of the United States of America 97, 5954-5959.
Beale, C.M., Lennon, J.J., Yearsley, J.M., Brewer, M.J., Elston, D.A., 2010. Regression analysis of spatial data. Ecology Letters 13, 246-264.
Billeter, R., Liira, J., Bailey, D., Bugter, R., Arens, P., Augenstein, I., Aviron, S., Baudry, J., Bukacek, R., Burel, F., Cerny, M., De Blust, G., De Cock, R., Diekotter, T., Dietz, H., Dirksen, J., Dormann, C., Durka, W., Frenzel, M., Hamersky, R., Hendrickx, F., Herzog, F., Klotz, S., Koolstra, B., Lausch, A., Le Coeur, D., Maelfait, J.P., Opdam, P., Roubalova, M., Schermann, A., Schermann, N., Schmidt, T., Schweiger, O., Smulders, M.J.M., Speelmans, M., Simova, P., Verboom, J., van Wingerden, W.K.R.E., Zobel, M., Edwards, P.J., 2008. Indicators for biodiversity in agricultural landscapes: a pan-European study. Journal of Applied Ecology 45, 141-150.
Bunce, R.G.H.; Bogers, M.M. B. , Roche, P., Walczak, I. Geijzendorffer, R. , Jongman, R.H.G. 2011. Manual for Habitat and Vegetation Surveillance and Monitoring: Temperate, Mediterranean and Desert Biomes. First edition. Wageningen, Alterra report 2154 . 106 pp.; 15 fig.; 14 tab.; 35 ref.
Bunce, R.G.H.; Metzger, M.J.; Jongman, R.H.G.; Brandt, J.; Blust, G. de; Elena-Rossello, R.; Groom, G.B.; Halada, L.; Hofer, G.; Howard, D.C.; Kovár, P.; Mücher, C.A.; Padoa-Schioppa, E.; Paelinx, D.; Palo, A.; Pérez-Soba, M.; Ramos, I.L.; Roche, P.; Skånes, H.; Wrbka, T. 2008. A Standardized Procedure for Surveillance and Monitoring European Habitats and provision of spatial data. Landscape Ecology, 23:11-25
Cardoso, P., Silva, I., de Oliveira, N.G., Serrano, A.R.M., 2004. Higher taxa surrogates of spider (Araneae) diversity and their efficiency in conservation. Biological Conservation 117, 453-459.
Caro, T., 2000. Focal species. Conservation Biology 14, 1569-1570.
Caro, T.M., O'Doherty, G., 1999. On the use of surrogate species in conservation biology. Conservation Biology 13, 805-814.
Cushman, S.A., McKelvey, K.S., Noon, B.R., McGarigal, K., 2010. Use of abundance of one species as a surrogate for abundance of others. Conservation Biology 24, 830-840.
EEA, 2007. Halting the loss of biodiversity by 2010: proposal for a first set of indicators to monitor progress in Europe. European Environment Agency, Copenhagen.
Elith, J., Graham, C.H., Anderson, R.P., Dudik, M., Ferrier, S., Guisan, A., Hijmans, R.J., Huettmann, F., Leathwick, J.R., Lehmann, A., Li, J., Lohmann, L.G., Loiselle, B.A., Manion, G., Moritz, C., Nakamura, M., Nakazawa, Y., Overton, J.M., Peterson, A.T., Phillips, S.J., Richardson, K., Scachetti-Pereira, R., Schapire, R.E., Soberon, J., Williams, S., Wisz, M.S., Zimmermann, N.E., 2006. Novel methods improve prediction of species' distributions from occurrence data. Ecography 29, 129-151.
Elith, J., Phillips, S.J., Hastie, T., Dudik, M., Chee, Y.E., Yates, C.J., 2011. A statistical explanation of MaxEnt for ecologists. Diversity and Distributions 17, 43-57.
Faith, D.P., Walker, P.A., 1996. Environmental diversity: On the best-possible use of surrogate data for assessing the relative biodiversity of sets of areas. Biodiversity and Conservation 5, 399-415.
Ferrier, S., 2002. Mapping spatial pattern in biodiversity for regional conservation planning: Where to from here? Systematic Biology 51, 331-363.
Ficetola, G.F., Sacchi, R., Scali, S., Gentilli, A., De Bernardi, F., Galeotti, P., 2007. Vertebrates respond differently to human disturbance: implications for the use of a focal species approach. Acta Oecologica-International Journal of Ecology 31, 109-118.

D6.6 Selected bio-indicators
BIO_SOS FP7-SPACE-2010-1 GA 263435 Page 29 of 31
Fleishman, E., Thomson, J.R., Mac Nally, R., Murphy, D.D., Fay, J.P., 2005. Using indicator species to predict species richness of multiple taxonomic groups. Conservation Biology 19, 1125-1137.
Gaston, K.J., Williams, P.H., 1993. Mapping the world's species-The higher taxon approach. Biodiversity Letters 1, 2-8.
Grantham, H.S., Pressey, R.L., Wells, J.A., Beattie, A.J., 2010. Effectiveness of biodiversity surrogates for conservation planning: Different measures of effectiveness generate a kaleidoscope of variation. Plos One 5.
Gregory, R.D., van Strien, A., Vorisek, P., Meyling, A.W.G., Noble, D.G., Foppen, R.P.B., Gibbons, D.W., 2005. Developing indicators for European birds. Philosophical Transactions of the Royal Society B-Biological Sciences 360, 269-288.
Heink, U., Kowarik, I., 2010. What are indicators? On the definition of indicators in ecology and environmental planning. Ecological Indicators 10, 584-593.
Hill, M.O., 1973. Diversity and evenness - Unifying notation and its consequences. Ecology 54, 427-432.
Hill, M.O., 1997. An evenness statistic based on the abundance-weighted variance of species proportions. Oikos 79, 413-416.
Jetz, W., Rahbek, C., 2002. Geographic range size and determinants of avian species richness. Science 297, 1548-1551.
Jones, C.G., Lawton, J.H., Shachak, M., 1994. Organisms as ecosystem engineers. Oikos 69, 373-386.
Kallimanis, A.S., Mazaris, A.D., Tsakanikas, D., Dimopoulos, P., Pantis, J.D., Sgardelis, S.P., 2012. Efficient biodiversity monitoring: Which taxonomic level to study? Ecological Indicators 15, 100-104.
Kati, V., Devillers, P., Dufrene, M., Legakis, A., Vokou, D., Lebrun, P., 2004. Testing the value of six taxonomic groups as biodiversity indicators at a local scale. Conservation Biology 18, 667-675.
Lambeck, R.J., 1997. Focal species: A multi-species umbrella for nature conservation. Conservation Biology 11, 849-856.
Landres, P.B., Verner, J., Thomas, J.W., 1988. Ecological uses of vertebrate indicator species - a critique. Conservation Biology 2, 316-328.
Larsen, F.W., Rahbek, C., 2005. The influence of spatial grain size on the suitability of the higher-taxon approach in continental priority-setting. Animal Conservation 8, 389-396.
Lawler, J.J., White, D., 2008. Assessing the mechanisms behind successful surrogates for biodiversity in conservation planning. Animal Conservation 11, 270-280.
Lawler, J.J., White, D., Sifneos, J.C., Master, L.L., 2003. Rare species and the use of indicator groups for conservation planning. Conservation Biology 17, 875-882.
Lennon, J.J., Koleff, P., Greenwood, J.J.D., Gaston, K.J., 2004. Contribution of rarity and commonness to patterns of species richness. Ecology Letters 7, 81-87.
Lindenmayer, D.B., Likens, G.E., 2011. Direct measurement versus surrogate indicator species for evaluating environmental change and biodiversity loss. Ecosystems 14, 47-59.
Lindenmayer, D.B., Manning, A.D., Smith, P.L., Possingham, H.P., Fischer, J., Oliver, I., McCarthy, M.A., 2002. The focal-species approach and landscape restoration: a critique. Conservation Biology 16, 338-345.
Lobo, J.M., Castro, I., Moreno, J.C., 2001. Spatial and environmental determinants of vascular plant species richness distribution in the Iberian Peninsula and Balearic Islands. Biological Journal of the Linnean Society 73, 233-253.
Lombard, A.T., Cowling, R.M., Pressey, R.L., Rebelo, A.G., 2003. Effectiveness of land classes as surrogates for species in conservation planning for the Cape Floristic Region. Biological Conservation 112, 45-62.

D6.6 Selected bio-indicators
BIO_SOS FP7-SPACE-2010-1 GA 263435 Page 30 of 31
Lund, M.P., Rahbek, C., 2002. Cross-taxon congruence in complementarity and conservation of temperate biodiversity. Animal Conservation 5, 163-171.
Mazaris, A., Tzanopoulos, J., Kallimanis, A., Matsinos, Y., Sgardelis, S., Pantis, J., 2008a. The contribution of common and rare species to plant species richness patterns: the effect of habitat type and size of sampling unit. Biodiversity and Conservation 17, 3567-3577.
Mazaris, A.D., Kallimanis, A.S., Sgardelis, S.P., Pantis, J.D., 2008b. Does higher taxon diversity reflect richness of conservation interest species? The case for birds, mammals, amphibians, and reptiles in Greek protected areas. Ecological Indicators 8, 664-671.
Mazaris, A.D., Kallimanis, A.S., Tzanopoulos, J., Sgardelis, S.P., Pantis, J.D., 2010. Can we predict the number of plant species from the richness of a few common genera, families or orders? Journal of Applied Ecology 47, 662-670.
McGeoch, M.A., 1998. The selection, testing and application of terrestrial insects as bio-indicators. Biological Reviews 73, 181-201.
Mills, L.S., Soule, M.E., Doak, D.F., 1993. The keystone-species concept in ecology and conservation. Bioscience 43, 219-224.
Myers, N., Mittermeier, R.A., Mittermeier, C.G., da Fonseca, G.A.B., Kent, J., 2000. Biodiversity hotspots for conservation priorities. Nature 403, 853-858.
OECD, 2003. OECD Environmental Indicators. Development Measurement and Use. OECD Organisation for Economic Co-Operation Development, Paris.
Oliver, I., Holmes, A., Dangerfield, J.M., Gillings, M., Pik, A.J., Britton, D.R., Holley, M., Montgomery, M.E., Raison, M., Logan, V., Pressey, R.L., Beattie, A.J., 2004. Land systems as surrogates for biodiversity in conservation planning. Ecological Applications 14, 485-503.
Ricketts, T.H., Daily, G.C., Ehrlich, P.R., 2002. Does butterfly diversity predict moth diversity? Testing a popular indicator taxon at local scales. Biological Conservation 103, 361-370.
Roberge, J.M., Angelstam, P., 2004. Usefulness of the umbrella species concept as a conservation tool. Conservation Biology 18, 76-85.
Ryszkowski, L., Karg, J., Margarit, G., Paoletti, M.G., Glotin, R., 1993. Above-ground insect biomass in agricultural landscape of Europe, In: R.G.H. Bunce, L. Ryszkowski, M.G. Paoletti (Eds.), Landscape Ecology and Agroecosystems, Lewis, Boca Raton, USA, pp. 71-82.
Sauberer, N., Zulka, K.P., Abensperg-Traun, M., Berg, H.M., Bieringer, G., Milasowszky, N., Moser, D., Plutzar, C., Pollheimer, M., Storch, C., Trostl, R., Zechmeister, H., Grabherr, G., 2004. Surrogate taxa for biodiversity in agricultural landscapes of eastern Austria. Biological Conservation 117, 181-190.
Studeny, A.C., Buckland, S.T., Illian, J.B., Johnston, A., Magurran, A.E., 2011. Goodness-of-fit measures of evenness: a new tool for exploring changes in community structure. Ecosphere 2, art15.
Terborgh, J., Winter, B., 1983. A method for siting parks and reserves with special reference to Colombia and Ecuador. Biological Conservation 27, 45-58.
Trindade, J., Loyola, R.D., 2011. Performance and Consistency of Indicator Groups in Two Biodiversity Hotspots. Plos One 6.
van Strien, A.J., van Duuren, L., Foppen, R.P.B., Soldaat, L.L., 2009. A typology of indicators of biodiversity change as a tool to make better indicators. Ecological Indicators 9, 1041-1048.
Villasenor, J.L., Ibarra-Manriquez, G., Meave, J.A., Ortiz, E., 2005. Higher taxa as surrogates of plant biodiversity in a megadiverse country. Conservation Biology 19, 232-238.
Warman, L.D., Forsyth, D.M., Sinclair, A.R.E., Freemark, K., Moore, H.D., Barrett, T.W., Pressey, R.L., White, D., 2004. Species distributions, surrogacy, and important conservation regions in Canada. Ecology Letters 7, 374-379.

D6.6 Selected bio-indicators
BIO_SOS FP7-SPACE-2010-1 GA 263435 Page 31 of 31
Wiens, J.A., Hayward, G.D., Holthausen, R.S., Wisdom, M.J., 2008. Using surrogate species and groups for conservation planning and management. Bioscience 58, 241-252.
Williams, P.H., Gaston, K.J., 1994. Measuring more of biodiversity - Can higher-taxon richness predict wholesale species richness? Biological Conservation 67, 211-217.
Wolters, V., Bengtsson, J., Zaitsev, A.S., 2006. Relationship among the species richness of different taxa. Ecology 87, 1886-1895.